
Improvement of Climate Resource Utilization Efficiency to Enhance Maize Yield through Adjusting Planting Density
Abstract
:1. Introduction
2. Materials and Methods
2.1. Experimental Site
2.2. Experimental Design
2.3. Research Methods
2.3.1. Grain Yield
2.3.2. Dry Matter Accumulation and Dry Matter Translocation (DMA and DMT)
2.3.3. Climatic Data
2.3.4. Accumulated Temperature ≥10 °C (AT10)
2.3.5. Solar Radiation
2.3.6. Utilization Efficiency of Solar Radiation, Temperature, and Precipitation
2.3.7. Statistical Analysis
3. Results
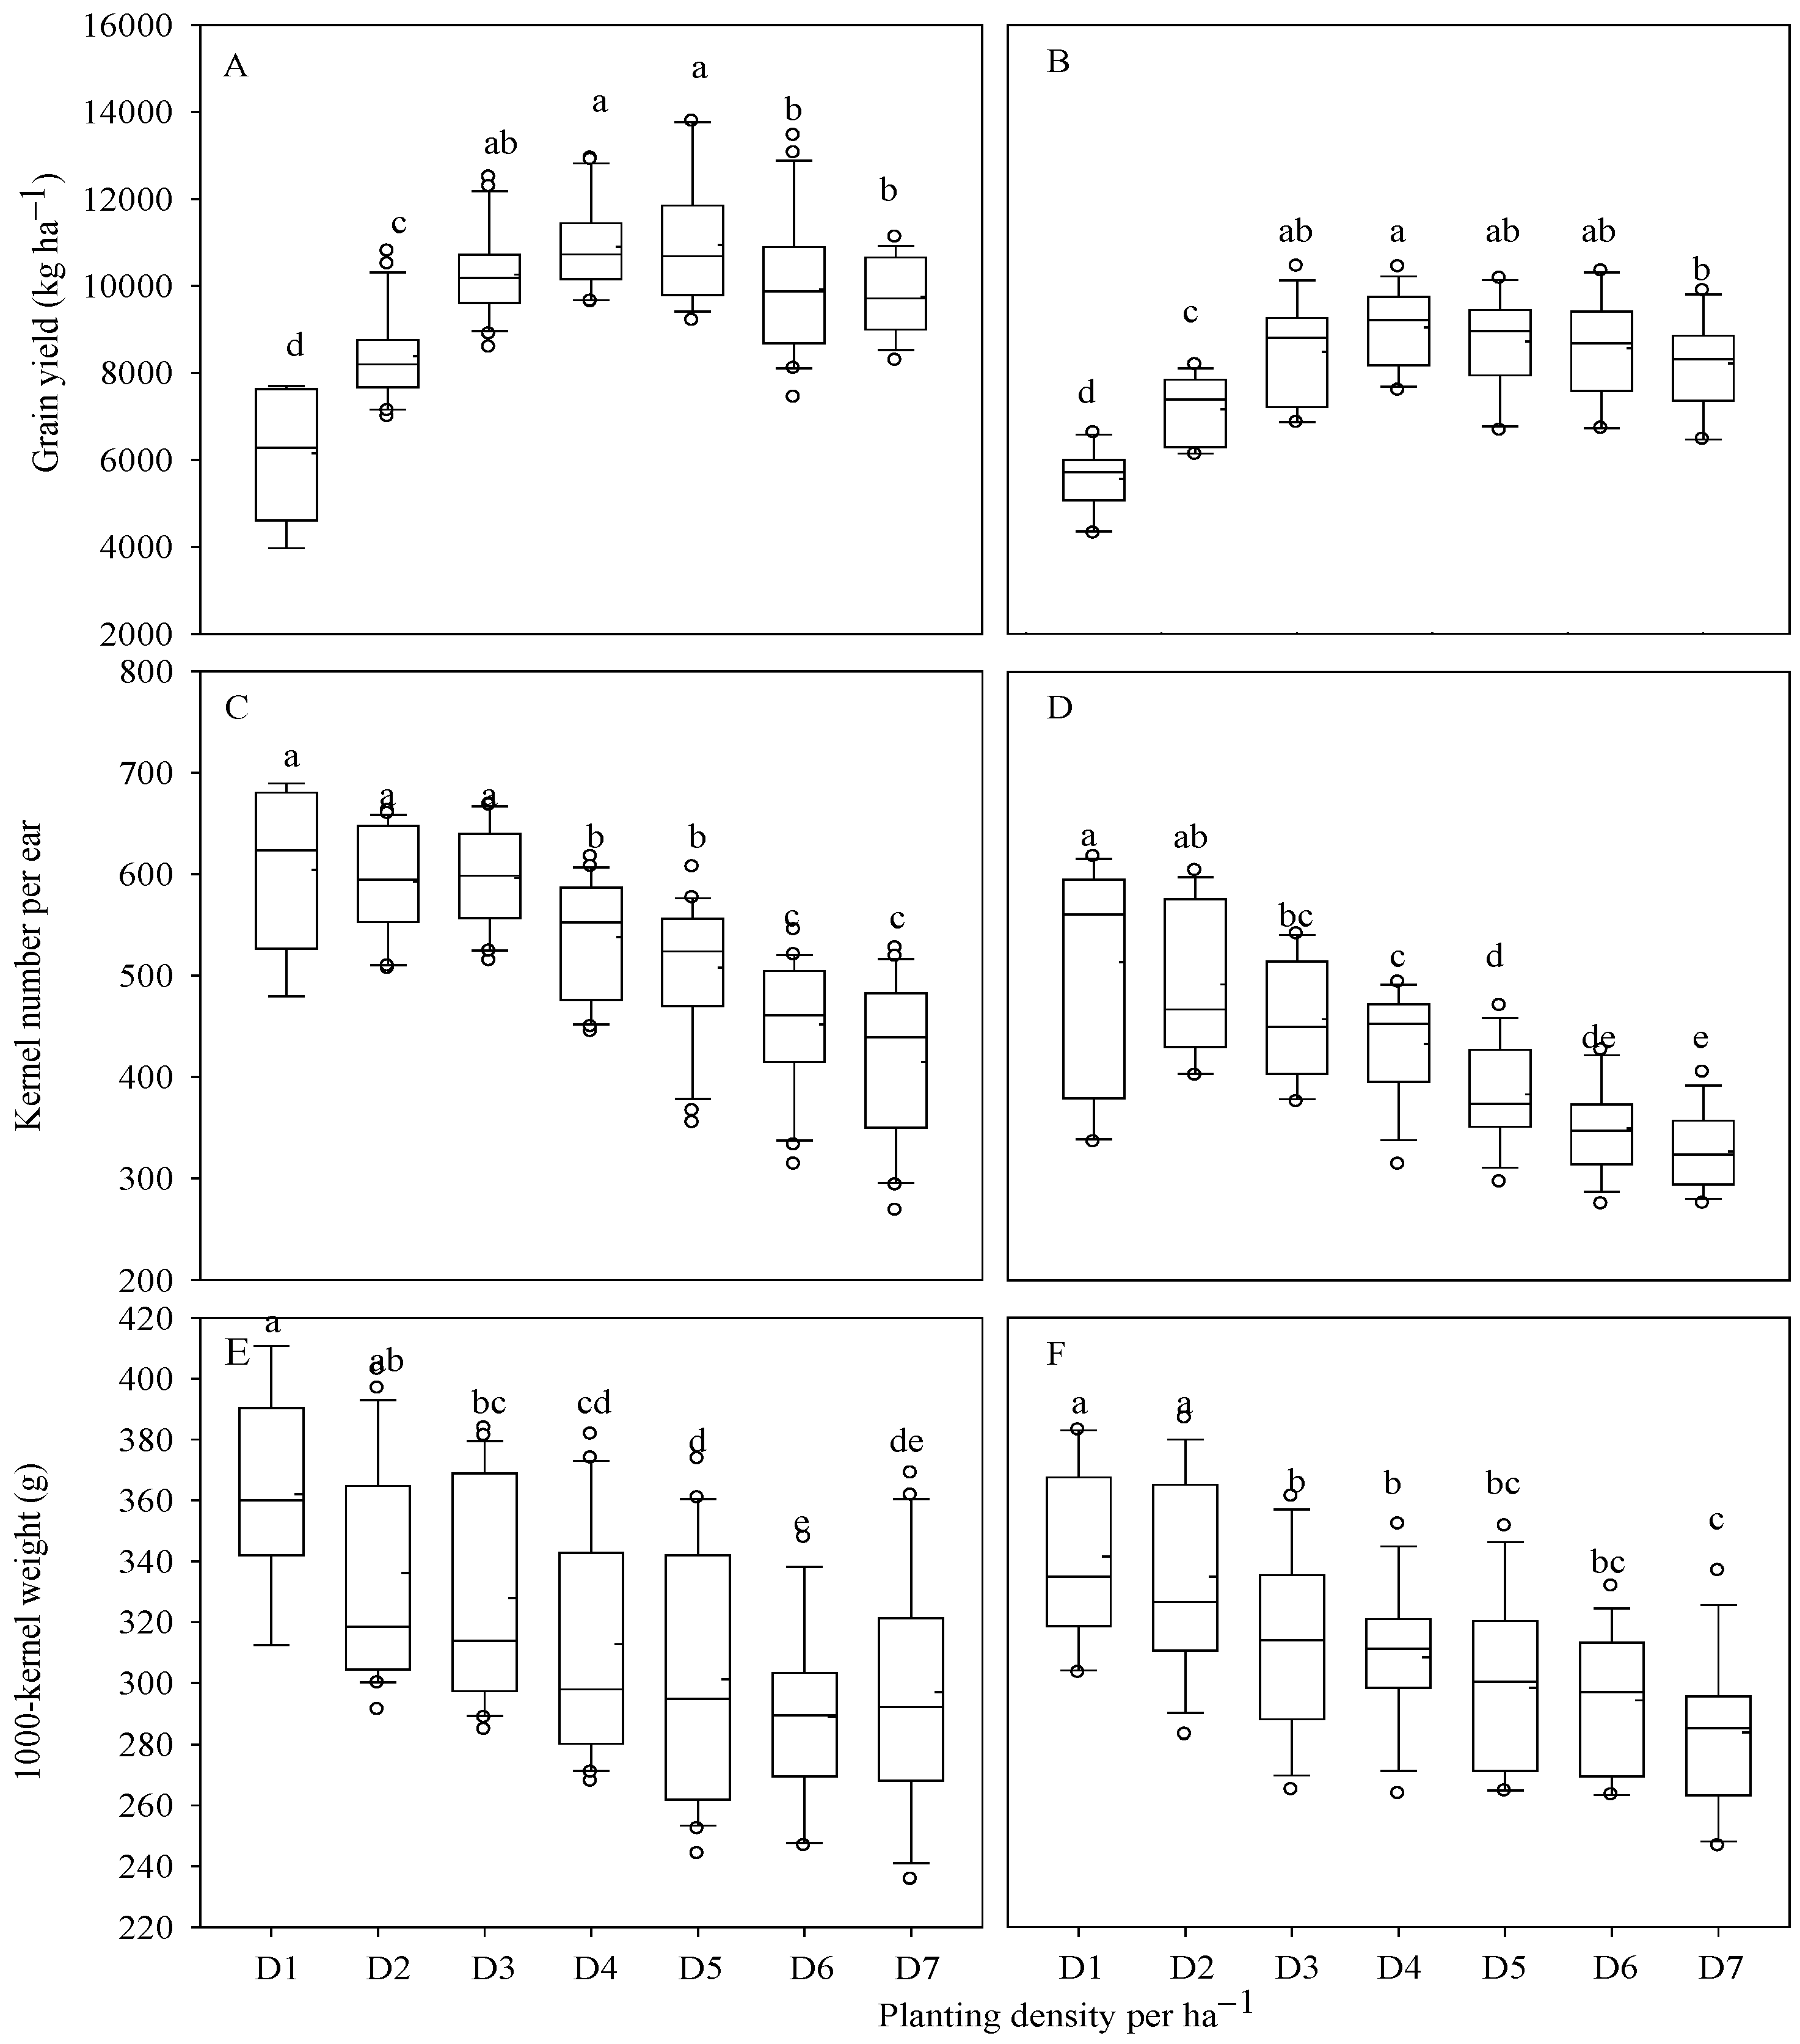
3.1. Differences in Yield and Its Components
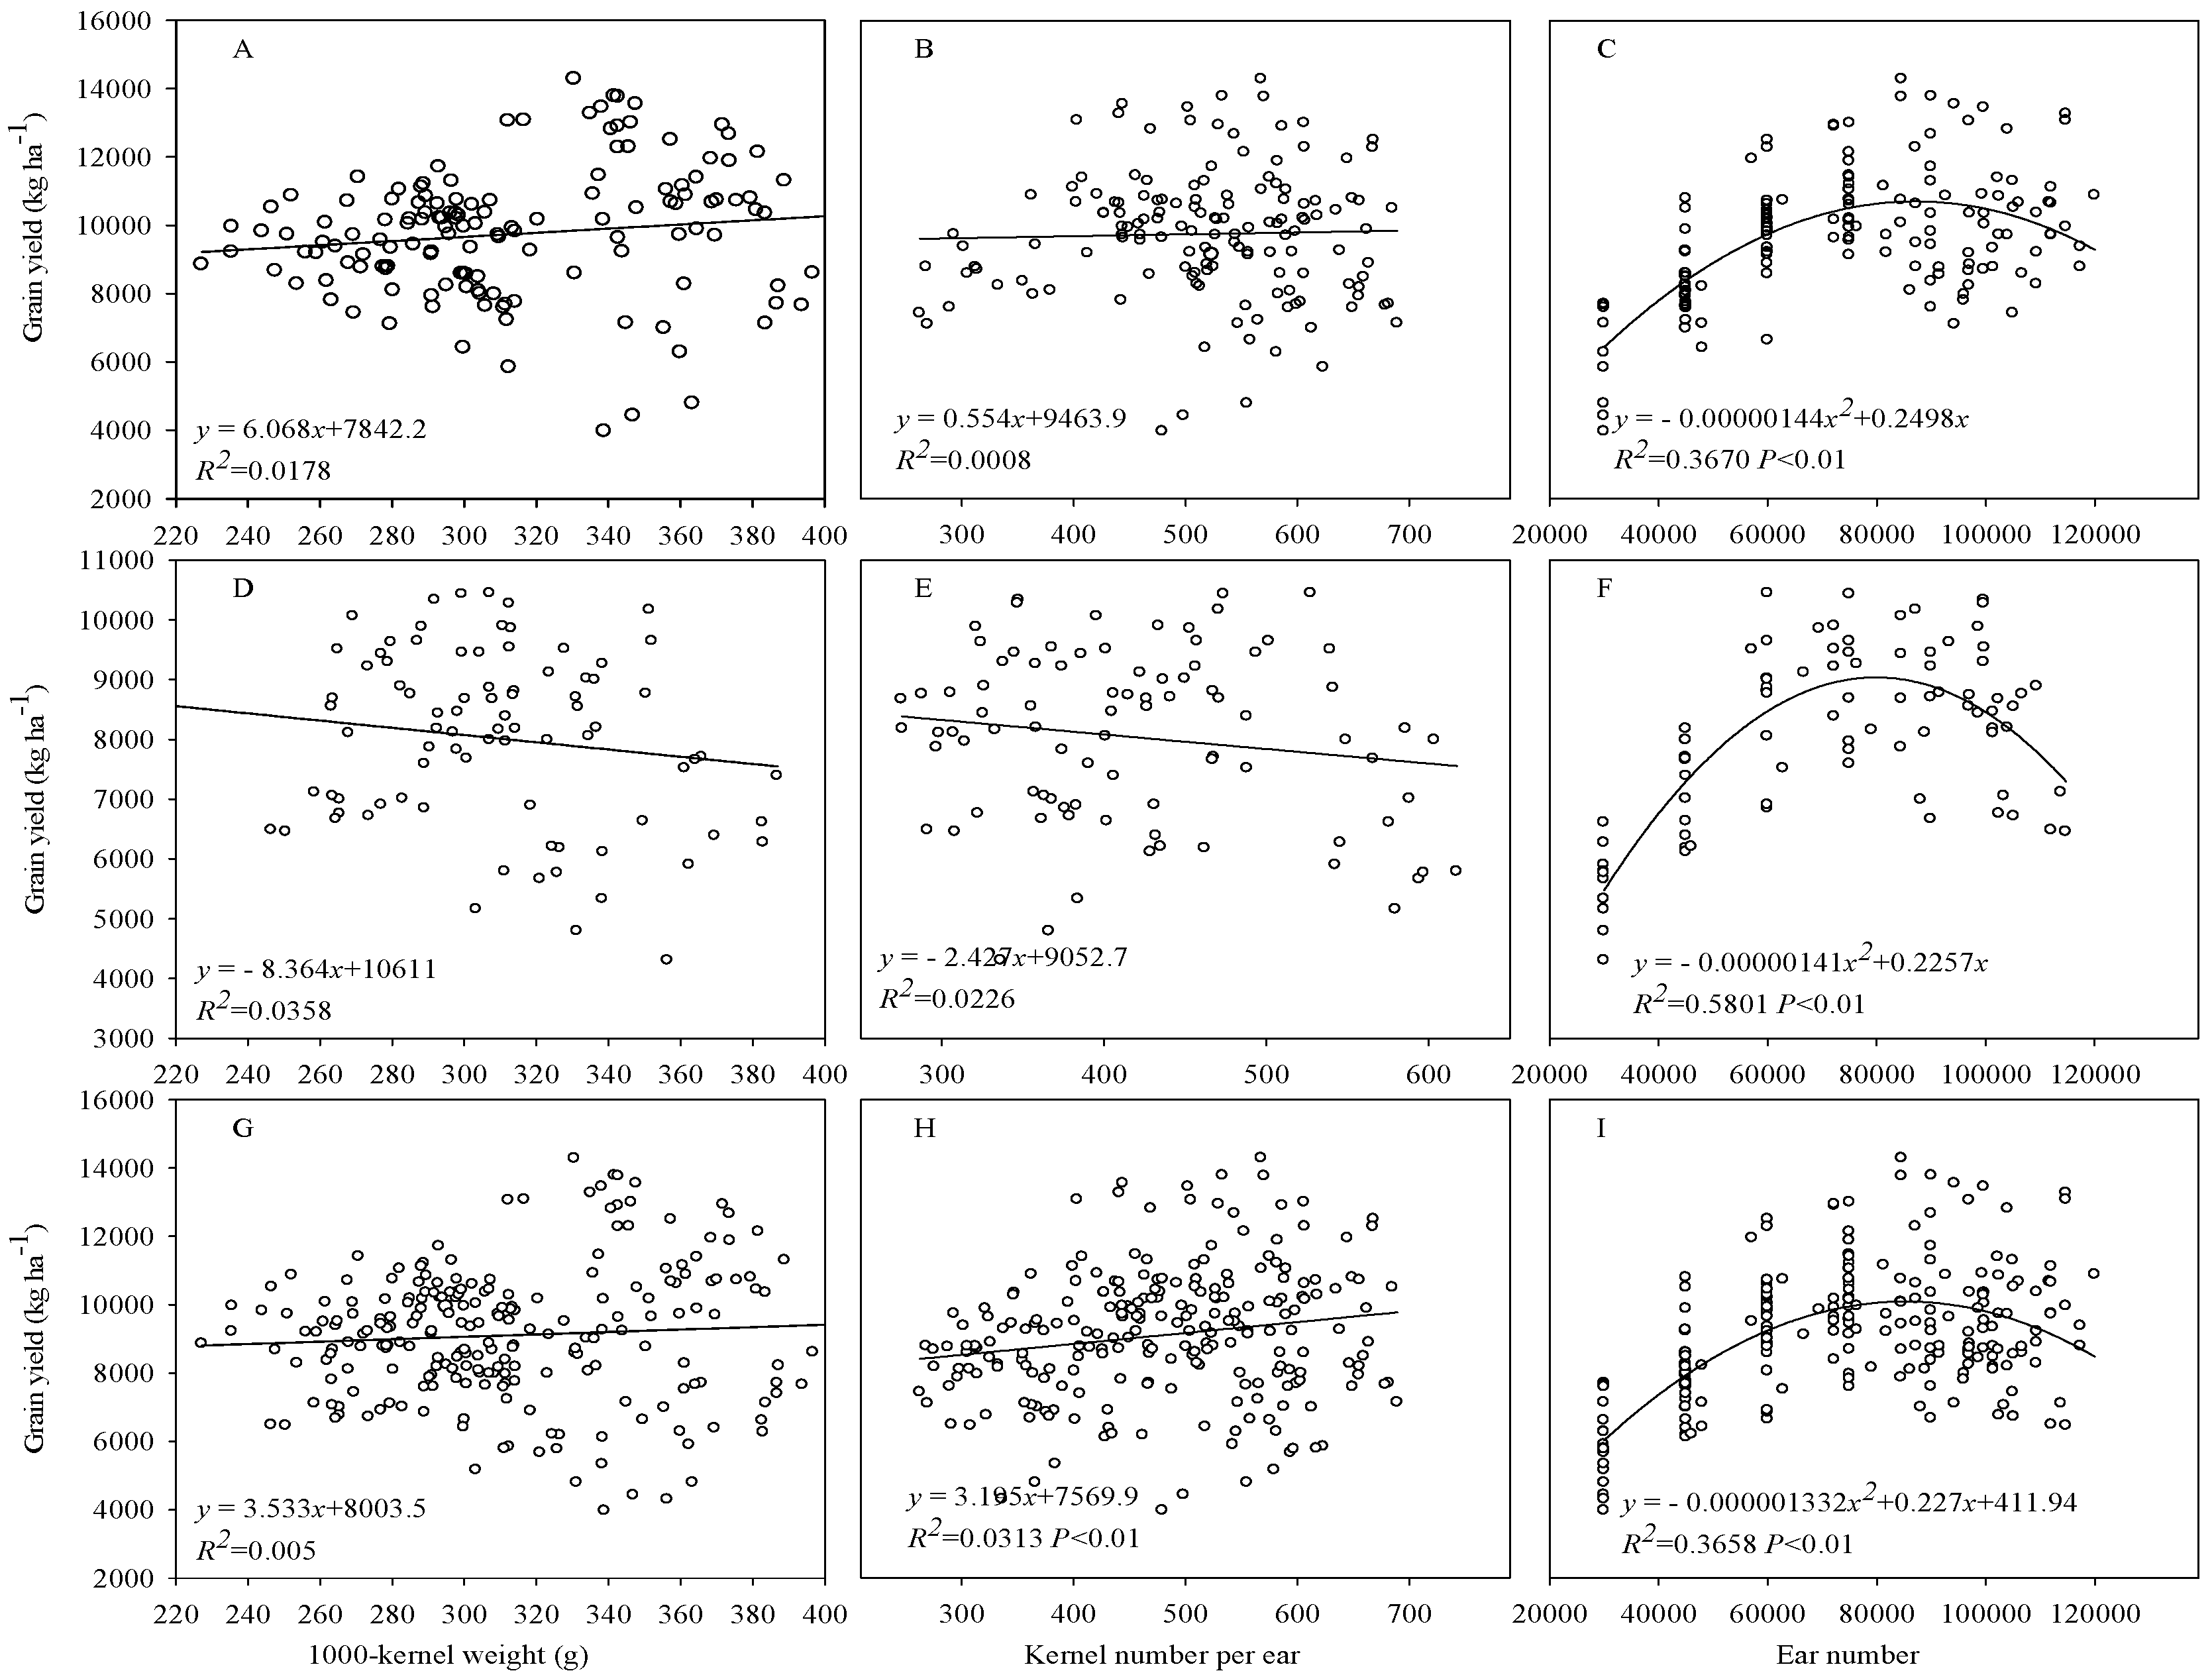
3.2. Regression of Grain Yield and Its Components
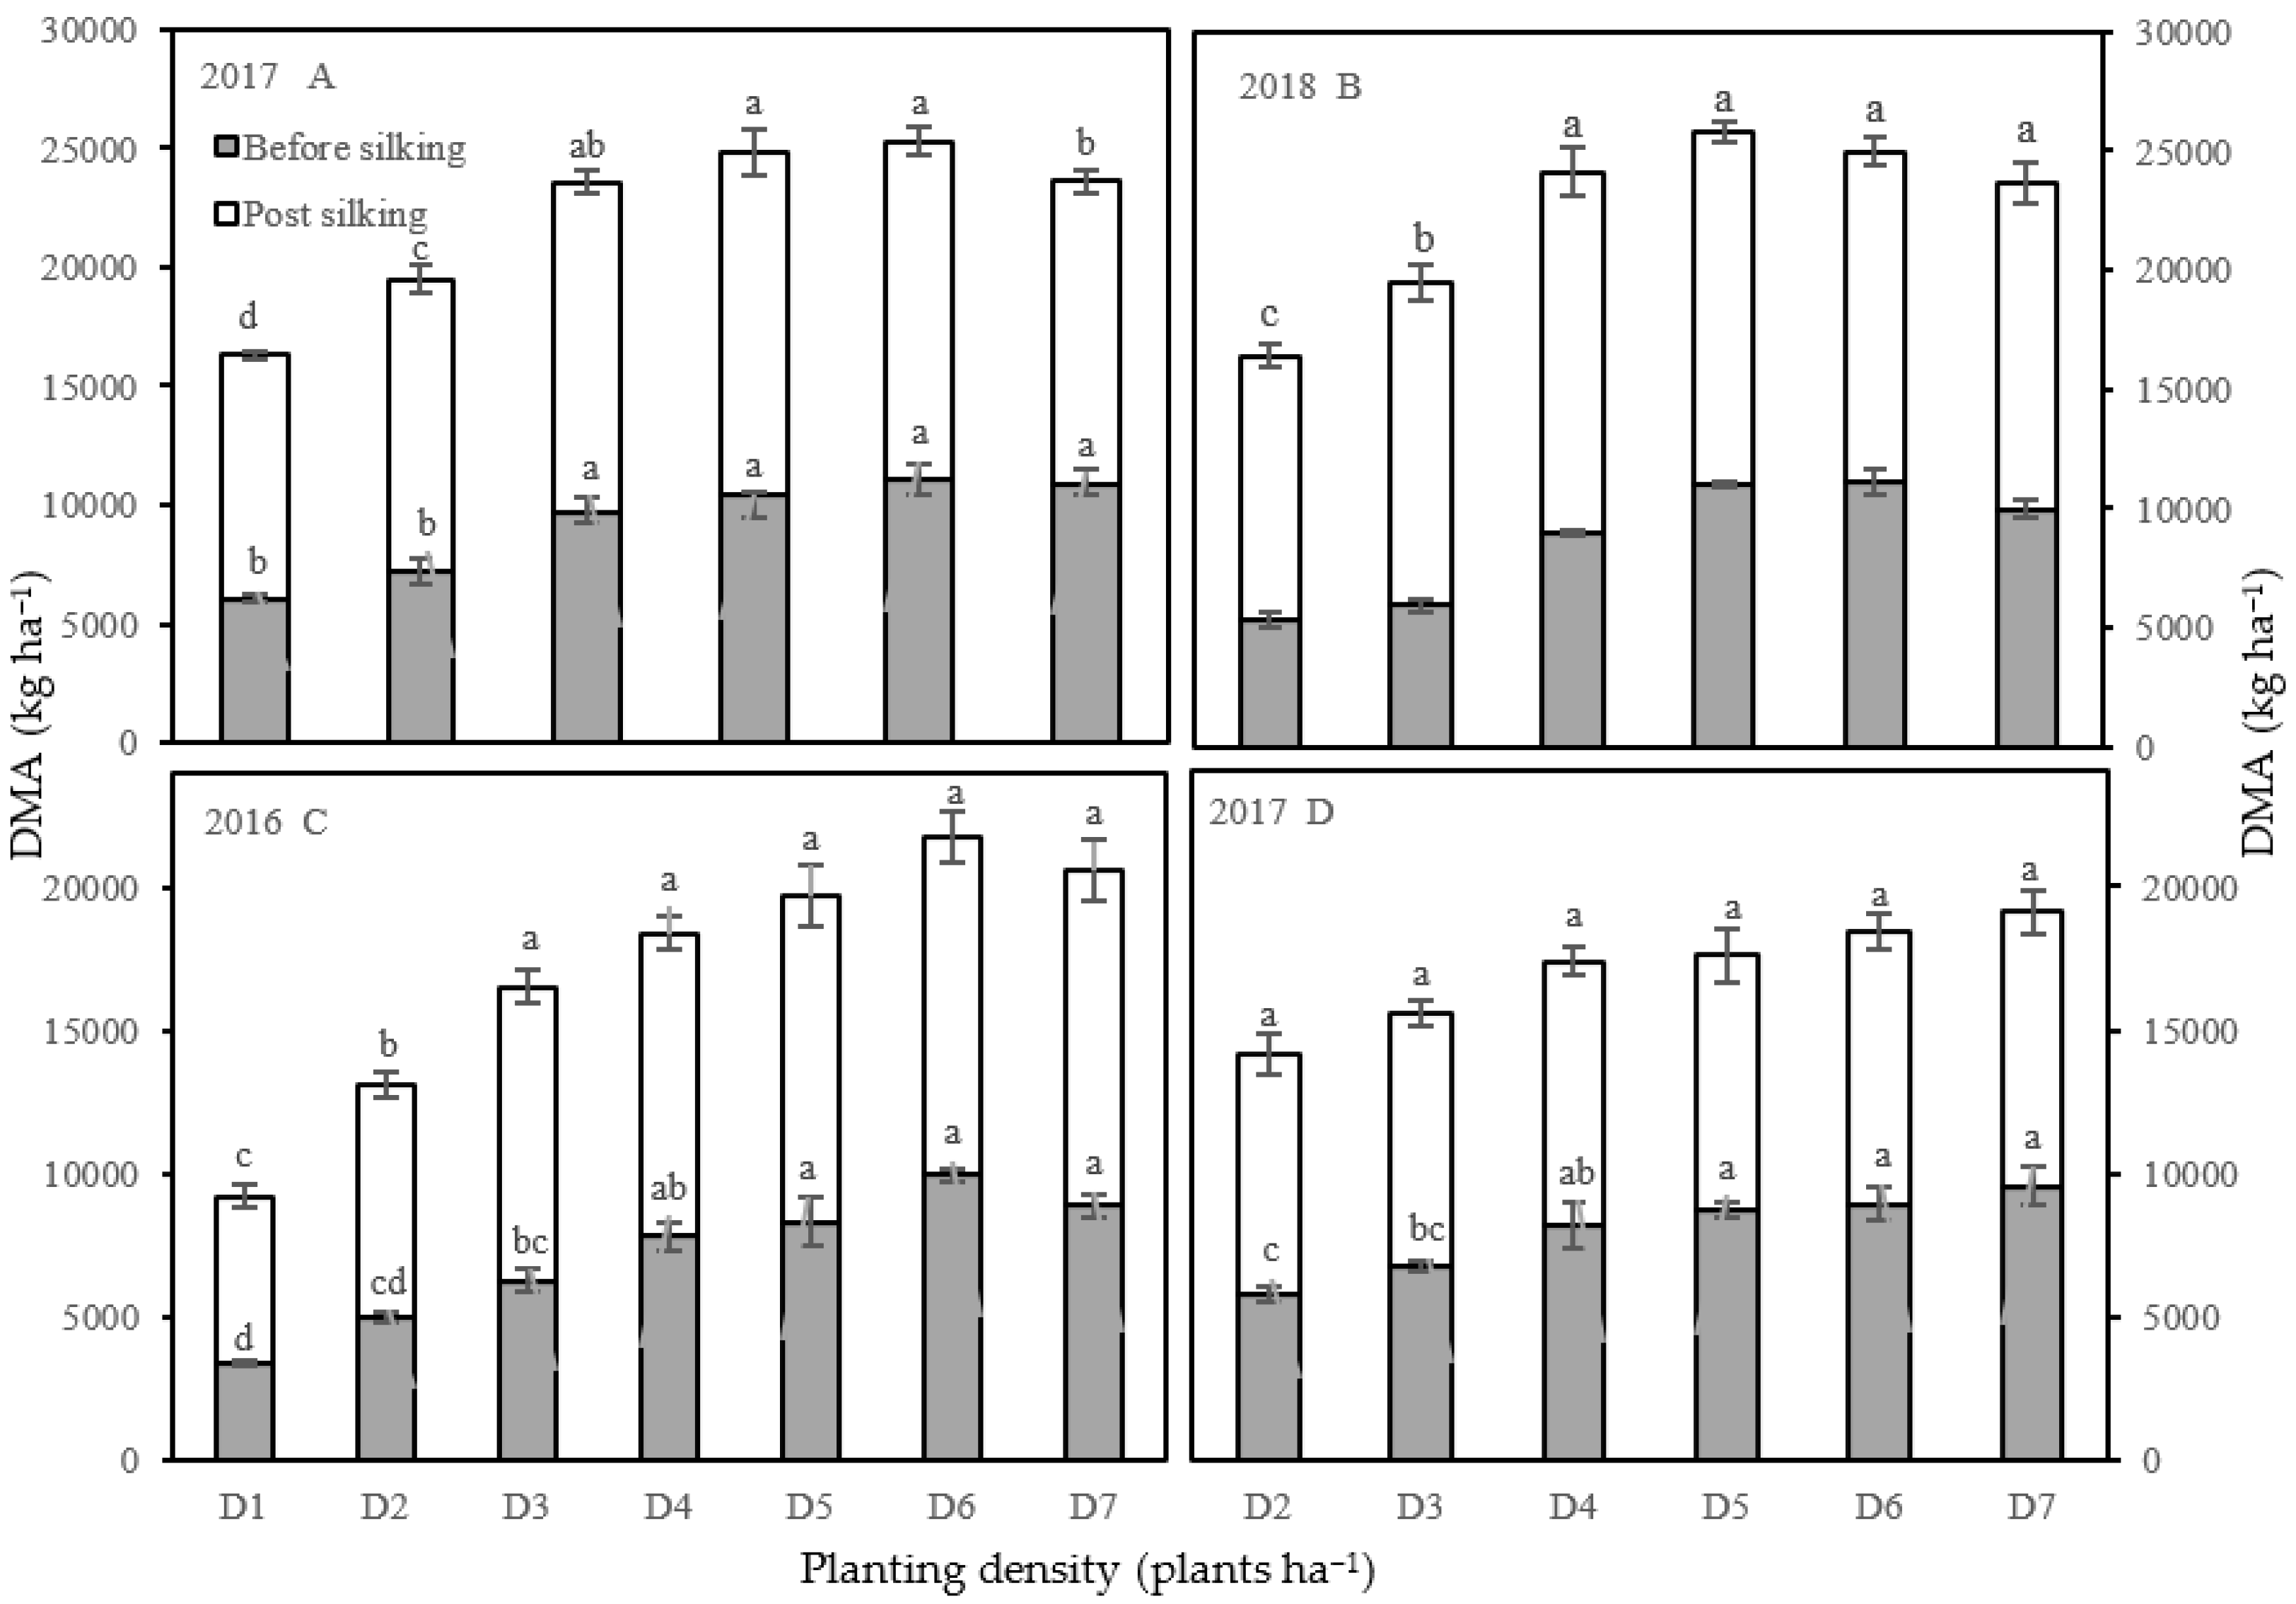
3.3. Difference in DMA and DMT
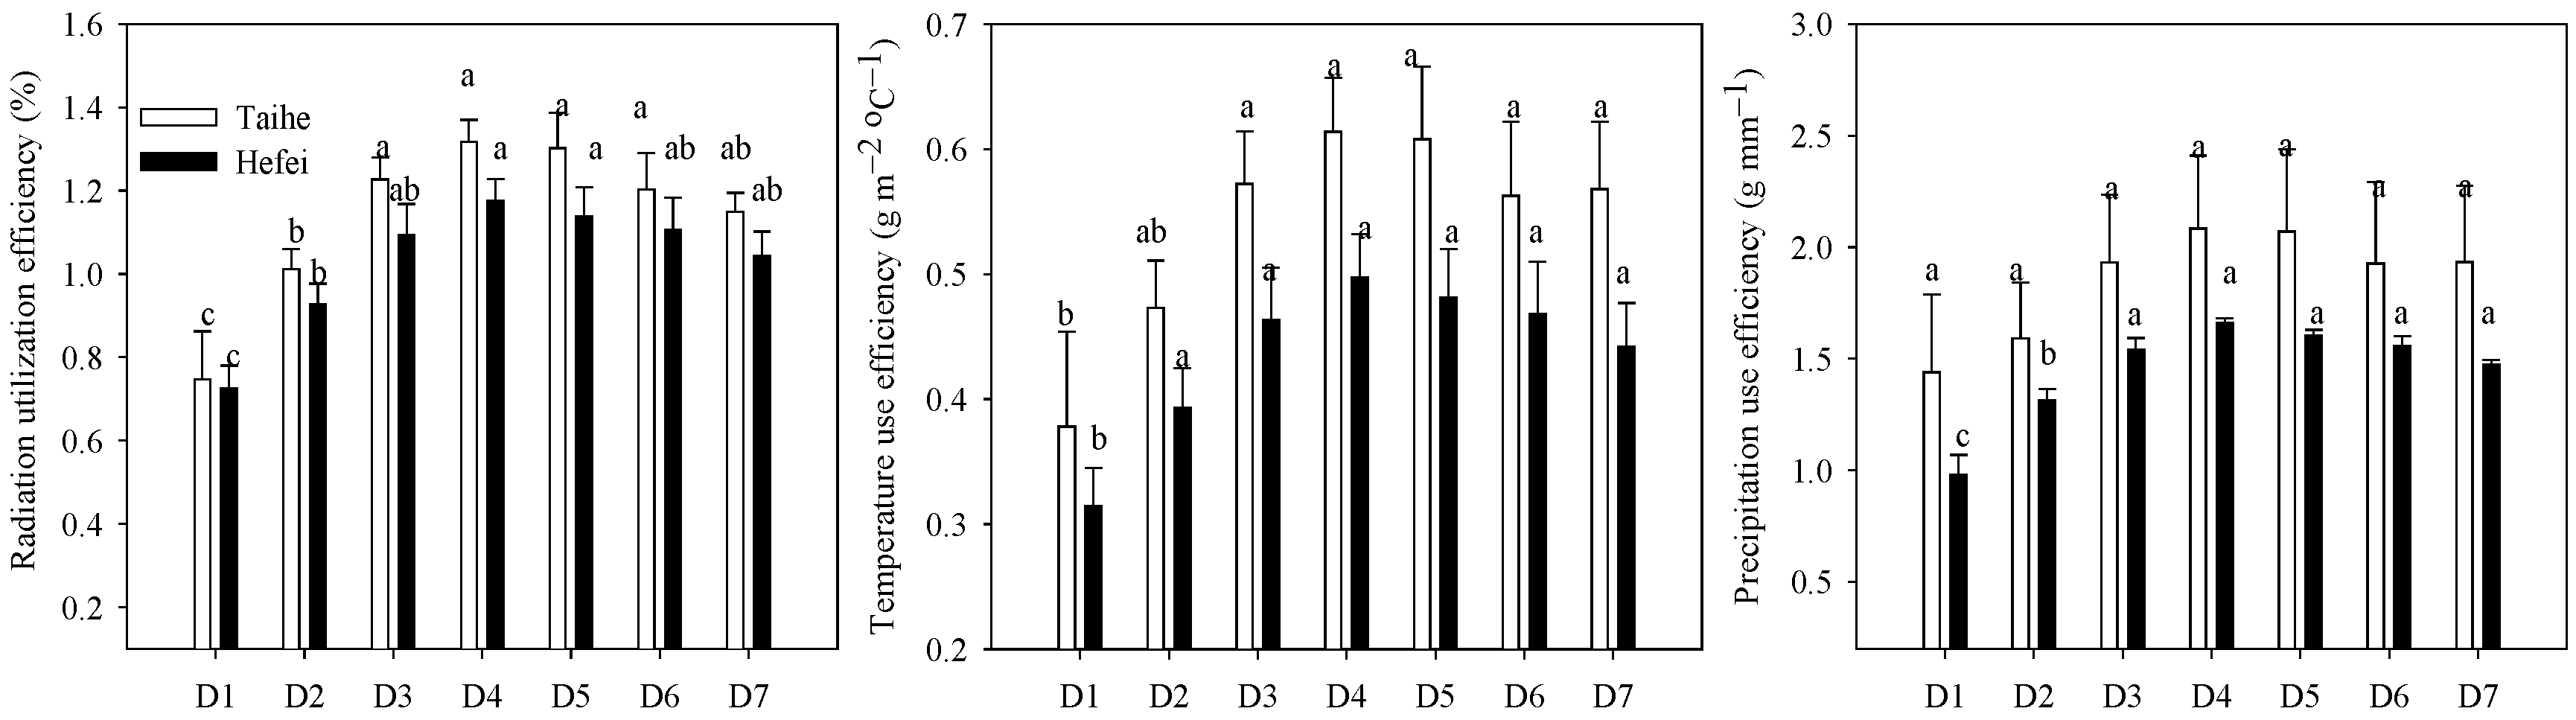
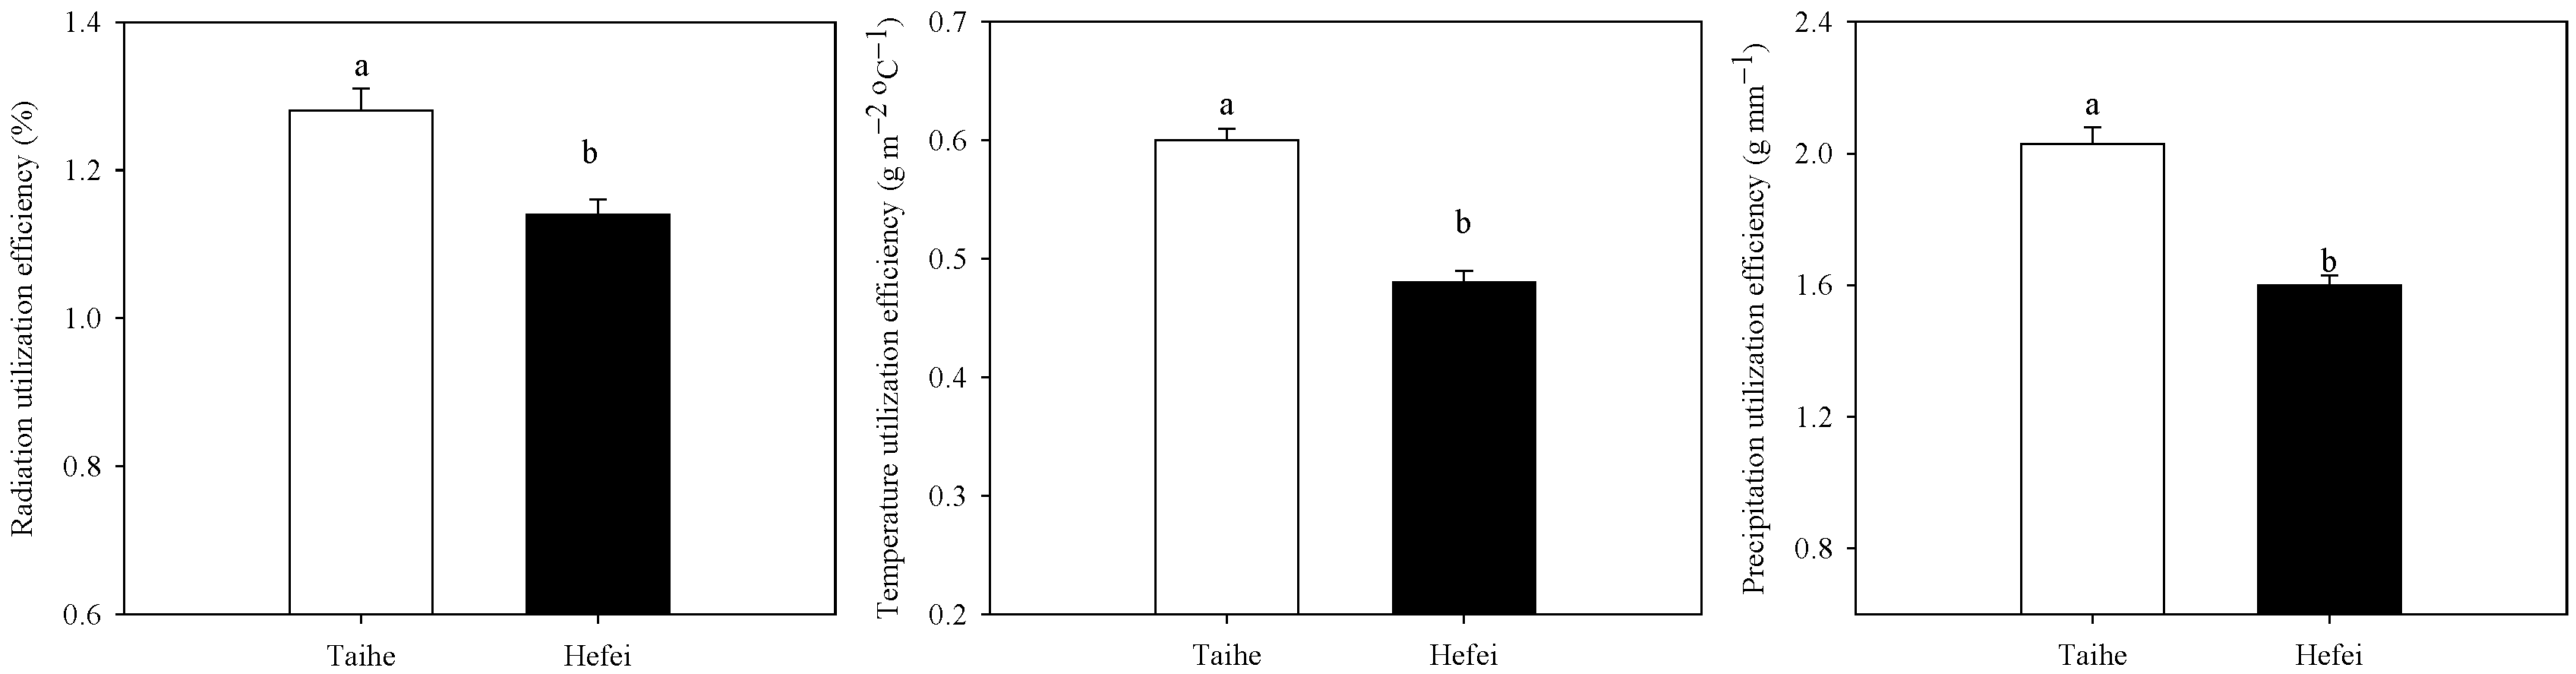
3.4. Differences in Resource Utilization Efficiency
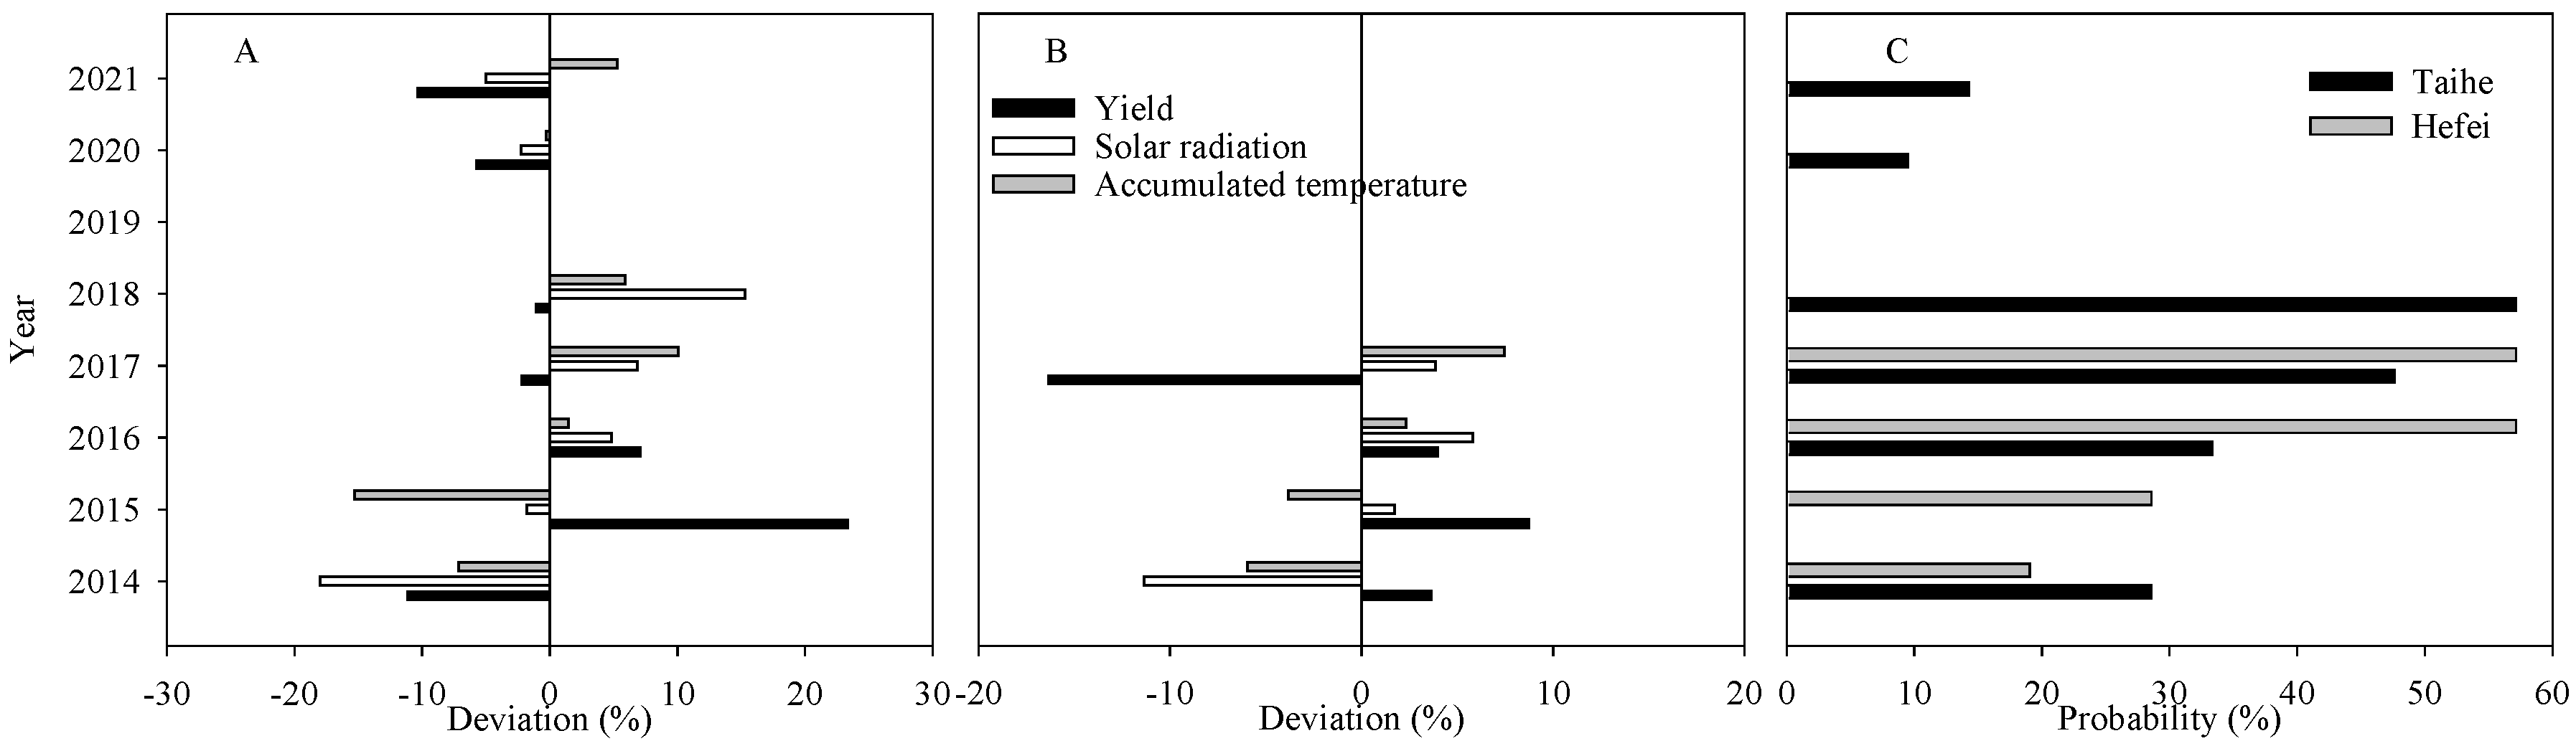
3.5. Inter-Annual Differences in Yield and Climate
4. Discussion
4.1. Change in Planting Density to Adapt to Climate Change and Improve Yield
4.2. Heat Resource Has a Negative Effect on the Grain Yield
5. Conclusions
Author Contributions
Funding
Data Availability Statement
Acknowledgments
Conflicts of Interest
Abbreviations
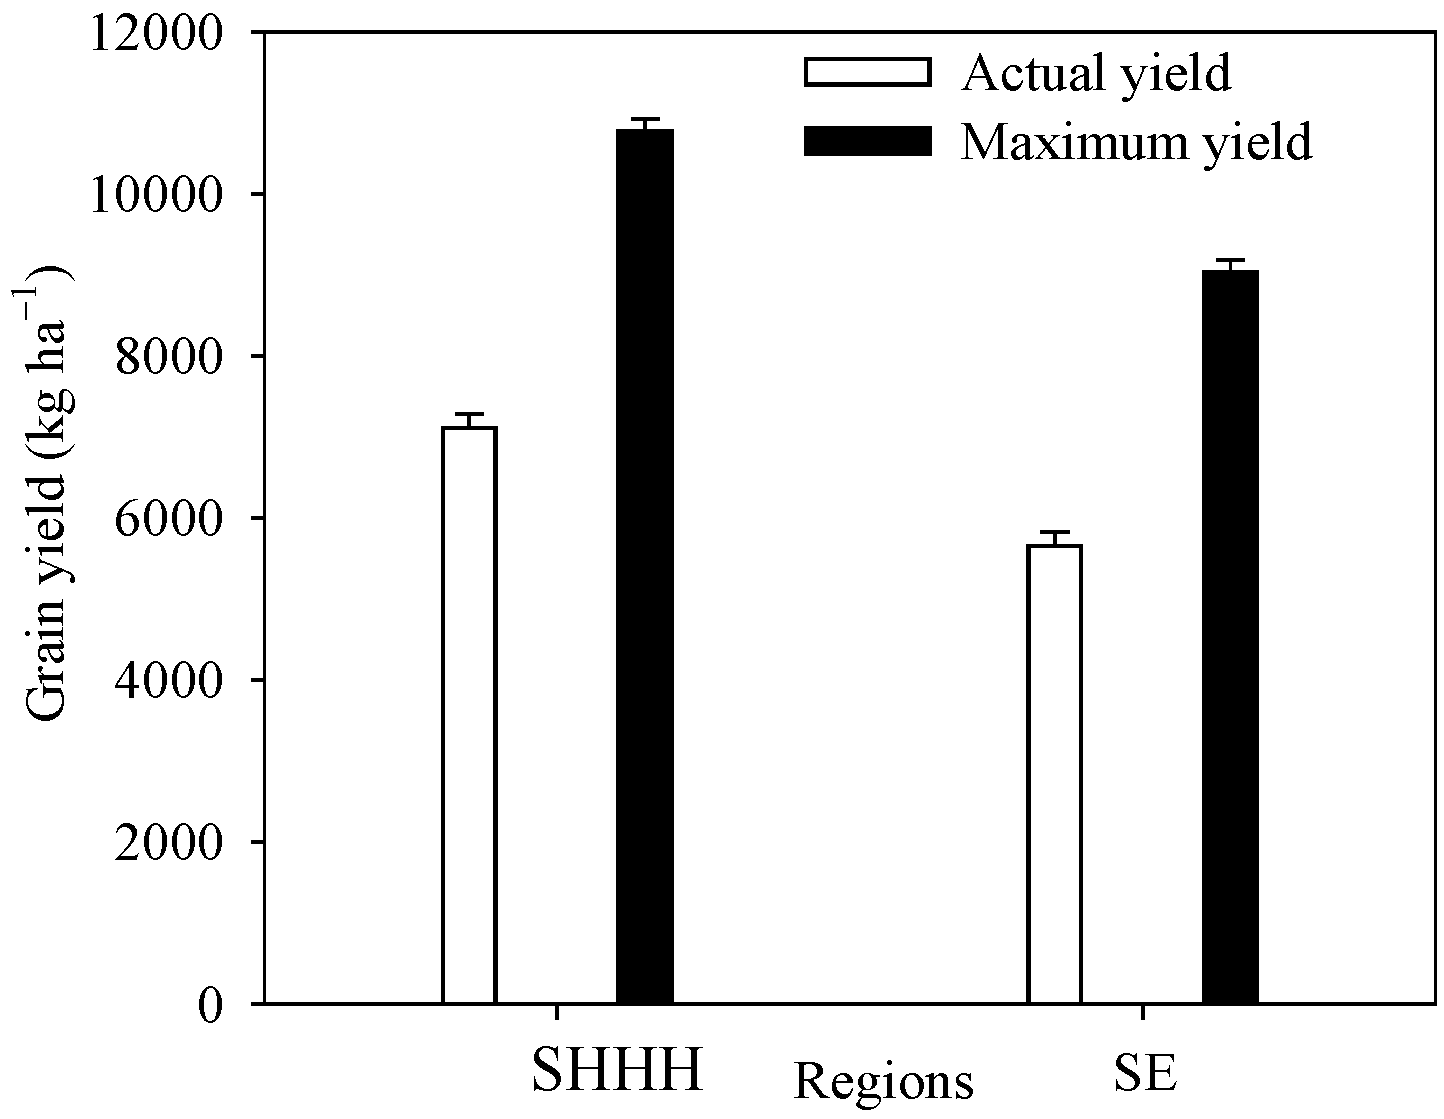
| SHHH | Southern Huang-Huai-Hai maize region |
| SE | Hilly maize area in the southeast |
| AOPD | Agronomic optimal planting density |
| Tmean | The mean temperature |
| Tmax | The maximum temperature |
| Prec. | Precipitation |
| AT10 | Accumulated temperature ≥ 10 °C |
| RUE | Solar radiation utilization efficiency |
| TUE | Temperature utilization efficiency |
| PUE | Precipitation utilization efficiency |
| DMA | Dry matter accumulation |
| DMT | Dry matter translocation |
| CDMGW | The contribution of dry matter at the post-silking stage to the grain weight |
References
- Li, R.F.; Zhang, G.Q.; Liu, G.Z.; Wang, K.; Xie, R.Z.; Hou, P.; Ming, B.; Wang, Z.G.; Li, S.K. Improving the yield potential in maize by constructing the ideal plant type and optimizing the maize canopy structure. Food Energy Secur. 2021, 10, e312. [Google Scholar] [CrossRef]
- Wang, L.J.; Liao, S.H.; Huang, S.B.; Ming, B.; Meng, Q.F.; Wang, P. Increasing concurrent drought and heat during the summer maize season in Huang-Huai-Hai Plain, China. Int. J. Climatol. 2018, 38, 3177–3190. [Google Scholar] [CrossRef]
- Edreira, J.I.R.; Otegui, M.E. Heat stress in temperate and tropical maize hybrids: A novel approach for assessing sources of kernel loss in field conditions. Field Crops Res. 2013, 142, 58–67. [Google Scholar] [CrossRef]
- Ma, D.L.; Xie, R.Z.; Zhang, F.L.; Li, J.; Li, S.M.; Long, H.L.; Liu, Y.; Guo, Y.Q.; Li, S.K. Genetic contribution to maize yield gain among different locations in China. Maydica 2015, 60, 1–8. [Google Scholar]
- Feng, Y.; Cui, X.; Shan, H.; Shi, Z.S.; Li, F.H.; Wang, H.W.; Zhu, M.; Zhong, X.M. Effects of solar radiation on photosynthetic physiology of barren stalk differentiation in maize. Plant Sci. 2021, 312, 111046. [Google Scholar] [CrossRef]
- Yang, Y.S.; Guo, X.X.; Hou, P.; Xue, J.; Liu, G.Z.; Liu, W.M.; Wang, Y.H.; Zhao, R.L.; Ming, B.; Xie, R.Z.; et al. Quantitative effects of solar radiation on maize lodging resistance mechanical properties. Field Crops Res. 2020, 255, 107906. [Google Scholar] [CrossRef]
- Zhang, M.; Chen, T.; Hojatollah, L.; Feng, X.M.; Cao, T.H.; Qian, C.R.; Deng, A.X.; Song, Z.W.; Zhang, W.J. How plant density affects maize spike differentiation, kernel set, and grain yield formation in Northeast China? J. Integr. Agric. 2018, 17, 1745–1757. [Google Scholar] [CrossRef]
- Xue, H.Y.; Han, Y.C.; Li, Y.B.; Wang, G.P.; Lu, F.; Fan, Z.Y.; Du, W.L.; Yang, B.F.; Mao, S.C. Spatial distribution of light interception by different plant population densities and its relationship with yield. Field Crops Res. 2015, 184, 17–27. [Google Scholar] [CrossRef]
- Yang, J.S.; Gao, H.Y.; Peng, L.; Geng, L.I.; Dong, S.T.; Zhang, J.W. Effects of planting density and row spacing on canopy apparent photosynthesis of high-yield summer corn. Acta Agron. Sin. 2010, 36, 1226–1235. [Google Scholar] [CrossRef]
- Gonzalez, V.H.; Tollenaar, M.; Bowman, A.; Good, B.; Lee, E.A. Maize yield potential and density tolerance. Crop Sci. 2018, 58, 472–485. [Google Scholar] [CrossRef]
- Liu, G.Z.; Yang, H.S.; Xie, R.Z.; Yang, Y.S.; Liu, W.M.; Guo, X.X.; Xue, J.; Ming, B.; Wang, K.R.; Hou, P.; et al. Genetic gains in maize yield and related traits for high-yielding cultivars released during 1980s to 2010s in China. Field Crops Res. 2021, 270, 108223. [Google Scholar] [CrossRef]
- Aschonitis, V.G.; Mastrocicco, M.; Colombani, N.; Salemi, E.; Kazakis, N.; Voudouris, K.; Castaldelli, G. Assessment of the intrinsic vulnerability of agricultural land to water and nitrogen losses via deterministic approach and regression analysis. Water Air Soil Pollut. 2012, 223, 1605–1614. [Google Scholar] [CrossRef]
- Assefa, Y.; Carter, P.; Hinds, M.; Bhalla, G.; Schon, R.; Jeschke, M.; Paszkiewicz, S.; Smith, S.; Ciampitti, I.A. Analysis of long term study indicates both agronomic optimal plant density and increase maize yield per plant contributed to yield gain. Sci. Rep. 2018, 8, 4937. [Google Scholar] [CrossRef] [Green Version]
- Sangoi, L. Understanding plant density effects on maize growth and development: An important issue to maximize grain yield. Ciência Rural 2000, 31, 159–168. [Google Scholar] [CrossRef] [Green Version]
- Chen, G.Z.; Wu, P.; Wang, J.Y.; Zhou, Y.D.; Ren, L.Q.; Cai, T.; Zhang, P.; Jia, Z.K. How do different fertilization depths affect the growth, yield, and nitrogen use efficiency in rain-fed summer maize? Field Crops Res. 2023, 290, 108759. [Google Scholar] [CrossRef]
- Zhao, J.; Yang, X.G.; Liu, Z.J.; Lv, S.; Wang, J.; Dai, S.W. Variations in the potential climatic suitability distribution patterns and grain yields for spring maize in Northeast China under climate change. Clim. Chang. 2016, 137, 29–42. [Google Scholar] [CrossRef]
- Begna, S.H.; Hamilton, R.I.; Dwver, L.M.; Stewart, D.W.; Smith, D.L. Effects of population density and planting pattern on the yield and yield components of leafy reduced-stature maize in a short-season area. J. Agron. Crop Sci. 1997, 179, 9–17. [Google Scholar] [CrossRef]
- Tokatlidis, I.S.; Has, V.; Melidis, V.; Has, I.; Mylonas, I.; Evgenidis, G.; Copandean, A.; Ninou, E.; Fasoula, V.A. Maize hybrids less dependent on high plant densities improve resource-use efficiency in rainfed and irrigated conditions. Field Crops Res. 2011, 120, 345–351. [Google Scholar] [CrossRef]
- Jia, Q.M.; Sun, L.F.; Mou, H.Y.; Ali, S.; Liu, D.H.; Zhang, Y.; Zhang, P.; Ren, X.L.; Jia, Z.K. Effects of planting patterns and sowing densities on grain-filling, radiation use efficiency and yield of maize (Zea mays L.) in semi-arid Regions. Agric. Water Manag. 2017, 201, 287–298. [Google Scholar] [CrossRef]
- Wang, T.X.; Li, N.; Li, Y.; Lin, H.X.; Yao, N.; Chen, X.G.; Liu, D.L.; Yu, Q.; Feng, H. Impact of climate variability on grain yields of spring and summer maize. Comput. Electron. Agric. 2022, 199, 107101. [Google Scholar] [CrossRef]
- Yu, Y.; Jiang, Z.H.; Wang, G.J.; Kattel, G.R.; Chuai, X.W.; Shang, Y.; Zou, Y.F.; Miao, L.J. Disintegrating the impact of climate change on maize yield from human management practices in China. Agric. For. Meteorol. 2022, 327, 109235. [Google Scholar] [CrossRef]
- Wang, J.; Wang, E.; Yin, H.; Feng, L.P.; Zhao, Y.X. Differences between observed and calculated solar radiations and their impact on simulated crop yields. Field Crops Res. 2015, 176, 1–10. [Google Scholar] [CrossRef]
- He, H.Y.; Hu, Q.; Li, R.; Pan, X.B.; Huang, B.X.; He, Q.J. Regional gap in maize production, climate and resource utilization in China. Field Crops Res. 2020, 254, 107830. [Google Scholar] [CrossRef]
- Liu, Y.E.; Hou, P.; Xie, R.Z.; Hao, W.P.; Li, S.K.; Mei, X.R. Spatial variation and improving measures of the utilization efficiency of accumulated temperature. Crop Sci. 2015, 55, 1806–1817. [Google Scholar] [CrossRef]
- Yang, Y.W.; Yu, Q.; Wang, J. Spatio-temporal variations of principal climatic factors in north china and part of East China within past 40 years. Resour. Sci. 2004, 26, 45–50. [Google Scholar]
- Zhang, L.L.; Zhang, Z.; Luo, Y.C.; Cao, J.; Li, Z.Y. Optimizing genotype-environment-management interactions for maize farmers to adapt to climate change in different agro-ecological zones across China. Sci. Total Environ. 2020, 728, 138614. [Google Scholar] [CrossRef]
- Zhang, Z.T.; Yang, X.G.; Liu, Z.J.; Bai, F.; Sun, S.; Nie, J.Y.; Gao, J.Q.; Ming, B.; Xie, R.Z.; Li, S.K. Spatio-temporal characteristics of agro-climatic indices and extreme weather events during the growing season for summer maize (Zea mays L.) in Huanghuaihai region, China. Int. J. Biometeorol. 2020, 64, 827–839. [Google Scholar] [CrossRef]
- Hou, P.; Liu, Y.; Liu, W.M.; Yang, H.S.; Xie, R.Z.; Wang, K.R.; Ming, B.; Liu, G.Z.; Xue, J.; Wang, Y.H.; et al. Quantifying maize grain yield losses caused by climate change based on extensive field data across China. Resour. Conserv. Recycl. 2021, 174, 105811. [Google Scholar] [CrossRef]
- Xiao, D.P.; Liu, D.L.; Wang, B.; Feng, P.Y.; Waters, C. Designing high-yielding maize ideotypes to adapt changing climate in the North China Plain. Agric. Syst. 2020, 181, 102805. [Google Scholar] [CrossRef]
- Liu, Y.; Wang, E.L.; Yang, X.G.; Wang, J. Contributions of climatic and crop varietal changes to crop production in the North China Plain, since 1980s. Glob. Chang. Biol. 2010, 16, 2287–2299. [Google Scholar] [CrossRef]
- Xu, W.J.; Liu, C.W.; Wang, K.R.; Xie, R.Z.; Ming, B.; Wang, Y.H.; Zhang, G.Q.; Liu, G.Z.; Zhao, R.L.; Fan, P.P.; et al. Adjusting maize plant density to different climatic conditions across a large longitudinal distance in China. Field Crops Res. 2017, 212, 126–134. [Google Scholar] [CrossRef]
- Gao, Y.K.; Zhao, H.F.; Zhao, C.; Hu, G.H.; Zhang, H.; Liu, X.; Li, N.; Hou, H.Y.; Li, X. Spatial and temporal variations of maize and wheat yield gaps and their relationships with climate in China. Agric. Water Manag. 2022, 270, 107714. [Google Scholar] [CrossRef]
- Wu, W.M.; Wang, S.J.; Chen, H.J.; Song, Y.H.; Zhang, L.; Chen, P.; Jing, L.L.; Li, J.C. Optimal nitrogen regimes compensate for the impacts of seedling subjected to waterlogging stress in summer maize. PLoS ONE 2018, 13, e0206210. [Google Scholar] [CrossRef]
- Wu, W.M.; Wang, S.J.; Zhang, L.; Li, J.C.; Song, Y.H.; Peng, C.; Chen, X.; Jing, L.L.; Chen, H.J. Subsoiling improves the photosynthetic characteristics of leaves and water use efficiency of rainfed summer maize in the southern Huang-Huai-Hai plain of China. Agronomy 2020, 10, 465. [Google Scholar] [CrossRef] [Green Version]
- Chang, Q. Spati-Temporal Variation of the Yield in Wheat-Maize Production System and the Distribution Differences of Radiation and Heat Use Efficiency in Henan Province. Master’s Thesis, China Agricultural University, Beijing, China, 2016. [Google Scholar]
- Liu, G.; Liu, W.; Hou, P.; Ming, B.; Yang, Y.; Guo, X.; Xie, R.; Wang, K.; Li, S. Reducing maize yield gap by matching plant density and solar radiation. J. Integr. Agric. 2020, 19, 2–9. [Google Scholar] [CrossRef]
- Ren, B.Z.; Liu, W.; Zhang, J.W.; Dong, S.T.; Liu, P.; Zhao, B. Effects of plant density on the photosynthetic and chloroplast characteristics of maize under high-yielding conditions. Sci. Nat. 2017, 104, 12. [Google Scholar] [CrossRef]
- Luo, N.; Wang, X.Y.; Hou, J.M.; Wang, Y.Y.; Wang, P.; Meng, Q.F. Agronomic optimal plant density for yield improvement in the major maize regions of China. Crop Sci. 2020, 60, 1580–1590. [Google Scholar] [CrossRef]
- Grassini, P.; Thorburn, J.; Burr, C.; Cassman, K.G. High-yield irrigated maize in the Western U.S. Corn Belt: I. On-farm yield, yield potential, and impact of agronomic practices. Field Crops Res. 2011, 120, 142–150. [Google Scholar] [CrossRef] [Green Version]
- Meng, Q.F.; Hou, P.; Wu, L.; Chen, X.P.; Cui, Z.L.; Zhang, F.S. Understanding production potentials and yield gaps in intensive maize production in China. Field Crops Res. 2013, 143, 91–97. [Google Scholar] [CrossRef] [Green Version]
- An, Z.C.; Wang, C.; Jiao, X.Q.; Kong, Z.L.; Jiang, W.; Zhang, D.; Ma, W.Q.; Zhang, F.S. Methodology of analyzing maize density loss in smallholde’s fields and potential optimize approach. Agriculture 2021, 11, 480. [Google Scholar] [CrossRef]
- Zhang, W.F.; Cao, G.X.; Li, X.L.; Zhang, H.Y.; Wang, C.; Liu, Q.Q.; Chen, X.P.; Cui, Z.L.; Shen, J.B.; Jiang, R.F.; et al. Closing yield gaps in China by empowering smallholder farmers. Nature 2016, 537, 622–671. [Google Scholar] [CrossRef] [PubMed]
- Sun, H.Y.; Zhang, X.Y.; Wang, E.L.; Chen, S.Y.; Shao, L.W.; Qin, W.L. Assessing the contribution of weather and management to the annual yield variation of summer maize using APSIM in the North China Plain. Field Crops Res. 2016, 194, 94–102. [Google Scholar] [CrossRef]
- Deng, J.M.; Ran, J.Z.; Wang, Z.Q.; Fan, Z.X.; Wang, G.X.; Ji, M.F.; Liu, J.; Wang, Y.; Liu, J.Q.; Brown, J.H. Models and tests of optimal density and maximal yield for crop plants. Proc. Natl. Acad. Sci. USA 2012, 109, 15823–15828. [Google Scholar] [CrossRef] [Green Version]
- Srinivasan, V.; Kumar, P.; Long, S.P. Decreasing, not increasing, leaf area will raise crop yields under global atmospheric change. Glob. Change Biol. 2017, 23, 1626–1635. [Google Scholar] [CrossRef]
- Robles, M.; Ciampitti, I.A.; Vyn, T.J. Responses of maize hybrids to twin-row spatial arrangement at multiple plant densities. Agron. J. 2012, 104, 1747–1756. [Google Scholar] [CrossRef] [Green Version]
- Zhao, J.F.; Guo, J.P.; Mu, J. Exploring the relationships between climatic variables and climate-induced yield of spring maize in Northeast China. Agric. Ecosyst. Environ. 2015, 207, 79–90. [Google Scholar] [CrossRef]
- Zhai, L.C.; Zhang, L.H.; Yao, H.P.; Zheng, M.J.; Ming, B.; Xie, R.Z.; Zhang, J.T.; Jia, X.L.; Ji, J.J. The optimal cultivar × sowing date × plant density for grain yield and resource use efficiency of summer maize in the Northern Huang-Huai-Hai Plain of China. Agriculture 2022, 12, 7. [Google Scholar] [CrossRef]
- Bu, L.D.; Chen, X.P.; Li, S.Q.; Liu, J.L.; Zhu, L.; Luo, S.S.; Hill, R.L.; Zhao, Y. The effect of adapting cultivars on the water use efficiency of dryland maize (Zea mays L.) in northwestern China. Agric. Water Manag. 2015, 148, 1–9. [Google Scholar] [CrossRef]
- Andrade, F.H.; Uhart, S.A.; Frugone, M.I. Intercepted radiation at flowering and kernel number in maize: Shade versus plant density effects. Crop Sci. 1983, 33, 482–485. [Google Scholar] [CrossRef]
- Wang, J.; Wang, E.; Yin, H.; Feng, L.; Zhang, J. Declining yield potential and shrinking yield gaps of maize in the North China Plain. Agric. For. Meteorol. 2014, 195, 89–101. [Google Scholar] [CrossRef]
- Fischer, K.S.; Palmer, A.F. Tropical Maize. In The Physiology of Tropical Field Frops; Goldsworthy, P.R., Fischer, N., Eds.; Wiley: New York, NY, USA, 1984; pp. 213–248. [Google Scholar]
- Otegui, M.E. Prolificacy and grain yield components in modern Argentinian maize hybrids. Maydica 1995, 40, 371–376. [Google Scholar]
- Cerrudo, D.; Hernández, M.; Tollenaar, M.; Vega, C.R.C.; Echarte, L. Kernel number response to plant density in tropical, temperate, and tropical × temperate maize hybrids. Crop Sci. 2020, 260, 381–390. [Google Scholar] [CrossRef]
- Umesh, B.; Reddy, K.S.; Polisgowdar, B.S.; Maruthi, V.; Satishkumar, U.; Ayyanagoudar, M.S.; Rao, S.; Veeresh, H. Assessment of climate change impact on maize (Zea mays L.) through aquacrop model in semi-arid alfisol of southern Telangana. Agric. Water Manag. 2022, 274, 107950. [Google Scholar] [CrossRef]
- Lizasoa, J.I.; Ruiz-Ramosa, M.; Rodrígueza, L.; Gabaldon-Lealb, C.; Oliveirac, J.A.; Loriteb, I.J.; Sáncheza, D.; Garcíad, E.; Rodrígueza, A. Impact of high temperatures in maize: Phenology and yield components. Field Crops Res. 2018, 216, 129–140. [Google Scholar] [CrossRef] [Green Version]
- Bassu, S.; Fumagalli, D.; Toreti, A.; Ceglar, A.; Giunta, F.; Motzo, R.; Zajac, Z.; Niemeyer, S. Modelling potential maize yield with climate and crop conditions around flowering. Field Crops Res. 2021, 271, 108226. [Google Scholar] [CrossRef]
- Chekole, F.C.; Ahmed, A.M. Future climate implication on maize (Zea mays) productivity with adaptive options at Harbu district, Ethiopia. J. Agric. Food Res. 2023, 11, 100480. [Google Scholar] [CrossRef]
- Wang, H.T.; Zhang, C.H.; Fang, Y.; Chu, J.H.; Yan, Z.; Zhou, G.X.; Wang, L.; Yang, W.; Shen, G.L.; Wang, H. The impact of climate change on crop breeding strategies in China. Chin. Agric. Sci. Bull. 2022, 38, 64–74. [Google Scholar]


| Sites | Years | pH | Soil Organic Carbon (g kg−1) | Alkali-Hydrolyzable N (mg kg−1) | Available P (mg kg−1) | Available K (mg kg−1) |
|---|---|---|---|---|---|---|
| Taihe | 2014 | 7.2 | 22.1 | 120.6 | 43.1 | 227.9 |
| 2015 | 6.9 | 21.7 | 133.1 | 38.1 | 271.2 | |
| 2016 | 7.2 | 22.3 | 169.7 | 40.5 | 249.7 | |
| 2017 | 7.1 | 22.1 | 159.8 | 35.9 | 187.6 | |
| 2018 | 6.9 | 20.6 | 146.2 | 30.8 | 186.4 | |
| 2020 | 6.9 | 22.8 | 175.6 | 39.1 | 201.0 | |
| 2021 | 6.8 | 20.6 | 145.9 | 38.6 | 156.7 | |
| Hefei | 2014 | 6.9 | 21.6 | 118.4 | 25.4 | 269.6 |
| 2015 | 6.5 | 19.8 | 129.8 | 26.5 | 224.9 | |
| 2016 | 6.7 | 20.6 | 156.4 | 21.1 | 200.7 | |
| 2017 | 6.7 | 19.1 | 127.1 | 18.6 | 235.8 |
| Taihe | Hefei | Taihe | Hefei | |
|---|---|---|---|---|
| 2012–2021 | 2012–2021 | 2014–2021 | 2014–2017 | |
| The annual mean temperature (°C) | 15.7 | 16.2 | − | − |
| The mean annual total precipitation (mm) | 1000 | 1033 | − | − |
| The mean temperature from June to October (°C) | − | − | 23.7 | 24.6 |
| The mean total precipitation from June to October (mm) | − | − | 657 | 745.3 |
| Years | Planting Date (Month/Day) | Harvesting Date (Month/Day) | ||
|---|---|---|---|---|
| Taihe | Hefei | Taihe | Hefei | |
| 2014 | 6/17 | 6/21 | 10/03 | 10/14 |
| 2015 | 6/17 | 6/21 | 10/03 | 10/14 |
| 2016 | 6/13 | 6/28 | 10/06 | 10/18 |
| 2017 | 6/12 | 6/15 | 10/13 | 10/10 |
| 2018 | 6/05 | − | 9/27 | − |
| 2019 | − | − | − | − |
| 2020 | 6/05 | − | 9/27 | − |
| 2021 | 6/05 | − | 9/27 | − |
| Factor | Yield | 1000-Kernel Weight | Kernel Number | Ear Number |
|---|---|---|---|---|
| Density (D) | 172.3 ** | 47.1 ** | 178.4 ** | 9.9 ** |
| Year (Y) | 97.5 ** | 89.1 ** | 99.1 ** | 1.2 |
| Site (S) | 446.3 ** | 125.2 ** | 370.2 ** | 0.009 |
| D × Y | 6.8 ** | 4.4 | 12.5 ** | 1.1 |
| D × S | 5.6 ** | 1.0 | 8.5 ** | 0.01 |
| Y × S | 53.6 ** | 70.5 ** | 17.0 ** | 0.07 |
| D × S × Y | 3.0 ** | 2.0 * | 3.4 ** | 0.02 |
| Site | Equation | R2 | Planting Density | Yield | ||||
|---|---|---|---|---|---|---|---|---|
| AOPD | 95% CI | AOPD | 95% CI | |||||
| Lower | Upper | Lower | Upper | |||||
| 104 Plants ha−1 | kg ha−1 | |||||||
| Taihe | y = −1.44 × 10−6x2 + 0.2498x | 0.3670 | 8.6 | 7.6 | 9.7 | 10,768.3 | 10,610.8 | 10,610.8 |
| Hefei | y = −1.41 × 10−6x2 + 0.2257x | 0.5801 | 8.0 | 6.9 | 9.0 | 9025.6 | 8870.1 | 8870.1 |
| Site | Year | Treatment | DMT before the Silking Stage (kg ha−1) | Contribution of DMT before the Silking Stage to Grain (%) | DMA at the Post-Silking Stage (kg ha−1) | CDMGW (%) |
|---|---|---|---|---|---|---|
| Taihe | 2017 | D2 | 1932.1 | 23.3 | 6360.2 | 76.7 |
| D3 | 1918.2 | 18.6 | 8412.6 | 81.4 | ||
| D4 | 1808.4 | 15.0 | 10,245.9 | 85.0 | ||
| D5 | 2884.4 | 25.1 | 8595.2 | 74.9 | ||
| D6 | 3418.1 | 31.5 | 7424.2 | 68.5 | ||
| D7 | 3423.7 | 36.7 | 5916.2 | 63.3 | ||
| 2018 | D2 | 2858.0 | 34.6 | 5392.4 | 65.4 | |
| D3 | 3554.5 | 35.5 | 6467.7 | 64.5 | ||
| D4 | 2053.2 | 15.7 | 11,052.3 | 84.3 | ||
| D5 | 1707.4 | 13.1 | 11,343.0 | 86.9 | ||
| D6 | 3760.0 | 37.2 | 6335.8 | 62.8 | ||
| D7 | 3768.9 | 38.0 | 6159.0 | 62.0 | ||
| Hefei | 2016 | D1 | 1029.9 | 21.4 | 3777.6 | 78.6 |
| D2 | 1420.6 | 21.1 | 5311.5 | 78.9 | ||
| D3 | 1832.6 | 21.8 | 6592.1 | 78.2 | ||
| D4 | 1279.9 | 13.8 | 8025.8 | 86.2 | ||
| D5 | 1959.5 | 20.8 | 7473.5 | 79.2 | ||
| D6 | 2862.6 | 32.0 | 6074.5 | 68.0 | ||
| D7 | 3387.7 | 40.7 | 4938.2 | 59.3 | ||
| 2017 | D2 | 2120.3 | 34.0 | 4114.1 | 66.0 | |
| D3 | 1910.8 | 27.8 | 4968.8 | 72.2 | ||
| D4 | 1427.2 | 18.3 | 6363.7 | 81.7 | ||
| D5 | 1502.7 | 20.4 | 5871.6 | 79.6 | ||
| D6 | 2672.1 | 39.1 | 4168.7 | 60.9 | ||
| D7 | 2891.2 | 43.3 | 3792.2 | 56.7 |
| Climatic Resources | Regions | Ranges |
|---|---|---|
| Solar radiation (MJ m−2) | Taihe | 1441.8~2028.3 |
| Hefei | 1340.4~1989.84 | |
| Accumulated temperature ≥ 10 °C (°C) | Taihe | 1515.6~1968.6 |
| Hefei | 1715.4~2027.8 | |
| Precipitation (mm) | Taihe | 358.3~881.1 |
| Hefei | 469.8~1055.2 |
Disclaimer/Publisher’s Note: The statements, opinions and data contained in all publications are solely those of the individual author(s) and contributor(s) and not of MDPI and/or the editor(s). MDPI and/or the editor(s) disclaim responsibility for any injury to people or property resulting from any ideas, methods, instructions or products referred to in the content. |
© 2023 by the authors. Licensee MDPI, Basel, Switzerland. This article is an open access article distributed under the terms and conditions of the Creative Commons Attribution (CC BY) license (https://creativecommons.org/licenses/by/4.0/).
Share and Cite
Wu, W.; Zhang, L.; Chu, Z.; Yue, W.; Xu, Y.; Peng, C.; Chen, X.; Jing, L.; Ma, W.; Wang, S. Improvement of Climate Resource Utilization Efficiency to Enhance Maize Yield through Adjusting Planting Density. Agronomy 2023, 13, 846. https://doi.org/10.3390/agronomy13030846
Wu W, Zhang L, Chu Z, Yue W, Xu Y, Peng C, Chen X, Jing L, Ma W, Wang S. Improvement of Climate Resource Utilization Efficiency to Enhance Maize Yield through Adjusting Planting Density. Agronomy. 2023; 13(3):846. https://doi.org/10.3390/agronomy13030846
Chicago/Turabian StyleWu, Wenming, Lin Zhang, Zhaokang Chu, Wei Yue, Ying Xu, Chen Peng, Xiang Chen, Lili Jing, Wei Ma, and Shiji Wang. 2023. "Improvement of Climate Resource Utilization Efficiency to Enhance Maize Yield through Adjusting Planting Density" Agronomy 13, no. 3: 846. https://doi.org/10.3390/agronomy13030846