
Genetic Diversity and Population Structure in Solanum nigrum Based on Single-Nucleotide Polymorphism (SNP) Markers

 ,
,
Abstract
:1. Introduction
2. Materials and Methods
2.1. Plant Materials
2.2. Genomic DNA Extractions and Specific-Locus Amplified Fragment Sequencing
2.3. Sequence Alignment for SNP Calling and Quality Assessment
2.4. Genetic Differentiation Analyses
2.5. Phylogenetic Analysis
3. Results
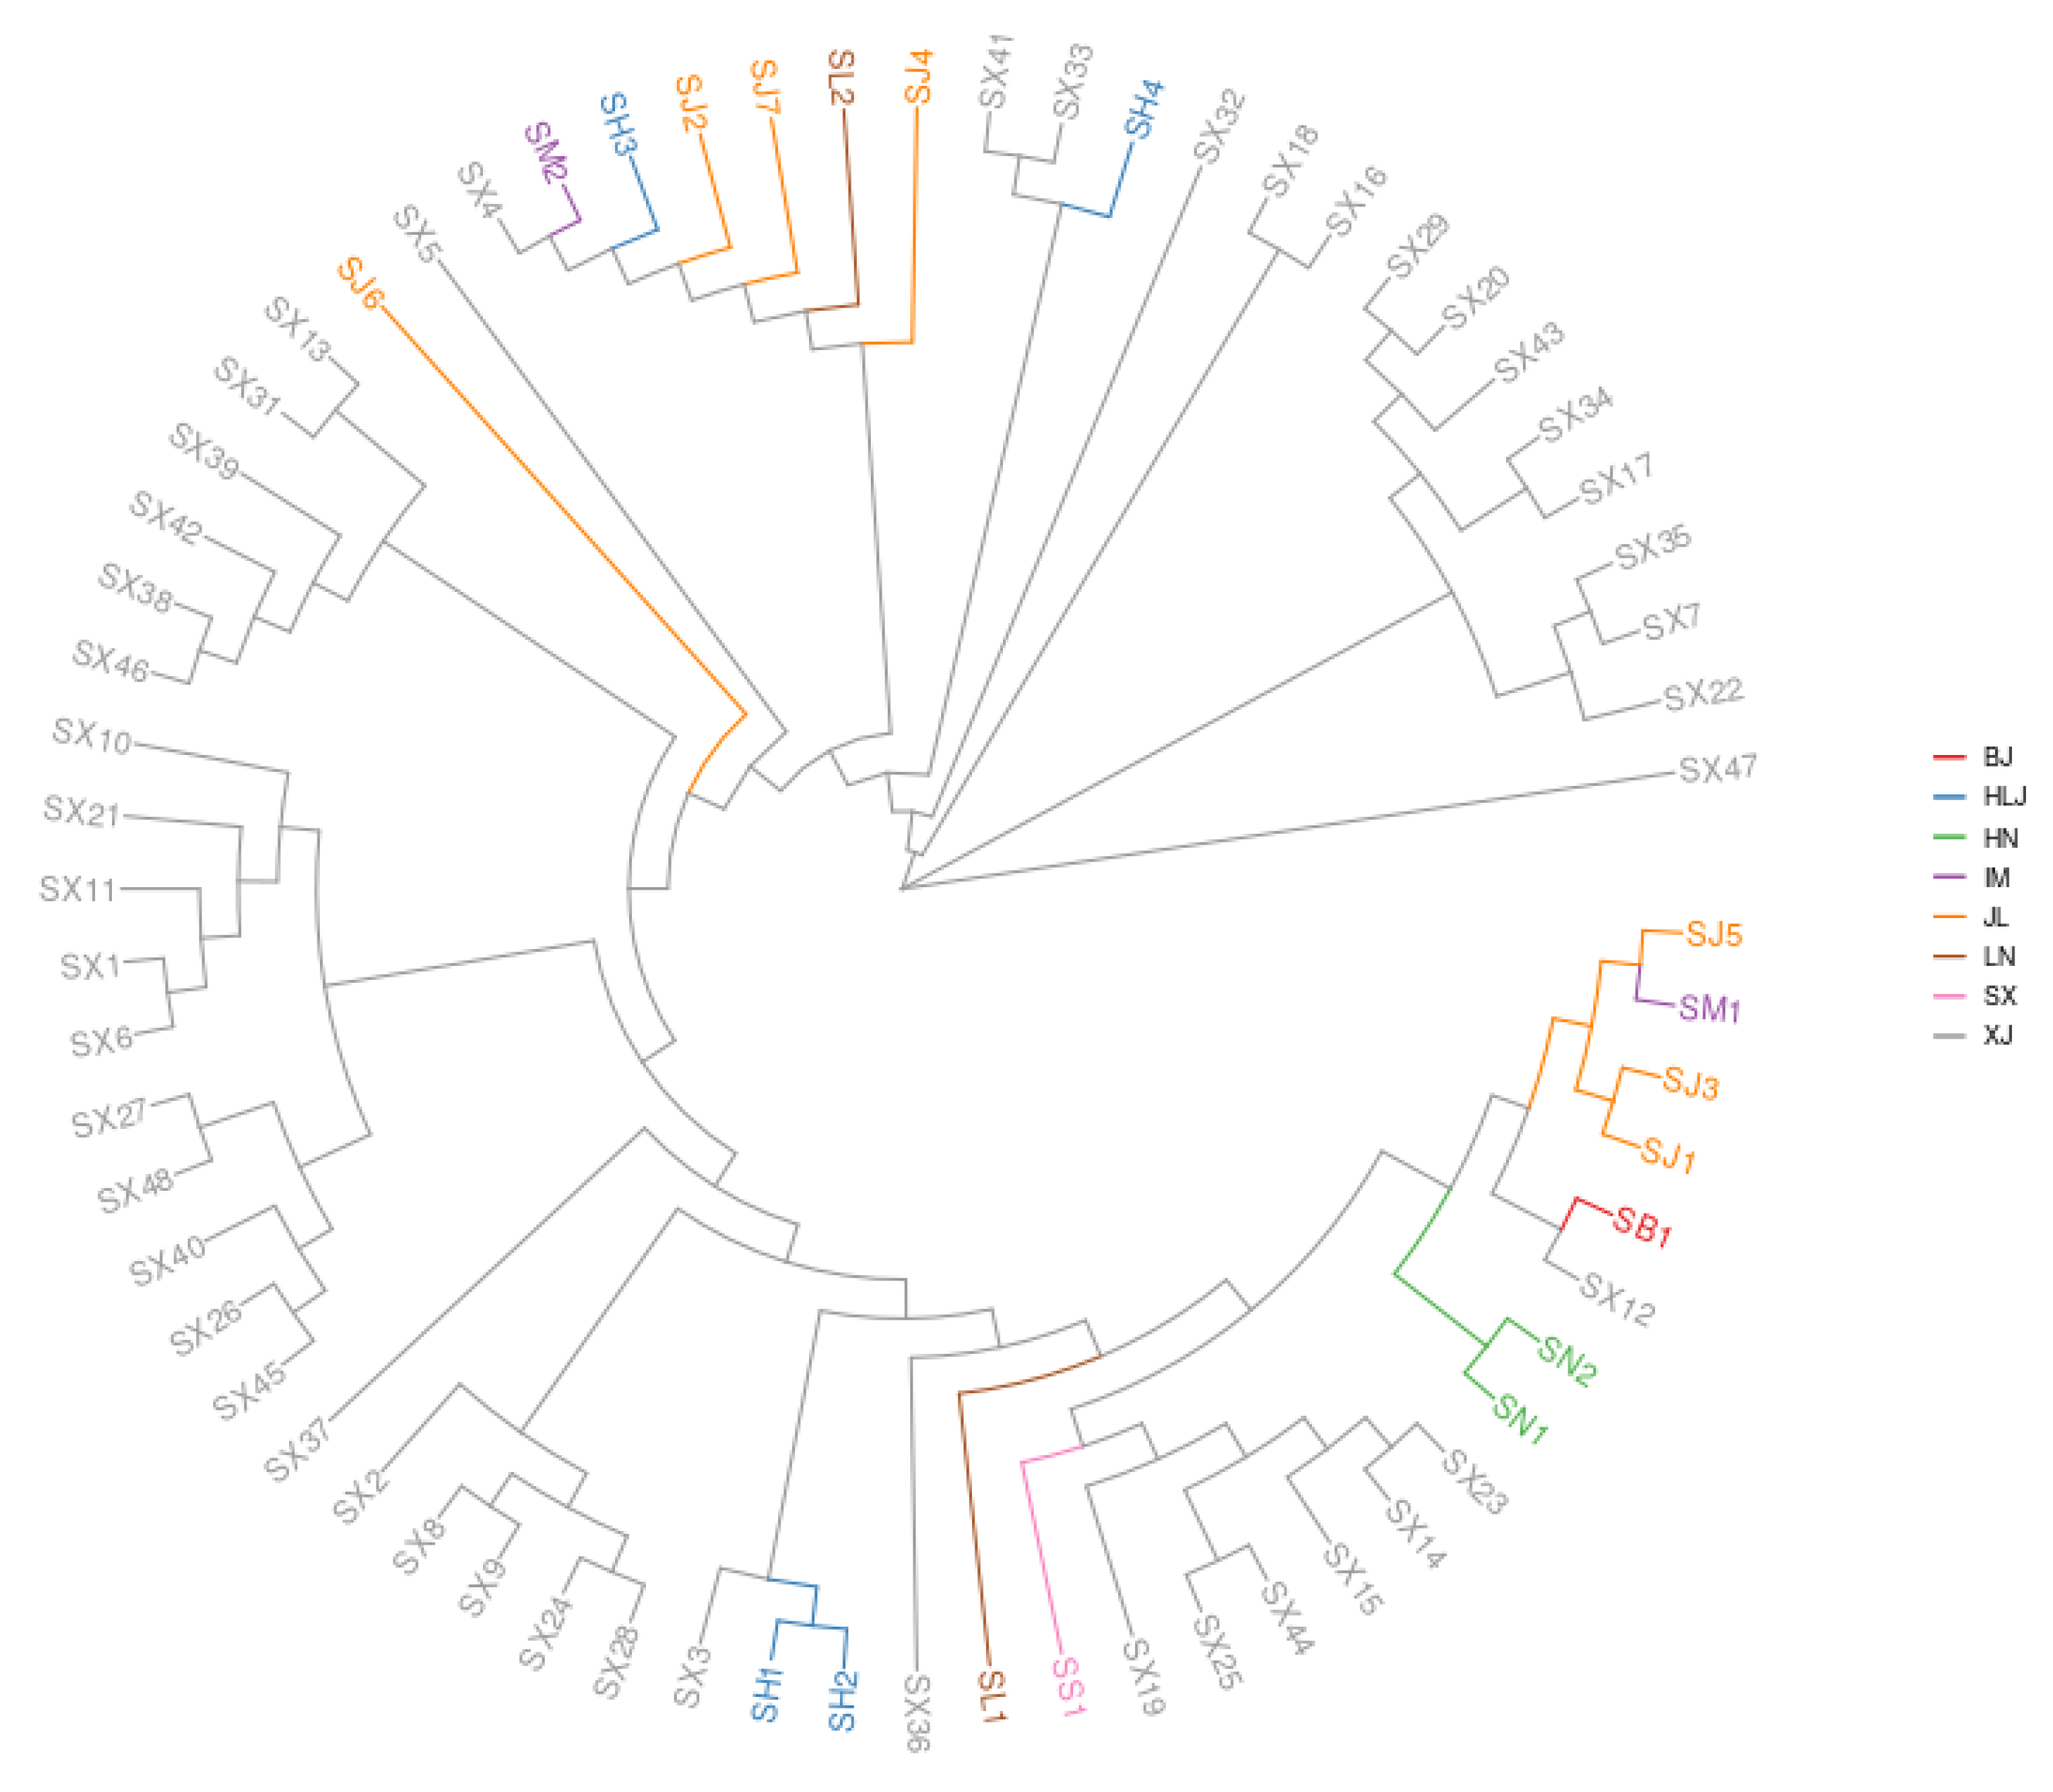
3.1. Phylogenetic Analyses on S. nigrum Populations
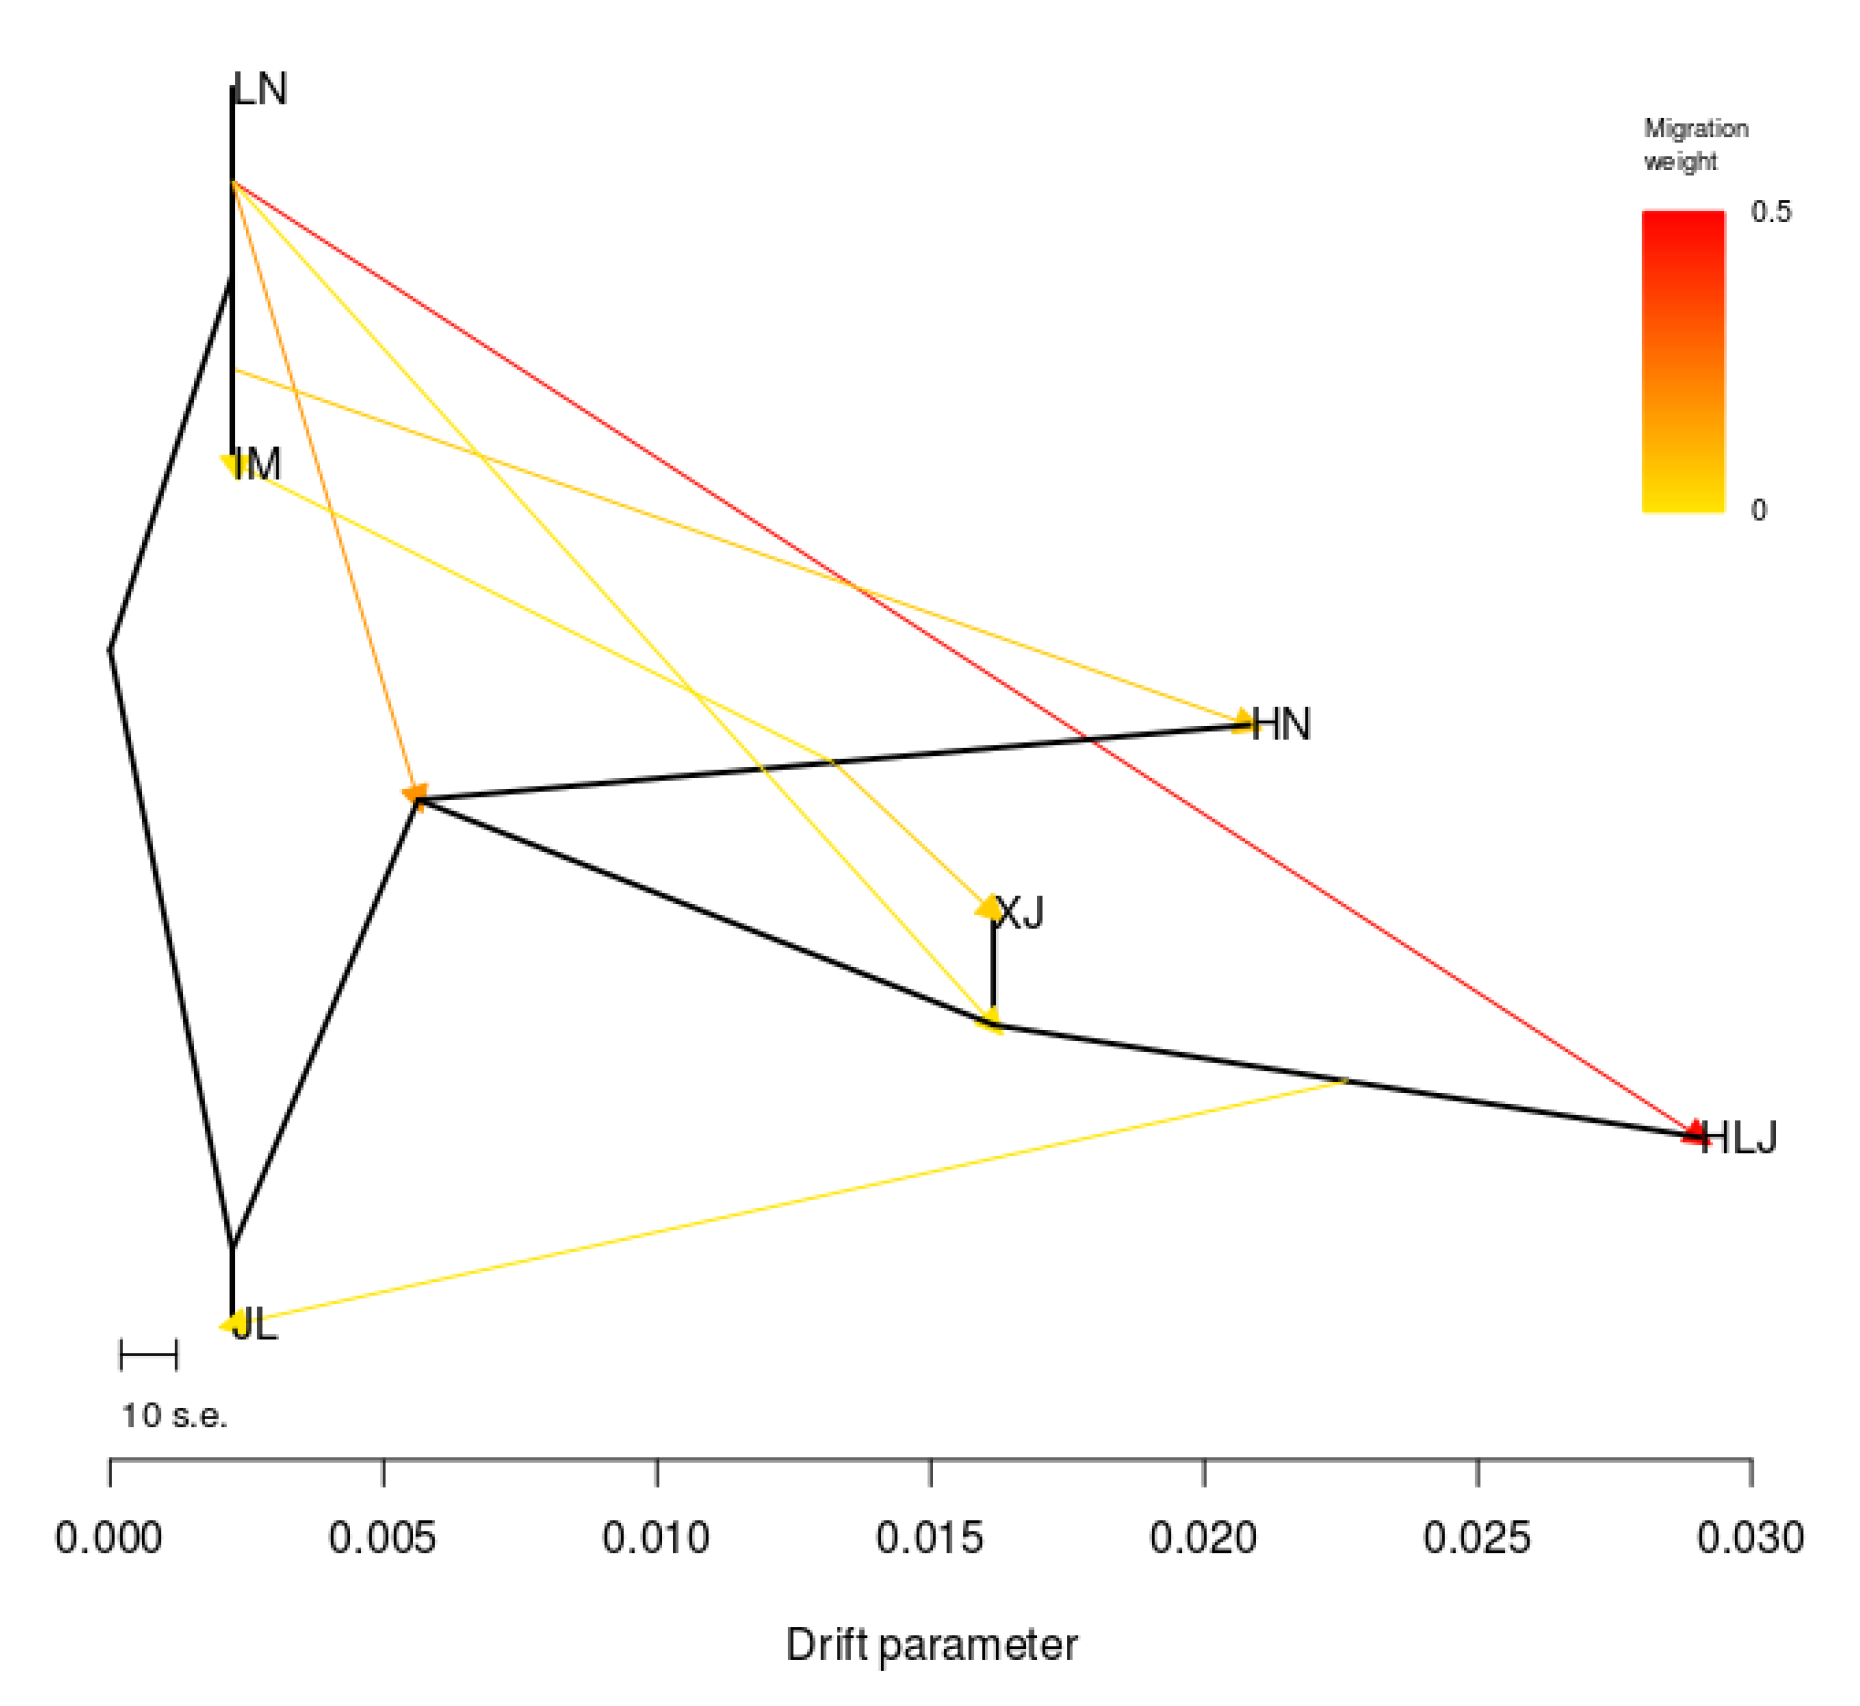
3.2. Genetic Differences and Genetic Distances of S. nigrum
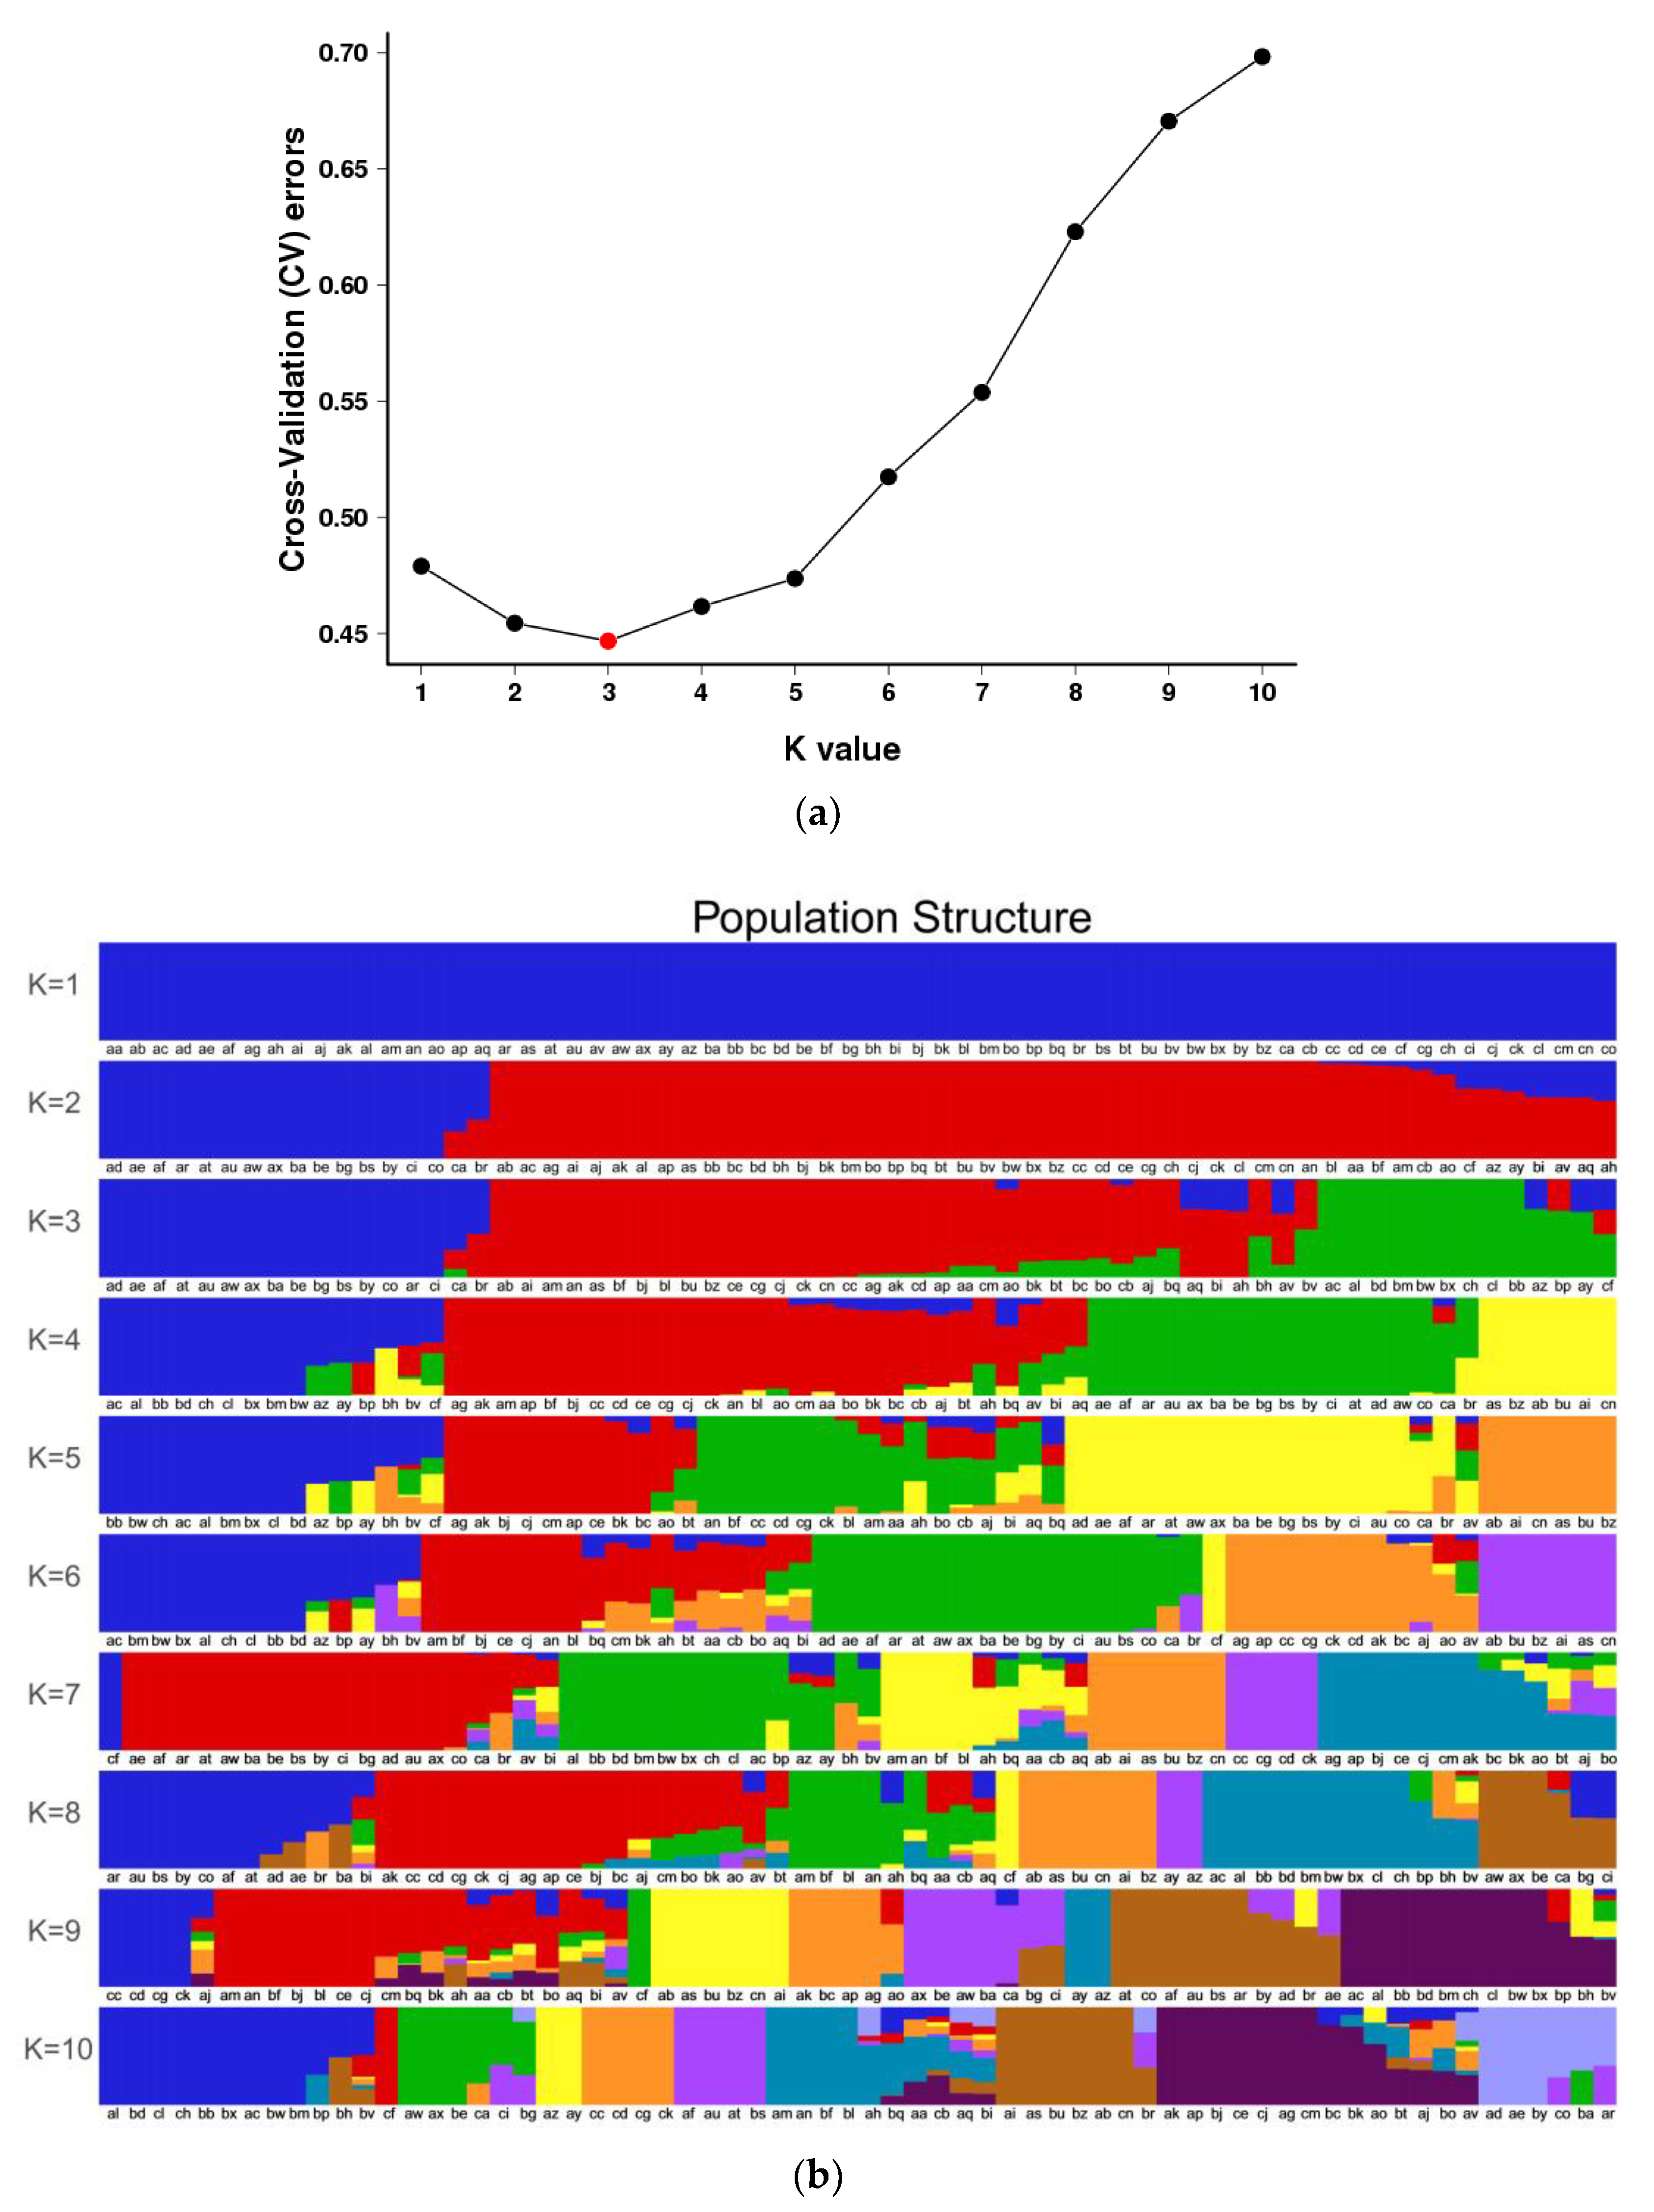
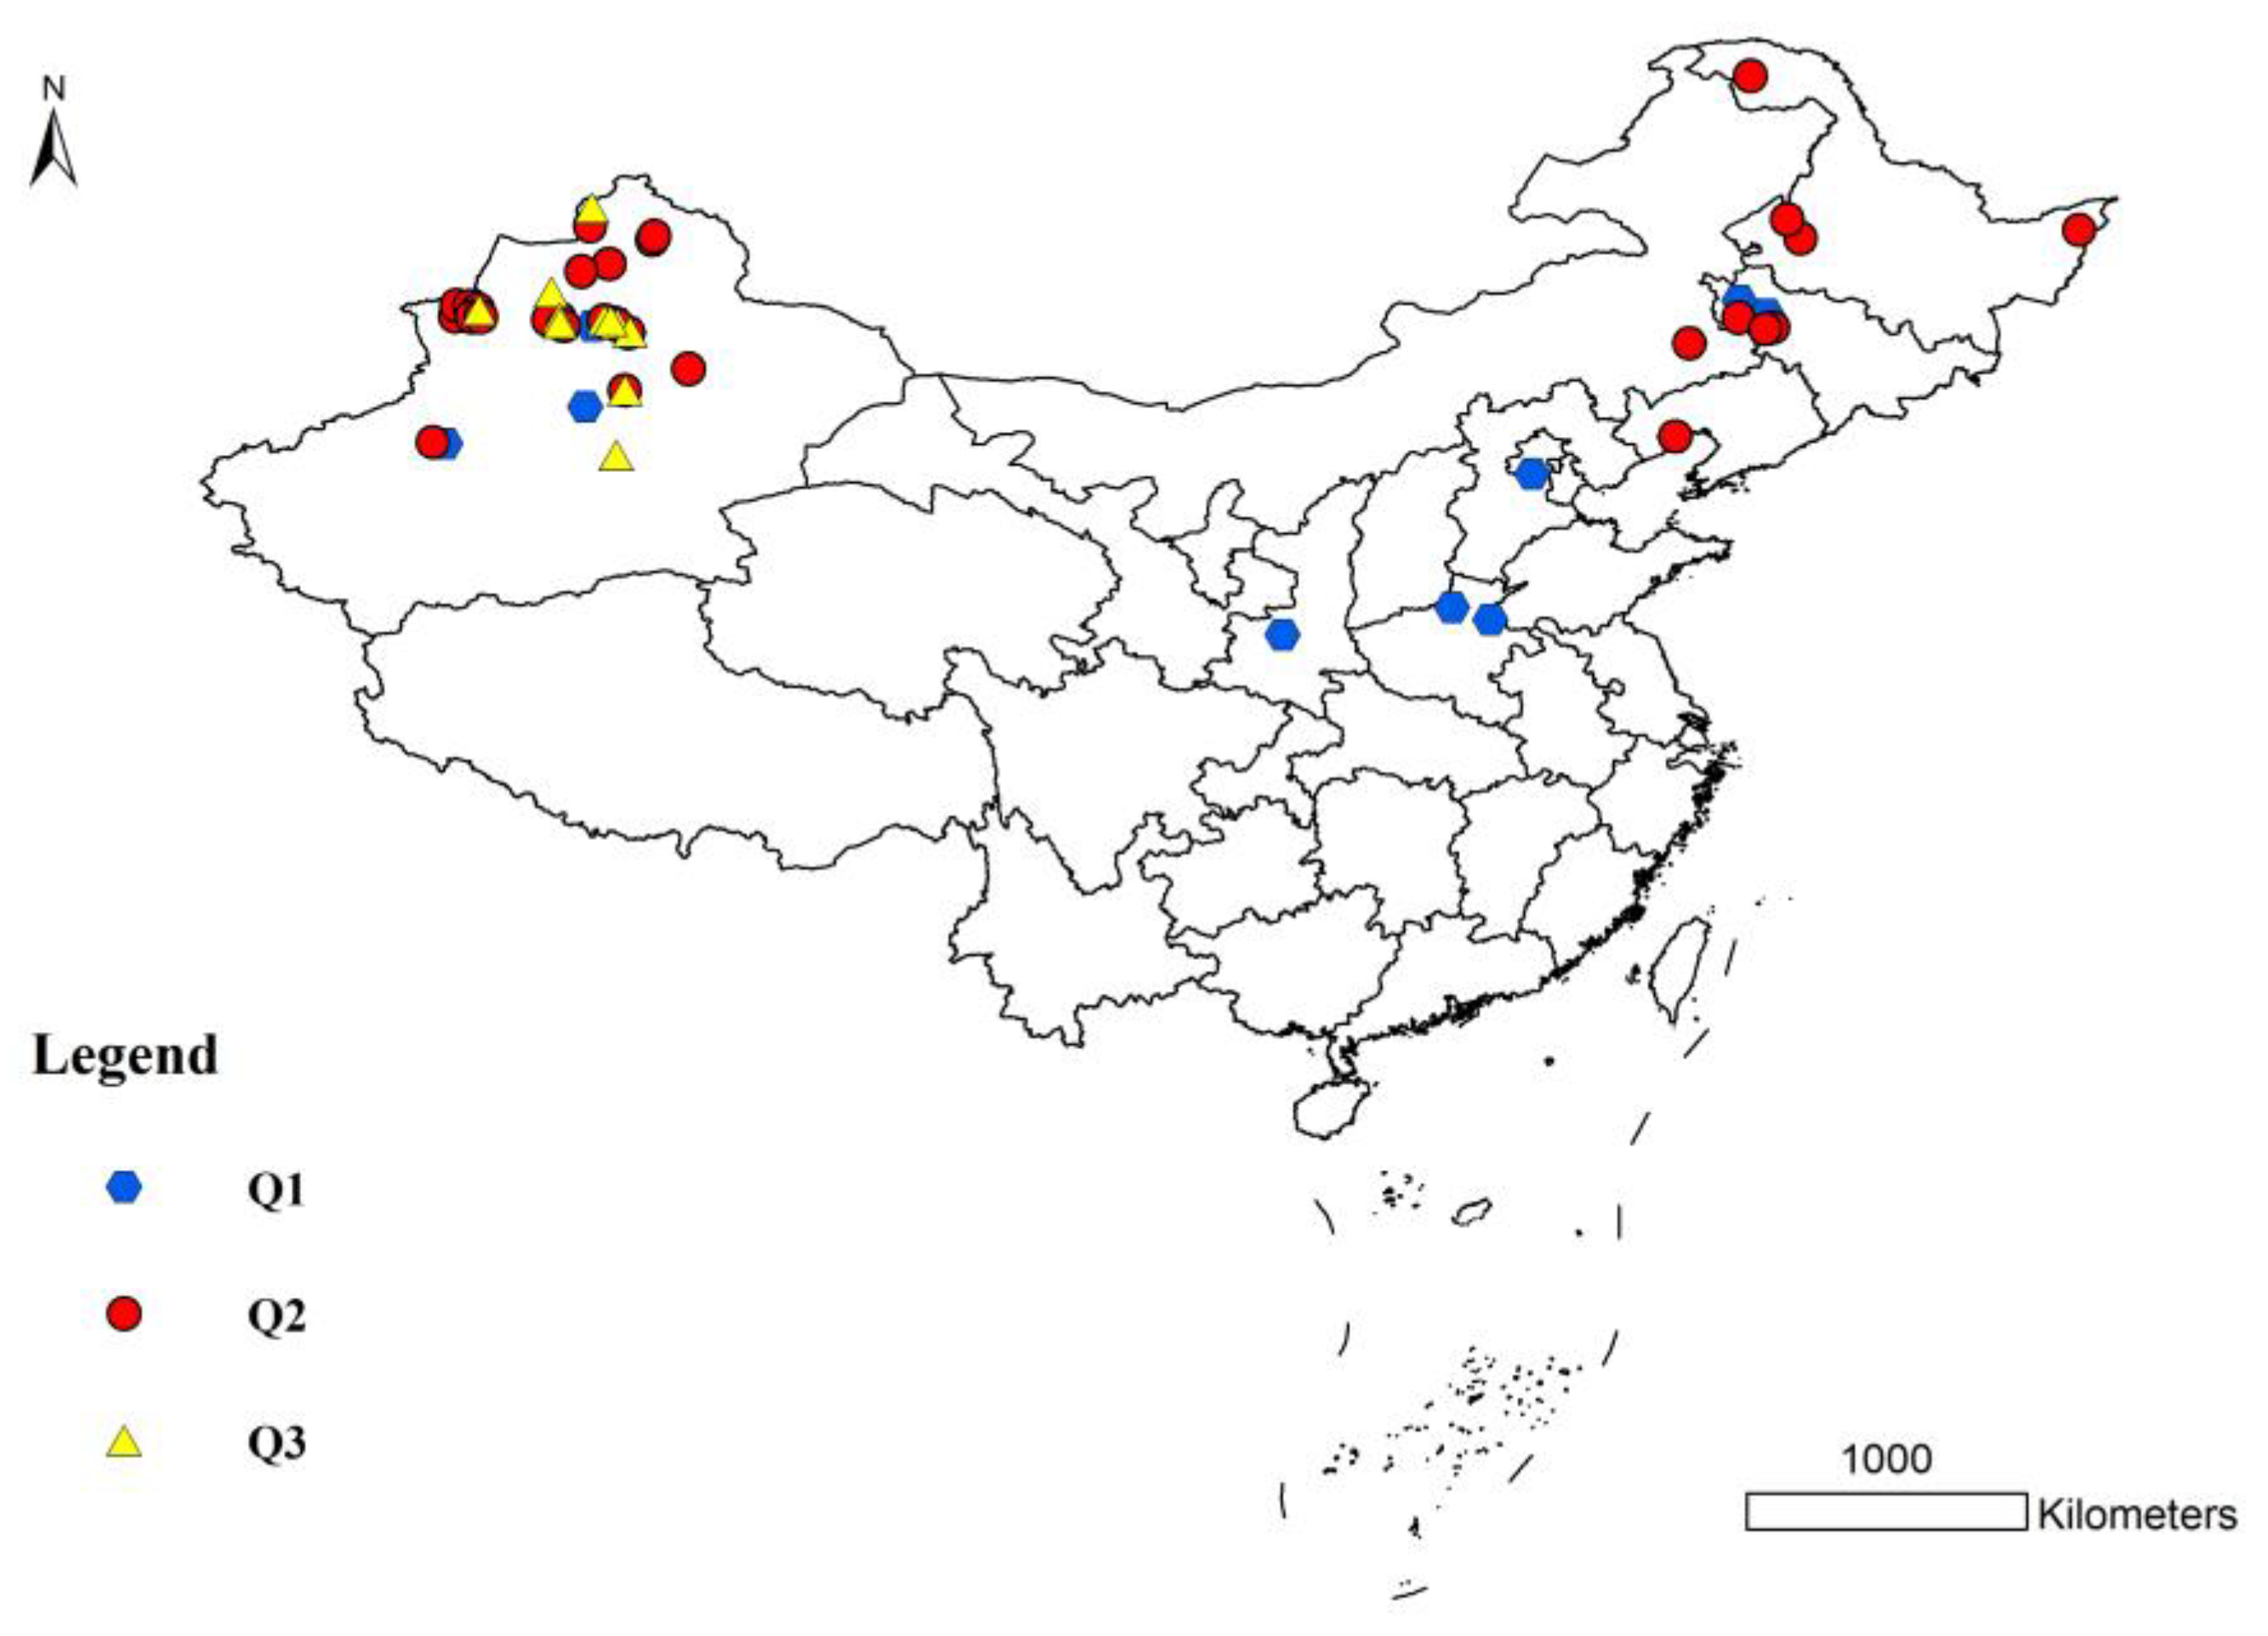
3.3. Population Structure of S. nigrum
4. Discussion
5. Conclusions
Supplementary Materials
Author Contributions
Funding
Data Availability Statement
Conflicts of Interest
References
- Edmonds, J.M.; Chweya, J.A. Solanum nigrum L. and related species. Promoting the conservation and use of underutilized and neglected crops. 15. In Black Nightshades; Heller, J., Engels, J.M.M., Hammer, K., Eds.; Institute of Plant Genetic and Crop Plant Resources, Gatersleben/International Plant Genetic Resources Institute: Rome, Italy, 1997; pp. 9–86. [Google Scholar]
- Wang, Y.H.; Xiang, X.M.; Yi, X.M.; He, X.J. Potential Anti-inflammatory Steroidal Saponins from the Berries of Solanum nigrum L. (European Black Nightshade). J. Agri. Food Chem. 2017, 65, 4262–4272. [Google Scholar] [CrossRef]
- Chhon, S.; Jeon, J.; Kim, J.; Park, S.U. Accumulation of Anthocyanins through overexpression of AtPAP1 in Solanum nigrum Lin. (Black Nightshade). Biomolecules 2020, 10, 277. [Google Scholar] [CrossRef] [Green Version]
- Wei, Y.F.; Zhang, Q.C.; Zha, H.; Wang, X.L.; Wang, J.G. Determination of resistance level and multi-resistance to pendimethalin of weed Solanum nigrum in Xinjiang cotton fields. J. Pestic. Sci. 2022, 59, 1008–7303. [Google Scholar]
- Zou, T.T.; Jin, C.Z.; Zhu, Z.J.; Hu, Y.H. Detection of glyphosate resistance in black nightshade solanum nigrum from Hunan China. Scienceasia 2019, 45, 419–424. [Google Scholar] [CrossRef] [Green Version]
- Huang, H.J.; Zhang, C.X.; Jian, C.L.; Zhang, X.K.; Huang, Z.F.; Wu, W.L.; Wei, S.H. Diversity and community composition of weeds in cotton fields of Northern Xinjiang. J. Weed Sci. 2020, 38, 7–13. [Google Scholar]
- Guo, Y.L.; Huang, C.Y.; Wang, Y.; Huang, Y.J.; Wan, P. Effects of different tillage patterns on Soil weed seedbank in soybean field. J. Anhui Agri. Sci. 2016, 44, 89–93. [Google Scholar]
- Huang, K.; Lin, L.; Liao, M.; Liu, J.; Liang, D.; Xia, H.; Wang, X.; Wang, J.; Deng, H. Effects of intercropping with different Solanum plants on the physiological characteristics and cadmium accumulation of Solanum nigrum. Int. J. Environ. Anal. Chem. 2021, 101, 2835. [Google Scholar] [CrossRef]
- Hammami, H.; Parsa, M.; Mijani, S. Weed ability to phytoremediate cadmium-contaminated soil. Int. J. Phytoremediat. 2016, 18, 48–53. [Google Scholar] [CrossRef]
- Lewthwaite, S.L.; Triggs, C.M. Identification of paraquat-resistant Solanum nigrum and S. americanum biotypes. In Proceedings of the New Zealand Plant Protection Society’s Annual Conference, Otago Museum Conference Centre, Dunedin, New Zealand, 11–13 August 2009; Zydenbos, S.M., Ed.; New Zealand Plant Protection Society: Hastings, New Zealand, 2009; pp. 349–355. [Google Scholar]
- Itoh, K.; Ito, K. Weed ecology and its control in south-east tropical countries. Jpn. J. Trop. Agric. 1994, 38, 369–373. [Google Scholar]
- De Donato, M.; Mozzetti, C.; Perucco, E. Evaluation of atrazine resistance in protoplast regenerants of Solanum nigrum L. Acta Hortic. 1990, 280, 263–269. [Google Scholar] [CrossRef]
- De Prado, R.; Dominguez, C.; Tena, M. Triazine resistance in biotypes of Solanum nigrum and four Amaranthus species found in Spain. Weed Res. 1993, 33, 17–24. [Google Scholar] [CrossRef]
- Dehmer, K.J. Conclusions on the taxonomy of the Solanum nigrum complex by molecular analyses of IPK germplasm accessions. In Proceedings of the Vth International Solanaceae Conference, Nijmegen, The Netherlands, 23–29 July 2001; Berg, R.G., Barendse, G.W.M., Weerden, G.M., Mariani, C., Solanaceae, V., Eds.; Nijmegen University Press: Nijmegen, The Netherlands, 2001; pp. 85–96. [Google Scholar]
- Dehmer, K.J.; Hammer, K. Taxonomic status and geographic provenance of germplasm accessions in the Solanum nigrum L complex: AFLP data. Genet. Resour. Crop Ev. 2004, 51, 551–558. [Google Scholar] [CrossRef]
- Manoko, M.L.K.; Berg, R.G.V.D.; Feron, R.M.C.; Weerden, G.M.; Mariani, C. Genetic diversity of the African hexaploid species of Solanum scabrum Mill. and Solanum nigrum L. (Solanaceae). Genet. Res. Crop Ev. 2008, 55, 409–418. [Google Scholar] [CrossRef] [Green Version]
- Poczai, P.; Cerna’k, I.; Varga, I.; Hyvo¨nen, J. Nuclear intron-targeting markers in genetic diversity analysis of black nightshade (Solanum sect. Solanum, Solanaceae) accessions. Genet. Resour. Crop Ev. 2014, 61, 247–266. [Google Scholar] [CrossRef] [Green Version]
- Dekker, J. Weed diversity and weed management. Weed Sci. 1997, 45, 357–363. [Google Scholar] [CrossRef]
- Fontana, L.C.; Agostinetto, D.; Langaro, A.C.; Arge, L.W.P.; Franco, J.J.; Bianchi, V.J. Genetic diversity among crabgrass weed ecotypes (Digitria spp.) occurring in field crops in Rio Grande do Sul, Brazil. Aust. J. Crop Sci. 2015, 9, 931–939. [Google Scholar]
- Hosseini, M.; Yassaie, M.; Rashed-Mohassel, M.H.; Ghorbani, R.; Niazi, A. Genetic diversity of Iranian wild barley (Hordeum spontaneum Koch.) populations. J. Crop Sci. Biotech. 2022, 25, 301–311. [Google Scholar] [CrossRef]
- Govindaraj, M.; Vetriventhan, M.; Srinivasan, M. Importance of genetic diversity assessment in crop plants and its recent advances: An overview of its analytical perspectives. Genet. Res. Int. 2015, 2015, 431487. [Google Scholar] [CrossRef] [Green Version]
- Fischer, M.C.; Rellstab, C.; Leuzinger, M.; Roumet, M.; Gugerli, F.; Shimizu, K.K.; Holderegger, R.; Widmer, A. Estimating genomic diversity and population differentiation-an empirical comparison of microsatellite and SNP variation in Arabidopsis halleri. BMC Genom. 2017, 18, 69. [Google Scholar] [CrossRef] [Green Version]
- Sartie, A.; Asiedu, R.; Franco, J. Genetic and phenotypic diversity in a germplasm working collection of cultivated tropical yams (Dioscorea spp.). Genet. Resour. Crop Evol. 2012, 59, 1753–1765. [Google Scholar] [CrossRef]
- Cooper, J.S.; Rice, B.R.; Shenstone, E.M.; Lipka, A.E.; Jamann, T.M. Genome-wide analysis and prediction of resistance to goss’s wilt in maize. Plant Genome 2019, 12, 1–10. [Google Scholar] [CrossRef] [PubMed] [Green Version]
- Chen, S.Q.; Huang, Z.F.; Dai, Y.; Qin, S.W.; Gao, Y.Y.; Zhang, L.L. The development of 7E chromosome-specific molecular markers for Thinopyrum elongatum based on Slaf-seq technology. PLoS ONE 2013, 8, 65122. [Google Scholar] [CrossRef] [PubMed]
- Huang, S.; Ding, J.; Deng, D.; Tang, W.; Sun, H.; Liu, D.; Zhang, L.; Niu, X.; Zhang, X.; Meng, M.; et al. Draft genome of the kiwifruit Actinidia chinensis. Nat. Commun. 2013, 4, 2640. [Google Scholar] [CrossRef] [Green Version]
- Chen, W.; Yao, J.; Chu, L.; Li, Y.; Guo, X.; Zhang, Y. The development of specific SNP markers for chromosome 14 in cotton using next-generation sequencing. Plant Breed. 2014, 133, 256–261. [Google Scholar] [CrossRef]
- Zheng, W.; Li, Z.; Zhao, J.; Zhang, Y.; Wang, C.; Lu, X.; Sun, F. Study of the long-distancemigration of small brown planthoppers Laodelphax striatellus in China using next-generation sequencing. Pest Manag. Sci. 2016, 72, 298–305. [Google Scholar] [CrossRef]
- Sun, J.; Ma, D.; Tang, L.; Zhao, M.; Zhang, G.; Wang, W.; Song, J.; Li, X.; Liu, Z.; Zhang, W.; et al. Population genomic analysis and de novo assembly reveal the origin of weedy rice as an evolutionary game. Mol. Plant 2019, 12, 632–647. [Google Scholar] [CrossRef] [Green Version]
- Sun, X.; Liu, D.; Zhang, X.; Li, W.; Liu, H.; Hong, W.; Jiang, C.; Guan, N.; Ma, C.; Zeng, H.; et al. SLAF-seq: An ecient method of large-scale de novo SNP discovery and genotyping using high-throughput sequencing. PLoS ONE 2013, 8, e58700. [Google Scholar] [CrossRef] [Green Version]
- McKenna, A.; Hanna, M.; Banks, E.; Sivachenko, A.; Cibulskis, K.; Kernytsky, A.; Garimella, K.; Altshuler, D.; Gabriel, S.; Daly, M.; et al. The Genome Analysis Toolkit: A MapReduce framework for analyzing next-generation DNA sequencing data. Genome Res. 2010, 20, 1297–1303. [Google Scholar] [CrossRef] [Green Version]
- Li, H.; Handsaker, B.; Wysoker, A.; Fennell, T.; Ruan, J.; Homer, N.; Marth, G.; Abecasis, G.; Durbin, G. 1000 Genome project data processing subgroup. The sequence alignment/map format and SAMtools. Bioinformatics 2010, 25, 2078–2079. [Google Scholar] [CrossRef] [Green Version]
- Meirmans, P.G.; Van Tienderen, P.H. genotype and genodive: Two programs for the analysis of genetic diversity of asexual organisms. Mol. Ecol. Notes 2004, 4, 792–794. [Google Scholar] [CrossRef]
- Kimura, M. A simple method for estimating evolutionary rate of base substitutions through comparative studies of nucleotide sequences. J. Mol. Evol. 1980, 16, 111–120. [Google Scholar] [CrossRef]
- Kumar, S.; Stecher, G.; Li, M.; Knyaz, C.; Tamura, K. MEGA X: Molecular Evolutionary Genetics Analysis across computing platforms. Mol. Biol. Evol. 2018, 35, 1547–1549. [Google Scholar] [CrossRef]
- Saitou, N.; Nei, M. The neighbor-joining method: A new method for reconstructing phylogenetic trees. Mol. Biol. Evol. 1987, 4, 406–425. [Google Scholar] [PubMed]
- Kobert, K.; Stamatakis, A.; Flouri, T. Efficient detection of repeating sites to accelerate phylogenetic likelihood calculations. Syst. Biol. 2016, 66, 205–217. [Google Scholar] [CrossRef] [PubMed] [Green Version]
- Alexander, D.H.; Novembre, J.; Lange, K. Fast model-based estimation of ancestry in unrelated individuals. Genome Res. 2009, 19, 1655–1664. [Google Scholar] [CrossRef] [PubMed] [Green Version]
- Alexander, D.H.; Lange, K. Enhancements to the ADMIXTURE algorithm for individual ancestry estimation. BMC Bioinform. 2011, 12, 246. [Google Scholar] [CrossRef] [Green Version]
- Pickrell, J.K.; Pritchard, J.K. Inference of population splits and mixtures from genome-wide allele frequency data. PLoS Genet. 2012, 8, e1002967. [Google Scholar] [CrossRef] [Green Version]
- Hubisz, M.J.; Falush, D.; Stephens, M.; Pritchard, J.K. Inferring weak population structure with the assistance of sample group information. Mol. Ecol. Resour. 2009, 9, 1322–1332. [Google Scholar] [CrossRef] [PubMed] [Green Version]
- Adahl, E.; Lundberg, P.; Jonzan, N. From climate change to population change: The need to consider annual life cycles. Glob. Change Biol. 2006, 12, 1627–1633. [Google Scholar] [CrossRef]
- Mangolin, C.A.; Junior, R.S.O.; Machado, M.F.P.S. Genetic diversity in weed. In Herbicides—Environmental Impact Studies and Management Approaches; Alvarez-Fernandez, R., Ed.; In Tech: Rijeka, Croatia, 2012; pp. 223–248. [Google Scholar]
- Gamal, A.E.; Husain, M.A.; Abdelfattah, B. Biodiversity of some Solanum species from southwestern Saudi Arabia’s highlands. Bot. Lett. 2021, 168, 246–255. [Google Scholar]
- Kočiš Tubić, N.; Djan, M.; Veličković, N.; Anačkov, G.; Obreht, D. Microsatellite DNA variation within and among invasive populations of Ambrosia artemisiifolia from the southern Pannonian Plain. Weed Res. 2015, 55, 268–277. [Google Scholar] [CrossRef]
- Wards. Genetic analysis of invasive plant populations at different spatial scales. Biol. Invasions 2006, 8, 541–552. [Google Scholar] [CrossRef]
- Comes, H.P.; Kadereit, J.W. The effect of quaternary climatic changes on plant distribution and evolution. Trends Plant Sci. 1998, 3, 432–438. [Google Scholar] [CrossRef]


| ID | Biogeographic Regions | Longitude | Latitude | ID | Biogeographic Regions | Longitude | Latitude |
|---|---|---|---|---|---|---|---|
| SB1 | Beijing | 116°16′45″ | 39°33′16″ | SX15 | Xinjiang | 85°63′07″ | 44°19′31″ |
| SH1 | Heilongjiang | 122°77′19″ | 52°22′92″ | SX16 | Xinjiang | 86°50′25″ | 44°23′50″ |
| SH2 | Heilongjiang | 133°52′53″ | 47°24′19″ | SX17 | Xinjiang | 84°58′38″ | 44°34′17″ |
| SH3 | Heilongjiang | 124°54′42″ | 47°08′55″ | SX18 | Xinjiang | 86°50′25″ | 44°23′50″ |
| SH4 | Heilongjiang | 124°28′01″ | 47°45′39″ | SX19 | Xinjiang | 85°0′12″ | 44°27′45″ |
| SJ1 | Jilin | 123°43′53″ | 44°10′83″ | SX20 | Xinjiang | 86°37′30″ | 44°28′59″ |
| SJ2 | Jilin | 124°1′57″ | 44°17′20″ | SX21 | Xinjiang | 81°40′59″ | 45°0′14″ |
| SJ3 | Jilin | 122° 55′82″ | 45°07′49″ | SX22 | Xinjiang | 86°24′17″ | 44°30′58″ |
| SJ4 | Jilin | 122°54′14″ | 44°36′12″ | SX23 | Xinjiang | 85°1′36″ | 44°31′37 |
| SJ5 | Jilin | 123°55′52″ | 44°17′31″ | SX24 | Xinjiang | 80°54′50″ | 40°34′57″ |
| SJ6 | Jilin | 123°46′35″ | 44°13′60″ | SX25 | Xinjiang | 81°18′6″ | 40°32′37″ |
| SJ7 | Jilin | 123°48′56″ | 44°41′54″ | SX26 | Xinjiang | 89°08′31″ | 42°57′14″ |
| SL1 | Liaoning | 120°50′50″ | 40°44′18″ | SX27 | Xinjiang | 86°33′85″ | 46°19′43″ |
| SL2 | Liaoning | 120°52′35″ | 40°46′51″ | SX28 | Xinjiang | 85°42′23″ | 46°05′11″ |
| SM1 | Inner Mongolia | 121°19′52″ | 43°45′52″ | SX29 | Xinjiang | 84°43′12″ | 45°25′26″ |
| SM2 | Inner Mongolia | 121°19′52″ | 43°45′52″ | SX31 | Xinjiang | 84°37′17″ | 44°32′21″ |
| SN1 | Henan | 113°41′44″ | 35°15′32″ | SX32 | Xinjiang | 84°58′38″ | 44°34′17 |
| SN2 | Henan | 114°55′22″ | 34°51′59″ | SX33 | Xinjiang | 82°06′20″ | 44°58′02″ |
| SS1 | Shaanxi | 108°13′57″ | 34°23′38″ | SX34 | Xinjiang | 85°36′49″ | 48°08′38″ |
| SX02 | Xinjiang | 81°32′6″ | 45°5′12″ | SX35 | Xinjiang | 84°59′56″ | 44°25′45″ |
| SX03 | Xinjiang | 86°24′17″ | 44°30′58″ | SX36 | Xinjiang | 86°37′30″ | 44°28′59″ |
| SX04 | Xinjiang | 82°20′33″ | 44°51′60″ | SX37 | Xinjiang | 85°51′54″ | 47°32′53″ |
| SX05 | Xinjiang | 86°51′46″ | 44°20′28″ | SX38 | Xinjiang | 88°01′57″ | 47°14′16″ |
| SX06 | Xinjiang | 82°24′30″ | 44°49′48″ | SX39 | Xinjiang | 87°58′31″ | 47°18′39″ |
| SX07 | Xinjiang | 86°37′30″ | 44°28′59″ | SX40 | Xinjiang | 87°12′18″ | 44°07′12″ |
| SX08 | Xinjiang | 82°10′35″ | 44°37′59″ | SX41 | Xinjiang | 87°04′44″ | 42°15′58″ |
| SX09 | Xinjiang | 82°27′7″ | 44°37′51″ | SX42 | Xinjiang | 88°1′52 “ | 47°14′16 “ |
| SX01 | Xinjiang | 82°5′43″ | 44°39′25″ | SX43 | Xinjiang | 86°48′07″ | 40°10′06″ |
| SX10 | Xinjiang | 82°6′22″ | 44°53′2″ | SX44 | Xinjiang | 87°12′18″ | 44°07′12″ |
| SX11 | Xinjiang | 82°8′60″ | 44°39′1″ | SX45 | Xinjiang | 87°04′44″ | 42°15′58″ |
| SX12 | Xinjiang | 85°48′55″ | 41°43′36″ | SX46 | Xinjiang | 88°01′57″ | 47°14′16″ |
| SX13 | Xinjiang | 84°58′38″ | 44°34′17″ | SX47 | Xinjiang | 87°15′06″ | 44°08′31″ |
| SX14 | Xinjiang | 86°50′25″ | 44°23′50″ | SX48 | Xinjiang | 85°06′37″ | 44°19′03″ |
| ID | Total Reads | GC Percentage (%) | Q30 Percentage (%) | ID | Total Reads | GC Percentage (%) | Q30 Percentage (%) |
|---|---|---|---|---|---|---|---|
| SB1 | 1,691,734 | 42.73 | 93.84 | SX15 | 1,650,570 | 43.41 | 94.14 |
| SH1 | 1,807,444 | 42.05 | 94.47 | SX16 | 1,519,690 | 43.44 | 94.39 |
| SH2 | 1,902,574 | 42.80 | 94.42 | SX17 | 1,737,036 | 42.87 | 93.68 |
| SH3 | 1,823,795 | 43.30 | 94.01 | SX18 | 2,002,105 | 43.27 | 94.15 |
| SH4 | 1,716,365 | 43.0 | 93.65 | SX19 | 1,736,208 | 43.40 | 94.31 |
| SJ1 | 2,662,305 | 42.15 | 94.57 | SX20 | 1,681,088 | 43.44 | 94.47 |
| SJ2 | 1,494,444 | 42.98 | 94.02 | SX21 | 1,622,367 | 43.09 | 94.48 |
| SJ3 | 1,735,455 | 43.30 | 94.68 | SX22 | 1,598,613 | 43.41 | 94.58 |
| SJ4 | 3,858,231 | 42.72 | 94.36 | SX23 | 1,534,640 | 43.47 | 94.78 |
| SJ5 | 1,643,277 | 43.10 | 93.62 | SX24 | 1,941,331 | 43.02 | 94.58 |
| SJ6 | 2,131,241 | 43.27 | 94.01 | SX25 | 2,100,514 | 42.83 | 94.29 |
| SJ7 | 1,588,142 | 42.71 | 93.70 | SX26 | 1,716,587 | 42.76 | 94.53 |
| SL1 | 1,883,192 | 43.04 | 94.02 | SX27 | 1,896,964 | 43.15 | 93.89 |
| SL2 | 1,616,090 | 43.44 | 94.53 | SX28 | 2,049,341 | 43.24 | 94.14 |
| SM1 | 1,657,653 | 42.95 | 94.42 | SX29 | 1,799,983 | 43.29 | 93.80 |
| SM2 | 2,166,560 | 42.33 | 93.63 | SX31 | 1,812,148 | 42.8 | 93.90 |
| SN1 | 2,109,751 | 42.85 | 93.91 | SX32 | 1,838,587 | 42.82 | 93.44 |
| SN2 | 1,676,914 | 43.00 | 94.43 | SX33 | 1,753,477 | 43.08 | 94.06 |
| SS1 | 1,620,348 | 42.88 | 94.09 | SX34 | 1,769,883 | 43.0 | 94.23 |
| SX01 | 2,450,367 | 41.97 | 94.76 | SX35 | 1,712,473 | 43.29 | 94.27 |
| SX02 | 1,723,640 | 42.68 | 93.92 | SX36 | 1,522,925 | 42.49 | 93.27 |
| SX03 | 2,213,391 | 41.92 | 94.75 | SX37 | 1,731,599 | 42.72 | 93.57 |
| SX04 | 1,973,084 | 42.03 | 94.79 | SX38 | 1,711,985 | 42.73 | 93.68 |
| SX05 | 1,958,204 | 42.30 | 94.77 | SX39 | 1,789,567 | 42.51 | 93.37 |
| SX06 | 2,121,610 | 42.05 | 94.63 | SX40 | 1,442,651 | 42.36 | 93.34 |
| SX07 | 2,053,106 | 42.13 | 94.73 | SX41 | 1,563,989 | 42.78 | 93.21 |
| SX08 | 2,393,941 | 41.88 | 94.58 | SX42 | 1,527,690 | 42.56 | 93.11 |
| SX09 | 2,205,426 | 42.09 | 94.63 | SX43 | 1,741,900 | 42.61 | 93.55 |
| SX10 | 2,023,837 | 42.51 | 94.57 | SX44 | 1,974,449 | 42.57 | 93.60 |
| SX11 | 2,404,368 | 42.03 | 94.49 | SX45 | 1,895,990 | 42.50 | 93.53 |
| SX12 | 1,750,841 | 42.12 | 94.55 | SX46 | 1,606,552 | 42.57 | 93.42 |
| SX13 | 1,863,520 | 42.87 | 94.41 | SX47 | 1,823,353 | 42.65 | 93.87 |
| SX14 | 1,451,126 | 43.35 | 94.15 | SX48 | 1,546,745 | 42.65 | 93.81 |
| ID | SLAF Number | Total Depth | Average Depth | ID | SLAF Number | Total Depth | Average Depth |
|---|---|---|---|---|---|---|---|
| SB1 | 143,008 | 1,397,095 | 9.77 | SX15 | 143,551 | 1,201,101 | 8.37 |
| SH1 | 139,623 | 1,558,808 | 11.16 | SX16 | 142,910 | 1,182,897 | 8.28 |
| SH2 | 150,756 | 1,514,661 | 10.05 | SX17 | 135,530 | 1,473,942 | 10.88 |
| SH3 | 148,052 | 1,447,856 | 9.78 | SX18 | 151,906 | 1,592,422 | 10.48 |
| SH4 | 144,849 | 1,383,746 | 9.55 | SX19 | 143,270 | 1,344,168 | 9.38 |
| SJ1 | 143,453 | 2,354,446 | 16.41 | SX20 | 144,038 | 1,352,983 | 9.39 |
| SJ2 | 139,706 | 1,221,842 | 8.75 | SX21 | 144,141 | 1,298,644 | 9.01 |
| SJ3 | 148,056 | 1,347,424 | 9.10 | SX22 | 145,000 | 1,224,795 | 8.45 |
| SJ4 | 171,626 | 3,081,308 | 17.95 | SX23 | 142,066 | 1,189,055 | 8.37 |
| SJ5 | 146,279 | 1,274,606 | 8.71 | SX24 | 150,371 | 1,563,158 | 10.40 |
| SJ6 | 153,773 | 1,702,217 | 11.07 | SX25 | 153,599 | 1,678,791 | 10.93 |
| SJ7 | 139,864 | 1,326,283 | 9.48 | SX26 | 148,364 | 1,362,955 | 9.19 |
| SL1 | 150,344 | 1,497,548 | 9.96 | SX27 | 151,134 | 1,479,202 | 9.79 |
| SL2 | 142,746 | 1,290,494 | 9.04 | SX28 | 152,221 | 1,635,532 | 10.74 |
| SM1 | 144,398 | 1,334,945 | 9.24 | SX29 | 145,849 | 1,442,431 | 9.89 |
| SM2 | 139,926 | 1,877,997 | 13.42 | SX31 | 146,580 | 1,511,018 | 10.31 |
| SN1 | 142,636 | 1,782,163 | 12.49 | SX32 | 147,503 | 1,509,826 | 10.24 |
| SN2 | 146,239 | 1,327,197 | 9.08 | SX33 | 148,484 | 1,394,929 | 9.39 |
| SS1 | 134,045 | 1,351,964 | 10.09 | SX34 | 147,378 | 1,434,272 | 9.73 |
| SX01 | 145,563 | 2,152,103 | 14.78 | SX35 | 146,085 | 1,356,216 | 9.28 |
| SX02 | 136,493 | 1,474,738 | 10.80 | SX36 | 139,212 | 1,215,151 | 8.73 |
| SX03 | 140,107 | 1,955,306 | 13.96 | SX37 | 141,906 | 1,452,165 | 10.23 |
| SX04 | 137,242 | 1,734,153 | 12.64 | SX38 | 142,509 | 1,418,841 | 9.96 |
| SX05 | 142,744 | 1,662,479 | 11.65 | SX39 | 144,886 | 1,457,086 | 10.06 |
| SX06 | 141,570 | 1,858,567 | 13.13 | SX40 | 135,976 | 1,186,188 | 8.72 |
| SX07 | 140,762 | 1,798,000 | 12.77 | SX41 | 106,088 | 1,140,162 | 10.75 |
| SX08 | 142,846 | 2,119,727 | 14.84 | SX42 | 137,456 | 1,246,916 | 9.07 |
| SX09 | 145,038 | 1,910,647 | 13.17 | SX43 | 141,769 | 1,457,711 | 10.28 |
| SX10 | 147,941 | 1,680,924 | 11.36 | SX44 | 144,564 | 1,689,305 | 11.69 |
| SX11 | 150,815 | 2,067,161 | 13.71 | SX45 | 144,316 | 1,591,007 | 11.02 |
| SX12 | 137,667 | 1,510,621 | 10.97 | SX46 | 137,927 | 1,350,467 | 9.79 |
| SX13 | 151,122 | 1,475,451 | 9.76 | SX47 | 146,675 | 1,493,755 | 10.18 |
| SX14 | 139,948 | 1,141,327 | 8.16 | SX48 | 138,873 | 1,285,432 | 9.26 |
| ID | SNP Number | Hetloci Ratio (%) | Integrity Ratio (%) | ID | SNP Number | Hetloci Ratio (%) | Integrity Ratio (%) |
|---|---|---|---|---|---|---|---|
| SB1 | 300,918 | 17.91 | 48.80 | SX15 | 340,669 | 19.00 | 55.25 |
| SH1 | 279,620 | 17.93 | 45.35 | SX16 | 334,821 | 18.15 | 54.30 |
| SH2 | 351,232 | 19.60 | 56.96 | SX17 | 266,597 | 16.87 | 43.24 |
| SH3 | 343,657 | 19.14 | 55.74 | SX18 | 355,004 | 19.54 | 57.58 |
| SH4 | 317,807 | 17.97 | 51.54 | SX19 | 327,964 | 18.31 | 53.19 |
| SJ1 | 276,991 | 18.88 | 44.92 | SX20 | 322,766 | 17.95 | 52.35 |
| SJ2 | 297,219 | 17.30 | 48.20 | SX21 | 323,363 | 17.86 | 52.44 |
| SJ3 | 353,923 | 19.30 | 57.40 | SX22 | 345,938 | 18.78 | 56.11 |
| SJ4 | 450,693 | 28.73 | 73.10 | SX23 | 336,435 | 18.48 | 54.56 |
| SJ5 | 341,109 | 18.93 | 55.32 | SX24 | 346,155 | 19.22 | 56.14 |
| SJ6 | 359,735 | 19.94 | 58.34 | SX25 | 364,002 | 20.11 | 59.04 |
| SJ7 | 284,537 | 17.15 | 46.15 | SX26 | 343,732 | 19.22 | 55.75 |
| SL1 | 349,578 | 19.69 | 56.70 | SX27 | 357,266 | 19.79 | 57.94 |
| SL2 | 321,662 | 17.92 | 52.17 | SX28 | 354,589 | 19.76 | 57.51 |
| SM1 | 321,841 | 17.88 | 52.20 | SX29 | 329,492 | 18.55 | 53.44 |
| SM2 | 268,565 | 17.91 | 43.56 | SX31 | 310,206 | 18.43 | 50.31 |
| SN1 | 295,616 | 18.08 | 47.94 | SX32 | 318,428 | 18.67 | 51.64 |
| SN2 | 334,074 | 18.23 | 54.18 | SX33 | 337,137 | 18.91 | 54.68 |
| SS1 | 274,926 | 16.70 | 44.59 | SX34 | 326,911 | 18.22 | 53.02 |
| SX01 | 295,832 | 19.07 | 47.98 | SX35 | 332,924 | 18.43 | 53.99 |
| SX02 | 267,309 | 17.33 | 43.35 | SX36 | 301,753 | 17.80 | 48.94 |
| SX03 | 272,426 | 18.23 | 44.18 | SX37 | 287,012 | 17.57 | 46.55 |
| SX04 | 267,987 | 17.77 | 43.46 | SX38 | 301,108 | 17.77 | 48.83 |
| SX05 | 300,601 | 17.99 | 48.75 | SX39 | 315,850 | 18.54 | 51.23 |
| SX06 | 279,522 | 18.32 | 45.33 | SX40 | 282,203 | 17.29 | 45.77 |
| SX07 | 279,250 | 18.17 | 45.29 | SX41 | 302,783 | 8.39 | 49.11 |
| SX08 | 279,198 | 18.55 | 45.28 | SX42 | 290,009 | 17.36 | 47.03 |
| SX09 | 297,579 | 18.89 | 48.26 | SX43 | 287,487 | 17.25 | 46.62 |
| SX10 | 323,345 | 19.13 | 52.44 | SX44 | 290,581 | 17.74 | 47.13 |
| SX11 | 314,870 | 19.83 | 51.07 | SX45 | 300,420 | 18.20 | 48.72 |
| SX12 | 271,604 | 17.61 | 44.05 | SX46 | 279,457 | 17.04 | 45.32 |
| SX13 | 355,317 | 19.87 | 57.63 | SX47 | 315,801 | 18.34 | 51.22 |
| SX14 | 317,163 | 17.48 | 51.44 | SX48 | 285,131 | 17.00 | 46.24 |
| Population | HLJ | IM | JL | LN | HN | XJ |
|---|---|---|---|---|---|---|
| HLJ IM | 0.009 | |||||
| JL | 0.007 | 0.005 | ||||
| LN | 0.005 | 0.039 | 0.005 | |||
| HN | 0.036 | 0.007 | 0.038 | 0.047 | ||
| XJ | 0.001 | 0.012 | 0.005 | 0.003 | 0.020 |
Disclaimer/Publisher’s Note: The statements, opinions and data contained in all publications are solely those of the individual author(s) and contributor(s) and not of MDPI and/or the editor(s). MDPI and/or the editor(s) disclaim responsibility for any injury to people or property resulting from any ideas, methods, instructions or products referred to in the content. |
© 2023 by the authors. Licensee MDPI, Basel, Switzerland. This article is an open access article distributed under the terms and conditions of the Creative Commons Attribution (CC BY) license (https://creativecommons.org/licenses/by/4.0/).
Share and Cite
Li, J.; Wei, S.; Huang, Z.; Zhu, Y.; Li, L.; Zhang, Y.; Ma, Z.; Huang, H. Genetic Diversity and Population Structure in Solanum nigrum Based on Single-Nucleotide Polymorphism (SNP) Markers. Agronomy 2023, 13, 832. https://doi.org/10.3390/agronomy13030832
Li J, Wei S, Huang Z, Zhu Y, Li L, Zhang Y, Ma Z, Huang H. Genetic Diversity and Population Structure in Solanum nigrum Based on Single-Nucleotide Polymorphism (SNP) Markers. Agronomy. 2023; 13(3):832. https://doi.org/10.3390/agronomy13030832
Chicago/Turabian StyleLi, Jinhui, Shouhui Wei, Zhaofeng Huang, Yuyong Zhu, Longlong Li, Yixiao Zhang, Ziqing Ma, and Hongjuan Huang. 2023. "Genetic Diversity and Population Structure in Solanum nigrum Based on Single-Nucleotide Polymorphism (SNP) Markers" Agronomy 13, no. 3: 832. https://doi.org/10.3390/agronomy13030832