Article

Yield, Quality, and Water and Fertilizer Partial Productivity of Cucumber as Influenced by the Interaction of Water, Nitrogen, and Magnesium

1
College of Horticulture, Northwest A&F University, Xianyang 712000, China
2
Key Laboratory of Protected Horticultural Engineering in Northwest, Ministry of Agriculture/Shaanxi Province Facility Agriculture Engineering Center, Xianyang 712000, China
*
Author to whom correspondence should be addressed.
Agronomy 2023, 13(3), 772; https://doi.org/10.3390/agronomy13030772
Submission received: 13 February 2023 / Revised: 28 February 2023 / Accepted: 4 March 2023 / Published: 7 March 2023

Abstract

:
The balanced management of water and nutrient factors is essential for the high-efficiency production of cucumber. The effect of magnesium coupling with water and nitrogen on cucumber was determined using a three-factor and three-level orthogonal rotation combination design experiment, and the yield, quality, and water and fertilizer efficiency of cucumber were studied. Yield was significantly influenced by the single factor of irrigation or nitrogen, with the largest value of 88,412.6 kg/ha under high levels of irrigation and nitrogen input. The increase in magnesium fertilizer has a significant promoting effect on reducing sugar and free amino acids, with results 19.0% and 9.8% higher than that of low magnesium application, respectively. The interaction of irrigation and magnesium alleviated the negative effects of nitrogen deficiency, thereby reducing the risk of nitrate accumulation and improving the partial productivity of nitrogen fertilizer. The interaction of nitrogen and magnesium significantly affected the yield of cucumber, and all the quality indicators except vitamin C and the partial productivity of water and fertilizer. Six indicators from three categories of yield, quality, and efficiency were used to establish the comprehensive evaluation system based on correlation analysis, and yield was assigned the highest combined weight of 0.4023 using game theory. Grey relational analysis model was adopted to evaluate the water and fertilizer treatments, and the optimal applied combination was irrigation of 653.7 m3/hm2, nitrogen fertilizer (CH4N2O) of 1141.9 kg/ha, and magnesium fertilizer (MgSO4.7H2O) of 422.1 kg/ha. This condition comprehensively promoted yield, quality, and efficiency, providing a scientific water and fertilizer management strategy for cucumber production in Northwest China.

1. Introduction

Water resources are important material guarantees for the sustainable development of human society, and its consumption has remarkably increased because of the emergence of global problems, such as population growth, climate change, and energy depletion [1]. In the arid and semi-arid areas of Northwest China, the agricultural water consumption accounts for 73.69% of the total water consumption, and water resources have become an important factor that restricts the development of high-quality economy and society [2]. Considering the excessive pursuit of yield from farmers, unreasonable fertilization is becoming increasingly serious, resulting in the failure to increase income, the destruction of soil water and salt balance, groundwater pollution, and other ecological and environmental problems. Therefore, the efficient use of water and fertilizer resources has become a major demand for national strategic development in China.
Cucumber is a horticultural crop grown worldwide because of its distinct taste and high yield. Over the years, the extensive water and fertilizer management mode has been adopted in production, causing serious loss of water and nitrogen, soil salinization, nitrate nitrogen leaching, and even the decline of cucumber yield and quality [3]. Irrigation affects the uptake and utilization of nitrogen fertilizer, while nitrogen is involved in the physiological and biochemical reactions of the vegetative body and affects the crop quality. The excessive application of nitrogen fertilizer results in antagonistic effects with other nutrients in the soil, leading to the inability of plants to absorb nutrients [4].
The appropriate supplementation of magnesium can effectively improve plant nitrogen use efficiency, yield, and quality. Magnesium is an essential element in the crop growth cycle [5]. Magnesium ion concentrations of 125 μ mol L−1 to 8.5 mmol L−1 in soil solution could increase the contents of soluble sugar and vitamin C(VC) in fruit, as well as the yield [6]. However, considering the frequent application of nitrogen fertilizer in greenhouse cultivation and the competition of magnesium with various cations, the magnesium in the soil is gradually depleted, and magnesium deficiency in plants is becoming increasingly prominent. If plants are deficient in magnesium, chlorophyll and protein synthesis become limited, and fruit quality and dry weight are affected [7]. Excessive magnesium fertilization could increase the antagonism between ions in nutrient uptake by plants, which makes it difficult for the roots to absorb water, and this eventually causes the above-ground parts of plants to wilt or even die. In addition, excessive application of magnesium fertilizer could reduce the sugar content of produce, and significantly shorten the storage time of produce [8]. Therefore, the rational allocation of magnesium with irrigation and nitrogen is an urgent problem that needs to be solved in the management of balanced fertilization in actual production.
This experiment aimed to explore the effects of the combining of irrigation, nitrogen, and magnesium on the yield, quality, and water and fertilizer use efficiency of cucumber. In addition, this experiment aims to establish a multi-index comprehensive evaluation system for the scientific evaluation of the combined application of water and fertilizer by using the grey relational analysis model, determine the optimal application scheme based on comprehensive evaluation, and analyze the regulatory effects and interactions of irrigation, nitrogen, and magnesium on cucumbers. This strategy considers multiple categories of indicators, which provide a theoretical basis for the water and fertilizer balance management to achieve high yield, quality, and water conservation in cucumber production.

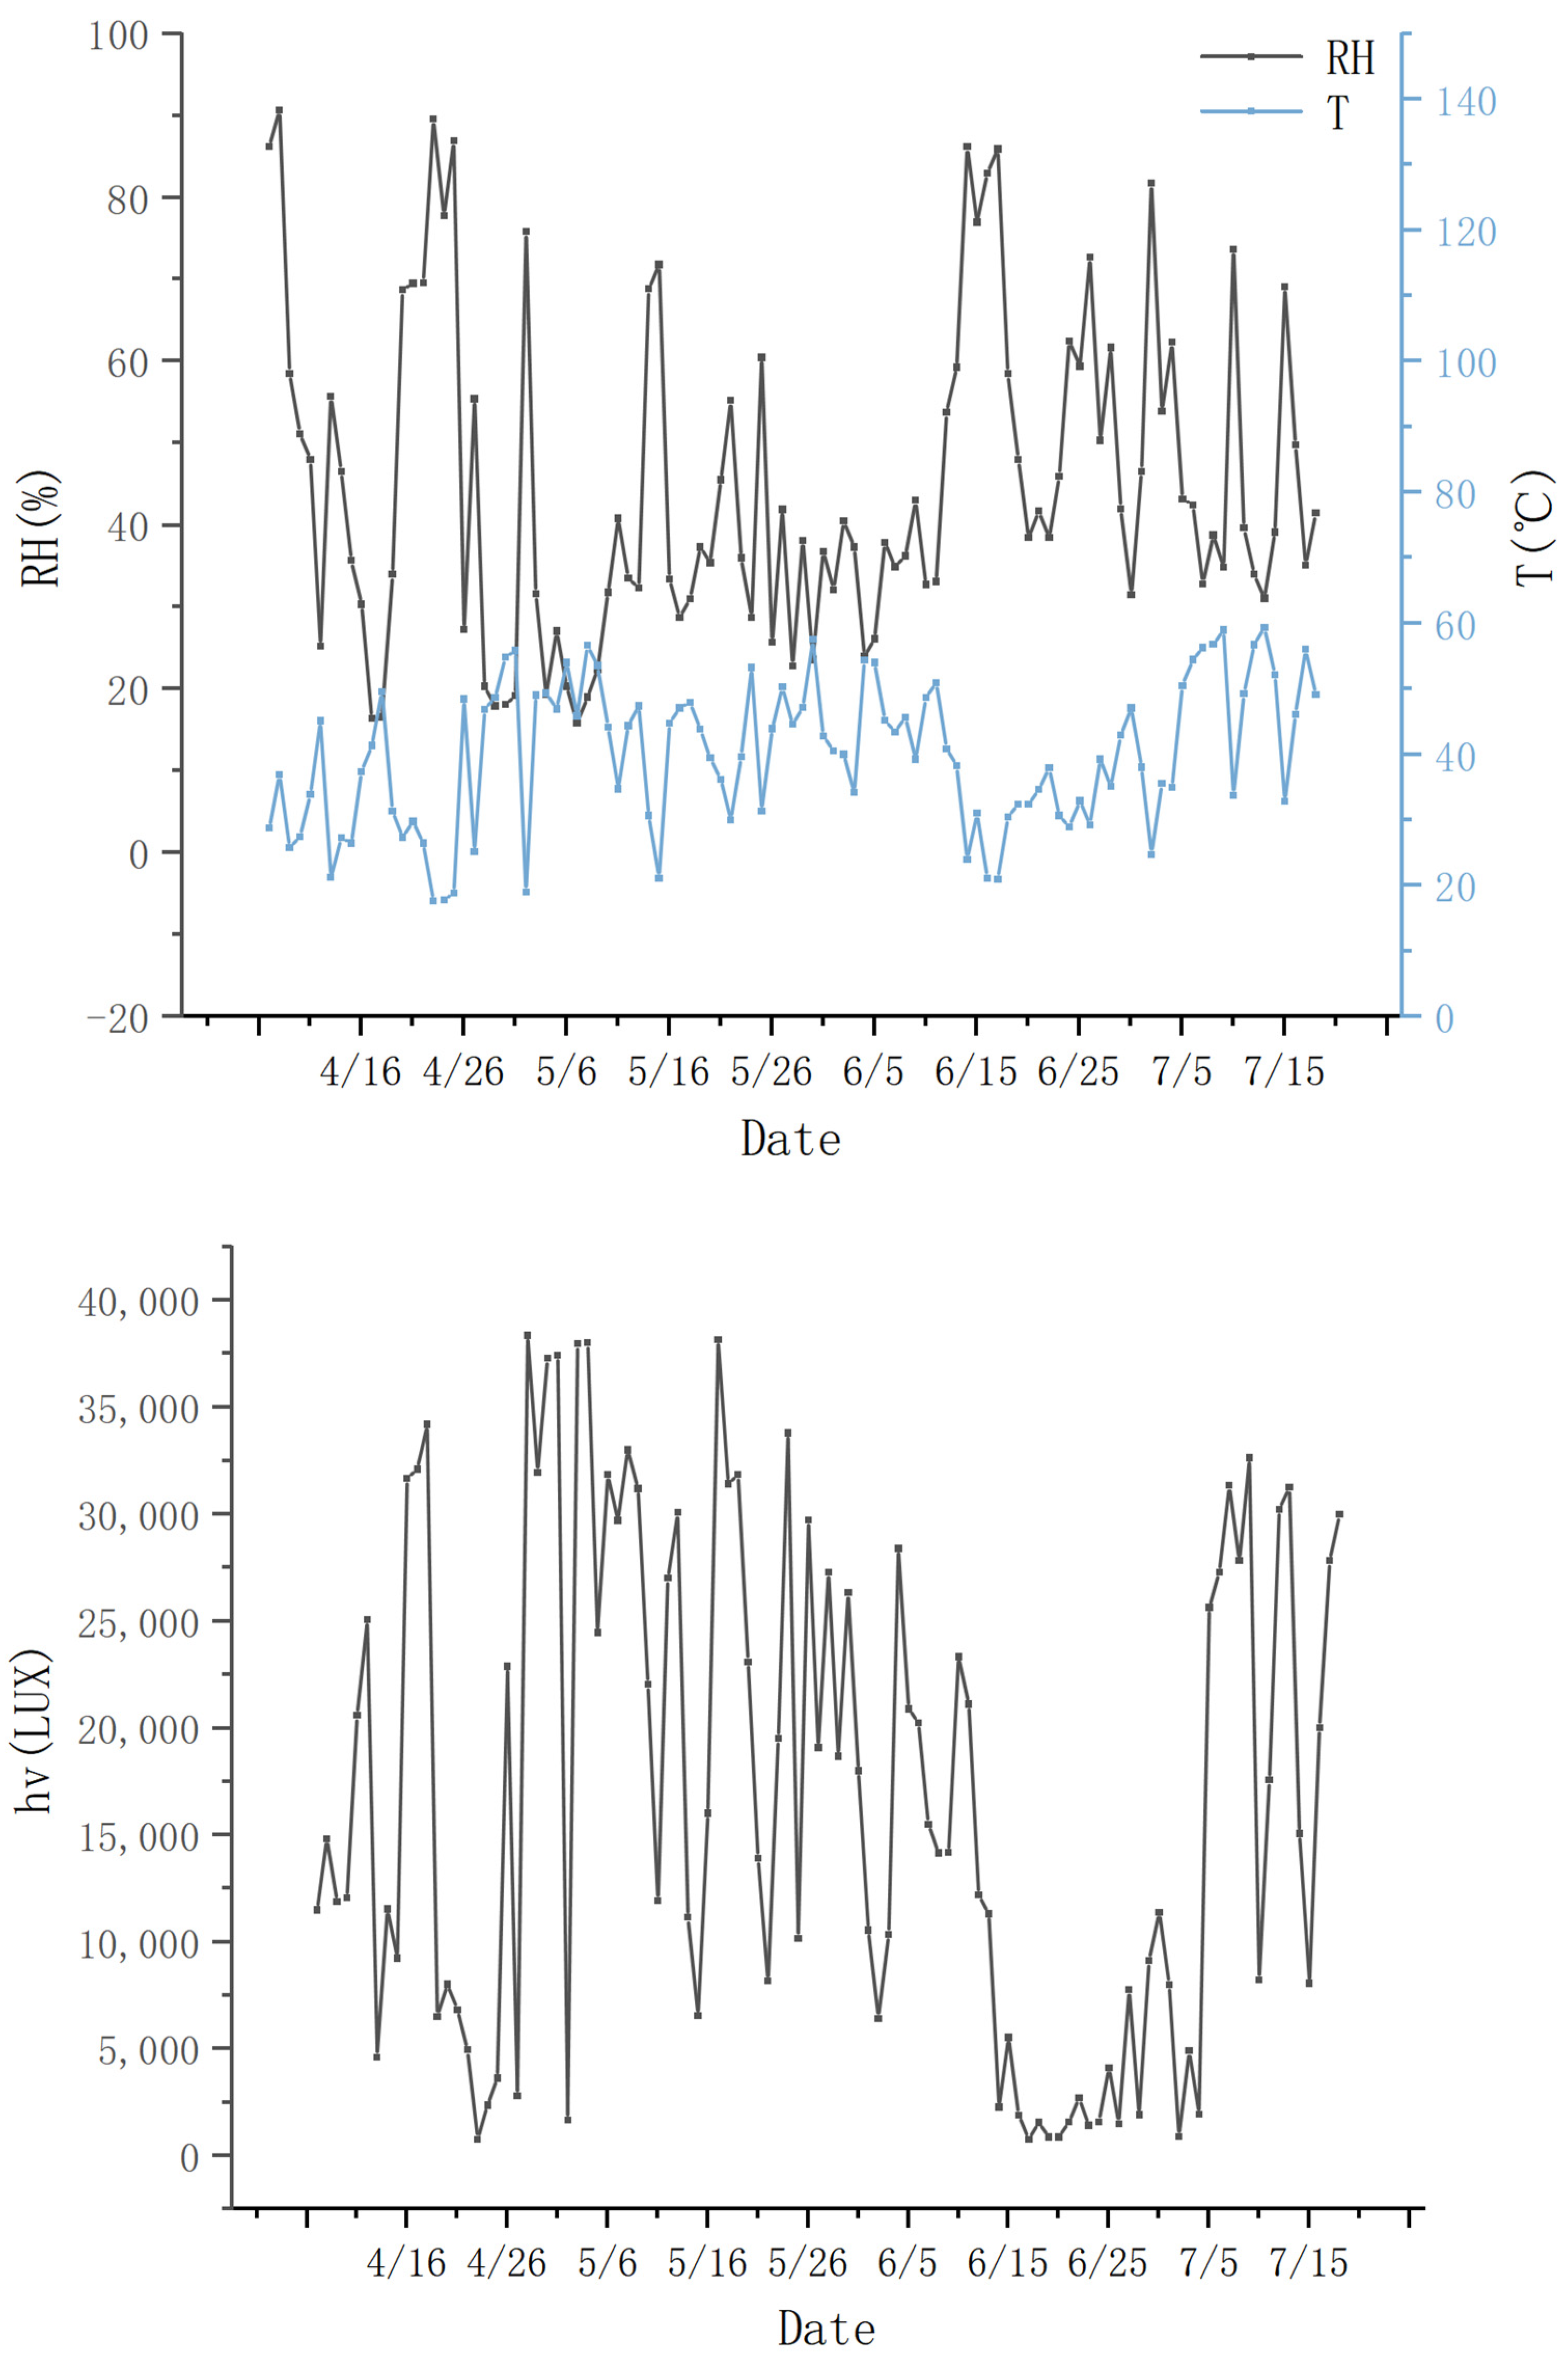
2. Materials and Methods

The water–fertilizer multi-factor coupling experiment for cucumber was conducted in a plastic greenhouse in Yang ling, Shaanxi Province, China (34°16′ N, 108°02′ E, and 450 m above sea level) from April to July 2021. The greenhouse was made of a steel frame with a length of 80 m, a width of 17 m, and a ridge height of 5.5 m. A small weather station (HOBO Event data Logger, Onset Computer Corp, Cape Cod, MA, USA) located in the greenhouse automatically recorded meteorological data, including temperature, humidity, and light radiation intensity (Figure 1). Cucumber (Bonnet 526) was selected as the test material because of its high fruiting rate, virus resistance, yield stability, and suitability for growing in the greenhouse. The physical properties of the soil before planting are shown in Table 1.

2.1. Experimental Design

This experiment was designed for three factors, namely, irrigation water amount (I), nitrogen application amount (N), and magnesium application amount (Mg), with three levels for each factor. Nine treatments were formed by orthogonal rotation combination design. The three I levels were determined based on evapotranspiration (I1: 75% ET0, I2: 100% ET0, and I3: 125% ET0), and three nitrogen levels and three magnesium levels were both conducted according to the target yield method as follows: N1 (75% N0), N2 (100% N0), N3 (125% N0), Mg1 (75% Mg0), Mg2 (100% Mg0), and Mg3 (125% Mg0). The specific dosages are shown in Table 2.
The water evapotranspiration in the field (ET0) was calculated using the following equation [9]:
E T 0 = S π r 2 · D
where S is the area of irrigated land (dm2), r is the radius of the evaporation dish (dm), and D is the amount of water evaporated from the evaporation dish (L).
The nitrogen and magnesium fertilization amounts were calculated in the bases of urea (CH4N2O) and magnesium sulfate (MgSO4.7H2O), respectively. Taking N0 as an example, the main calculation formula is as follows [10]:
T Y = 1 + n Y
where TY refers to the target yield (kg/667 m2), n is the rate of increase (usually 30% for greenhouse vegetables), and Y is the average yield in the previous three years (kg/667 m2).
U = T Y · N t
where U is the amount of nutrients required for planned yield (kg), and Nt is the nitrogen content needed to form 1000 kg of cucumber (usually 2.8 kg).
N 0 = U N s C · R
where N0 is the nitrogen fertilizer content required for TY (kg/667 m2), Ns is the nitrogen content of the test soil (kg/667 m2), and C is the effective nutrient content of the nitrogen fertilizer. The nitrogen fertilizer used in this experiment is CH4N2O with a nutrient content of 47%, and R is the nitrogen use efficiency. The utilization efficiency of CH4N2O is 65%.
Each treatment was set for three replicates and arranged in a random complete block. Infiltration of water and fertilizer was prevented by deeply burying the mulch between treatments. The planting rows were 7 m long and 0.7 m wide, and the planting distance was 0.5 m between cucumber seedlings on two sides of each row. The total area of each plot was 4.9 m2, which contains 36 plants. For avoiding treatment interferences, two guard rows were left around each plot. Cucumber seedlings were transplanted to the greenhouse at two true leaves stage on 7 April 2021 and were pulled on 15 July 2021. After planting, the seedlings were irrigated and then treated with water and fertilizer until the first flower appeared. Phosphorus (63 kg/hm2) and potassium (145.9 kg/hm2) fertilizers were also examined according to the TY method, with the same application rate for each treatment, and phosphorus fertilizers were applied as base fertilizer before ridging. By using drip irrigation under mulch, the irrigation amount of each treatment was recorded using an electronic flowmeter of the corresponding branches. Irrigation was carried out in the morning on sunny days with the frequency of 2–3 days. The whole growth period of the cucumber was divided into the seedling, flowering, fruiting, early melon, full melon, and late melon stages, with the fertilizer ratio of 1:2:2:2:1. Table 2 shows the test factor level code, while Table 3 shows the specific irrigation and fertilizer application rates.

2.2. Measurements

2.2.1. Yield

The yield indicators include single fruit weight (SFW) and yield per hectare (Y). An average of ten cucumber plants were devoted to measuring yield characteristics, which were single fruit weight (SFW, g), number of fruits per plant, and yield ha−1 (kg) that was estimated by multiplying the yield of each plot by 2041.8 (2041.8 = dividing the area of one hectare on the area of one plot). The mass was measured using a one-thousandth precision electronic balance.

2.2.2. Fruit Quality

The quality indicators included total soluble solids (TSS), reducing sugars (RS), soluble protein (SP), vitamin C content (VC), free amino acids (FAA), and nitrates (NIT). Total soluble solids was measured using a TD-45 handheld sugar meter [11]. Reducing sugars was determined using the 3,5-dinitrosalicylic acid method. Soluble protein was determined using the Komas Brilliant Blue G-250 staining method [12]. Vitamin C was determined using the xylene extraction colorimetric method [13]. Free amino acids was determined using the ninhydrin solution colorimetric method [14]. Nitrates was determined using the salicylic acid sulfuric acid colorimetric method [15].

2.2.3. Partial Productivity of Water and Fertilizer

The water partial productivity (WPP) was calculated as follows:
WPP = Y/I
where Y is the cucumber yield per hectare (kg/ha), and I is the actual irrigation amount (m3/ha).
The nitrogen partial productivity (NPP) was calculated as follows:
NPP = Y/N
where N is the nitrogen fertilizer application amount (kg/ha).
The magnesium partial productivity (MPP) was calculated as follows:
MPP = Y/Mg
where Mg is the magnesium fertilizer application amount (kg/ha).

2.3. Comprehensive Evaluation for Cucumber Production Based on Grey Relational Analysis (GRA)

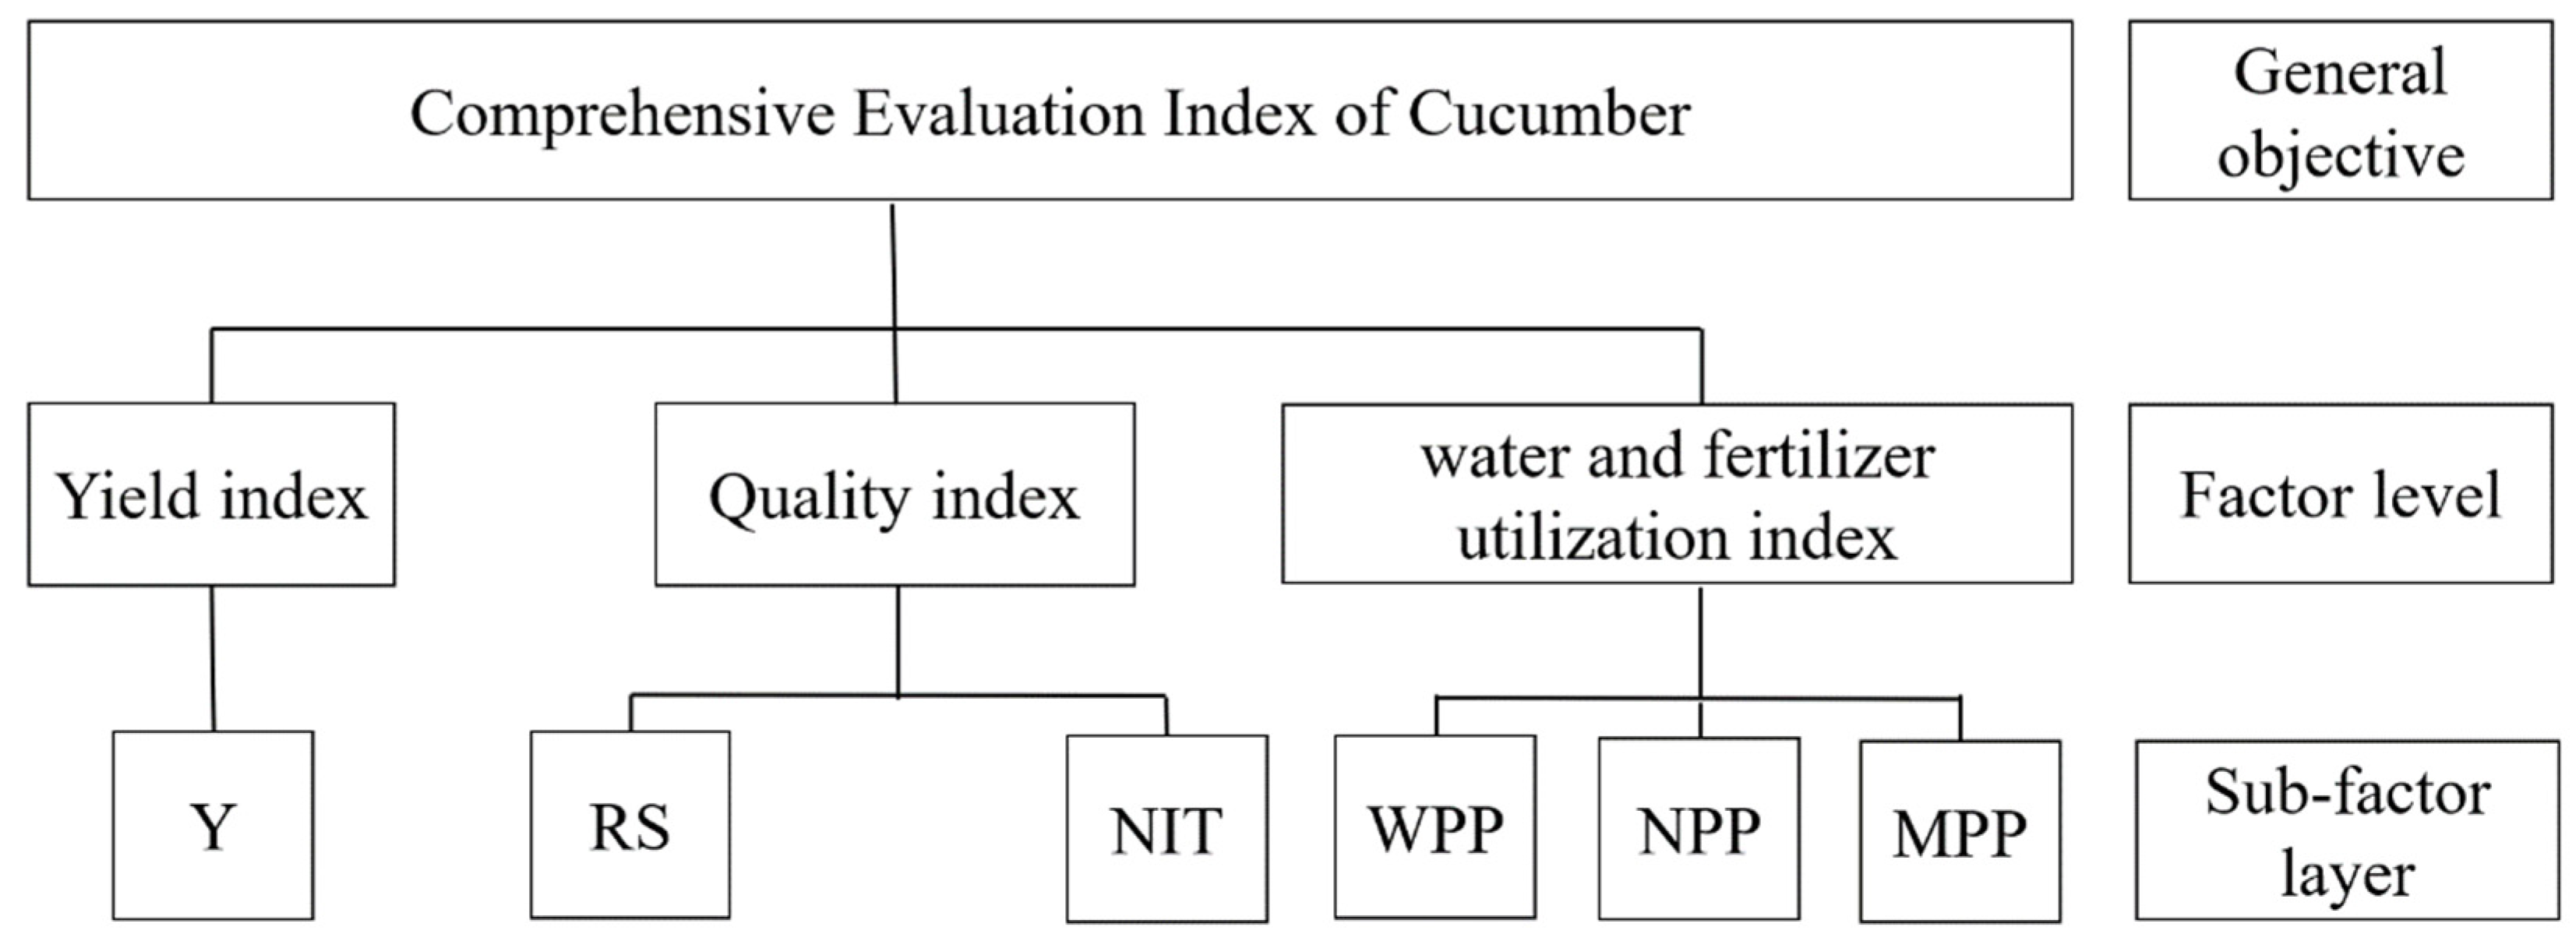
2.3.1. Establishment of a Comprehensive Evaluation System

Reasonable water and fertilizer application needs to consider the different categories of indicators for cucumber production. Therefore, a comprehensive evaluation system needs to be established to weigh multiple indicators from the three categories of yield, quality, and efficiency. The specific indicators can be obtained through correlation analysis.

2.3.2. Determination of the Indicator Weights

Determination of subjective weights by hierarchical analysis.
The analytic hierarchy process (AHP) involves the use of a judgment matrix based on the results of the questionnaire, and it decomposes the overall decision into a target layer, a factor layer, and a subfactor layer. Specific calculation methods are provided in the available literature [16].
Determination of objective weights by entropy weighting method.
The entropy weight method was used to determine objective weights using the standardized measured values. This method considers the relationship between multiple samples, which can make the data evaluation results more objective and reasonable. The specific calculation methods are based on a previous study [17].
Combined weighting based on game theory.
The combination weighting based on game theory involves the comparison and coordination of different weights to determine the optimal result of both subjective and objective weights. The combination weighting steps are as follows [18]:
1.
Two methods were employed to weigh the index, in which w1 is the weight vector determined by the AHP method, and w2 is the weight vector determined by the entropy weight method. The linear combination coefficient was set as αq(q = 1,2), and W is the linear combination of the two weight vectors.
W = q = 1 2 α q w q T
2.
According to the idea of game theory, the consistency and compromise between different weights were determined, and optimization was carried out to minimize the deviation. The optimal w was then obtained. Its combination coefficient αq was calculated as follows:
w 1 · w 1 T w 1 · w 2 T w 2 · w 1 T w 2 · w 2 T α 1 α 2 = w 1 · w 1 T w 2 · w 2 T
3.
The combination factor will be optimized. αq is normalized. Finally, the combined weight was obtained according to the following formula:
W * = q = 1 2 α q * w q T

2.3.3. Grey Correlation Degree Evaluation Model

Grey correlation analysis aims to determine the ideal scheme by comparing the relationship between decision sequences, calculate the correlation degree of each scheme, and use the ranking of the correlation degree as the basis for the quality of each decision scheme [19].
The grey correlation coefficient matrix was constructed, the grey correlation analysis method was used, the reasonable ideal scheme X0 = {x01, x02, …, x0n} was selected, the correlation coefficient of each element of the matrix to be decided, ξi (j) was normalized and calculated, and the grey coefficient matrix Rij was constructed. The specific steps are based on a previous study [20], in which the calculation formula of correlation coefficient is as follows:
ξ i j = Δ m i n + ρ Δ m a x Δ U i j + ρ Δ m a x
where ΔUij is the absolute difference between each point of the standardized matrix and the ideal scheme, Δmax is minimum difference between the two poles, Δmin is the maximum difference between two poles, and ρ is the resolution coefficient with a value of 0.5.
Correlation degree is a measure of the closeness between the candidate and ideal scheme. The closer the correlation degree is to 1, the closer the candidate scheme is to the ideal scheme. The closer the correlation degree is to 0, the worse the candidate scheme is [21]. The correlation degree between each scheme and the ideal scheme μi can be calculated using the following formula:
μ i = R i · w * = j = 1 n ξ i j · w j *

2.4. Data Analysis

DPS software (DPS 9.50. Hangzhou Rui Feng Information Technology Co., Hangzhou, Zhejiang Province, China) was used to calculate the experimental protocol. Yaahp (Yaahp V2.5. Shanxi Yuan Decision Software Technology Co., Xi’an, Shaanxi Province, China) software was used to construct the comprehensive hierarchical model of cucumber and determine the subjective weights of each indicator. Microsoft Excel (Office 2018, Microsoft Corp, Redmond, WA, USA) was used to calculate the objective weights and combined weights of the indicators. SPSS 23.0 (SPSS, IBM, Chicago, IL, USA) was used to perform ANOVA. Origin 2018 (Origin, Origin Lab, Northampton, MA, USA) and Rstudio (Rstudio 2022, Murray Hill, NJ, USA) were used to generate the figures.

3. Result

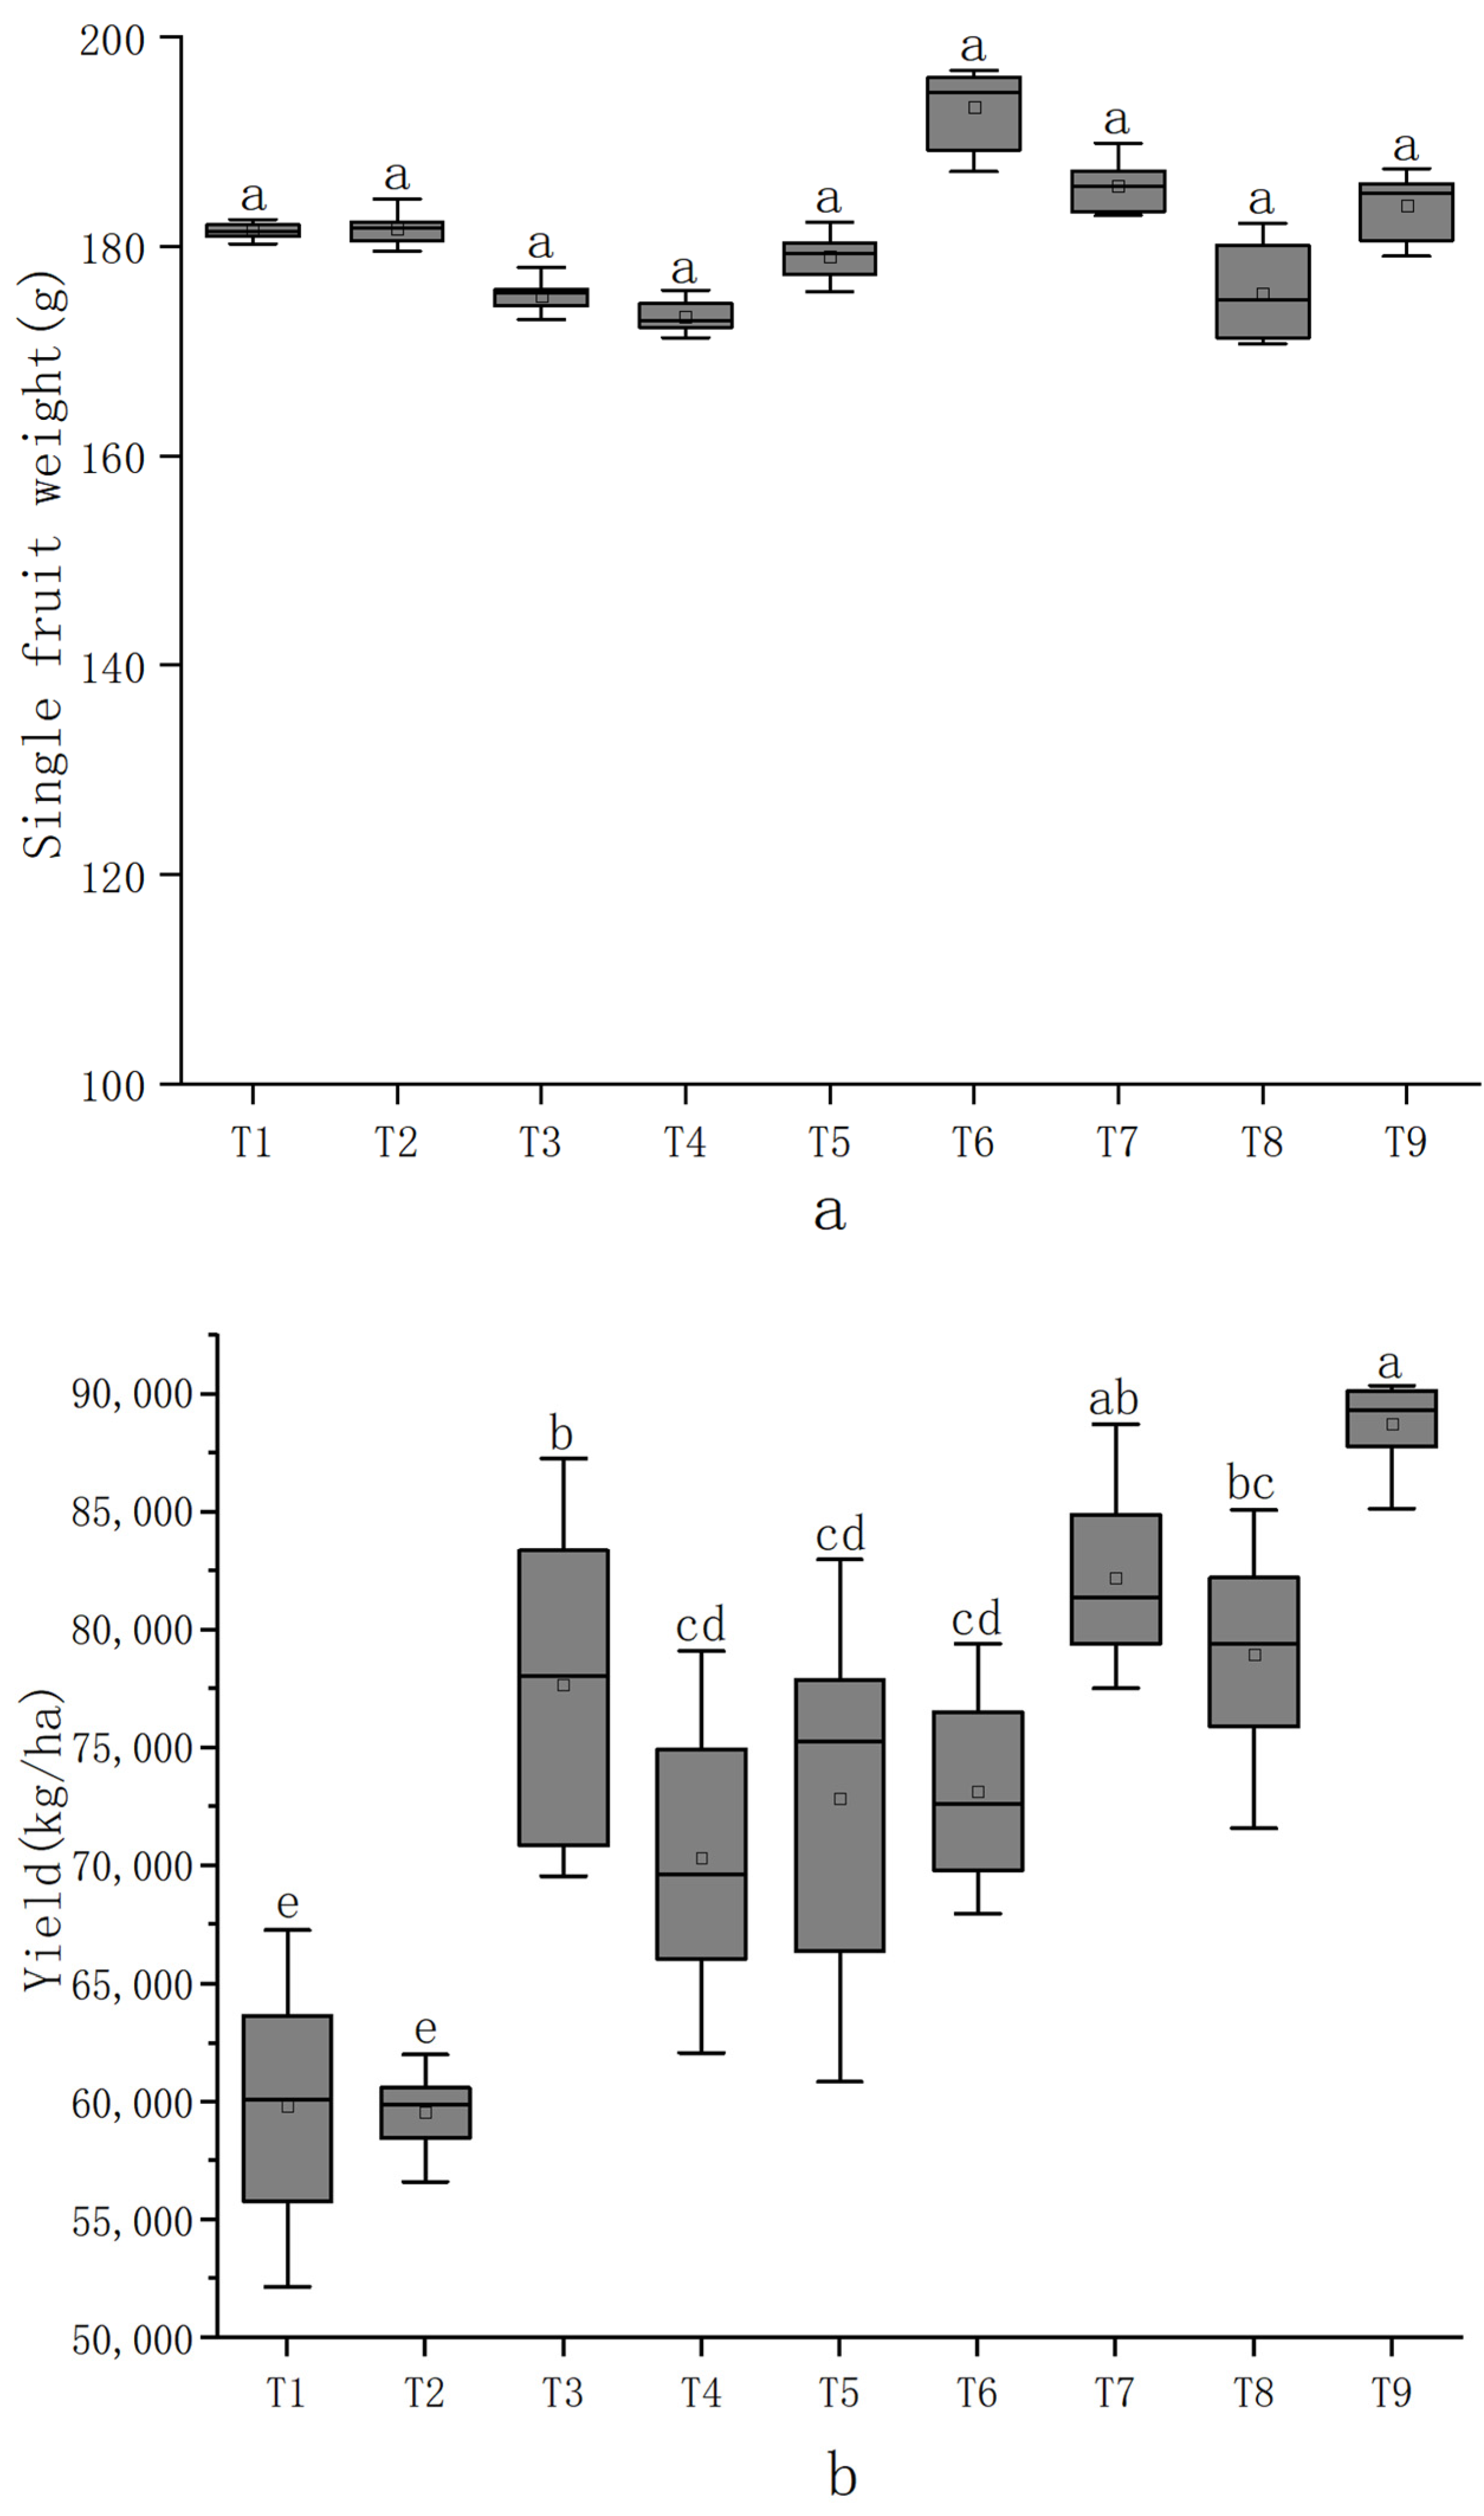
3.1. Effect of Irrigation Combined with Nitrogen and Magnesium on Cucumber Yield

The three factors of water and fertilizer had no significant effect on the SFW, in which the largest difference among all treatments was 11.9% (Table 4; Figure 2a). Yield was remarkably affected by irrigation and nitrogen. With the increase in irrigation, yield showed an upward trend (Table 4; Figure 2b). When I3 was applied, the yield was 26.88% higher than that of I1. The yield also increased with the increase in nitrogen application amount, and the treatment groups can be ranked as N3 > N2 > N1. Although the single factor of magnesium has no significant effect on yield, the interactions of I * Mg and N * Mg significantly affected yield (Table 4). In all treatments, T6 obtained the largest SFW, while the largest yield was observed in T9, with a value that was 50.10% higher than the lowest yield of T1 (Figure 2b).

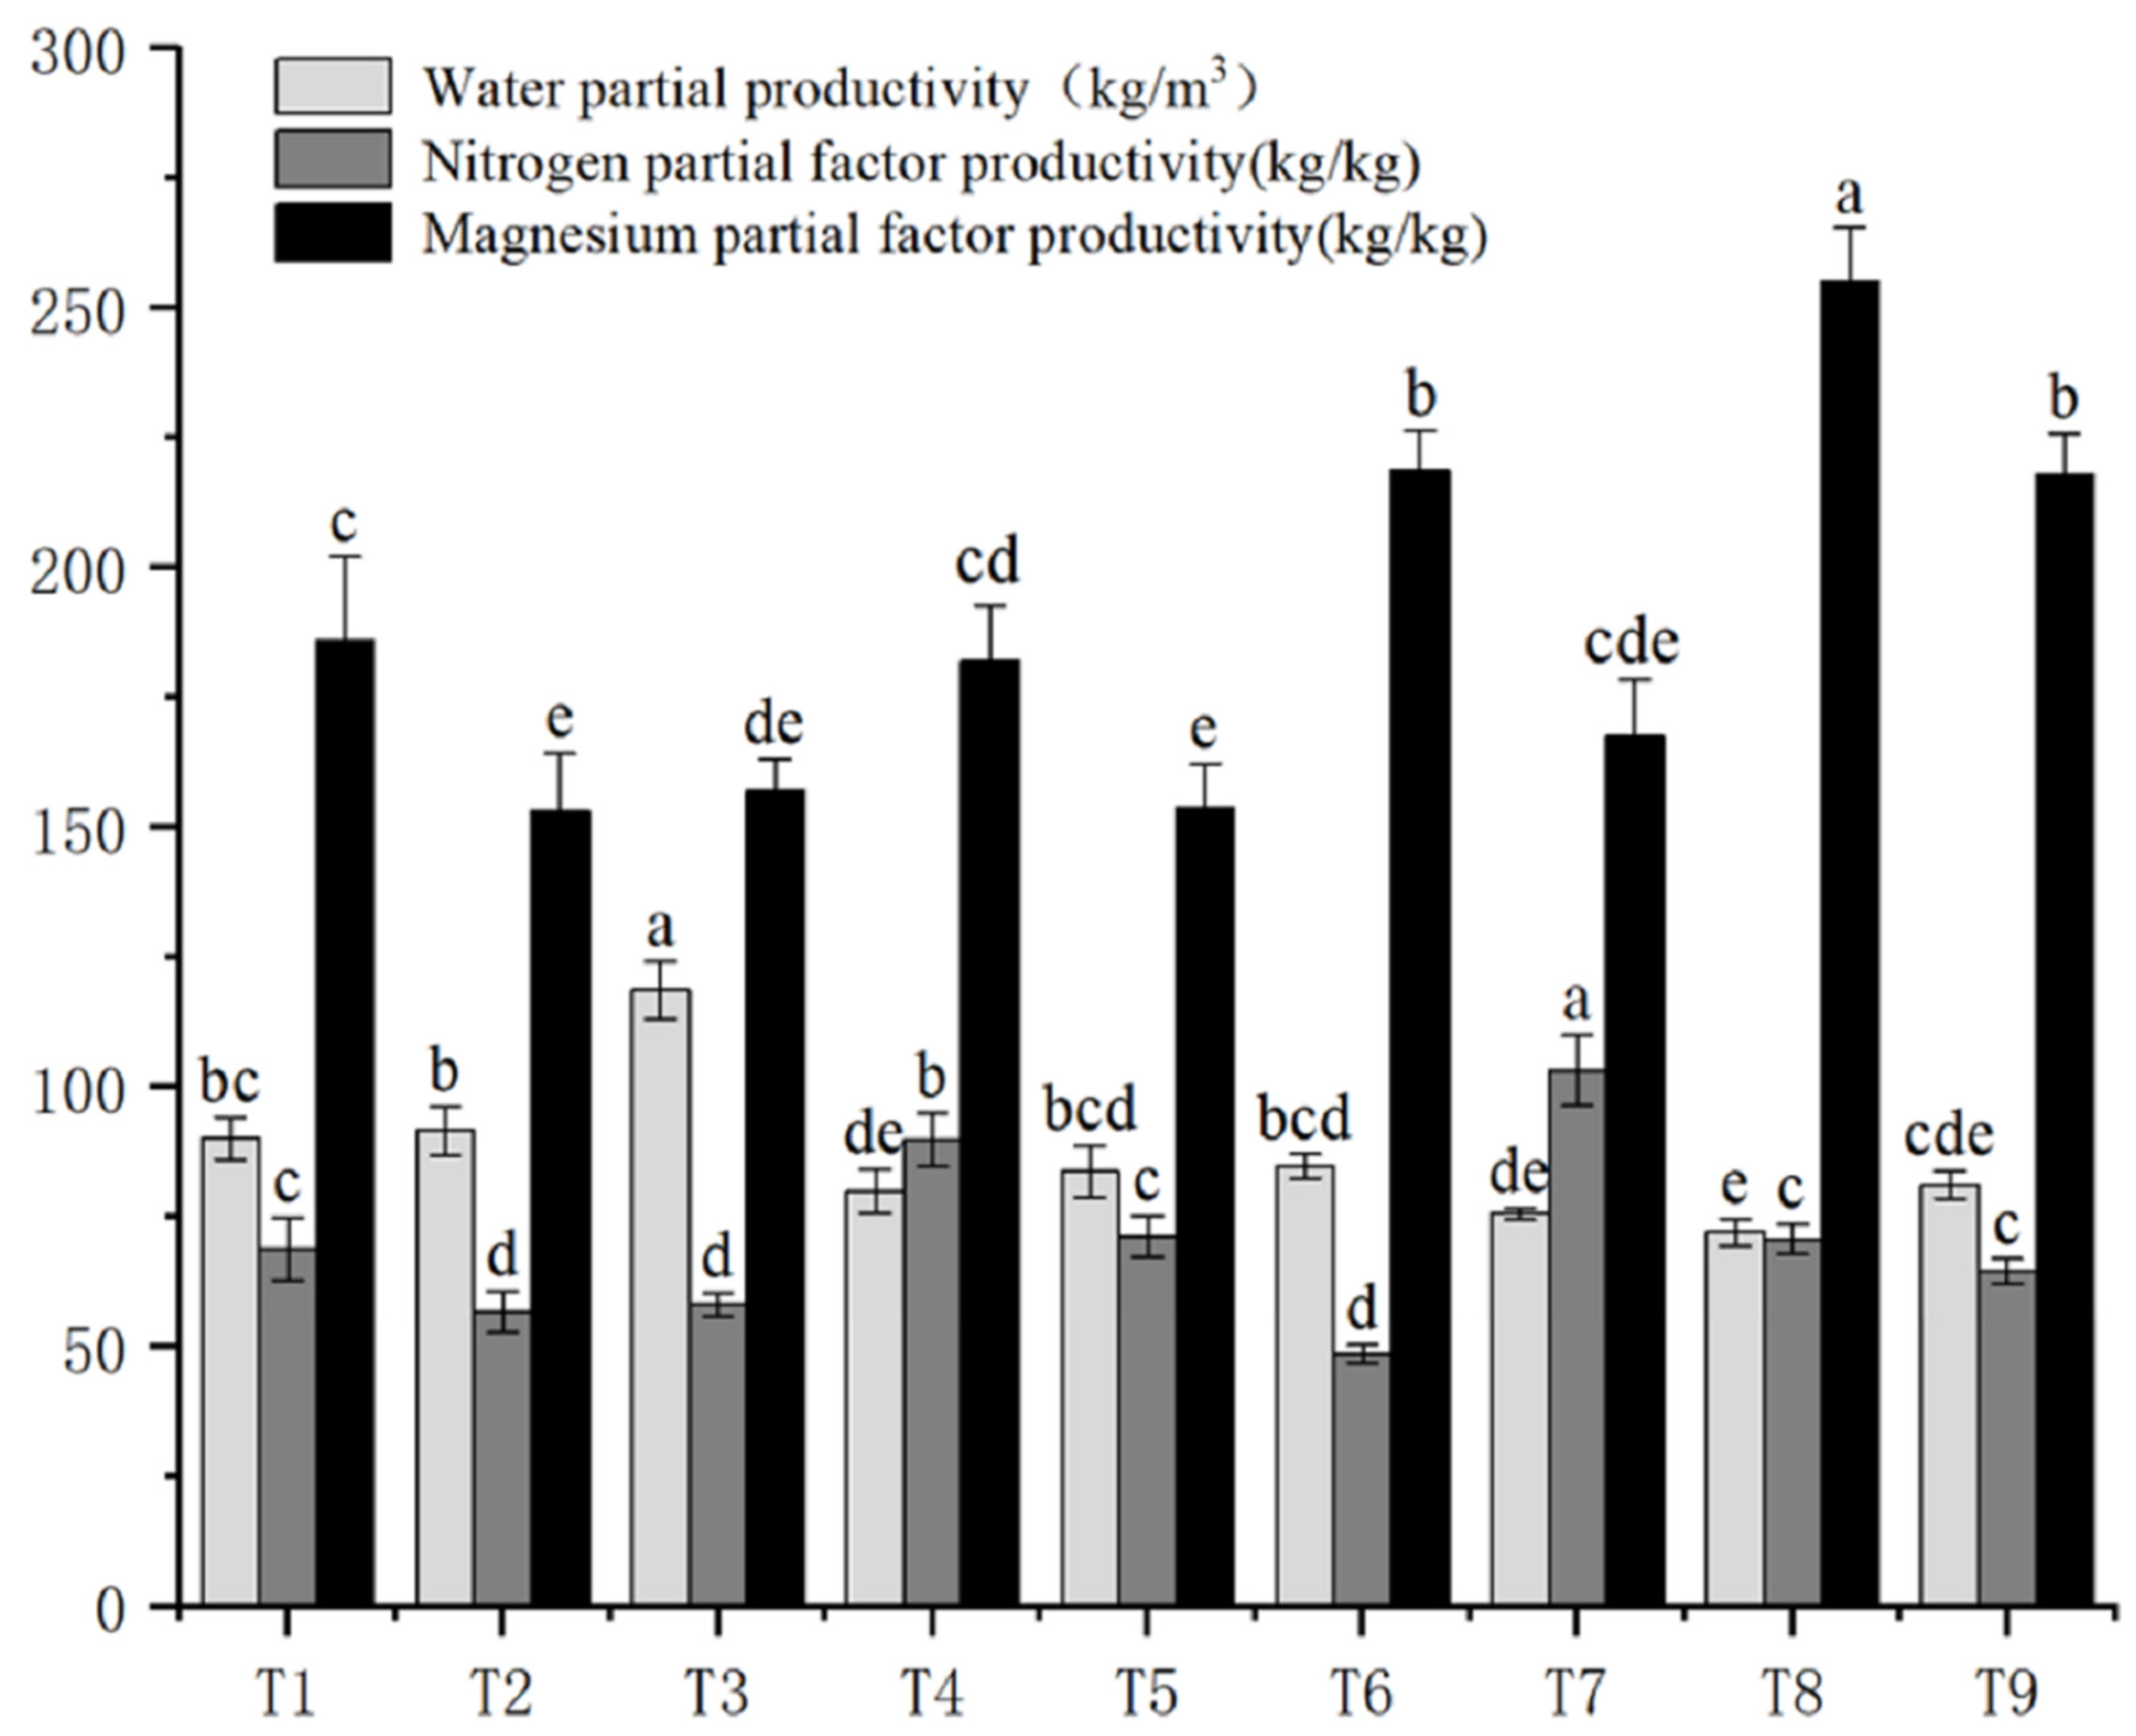
3.2. Effects of Irrigation Combined with Nitrogen and Magnesium on Water and Fertilizer Benefit Indexes of Cucumber

Irrigation significantly affected WPP, NPP, and MPP (Table 4). Water partial productivity decreased with the increase in irrigation amount. Water partial productivity was the highest under I1, with a value that was 23.87% higher than the lowest value of I3, but no significant difference was observed between I2 and I3 (Table 4). Irrigation exhibited a promoting effect on both NPP and MPP, and the two indicators increased with the increase in irrigation amount, in which the best performance was observed under I3 application. Nitrogen had significant effects on WPP and NPP (Table 4). Increasing nitrogen application promoted WPP, and WPP under N3 application was significantly higher than that of N1 and N2. However, NPP gradually decreased with the increase in nitrogen application (Table 4). The effect of magnesium was only significant on MPP, and the higher the magnesium application, the lower the MPP (Table 4). In addition, I * N had a significant effect on MPP, and I * Mg had a significant effect on NPP, while N * Mg had significant effects on WPP, NPP, and MPP (Table 4). For all individual treatments, T3 achieved the highest WPP, with a value that was 64.84% higher than that of T8. T7 exhibited the largest NPP, while T8 had the best performance in MPP, which was significantly different from T6 (Figure 3).

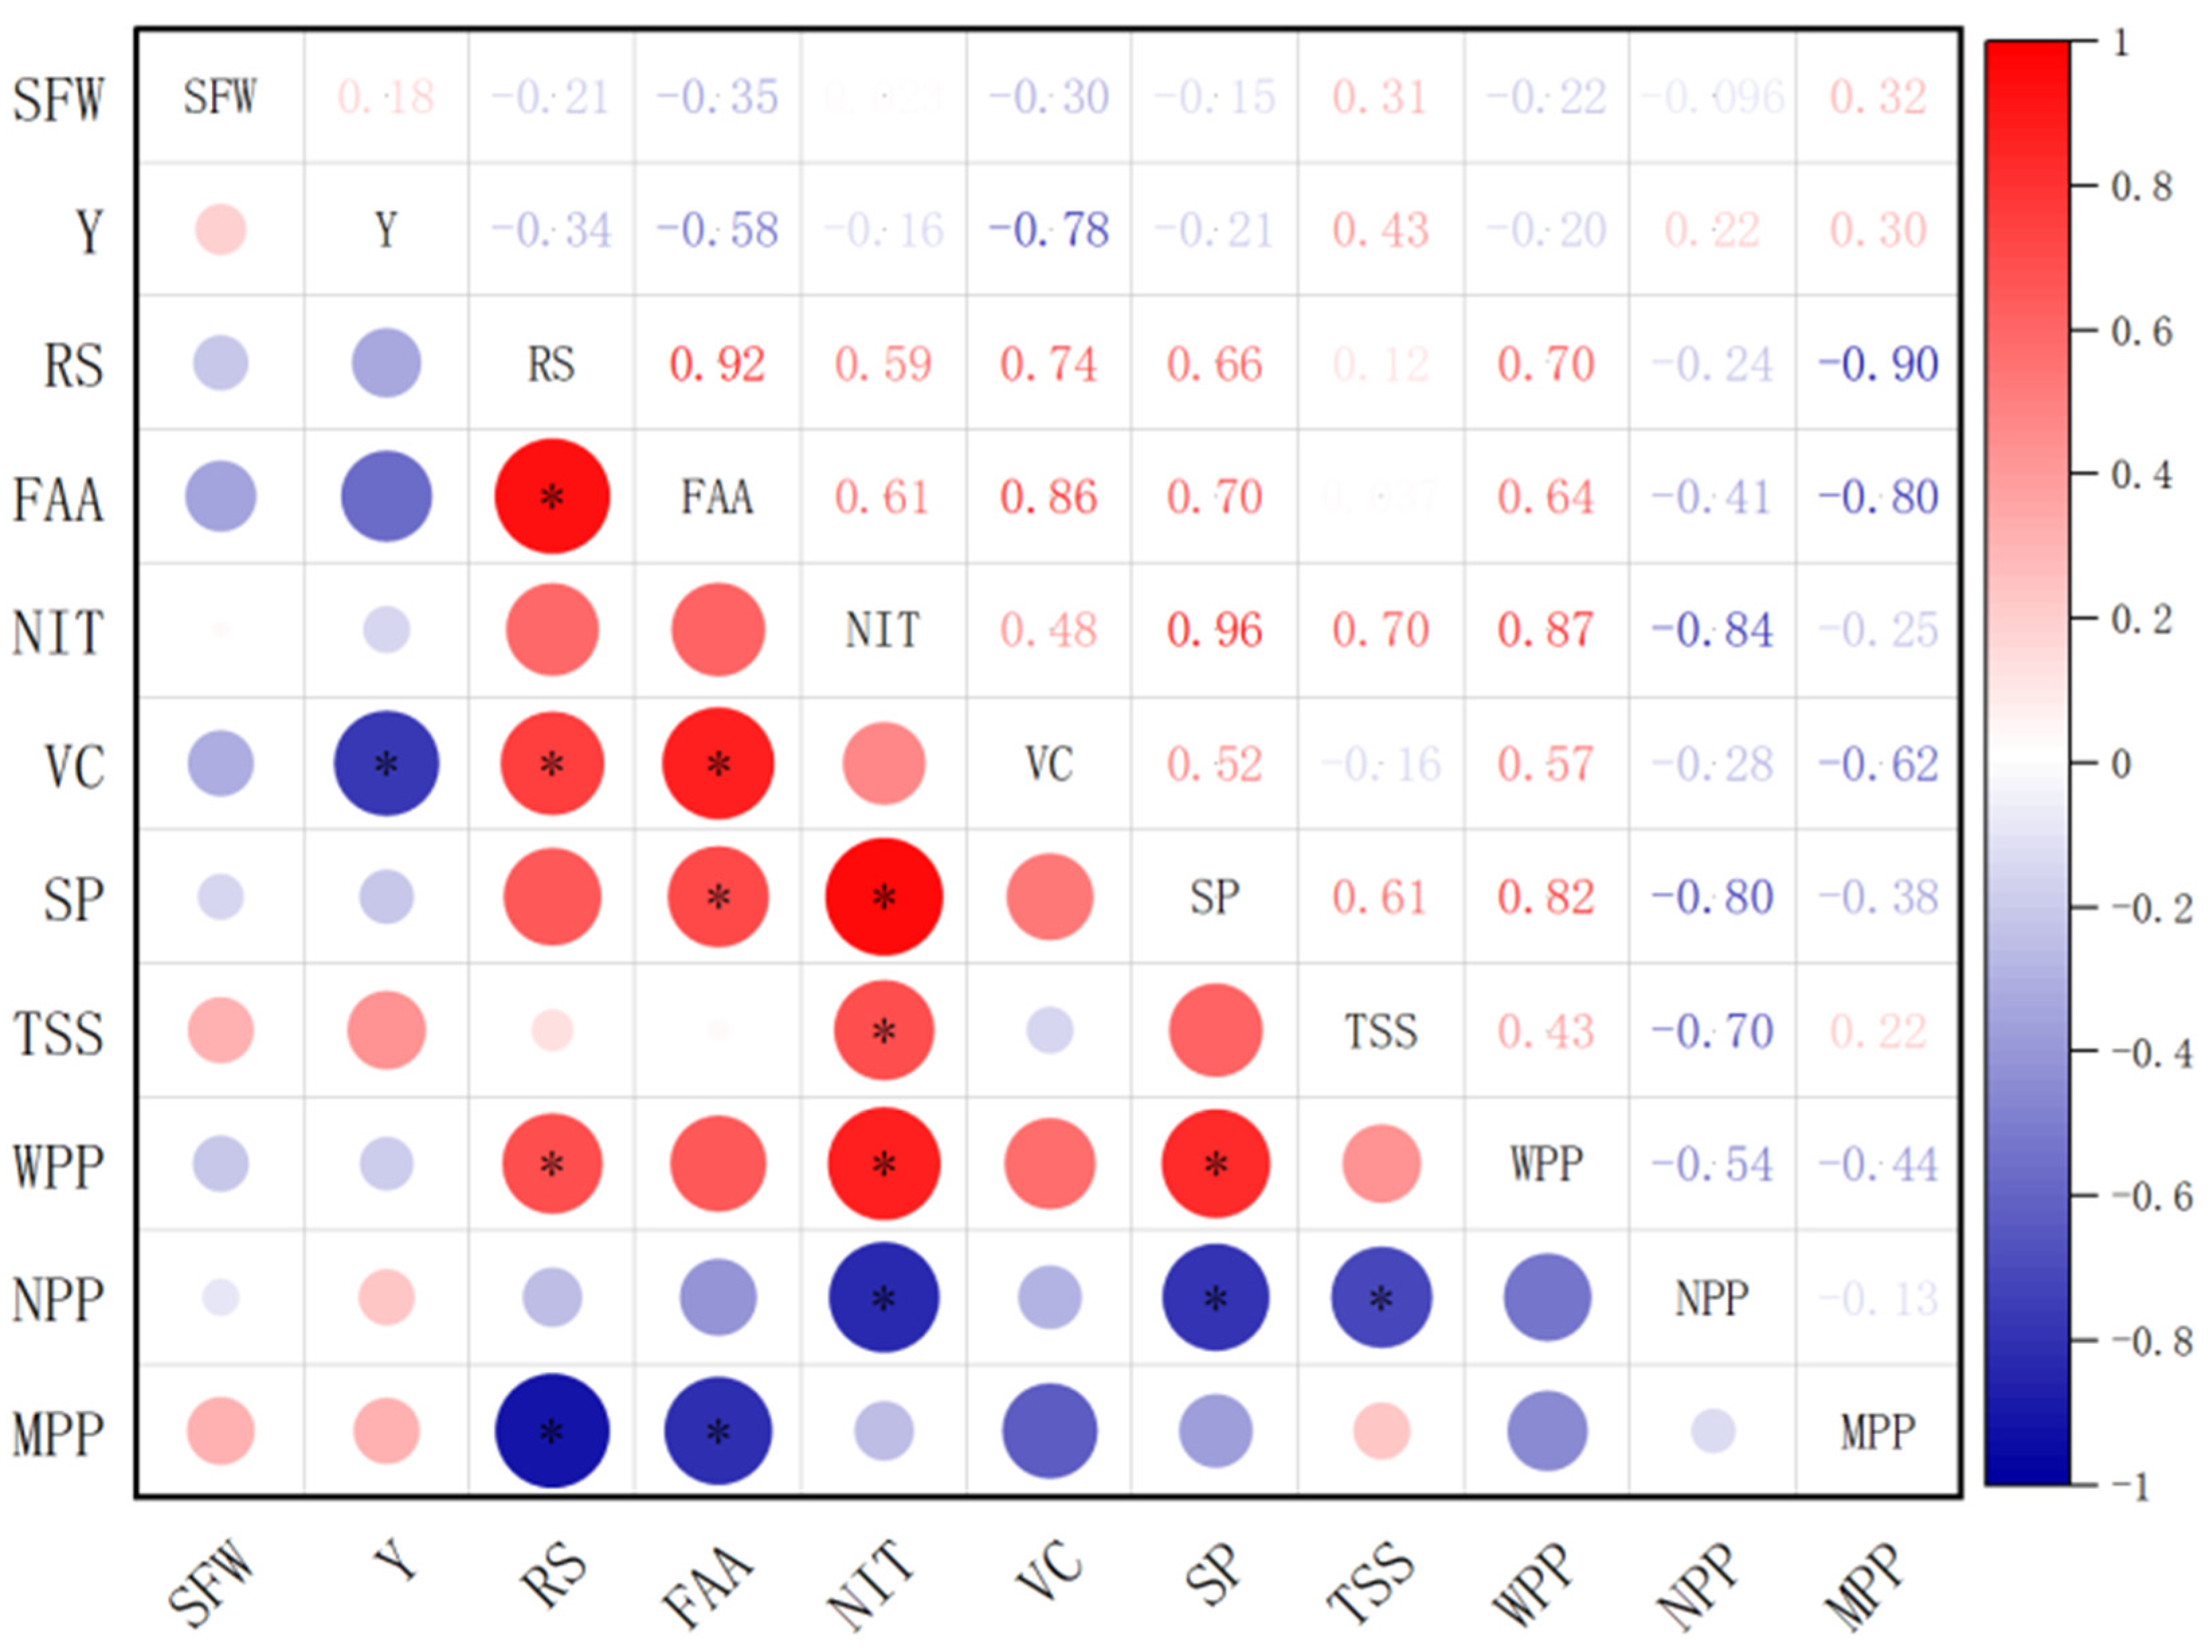
3.3. Effect of Irrigation Combined with Nitrogen and Magnesium on the Quality Indexes of Cucumber

Irrigation significantly affects all quality indicators except TSS (Table 5). Specifically, RS decreased significantly with the increase in irrigation and showed the best performance at I1 level (Table 5). For VC and FAA, I1 and I2 showed better promotion effect than I3, and the difference between I1 and I2 was not significant (Table 5). For SP, I1 showed a better promoting effect than I2 and I3. The lowest level of NIT was recorded in I3, in which the value was 16.1% lower than that in I1 (Table 5). In terms of nitrogen application level, NIT, SP, and TSS were affected significantly. Increased nitrogen application exacerbated NIT accumulation, but for SP and TSS, the effects of N2 and N3 did not significantly differ in terms of the two quality indicators (Table 5). The increase in magnesium application had a significant promoting effect on RS and FAA, and the best performances of the two indicators were observed when Mg3 was applied, with results 19.0% and 9.8% higher than that of Mg1, respectively (Table 5). For interactions, I * N significantly affected RS, FAA, VC, and TSS, and I * Mg only significantly regulated NIT and VC, while N * Mg significantly affected all quality indexes except VC (Table 5). In all treatments, T3 ranked the first with slight advantage in the three quality indicators of RS, SP, and TSS (Table 5). T2 achieved the largest FAA, and T1 performed best in VC. For NIT, the lowest value was observed in T7, and this value was 29.7% less than the maximum of T3 (Table 5).

3.4. Comprehensive Evaluation for Cucumber Based on the Grey Correlation Degree Model

3.4.1. Construction of the Comprehensive Evaluation System

The optimal water and fertilizer conditions of each index in cucumber production are not consistent. Therefore, multiple indexes should be considered to determine the final strategy. The correlation analysis method was used to screen the evaluation indexes to avoid the weight dispersion caused by the large number of indexes, thus affecting the accuracy of the evaluation results.
Figure 4 shows that 15 of the 55 correlations of the 11 indicators have significant correlations (p > 0.5). At the yield index layer, only yield was selected as the evaluation index, because SFW was controlled by human factors and had no significant response to water and fertilizer, although no correlation was observed between SFW and yield. Reducing sugars had no correlation with NIT, SP, and TSS in terms of quality indicators, but NIT was correlated with SP and TSS. Considering that NIT is a negative indicator of quality, RS and NIT were selected to represent quality indicators. In the efficiency index layer, no correlation was observed among WPP, NPP, and MPP. Therefore, these three indicators need to be included in the comprehensive evaluation system. A hierarchical model of cucumber production was established using Yaahp software(Yaahp V2.5) (Figure 5). The total target layer included three factor layers of yield, quality, and water and fertilizer utilization index, and six sub-factor layers of Y, RS, NIT, WPP, NPP, and MPP.

3.4.2. Determination of Indicator Weights

Under the AHP analytic hierarchy process, the weights of the three factor layers of yield, quality, and efficiency were 0.6, 0.3, and 0.1, respectively (Table 6). For all the subfactors, yield had the largest subjective weight, and NPP and MPP had the smallest subjective weight. Under the entropy weight method, NPP had the largest objective weight, and RS had the smallest weight. By combining the weights based on game theory, yield obtained the maximum combined weight of 0.4023, followed by NPP (Table 7).
On the basis of combination weighting based on game theory, the grey correlation model was used to calculate the difference between each treatment and the ideal treatment. As shown in Table 8, T3 ranked first, followed by T9, and T2 had the lowest comprehensive score. The results are as follows:

4. Discussion

4.1. Yield

In the experiment, water and fertilizer had no significant effect on the SFW of cucumber, mainly because the fruit size was basically the same when the cucumber was harvested according to artificial experience. Therefore, the SFW of cucumber fruit was not related to different water and fertilizer application rates.
The interaction of I * N had significant effects on cucumber yield, which was consistent with a previous study [9]. I * Mg had a significant effect on cucumber yield, because reasonable irrigation and magnesium application could promote the growth and development of plant roots, and this condition is conducive to the full absorption of water and nutrients by plant roots, which increase the sink–source ratio and the photosynthetic production capacity of source leaves, thereby increasing production [22]. As an enzyme-assisted factor and heterologous regulator, Mg can regulate the Calvin cycle by activating various enzymes, thereby increasing the dry matter accumulation of plants [23]. Therefore, I * Mg can promote the synthesis and transformation of carbohydrates in plants to a certain extent, thereby promoting plant dry matter accumulation and affecting crop yield [24].
In this experiment, under the low irrigation level (I1), the yield of T1 was the lowest, and T3 achieved the highest yield with a slight difference from T9 (the largest yield of all treatments), indicating that supplementation with nitrogen and magnesium could promote cucumber growth. Especially in low water input, N * Mg could compensate for the effect of water shortage on cucumber growth to a certain extent and promote the formation of cucumber yield, and this finding is consistent with the research results of Peng et al. [25]. This finding was obtained because magnesium affects nitrogen transport in plants [26]. Mendes et al. [27] found that magnesium is an activator of carboxylase and phosphorylase, which can promote the synthesis of chlorophyll and affect the photosynthesis of plants, promote crop nitrogen uptake, and increase plant dry matter accumulation, thereby increasing crop yield. Therefore, the reasonable application of nitrogen and magnesium fertilizer can significantly alleviate the inhibition of drought stress on plant yield.

4.2. Water and Fertilizer Utilization

Reasonable fertilization can improve crop water use efficiency, and irrigation can improve fertilizer use efficiency [28]. The I * Mg interaction had a significant indigenous effect on plant NPP. This finding was obtained because I * Mg can promote the photosynthetic capacity of plants, promote the nitrogen metabolism pathway in roots and the synthesis of related enzymes and hormones, and enhance the ability of plants to absorb nitrogen fertilizer, thereby improving plant NPP [29]. The I * N interaction had a significant interaction on MPP, and I * N could change the osmotic pressure of cells and increase the synthesis of enzymes in the photosynthetic system [30]. The appropriate amount of I * N can improve the net photosynthetic rate and the accumulation of photosynthetic assimilates, thereby promoting the absorption of magnesium by plants [31].
A synergistic effect was observed between magnesium and nitrogen, and the increase in magnesium and nitrogen can promote the utilization of water and nutrients by plants, which was consistent with our results. Mg can promote nitrogen uptake by crops [32]. Magnesium deficiency affects nitrogen transport in maize, because magnesium stress increases nitrate reductase activity and promotes the transformation of inorganic nitrogen in plants, resulting in a decrease in NPP under low-magnesium conditions [33]. In addition, low magnesium can lead to poor root development, thereby reducing the total nitrogen uptake of roots and affecting plant nitrogen accumulation. The appropriate proportion of nitrogen and magnesium fertilizer is conducive to the full absorption of water and nutrients by plant roots and promotes the crop utilization of deep soil moisture [34]. Therefore, The N * Mg interaction had significant effects on WPP, NPP, and MPP.

4.3. Quality Indicators

In the present study, magnesium had a significant effect on RS and FAA (Table 5), which was consistent with a previous study [35]. This finding was obtained because the rational application of magnesium can increase plant chlorophyll content, thereby affecting photosynthesis and promoting carbohydrate, fat, and protein synthesis [36]. Reasonable water and nitrogen application could significantly decrease the NIT content in cucumber fruit and maintain the contents of VC, TSS, FAA, and RS at a high level, which could improve the cucumber quality to a certain extent. This property can be attributed to glutamine synthetase, which is the main enzyme of ammonia assimilation in higher plants [37], and its activity affects the metabolism of amino acids and proteins in plants. Water and nitrogen interaction had significant effects on glutamine synthetase activity. At the same time, the application of nitrogen fertilizer in soil can improve the activity of N reductase and glutamine synthetase and promote the transformation to N ammonium. Therefore, the contents of RS and TSS in fruits will increase [38].
The I * Mg interaction had a very significant effect on plant quality [39], and the same results were obtained in the present study. This finding was obtained because the increase in I can promote the development of plant roots and thus affect the absorption of magnesium fertilizer by plants. The I * Mg interaction can promote the synthesis of chlorophyll, promote the synthesis and metabolism of protein and nitrate reductase in plants, promote the transportation of carbohydrates in plants, and facilitate the accumulation of antioxidant active substances and carbohydrates in fruits, thereby improving crop quality [40]. The contents of amino acids and soluble solids in plants gradually increase with the increase in nitrogen and magnesium fertilizers [41]]. In the present study, the quality indexes of cucumber under T3 treatment were higher than those under other treatments mainly because of the synergistic effect between magnesium and nitrate nitrogen [42]. The increase in magnesium application rate will promote the absorption of nitrogen in leaves and improve the quality of plants. In addition, under the condition of irrigation level I1, except for VC, the contents of all fruit quality indexes can be ranked as T3 > T1, indicating that, under water stress, more N and Mg fertilizers were helpful to improve fruit quality, which was consistent with the results of a previous study.

4.4. Comprehensive Evaluation

Considering that the optimal water and fertilizer conditions for different indicators were not the same, an evaluation system needs to be established to develop a reasonable application strategy. Cucumber production has many indicators, and the selection of indicators will affect the evaluation results. Considering that a large number of indicators would disperse the evaluation weight, correlation analysis was conducted to determine the important indexes that affect cucumber yield, quality, and water and fertilizer utilization rates for more reasonable and scientific results. Moreover, AHP analysis and the entropy method were used to determine the weight of each index, and game theory was used to calculate the optimal combination coefficient to determine the final weight, which effectively reduced the deviation of the single weighting method. The GRA model has computational efficiency and is flexible and convenient for analyzing data with a small sample size [43]. Therefore, combined weighting coupled with GRA was adopted to obtain the best treatment on the evaluation of multiple indicators, and then determine the optimal amount of irrigation, nitrogen, and magnesium to promote the comprehensive benefit of greenhouse cucumber.
For the application rate of water and fertilizer, the results of this experiment were inconsistent with previous studies, mainly because the interaction of the three factors for magnesium, irrigation, and nitrogen were investigated, and the efficiency index was considered on the basis of conventional yield and quality. Under low-irrigation conditions, increasing the input of magnesium fertilizer and nitrogen fertilizer improved the fruit quality and had no significant effect on cucumber yield reduction. Under the same irrigation conditions, increasing magnesium fertilizer can alleviate the problem of insufficient nitrogen fertilizer input, improve nitrogen use efficiency, and improve cucumber quality.

5. Conclusions

Under water stress, an appropriate increase in nitrogen and magnesium input can improve the quality of cucumber, with a slight negative effect on cucumber yield. All significant indicators for I * Mg, I * N, and N * Mg were significantly affected for cucumber yield. The increase in nitrogen application significantly improved SP and TSS but increased the risk of nitrate accumulation. The application of magnesium had a significant effect on RS and FAA. The interaction of I * Mg alleviated the inhibition of nitrogen deficiency and improved the nitrogen fertilizer productivity. The interaction of N * Mg significantly affected the yield, all the quality indicators (except VC), and the partial productivity of water and fertilizer.
Based on correlation analysis, seven indicators from three categories of yield, quality, and efficiency were selected to establish an evaluation system for cucumber production, and Y obtained the largest combined weight based on game theory. Grey correlation analysis was adopted to evaluate all the water and fertilizer combination schemes comprehensively, and the optimal scheme was irrigation of 653.7 m3/ha, nitrogen fertilizer (CH4N2O) of 1141.9 kg/ha, and magnesium fertilizer (MgSO4.7H2O) of 422.1 kg/ha, which is a recommended solution for cucumber production in Northwest China because it balances the yield, quality, and efficiency.

Author Contributions

J.L. was the main contributor to the writing of the manuscript and the conduct of the experiment; X.Y. analyzed and interpreted the data on yield; M.Z. analyzed and interpreted the data on quality; D.L. analyzed and interpreted the data on water and fertilizer use efficiency; Y.J. carried out a comprehensive evaluation of all the data; W.Y. was the main contributor to the introduction of the manuscript; and Z.Z. was the supervisor of the experiment design and the writing of the manuscript. All authors have read and agreed to the published version of the manuscript.

Funding

Scientific and Technological Innovative Research Team of Shaanxi in China (2021TD-34), the Agricultural Science and Technology Innovation Project of Shaanxi in China (NYKJ-2021-YL(XN)04), Key Research and development program of Shaanxi Province in China (2023-YBNY-275), and the Xi’an Science and Technology Program in China (21NYYF0031).

Institutional Review Board Statement

Not applicable.

Informed Consent Statement

Not applicable.

Data Availability Statement

The datasets generated and/or analyzed during the current study are available from the corresponding author upon reasonable request.

Acknowledgments

We are grateful to the research grants from Scientific and Technological Innovative Research Team of Shaanxi in China (2021TD-34), the Agricultural Science and Technology Innovation Project of Shaanxi in China (NYKJ-2021-YL(XN)04), Key Research and development program of Shaanxi Province in China (2023-YBNY-275), and the Xi’an Science and Technology Program in China (21NYYF0031).

Conflicts of Interest

No conflict of interest exists in the submission of this manuscript, and manuscript is approved by all co-authors for sub-mission/publication.

References

  1. Van Vuuren, D.P.; Bijl, D.L.; Bogaart, P.; Stehfest, E.; Biemans, H.; Dekker, S.C.; Doelman, J.C.; Gernaat, D.E.; Harmsen, M. Integrated scenarios to support analysis of the food–energy–water nexus. Nat. Sustain. 2019, 2, 1132–1141. [Google Scholar] [CrossRef]
  2. Chen, H.; Zhang, Y.P. New biorefineries and sustainable agriculture: Increased food, biofuels, and ecosystem security. Renew. Sustain. Energy Rev. 2015, 47, 117–132. [Google Scholar] [CrossRef]
  3. Rahil, M.H.; Qanadillo, A. Effects of different irrigation regimes on yield and water use efficiency of cucumber crop. Agric. Water Manag. 2015, 148, 10–15. [Google Scholar] [CrossRef]
  4. Maris, S.C.; Teira-Esmatges, M.R.; Arbonés, A.; Rufat, J. Effect of irrigation, nitrogen application, and a nitrification inhibitor on nitrous oxide, carbon dioxide and methane emissions from an olive (olea europaea l.) Orchard. Sci. Total Environ. 2015, 538, 966–978. [Google Scholar] [CrossRef]
  5. Tian, X.; He, D.; Bai, S.; Zeng, W.; Wang, Z.; Wang, M.; Wu, L.; Chen, Z. Physiological and molecular advances in magnesium nutrition of plants. Plant Soil. 2021, 468, 1–17. [Google Scholar] [CrossRef]
  6. Karley, A.J.; White, P.J. Moving cationic minerals to edible tissues: Potassium, magnesium, calcium. Curr. Opin. Plant Biol. 2009, 12, 291–298. [Google Scholar] [CrossRef]
  7. Tewari, R.K.; Kumar, P.; Sharma, P.N. Magnesium deficiency induced oxidative stress and antioxidant responses in mulberry plants. Sci. Hortic. 2006, 108, 7–14. [Google Scholar] [CrossRef]
  8. Apple, J.K.; Maxwell, C.V.; Derodas, B.; Watson, H.B.; Johnson, Z.B. Effect of magnesium mica on performance and carcass quality of growing-finishing swine. J. Anim. Sci. 2000, 78, 2135–2143. [Google Scholar] [CrossRef]
  9. Shahrokhnia, M.H.; Sepaskhah, A.R. Effects of irrigation strategies, planting methods and nitrogen fertilization on yield, water and nitrogen efficiencies of safflower. Agric. Water Manag. 2016, 172, 18–30. [Google Scholar] [CrossRef]
  10. Ding, W.; Xu, X.; He, P.; Zhang, J.; Cui, Z.; Zhou, W. Estimating regional n application rates for rice in china based on target yield, indigenous n supply, and n loss. Environ. Pollut. 2020, 263, 114408. [Google Scholar] [CrossRef]
  11. Shalit, M.; Katzir, N.; Tadmor, Y.; Larkov, O.; Burger, Y.; Shalekhet, F.; Lastochkin, E.; Ravid, U.; Amar, O.; Edelstein, M. Acetyl-coa: Alcohol acetyltransferase activity and aroma formation in ripening melon fruits. J. Agric. Food Chem. 2001, 49, 794–799. [Google Scholar] [CrossRef]
  12. Akubor, P.I.; Ogbadu, R.L. Effects of processing methods on the quality and acceptability of melon milk. Plant Foods Hum. Nutr. 2003, 58, 1–6. [Google Scholar]
  13. Sundriyal, M.; Sundriyal, D.C. Wild edible plants of the sikkim himalaya: Nutritive values of selected species. Econ. Bot. 2001, 55, 377–390. [Google Scholar] [CrossRef]
  14. Zhu, Y.; Luo, Y.; Wang, P.; Zhao, M.; Li, L.; Hu, X.; Chen, F. Simultaneous determination of free amino acids in pu-erh tea and their changes during fermentation. Food Chem. 2016, 194, 643–649. [Google Scholar] [CrossRef]
  15. Colla, G.; Kim, H.; Kyriacou, M.C.; Rouphael, Y. Nitrate in fruits and vegetables. Sci. Hortic. 2018, 237, 221–238. [Google Scholar] [CrossRef]
  16. Zhu, X.; Zhang, Y.; Hou, Y.; Jiang, M. Evaluation and analysis of land input-output comprehensive benefit based on fuzzy mathematics and analytic hierarchy process. Adv. Math. Phys. 2022, 2022, 1–10. [Google Scholar] [CrossRef]
  17. Wang, H.; Xu, C.; Xu, Z. An approach to evaluate the methods of determining experts’ objective weights based on evolutionary game theory. Knowl. Based Syst. 2019, 182, 104862. [Google Scholar] [CrossRef]
  18. Marden, J.R.; Shamma, J.S. Game Theory and Distributed Control, Handbook of Game Theory with Economic Applications; Elsevier: Amsterdam, The Netherlands, 2015; pp. 861–899. [Google Scholar]
  19. Wu, F.; Wei, C.; Zhang, B. A yarn nep prediction method combining grey correlation and nearest neighbour. J. Inf. Knowl. Manag. 2022, 21, 2250052. [Google Scholar] [CrossRef]
  20. Xia, X.; Sun, Y.; Wu, K.; Jiang, Q. Optimization of a straw ring-die briquetting process combined analytic hierarchy process and grey correlation analysis method. J. Fuel Process. Technol. 2016, 152, 303–309. [Google Scholar] [CrossRef]
  21. Chen, Y. Survey on influence of maritime port cluster effect on offshore reginal economy based on grey correlation model. J. Coast. Res. 2019, 94, 707–711. [Google Scholar] [CrossRef]
  22. Luo, W.; Yang, S.; Khan, M.A.; Ma, J.; Xu, W.; Li, Y.; Xiang, Z.; Jin, G.; Jia, J.; Zhong, B. Mitigation of cd accumulation in rice with water management and calcium-magnesium phosphate fertilizer in field environment. Environ. Geochem. Health 2020, 42, 3877–3886. [Google Scholar] [CrossRef]
  23. Shaul, O. Magnesium transport and function in plants: The tip of the iceberg. Biometals 2002, 15, 307–321. [Google Scholar] [CrossRef]
  24. Verbruggen, N.; Hermans, C. Physiological and molecular responses to magnesium nutritional imbalance in plants. Plant Soil. 2013, 368, 87–99. [Google Scholar] [CrossRef]
  25. Peng, W.T.; Qi, W.L.; Nie, M.M.; Xiao, Y.B.; Liao, H.; Chen, Z.C. Magnesium supports nitrogen uptake through regulating nrt2. 1/2.2 in soybean. Plant Soil. 2020, 457, 97–111. [Google Scholar] [CrossRef]
  26. Grzebisz, W. Crop response to magnesium fertilization as affected by nitrogen supply. Plant Soil. 2013, 368, 23–39. [Google Scholar] [CrossRef]
  27. Mendes, K.R.; Marenco, R.A. Photosynthetic traits of tree species in response to leaf nutrient content in the central amazon. Theor. Exp. Plant Physiol. 2015, 27, 51–59. [Google Scholar] [CrossRef]
  28. Ye, T.; Ma, J.; Zhang, P.; Shan, S.; Liu, L.; Tang, L.; Cao, W.; Liu, B.; Zhu, Y. Interaction effects of irrigation and nitrogen on the coordination between crop water productivity and nitrogen use efficiency in wheat production on the north china plain. Agric. Water Manag. 2022, 271, 107787. [Google Scholar] [CrossRef]
  29. Bagheri, N.; Yazdanpanah, N.; Sedaghati, N. Effect of different levels of magnesium in irrigation water on growth parameters of two pistachio bases. Qual. Durab. Agric. Prod. Food Stuffs 2021, 1, 65–71. [Google Scholar]
  30. Zamora-Re, M.I.; Dukes, M.D.; Hensley, D.; Rowland, D.; Graham, W. The effect of irrigation strategies and nitrogen fertilizer rates on maize growth and grain yield. Irrig. Sci. 2020, 38, 461–478. [Google Scholar] [CrossRef]
  31. Chen, Z.; Li, Y.; Zhang, X.; Xiong, Y.; Huang, Q.; Jin, S.; Shijun, S.; Daocai, C.; Huang, G. Effects of lignite bioorganic product on sunflower growth, water and nitrogen productivity in saline-sodic farmlands at northwest china. Agric. Water Manag. 2022, 271, 107806. [Google Scholar] [CrossRef]
  32. Shi, J.; Wang, Y.; Li, Z.; Huang, X.; Shen, T.; Zou, X. Simultaneous and nondestructive diagnostics of nitrogen/magnesium/potassium-deficient cucumber leaf based on chlorophyll density distribution features. Biosyst. Eng. 2021, 212, 458–467. [Google Scholar] [CrossRef]
  33. Yin, S.; Ze, Y.; Liu, C.; Li, N.; Zhou, M.; Duan, Y.; Hong, F. Cerium relieves the inhibition of nitrogen metabolism of spinach caused by magnesium deficiency. Biol. Trace Elem. Res. 2009, 132, 247–258. [Google Scholar] [CrossRef] [PubMed]
  34. Li, Y.; Xu, X.; Lei, B.; Zhuang, J.; Zhang, X.; Hu, C.; Cui, J.; Liu, Y. Magnesium-nitrogen co-doped carbon dots enhance plant growth through multifunctional regulation in photosynthesis. Chem. Eng. J. 2021, 422, 130114. [Google Scholar] [CrossRef]
  35. Cole, J.C.; Smith, M.W.; Penn, C.J.; Cheary, B.S.; Conaghan, K.J. Nitrogen, phosphorus, calcium, and magnesium applied individually or as a slow release or controlled release fertilizer increase growth and yield and affect macronutrient and micronutrient concentration and content of field-grown tomato plants. Sci. Hortic. 2016, 211, 420–430. [Google Scholar] [CrossRef]
  36. Li, J.; Yokosho, K.; Liu, S.; Cao, H.R.; Yamaji, N.; Zhu, X.G.; Liao, H.; Ma, J.F.; Chen, Z.C. Diel magnesium fluctuations in chloroplasts contribute to photosynthesis in rice. Nat. Plants 2020, 6, 848–859. [Google Scholar] [CrossRef]
  37. Wang, Z.H.; Li, S.X.; Malhi, S. Effects of fertilization and other agronomic measures on nutritional quality of crops. J. Sci. Food Agric. 2008, 88, 7–23. [Google Scholar] [CrossRef]
  38. Plett, D.C.; Ranathunge, K.; Melino, V.J.; Kuya, N.; Uga, Y.; Kronzucker, H.J. The intersection of nitrogen nutrition and water use in plants: New paths toward improved crop productivity. J. Exp. Bot. 2020, 71, 4452–4468. [Google Scholar] [CrossRef]
  39. Guo, W.; Nazim, H.; Liang, Z.; Yang, D. Magnesium deficiency in plants: An urgent problem. Crop J. 2016, 4, 83–91. [Google Scholar] [CrossRef]
  40. Thalooth, A.T.; Tawfik, M.M.; Mohamed, H.M. A comparative study on the effect of foliar application of zinc, potassium and magnesium on growth, yield and some chemical constituents of mungbean plants grown under water stress conditions. World J. Agric. Sci. 2006, 2, 37–46. [Google Scholar]
  41. Potarzycki, J. Influence of nitrogen and magnesium fertilization at the flag leaf stage of winter wheat development on the yield and grain quality. Nawozy I Nawożenie 2008, 32, 100–110. [Google Scholar]
  42. Qian, Y.D.; Zuo, Y.H.; Zheng, G.P.; Li, X.L.; Ma, Y.; Zhao, F.L. Effects of nitrogen and magnesium coupling on commercial qualities of the early japonica longjing20 in cold region. J. Nucl. Agric. Sci. 2013, 27, 118–125. [Google Scholar]
  43. Tan, R.; Yang, L.; Chen, S.; Zhang, W. Decision-making method based on game theory and grey theory in a single-value neutrosophic environment and its application to typhoon disaster assessment. Grey Syst. Theory Appl. 2021, 12, 595–623. [Google Scholar] [CrossRef]
Figure 1. Meteorological data of cucumber during growing seasons: light (hv), relative humidity (RH), and temperature.
Agronomy 13 00772 g001
Figure 2. Single fruit weight (a) and yield (b) for each treatment under different water and fertilizer treatments. Note: Error bars indicate standard error of the mean (n = 3). Different letters for each column represent significant differences between treatments according to Duncan’s analysis at p < 0.05.
Agronomy 13 00772 g002
Figure 3. WPP, NPP, and MPP under different treatments. Note: Error bars indicate standard error of the mean (n = 3). Different letters for each column represent significant differences between treatments according to Duncan’s analysis at p < 0.05.
Agronomy 13 00772 g003
Figure 4. Correlation coefficients among yield, quality, and fertilizer utilization rate. Note: * indicate significance levels at p ≤ 0.05, respectively.
Agronomy 13 00772 g004
Figure 5. Substructure model of cucumber AHP analytic hierarchy process.
Agronomy 13 00772 g005
Table 1. Nutrients and physical properties of soil foundation.
Bulk Density
(g/m3)
pHPorosity (%)Saturated Moisture (%)Available Nitrogen (mg/kg)Available Phosphorus
(mg/kg)
Available Potassium (mg/kg)Available
Calcium
(g/kg)
Available
Magnesium
(g/kg)
Organic Matter
(g/kg)
1.27.245.835.826.034.7229.94.60.78.9
Table 2. Designed variable levels and codes of experimental factors.
FactorIntervalsDesigned Variable Levels and Codes Ear Codes
123
Irrigation (m3/ha)217.9653.7871.61089.5
Nitrogen (kg/ha)228.4685.1913.51141.9
Magnesium (kg/ha)84.4253.3337.7422.1
Note: Irrigation, nitrogen, and magnesium are the amounts of H2O, CH4N2O, and MgSO4.7H2O that should be applied, respectively.
Table 3. The application amounts of water and fertilizer of treatments.
TreatmentsWater and Fertilizer Application Amounts
Irrigation (m3/ha)Nitrogen (kg/ha)Magnesium (kg/ha)
T1 (1,1,1)653.7685.1253.3
T2 (1,2,2)653.7913.5337.7
T3 (1,3,3)653.71141.9422.1
T4 (2,1,2)871.6685.1337.7
T5 (2,2,3)871.6913.5422.1
T6 (2,3,1)871.61141.9253.3
T7 (3,1,3)1089.5685.1422.1
T8 (3,2,1)1089.5913.5253.3
T9 (3,3,2)1089.51141.9337.7
Note: Nitrogen fertilizer refers to CH4N2O; 1 kg of CH4N2O contains 0.47 kg of N. Magnesium fertilizer refers to MgSO4.7H2O; 1 kg of MgSO4.7H2O contains 0.098 kg of Mg.
Table 4. Three-way analysis of variance (ANOVA) for indicators from yield of cucumber under the combined application of nitrogen, magnesium, and irrigation.
FactorsSFW (g)Y (kg/ha)WPP (kg/m3)NPP (kg/kg)MPP (kg/kg)
Ins*********
I1179.56 a65,439.92 b100.11 a61.12 c 165.33 c
I2182.74 a72,085.50 b82.70 b69.78 b184.90 b
I3183.30 a83,033.29 a76.21 b79.43 a213.39 a
Nns*****ns
N1181.05 a70,240.49 b81.81 b87.23 a178.49 a
N2178.91 a70,391.33 b82.39 b66.11 b187.26 a
N3185.64 a79,926.89 a94.83 a57.00 b197.88 a
Mgnsnsnsns***
Mg1184.56 a70,376.89 a82.25 a62.64 a219.83 a
Mg2179.91 a72,606.61 a84.17 a70.28 a184.39 b
Mg3181.13 a77,575.21 a92.60 a77.42 a159.40 c
I * Nns***nsns***
I * Mgns***ns***ns
N * Mgns******
Note: *, **, and *** indicate significance levels at p ≤ 0.05, p < 0.01, and p < 0.001, respectively; ns denotes that differences were not significant. Different letters for each column represent significant differences between treatments according to Duncan’s analysis at p < 0.05.
Table 5. Three-way analysis of variance (ANOVA) for indicators from quality of cucumber under the combined application of nitrogen, magnesium, and irrigation and quality of cucumber under different treatments.
FactorsRS (mg/g)FAA (μg/g)NIT (μg/g)VC (mg/100g)SP (mg/g)TSS (%)
I**************ns
I17.83 a2297.83 a1062.91 a11.51 a0.27 a3.74 a
I27.46 b2190.41 a959.78 b11.12 a0.24 b3.75 a
I36.59 c1905.96 b892.33 c9.57 b0.23 b3.74 a
Nnsns***ns****
N17.22 a2093.04 a887.44 c10.99 a0.22 b3.62 b
N27.34 a2197.05 a964.02 b10.68 a0.25 a3.75 ab
N37.31 a2104.11 a1063.56 a10.53 a0.26 a3.86 a
Mg****nsnsnsns
Mg16.63 c1993.71 b953.67 a10.53 a0.24 a3.76 a
Mg27.36 b2190.61 a967.47 a10.84 a0.25 a3.70 a
Mg37.89 a2209.89 a993.89 a10.82 a0.25 a3.78 a
I * N****ns***ns*
I * Mgnsns**nsns
N * Mg******ns****
T17.11 c2138.70 bcd981.00 b11.78 a0.24 abc3.65 bc
T28.00 ab2415.75 a1041.06 b11.40 ab0.26 ab3.69 abc
T38.35 a2339.04 ab1166.66 a11.34 ab0.28 a3.88 a
T47.36 bc2201.26 abc861.00 c11.43 ab0.21 bc3.57 c
T58.13 a2351.46 ab994.66 b11.36 ab0.26 ab3.81 ab
T66.89 c2018.48 cde1023.66 b10.54 bc0.24 abc3.87 a
T77.19 c1939.14 de820.33 c9.73 cd0.20 c3.64 bc
T85.88 d1823.93 e856.33 c9.26 d0.21 bc3.73 abc
T96.69 c1954.81 de1000.33 b9.68 cd0.25 abc3.83 ab
Note: *, **, and *** indicate significance levels at p ≤ 0.05, p < 0.01, and p < 0.001, respectively; ns denotes that differences were not significant. Different letters for each column represent significant differences between treatments according to Duncan’s analysis at p < 0.05.
Table 6. Pair-wise comparison matrixes and weights from AHP (analytic hierarchy process).
Judgment MatrixLocal WeightUltimate WeightConsistency Test Parameter
General goal A-Rule hierarchy BIndexC1C2C3WAXACR = 0
C11.0000.8006.0000.60000.6000λmax = 3.000
C20.5001.0003.0000.30000.3000
C30.1671.0001.0000.10000.1000
Rule hierarchy B1-index hierarchy CIndexC11 WB1XB2CR = 0
C111.000 1.00000.4000λmax = 1.000
Rule hierarchy B2-index hierarchy CIndexC21C22 WB2XB2CR=0
C211.0001.000 0.50000.5000λmax = 2.000
C221.0001.000 0.50000.1500
Rule hierarchy B3-index hierarchy CIndexC31C32C33WB3XB3CR = 0
C311.0001.2001.0000.37500.0375λmax = 3.000
C320.8331.0001.0000.31300.0313
C331.0001.0001.0000.31300.0313
CR is the matrix consistency check coefficient (R < 0.1); WA represents the importance weight of the corresponding elements in B layer to target layer A, which is local weight; WB1 and WB2 are analogous; XA represents the final importance weight of the corresponding elements in B layer to the total target, XB1 and XB2 are analogous; λmax is the maximum eigenvalue. B1, B2 and B3 represent yield index, quality index and water and fertilizer utilization index, respectively. C11, C21, C22, C31, C32, and C33 represent Y, RS, NIT, WPP, NPP, and MPP, respectively.
Table 7. Weight calculation results of AHP, entropy weight method, and combined weighting method based on game theory.
IndexYRSNITWPPNPPMPP
subjective weights0.60000.15000.15000.03750.03130.0313
objective weights0.11330.07440.08050.14970.36020.2217
combination weights0.40230.11920.12180.08300.16490.1086
Note: subjective weights represent the weight of each indicator under the AHP weighting method; objective weights represents the weight of each indicator under the entropy weighting method; and combination weight represents the weight of each indicator under the combined weighting method.
Table 8. Overall rating ranking by treatment.
TreatmentP+P−ProximityRanking
10.64630.80140.44648
20.64020.85810.42729
30.76140.71090.51711
40.65340.76270.46147
50.66330.77300.46186
60.69320.74600.48164
70.72600.74430.49373
80.69730.76000.47845
90.75130.71030.51402
Disclaimer/Publisher’s Note: The statements, opinions and data contained in all publications are solely those of the individual author(s) and contributor(s) and not of MDPI and/or the editor(s). MDPI and/or the editor(s) disclaim responsibility for any injury to people or property resulting from any ideas, methods, instructions or products referred to in the content.

