
Soil Management Strategies in Organic Almond Orchards: Implications for Soil Rehabilitation and Nut Quality

 , ,
, ,  , ,
, ,  ,
,  , ,
, ,
Abstract
:1. Introduction
2. Materials and Methods
2.1. Study Area
2.2. Experimental Design
2.3. Soil Sampling and Analysis
2.3.1. Soil Physical Properties
2.3.2. Soil Chemical Properties and Microbial Activity
2.4. Foliar Sampling and Analysis
2.5. Yield and Physico-Chemical Analysis of Almonds
2.5.1. Moisture Content, Water Activity, Textural Analysis, and Instrumental Color
2.5.2. Organic Acids and Sugars
2.5.3. Determination of Total Polyphenols and Antioxidant Activity
2.5.4. Fatty Acids Analysis
2.6. Statistical Analysis
3. Results and Discussion
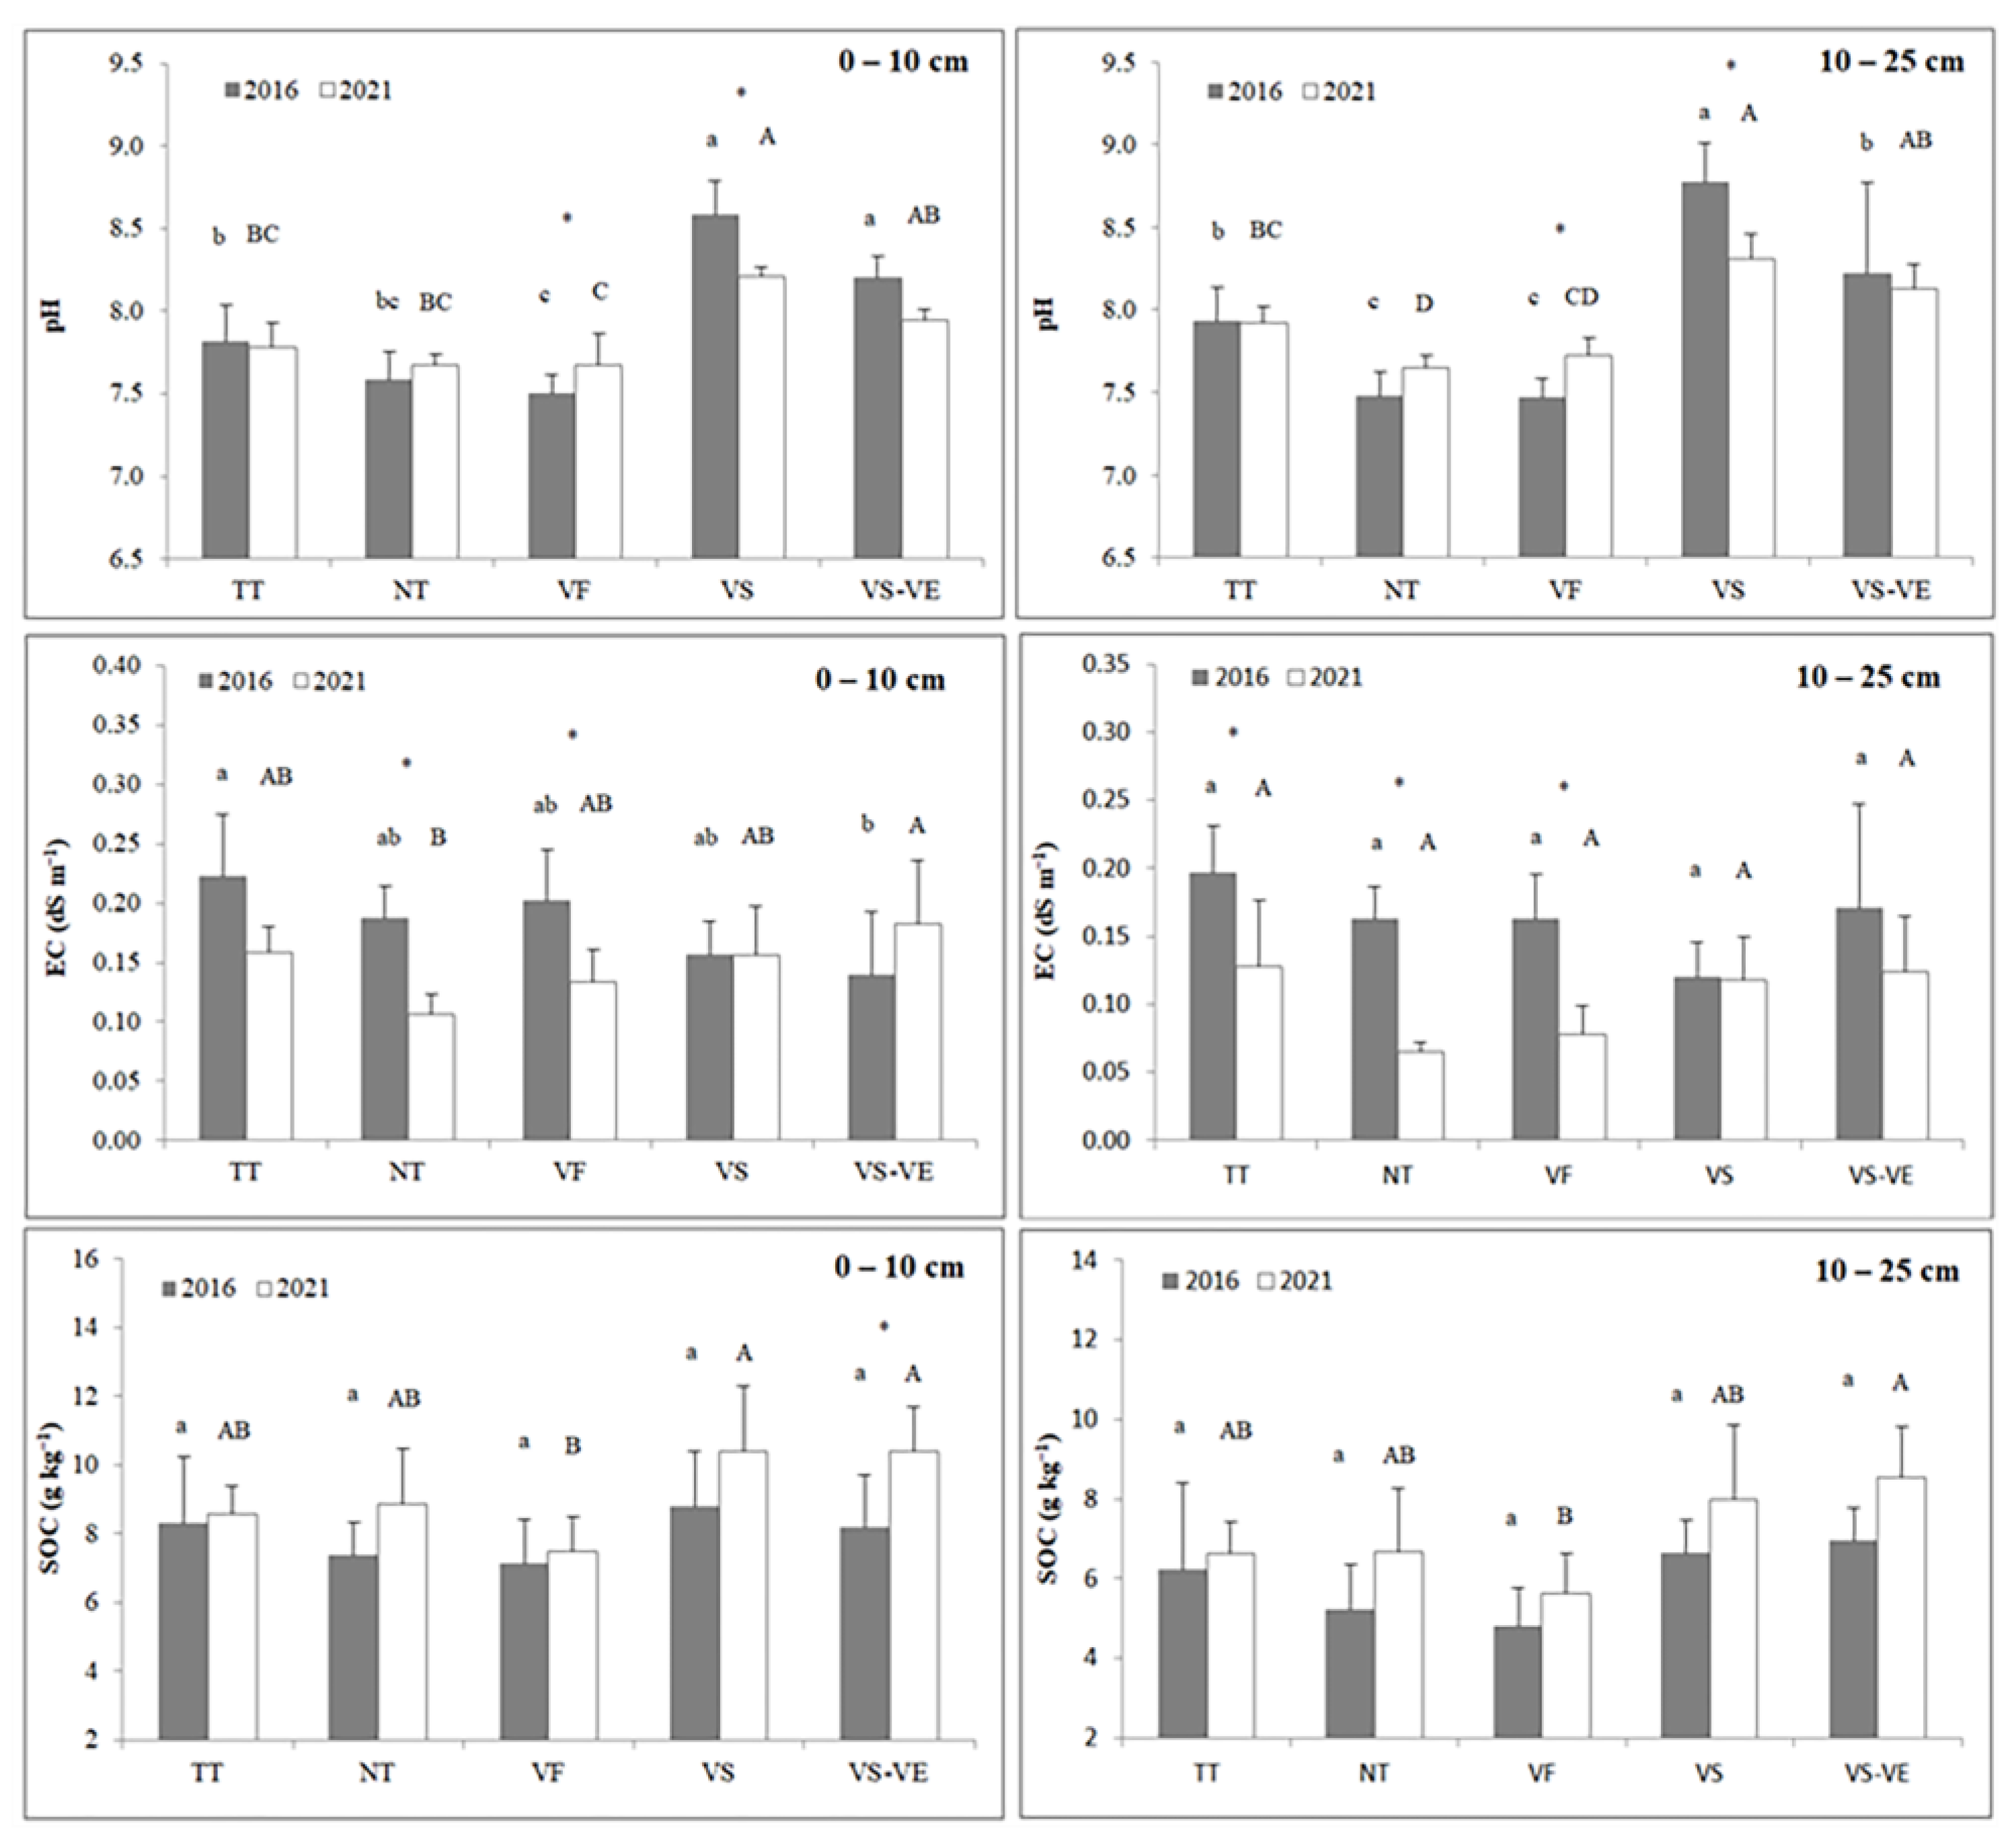
3.1. Soil Physical Properties
3.2. Soil Bio-Chemical Properties
3.2.1. Soil Macro and Micronutrients
3.2.2. Soil Microbial Activity
3.3. Foliar Analysis
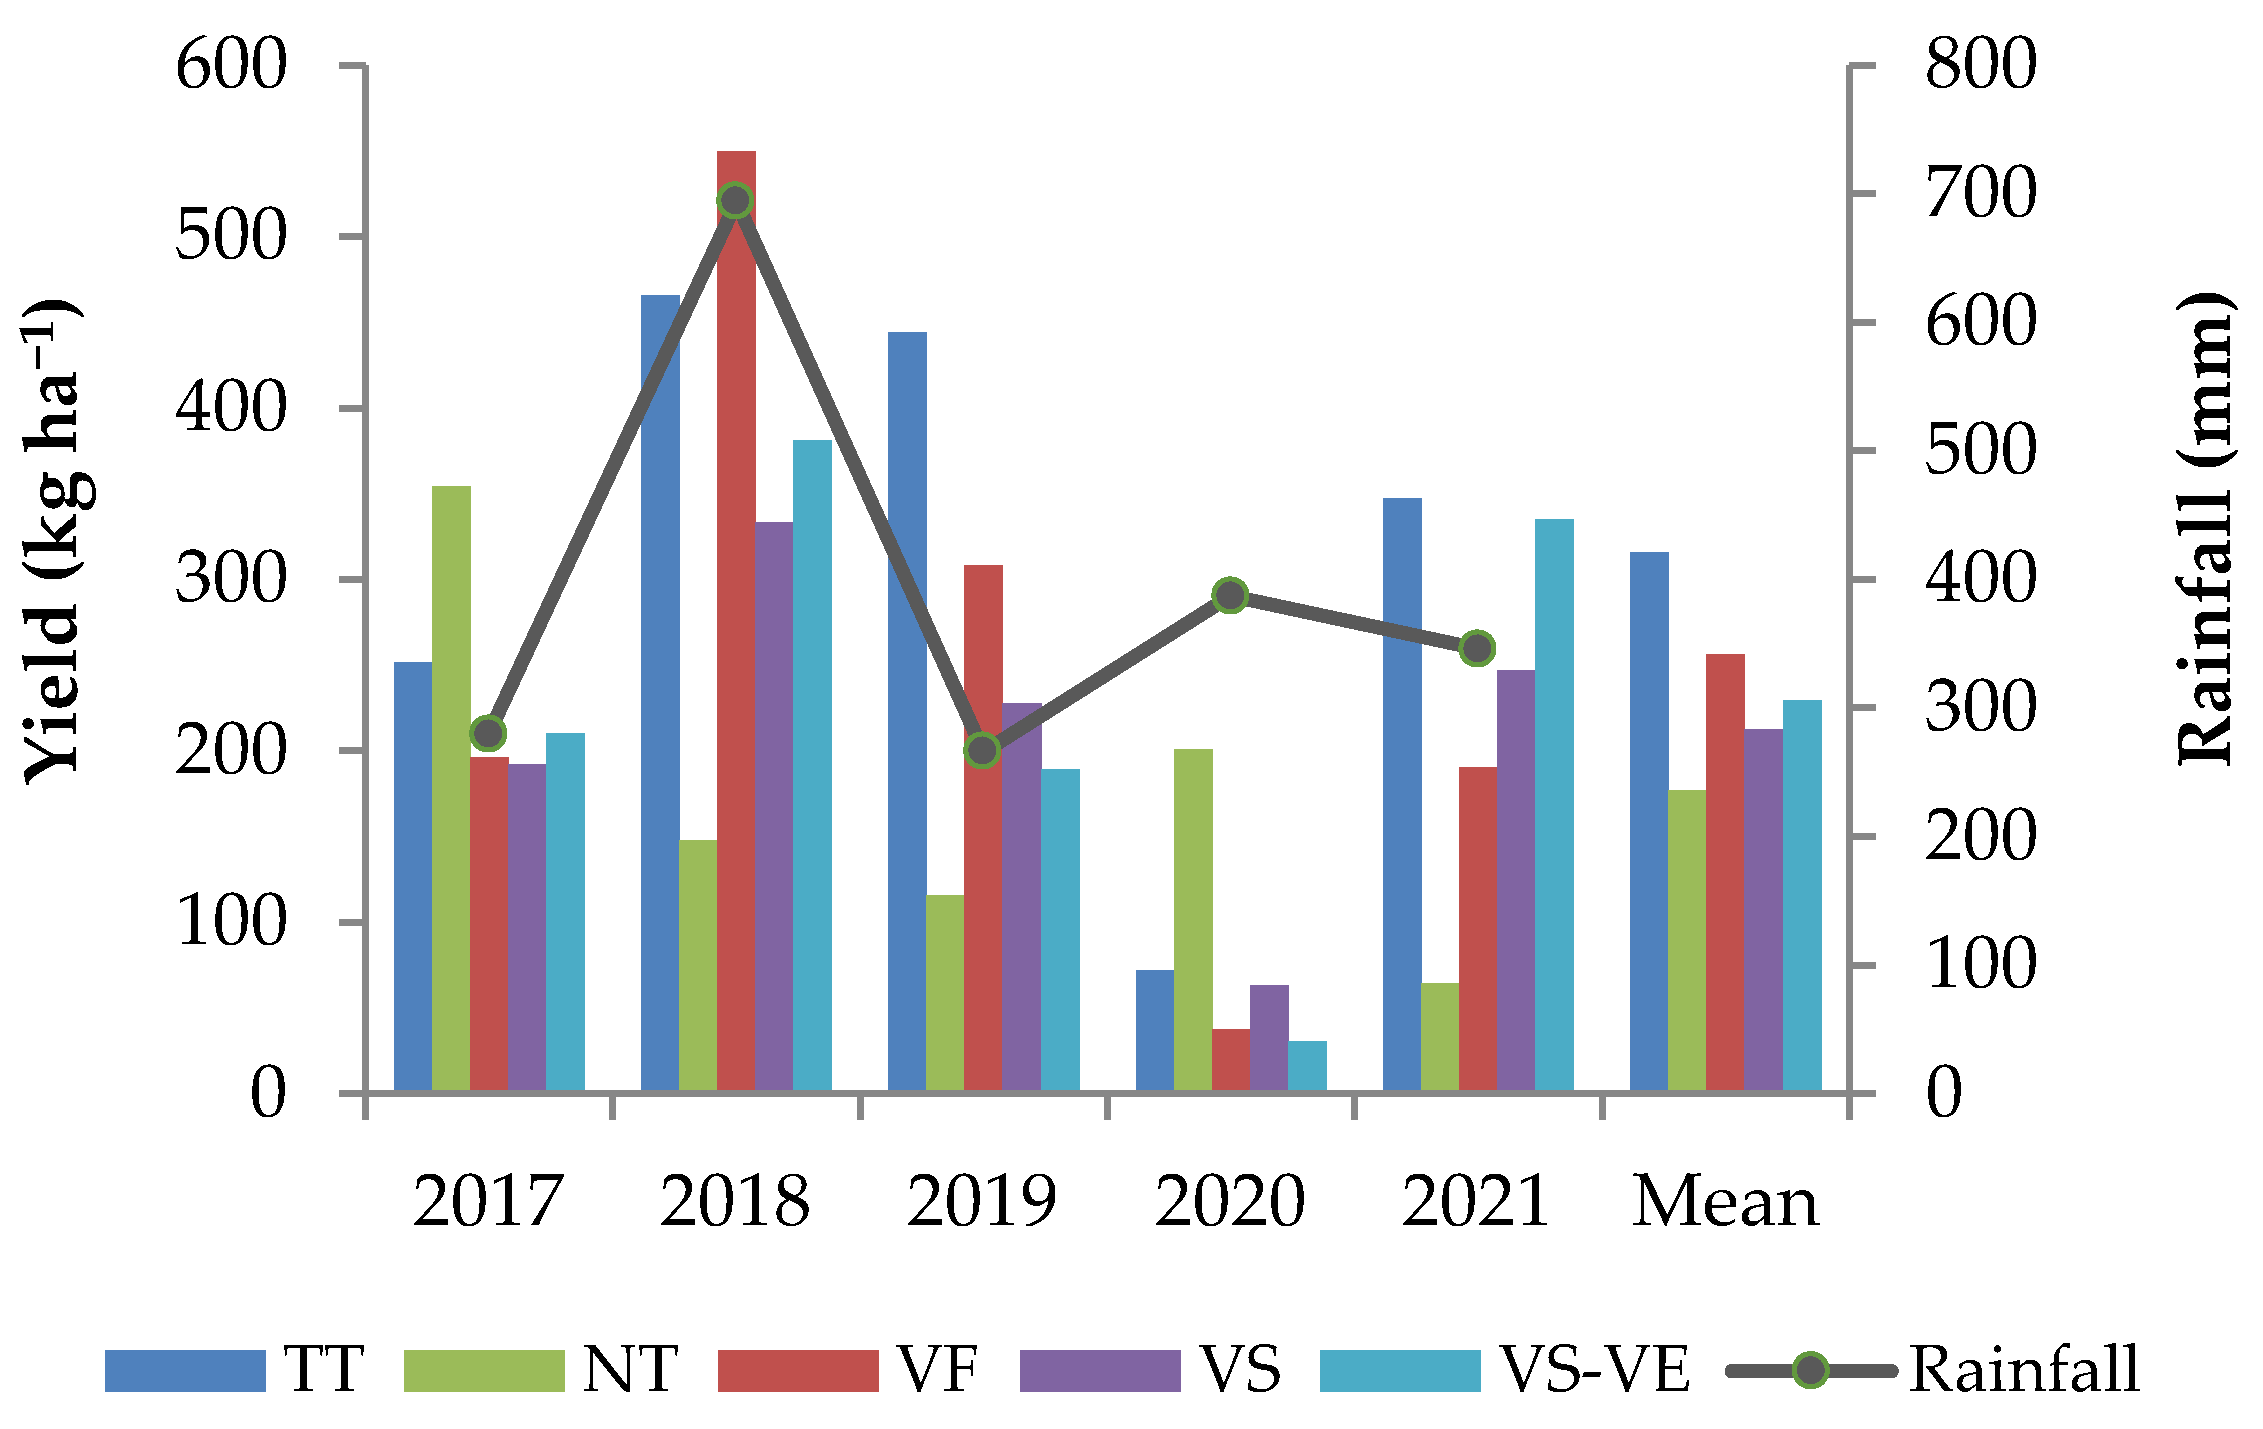
3.4. Almond Yield and Quality
Almond Quality Parameters
4. Conclusions
Author Contributions
Funding
Data Availability Statement
Conflicts of Interest
References
- Belnap, J.; Broadhurs, L.; Brochier, V.; Isbell, F.; Meyfroidt, P.; Moreira, F.; Nieminen, T.M.; Okuro, T.; Rodrigues, R.R.; Saxena, V. Direct and indirect drivers of land degradation and restoration. In The IPBES Assessment Report on Land Degradation and Restoration; IPBES: Bonn, Germany, 2018; Available online: https://www.ipbes.net/assessment-reports/ldr (accessed on 10 November 2022).
- Mirzabaev, A.; Nkonya, E.; Goedecke, J.; Johnson, T.; Anderson, W. Global drivers of land degradation and improvement. In Economics of Land Degradation and Improvement—A Global Assessment for Sustainable Development; Nkonya, E., Mirzabaev, A., von Braun, J., Eds.; Springer: Cham, Switzerland, 2016; pp. 167–195. [Google Scholar] [CrossRef] [Green Version]
- Eswaran, H.; Lal, R.; Reich, P.F. Land degradation: An overview. In Responses to Land Degradation; CRC Press: Boca Raton, FL, USA, 2001; pp. 20–35. [Google Scholar]
- Le, Q.B.; Nkonya, E.; Mirzabaev, A. Biomass Productivity-Based Mapping of Global Land Degradation Hotspots. In Economics of Land Degradation and Improvement—A Global Assessment for Sustainable Development; Nkonya, E., Mirzabaev, A., von Braun, J., Eds.; Springer: Cham, Switzerland, 2016; pp. 55–84. [Google Scholar] [CrossRef] [Green Version]
- European Commission. Caring for Soil is Caring for Life; European Commission, Directorate-General for Research and Innovation: Brussels, Belgium, 2020; Available online: https://data.europa.eu/doi/10.2777/918775 (accessed on 19 September 2022).
- Guerra, C.A.; Maes, J.; Geijzendorffer, I.; Metzger, M.J. An assessment of soil erosion prevention by vegetation in Mediterranean Europe: Current trends of ecosystem service provision. Ecol. Indic. 2016, 60, 213–222. [Google Scholar] [CrossRef]
- Martínez-Murillo, J.F.; Remond, R.; Ruiz-Sinoga, J.D. Validation of RUSLE K factor using aggregate stability in contrasted mediterranean eco-geomorphological landscapes (southern Spain). Environ. Res. 2020, 183, 109160. [Google Scholar] [CrossRef] [PubMed]
- Ramos, M.E.; Robles, A.B.; Sánchez-Navarro, A.; González-Rebollar, J.L. Soil responses to different management practices in rainfed orchards in semiarid environments. Soil Tillage Res. 2011, 112, 85–91. [Google Scholar] [CrossRef]
- Durán, Z.V.H.; Francia, M.J.R.; García, T.I.F.; Cuadros, T.S. Implications of land-cover types for soil erosion on semiarid mountain slopes: Towards sustainable land use in problematic landscapes. Acta Ecol. Sin. 2013, 33, 272–281. [Google Scholar] [CrossRef]
- García-Ruiz, J.M.; Nadal-Romero, E.; Lana-Renault, N.; Beguería, S. Erosion in Mediterranean landscapes: Changes and future challenges. Geomorphology 2013, 198, 20–36. [Google Scholar] [CrossRef] [Green Version]
- Lagacherie, P.; Álvaro-Fuentes, J.; Annabi, M.; Bernoux, M.; Bouarfa, S.; Douaoui, A.; Grünberger, O.; Hammani, A.; Montanarella, L.; Mrabet, R.; et al. Managing Mediterranean soil resources under global change: Expected trends and mitigation strategies. Reg. Environ. Chang. 2018, 18, 663–675. [Google Scholar] [CrossRef]
- Diodato, N.; Bellocchi, G.; Romano, N.; Chirico, G.B. How the aggressiveness of rainfalls in the Mediterranean lands is enhanced by climate change. Clim. Chang. 2011, 108, 591. [Google Scholar] [CrossRef]
- Hoerling, M.; Eischeid, J.; Perlwitz, J.; Quan, X.; Zhang, T.; Pegion, P. On the increased frequency of mediterranean drought. J. Clim. 2012, 25, 2146–2161. [Google Scholar] [CrossRef] [Green Version]
- Giannakopoulos, C.; Le Sager, P.; Bindi, M.; Moriondo, M.; Kostopoulou, E.; Goodess, C.M. Climatic changes and associated impacts in the Mediterranean resulting from a 2 °C global warming. Glob. Planet. Chang. 2009, 68, 209–224. [Google Scholar] [CrossRef]
- Olesen, J.E.; Trnka, M.; Kersebaum, K.C.; Skjelvåg, A.O.; Seguin, B.; Peltonen-Sainio, P.; Rossi, F.; Kozyra, J.; Micale, F. Impacts and adaptation of European crop production systems to climate change. Eur. J. Agron. 2011, 34, 96–112. [Google Scholar] [CrossRef]
- Ray, D.K.; Gerber, J.S.; MacDonald, G.K.; West, P.C. Climate variation explains a third of global crop yield variability. Nat. Commun. 2015, 6, 5989. [Google Scholar] [CrossRef] [PubMed] [Green Version]
- Panagos, P.; Standardi, G.; Borrelli, P.; Lugato, E.; Montanarella, L.; Bosello, F. Cost of agricultural productivity loss due to soil erosion in the European Union: From direct cost evaluation approaches to the use of macroeconomic models. Land Degrad. Dev. 2018, 29, 471–484. [Google Scholar] [CrossRef]
- Bodner, G.; Nakhforoosh, A.; Kaul, H.P. Management of crop water under drought: A review. Agron. Sustain. Dev. 2015, 35, 401–442. [Google Scholar] [CrossRef]
- Hamidov, A.; Helming, K.; Bellocchi, G.; Bojar, W.; Dalgaard, T.; Ghaley, B.B.; Hoffmann, C.; Holman, I.; Holzkämper, A.; Krzeminska, D.; et al. Impacts of climate change adaptation options on soil functions: A review of European case-studies. Land Degrad. Dev. 2018, 29, 2378–2389. [Google Scholar] [CrossRef] [Green Version]
- López-Vicente, M.; Álvarez, S. Stability and patterns of topsoil water content in rainfed vineyards, olive groves, and cereal fields under different soil and tillage conditions. Agric. Water Manag. 2018, 201, 167–176. [Google Scholar] [CrossRef]
- Morugán-Coronado, A.; Linares, C.; Gómez-López, M.D.; Faz, A.; Zornoza, R. The impact of intercropping, tillage and fertilizer type on soil and crop yield in fruit orchards under Mediterranean conditions: A meta-analysis of field studies. Agric. Syst. 2020, 178, 102736. [Google Scholar] [CrossRef]
- Cárceles, R.B.; Durán, Z.V.H.; Soriano, R.M.; Cermeño, S.P.; Gálvez, R.B.; Carbonell, B.R.M.; Ordoñez, F.R.; García, T.I.F. Soil and water conservation measures for mediterranean fruit crops in rainfed hillslopes. In Resources Use Efficiency in Agriculture; Kumar, S., Meena, R.S., Jhariya, M.K., Eds.; Springer: Singapore, 2020; pp. 427–480. [Google Scholar] [CrossRef]
- Meerkerk, A.; Van Weselmael, B.; Cammeraat, E. Water availability in almond orchards on marl soils in southest Spain: The role of evaporation and runoff. J. Arid Environ. 2008, 72, 2168–2178. [Google Scholar] [CrossRef]
- Ferreira, S.S.C.; Seifollahi-Aghmiuni, S.; Destouni, G.; Ghajarnia, N.; Kalantari, Z. Soil degradation in the European Mediterranean region: Processes, status and consequences. Sci. Total Environ. 2022, 805, 150106. [Google Scholar] [CrossRef]
- Maetens, W.; Vanmaercke, M.; Poesen, J.; Jankauskas, B.; Jankauskiene, G.; Ionita, I. Effects of land use on annual runoff and soil loss in Europe and the Mediterranean: A meta-analysis of plot data. Prog. Phys. Geogr. 2012, 90, 53–62. [Google Scholar] [CrossRef]
- Gómez, J.A.; Campos, M.; Guzmán, M.G.; Castillo-Llanque, F.; Vanwalleghem, T.; Lora, A.; Giráldez, J.V. Soil erosion control, plant diversity, and arthropod communities under heterogeneous cover crops in an olive orchard. Environ. Sci. Pollut. Res. 2017, 25, 977–989. [Google Scholar] [CrossRef]
- Martínez-Mena, M.; Carrillo-Lopez, E.; Boix-Fayos, C.; Almagro, M.; Franco, N.G.; Díaz-Pereira, E.; Montoya, I.; de Vente, J. Long-term effectiveness of sustainable land management practices to control runoff, soil erosion, and nutrient loss and the role of rainfall intensity in Mediterranean rainfed agroecosystems. Catena 2020, 187, 104352. [Google Scholar] [CrossRef]
- Cárceles, R.B.; Durán, Z.V.H.; Soriano, R.M.; Gálvez, R.B.; García, T.I.F. Soil erosion and the efficiency of the conservation measures in Mediterranean hillslope farming (SE Spain). Eurasian Soil Sci. 2021, 54, 792–806. [Google Scholar] [CrossRef]
- Cherlet, M.; Ivits, E.; Sommer, S.; Tóth, G.; Jones, A.; Montanarella, L.; Belward, A. Land Productivity Dynamics in Europe- Towards a Valuation of Land Degradation in the EU; European Commission, Joint Research Centre, Publications Office: Brussels, Belgium, 2013. [Google Scholar] [CrossRef]
- FAOSTAT. Food and Agriculture Organisation of the United Nations. 2021. Available online: http://www.fao.org/faostat/en/#data/QC (accessed on 13 February 2023).
- MAPA. Anuario de Estadística 2020. Ministerio de Agricultura, Pesca y Alimentación; MAPA: Madrid, Spain, 2021; Available online: https://www.mapa.gob.es/estadistica/pags/anuario/2020/ANUARIO/AE20.pdf (accessed on 15 March 2022).
- Arquero, O. Manual del Almendro; Consejería de Agricultura, Pesca y Desarrollo Rural: Sevilla, Spain, 2013; p. 78. [Google Scholar]
- MAPA. Producción Ecológica. Estadísticas 2020; Ministerio de Agricultura, Pesca y Alimentación: Madrid, Spain, 2021. [Google Scholar]
- Iglesias, I.; Foiles, P.; Oliveira, C. El almendro en España y Portugal: Situación, innovación tecnológica, costes, rentabilidad y perspectivas. Fruticultura 2021, 81, 6–49. [Google Scholar]
- Aznar-Sánchez, J.A.; Belmonte, L.; Velasco Muñoz, J. Caracterización del cultivo del almendro en secano en Andalucía y propuestas de reconversión. ITEA Inf. Tec. Econ. Agrar. 2016, 112, 317–335. [Google Scholar] [CrossRef]
- Wittwer, R.A.; Bender, S.F.; Hartman, K.; Hydbom, S.; Lima, R.A.A.; Loaiza, V.; Nemecek, T.; Oehl, F.; Olsson, P.A.; Petchey, O.; et al. Organic and conservation agriculture promote ecosystem multifunctionality. Sci. Adv. 2021, 7, eabg6995. [Google Scholar] [CrossRef]
- Cárceles, R.B.; Durán, Z.V.H.; Soriano, R.M.; García, T.I.F.; Gálvez, R.B.; Cuadros, T.S. Conservation agriculture as a sustainable system for soil health: A review. Soil Syst. 2022, 6, 87. [Google Scholar] [CrossRef]
- Aziz, I.; Mahmood, T.; Islam, K.R. Effect of long term no-till and conventional tillage practices on soil quality. Soil Tillage Res. 2013, 131, 28–35. [Google Scholar] [CrossRef]
- Linares, R.; de la Fuente, M.; Junquera, P.; Lissarrague, J.R.; Baeza, P. Effects of soil management in vineyard on soil physical and chemical characteristics. BIO Web Conf. 2014, 3, 01008. [Google Scholar] [CrossRef]
- Nunes, M.R.; Karlen, D.L.; Moorman, T.B. Tillage intensity effects on soil structure indicators—A US meta-analysis. Sustainability 2020, 12, 2071. [Google Scholar] [CrossRef] [Green Version]
- Durán, Z.V.H.; Rodríguez, P.C.R.; Francia, M.J.R.; Martínez, R.A.; Arroyo, P.L.; Cárceles, R.B.; Navarro, M.M.C. Benefits of plant strips for sustainable mountain agriculture. Agron. Sustain. Dev. 2008, 28, 497–505. [Google Scholar] [CrossRef]
- Beniston, J.W.; Shipitalo, M.J.; Lal, R.; Dayton, E.A.; Hopkins, D.W.; Jones, F.; Joynes, A.; Dungait, J.A.J. Carbon and macronutrient losses during accelerated erosion under different tillage and residue management. Eur. J. Soil Sci. 2015, 66, 218–225. [Google Scholar] [CrossRef]
- García-Díaz, A.; Bienes, R.; Sastre, B.; Novara, A.; Gristina, L.; Cerdà, A. Nitrogen losses in vineyards under different types of soil groundcover. A field runoff simulator approach in central Spain. Agric. Ecosyst. Environ. 2017, 236, 256–267. [Google Scholar] [CrossRef]
- Lal, R.; Delgado, J.A.; Groffman, P.M.; Millar, N.; Dell, C.; Rotz, A. Management to mitigate and adapt to climate change. J. Soil Water Conserv. 2011, 66, 276–285. [Google Scholar] [CrossRef] [Green Version]
- Cucci, G.; Lacolla, G.; Crecchio, C.; Pascazio, S.; Giorgio, D.D.E. Impact of long term soil management practices on the fertility and weed flora of an almond orchard. Turk. J. Agric. For. 2016, 40, 194–202. [Google Scholar] [CrossRef]
- Norfolk, O.; Eichhorn, M.P.; Gilbert, F. Flowering ground vegetation benefits wild pollinators and fruit set of almond within arid smallholder orchards. Insect Conserv. Divers. 2016, 9, 236–243. [Google Scholar] [CrossRef]
- De Leijster, V.; João, M.; Wassen, M.J.; Ramos-Font, M.E.; Belén, A.; Díaz, M.; Staal, M.; Verweij, P.A. Agroecological management improves ecosystem services in almond orchards within one year. Ecosyst. Serv. 2019, 38, 100948. [Google Scholar] [CrossRef]
- Cárceles, R.B.; Durán, Z.V.H.; Soriano, R.M.; García-Tejero, I.F.; Gálvez, R.B.; Repullo-Ruibérriz de Torres, M.A.; Ordóñez, F.R.; Carbonell, B.R.M.; Cuadros, T.S. Legumes protect the soil erosion and ecosystem services. In Advances in Legumes for Sustainable Intensification; Meena, R.S., Kumar, S., Eds.; Academic Press: Oxford, UK, 2022; pp. 247–266. [Google Scholar] [CrossRef]
- Gervasi, T.; Barreca, D.; Laganà, G.; Mandalari, G. Health Benefits Related to Tree Nut Consumption and Their Bioactive Compounds. Int. J. Mol. Sci. 2021, 22, 5960. [Google Scholar] [CrossRef] [PubMed]
- Barreca, D.; Nabavi, S.M.; Sureda, A.; Rasekhian, M.; Raciti, R.; Silva, A.S.; Annunziata, G.; Arnone, A.; Tenore, G.C.; Süntar, İ.; et al. Almonds (Prunus dulcis Mill. D. A. Webb): A Source of Nutrients and Health-Promoting Compounds. Nutrients 2020, 12, 672. [Google Scholar] [CrossRef] [Green Version]
- Yada, S.; Lapsley, K.; Huang, G. A review of composition studies of cultivated almonds: Macronutrients and micronutrients. J. Food Compos. Anal. 2011, 24, 469–480. [Google Scholar] [CrossRef]
- Bolling, B.W. Almond polyphenols: Methods of analysis, contribution to food quality, and health promotion. Compr. Rev. Food Sci. Food Saf. 2017, 16, 346–368. [Google Scholar] [CrossRef] [Green Version]
- Lee-Bravatti, M.A.; Wang, J.; Avendano, E.E.; Ligaya King, L.; Johnson, E.J.; Raman, G. Almond consumption and risk factors for cardiovascular disease: A systematic review and meta-analysis of randomized controlled trials. Adv. Nutr. 2019, 10, 1076–1088. [Google Scholar] [CrossRef] [PubMed]
- Li, S.C.; Liu, Y.H.; Liu, J.F.; Chang, W.H.; Chen, C.M.; Oliver Chen, C.Y. Almond consumption improved glycemic control and lipid profiles in patients with type 2 diabetes mellitus. Metabolism 2011, 60, 474–479. [Google Scholar] [CrossRef] [PubMed]
- Rajaram, S.; Connell, K.; Sabaté, J. Effect of almond-enriched high-monounsaturated fat diet on selected markers of inflammation: A randomised, controlled, crossover study. Br. J. Nutr. 2010, 103, 907–912. [Google Scholar] [CrossRef] [PubMed]
- Rabadán, A.; Álvarez-Ortí, M.; Gómez, R.; de Miguel, C.; Pardo, J.E. Influence of genotype and crop year in the chemometrics of almond and pistachio oils. J. Sci. Food Agric. 2017, 98, 2402–2410. [Google Scholar] [CrossRef] [PubMed]
- Sahota, A. The global market for organic food & drink. In The World of Organic Agriculture. Statistics and Emerging Trends 2021; Research Institute of Organic Agriculture FiBL—IFOAM Organics International, Frick: Bonn, Germany, 2021; pp. 136–139. [Google Scholar]
- Chiciudean, D.; Funar, S.; Arion, F.; Chirla, G.; Man, A. The Factors of Influence over the Consumer Buying Behaviour for Organic Food. Bull. UASVM Hortic. 2017, 69, 68–71. [Google Scholar]
- Rodríguez-Bermúdez, R.; Miranda, M.; Orjales, I.; Ginzo-Villamayor, M.J.; Al-Soufi, W.; López-Alonso, M. Consumers’ perception of and attitudes towards organic food in Galicia (Northern Spain). Int. J. Consum. Stud. 2020, 44, 206–219. [Google Scholar] [CrossRef]
- Shafie, F.A.; Rennie, D. Consumer perceptions towards organic food. Procedia Soc. Behav. Sci. 2012, 49, 360–367. [Google Scholar] [CrossRef] [Green Version]
- Soil Survey Staff. Keys to Soil Taxonomy, 12th ed.; USDA-Natural Resources Conservation Service: Washington, DC, USA, 2014. [Google Scholar]
- Gee, G.W.; Bauder, J.W. Particle Size Analysis by Hydrometer: A Simplified Method for Routine Textural Analysis and a Sensitivity Test of Measurement Parameters. Soil Sci. Soc. Am. J. 1979, 43, 1004–1007. [Google Scholar] [CrossRef]
- Blake, G.R.; Hartge, K.H. Bulk density. In Methods of Soil Analysis: Part 1: Physical and Mineralogical Methods, 2nd ed.; Monograph Number 9; Klute, A., Ed.; ASA: Madison, WI, USA, 1986; pp. 363–375. [Google Scholar]
- Richards, L.A. Porous plate apparatus for measuring moisture retention and transmission by soil. Soil Sci. 1948, 66, 105–110. [Google Scholar] [CrossRef]
- Van Eerd, L.L.; DeBruyn, A.H.; Ouellette, L.; Hooker, D.C.; Robinson, D.E. Quantitative and qualitative comparison of three wet aggregate stability methods using a long-term tillage system and crop rotation experiment. Can. J. Soil Sci. 2018, 98, 738–742. [Google Scholar] [CrossRef]
- Six, J.; Elliott, E.T.; Paustian, K. Soil structure and soil organic matter II. A normalized stability index and the effect of mineralogy. Soil Sci. Soc. Am. J. 2000, 64, 1042–1049. [Google Scholar] [CrossRef]
- Devine, S.; Markewitz, D.; Hendrix, P.; Coleman, D. Soil Aggregates and Associated Organic Matter under Conventional Tillage, No-Tillage, and Forest Succession after Three Decades. PLoS ONE 2014, 9, e84988. [Google Scholar] [CrossRef] [PubMed] [Green Version]
- Hesse, P.R. A Textbook of Soil Chemical Analysis; John Murray: London, UK, 1971. [Google Scholar]
- Olsen, S.R.; Cole, C.W.; Watanabe, F.S.; Dean, L.A. Estimation of Available Phosphorous in Soils by Extraction with Sodium Bicarbonate; U.S. Department of Agriculture Circular 939, Government Printing Office: Washington, DC, USA, 1954.
- MAPA. Métodos Oficiales de Análisis; Tomo III. Ministerio de Agricultura, Pesca y Alimentación: Madrid, Spain, 1994. [Google Scholar]
- Walkley, A.; Black, J.A. An examination of the Degtjareff method for determining soil organic matter and a proposed modification of the chromic acid titration method. Soil Sci. 1934, 37, 29–38. [Google Scholar] [CrossRef]
- Lindsay, W.L.; Norwell, W.L. Development of DTPA soil test for zinc, iron, manganese and copper. Soil Sci. Soc. Am. J. 1978, 42, 421–428. [Google Scholar] [CrossRef]
- Adam, G.; Duncan, H. Development of a sensitive and rapid method for the measurement of total microbial activity using Fluorescein Diacetate (FDA) in a range of soils. Soil Biol. Biochem. 2001, 33, 943–951. [Google Scholar] [CrossRef] [Green Version]
- Schnürer, J.; Rosswall, T. Fluorescein Diacetate Hydrolysis as a Measure of Total Microbial Activity in Soil and Litter. Appl. Environ. Microbiol. 1982, 43, 1256–1261. [Google Scholar] [CrossRef] [PubMed] [Green Version]
- Muscolo, A.; Panuccio, M.R.; Mallamaci, C.; Sidari, M. Biological indicators to assess short-term soil quality changes in forest ecosystems. Ecol. Indic. 2014, 45, 416–423. [Google Scholar] [CrossRef]
- Green, V.S.; Stott, D.E.; Diack, M. Assay for fluorescin diacetate hydrolytic activity; optimization for soil samples. Soil Biol. Biochem. 2006, 38, 693–701. [Google Scholar] [CrossRef]
- Environmental Protection Agency. Method 3052, SW-846. Microwave Assisted Acid Digestion of Siliceous and Organically Based Matrices; Environmental Protection Agency: Washington, DC, USA, 1996.
- AOAC. Official Methods of Analysis, 15th ed.; Association of Official Analytical Chemists: Washington, DC, USA, 1995. [Google Scholar]
- Gao, X.; Björk, L.; Trajkovski, V.; Uggla, M. Evaluation of antioxidant activities of rosehip ethanol extracts in different test systems. J. Sci. Food Agric. 2000, 80, 2021–2027. [Google Scholar] [CrossRef]
- Re, R.; Pellegrini, N.; Proteggente, A.; Pannala, A.; Yang, M.; Rice-Evans, C. Antioxidant activity applying an improved ABTS radical cation decolorization assay. Free Radic. Biol. Med. 1999, 26, 1231–1237. [Google Scholar] [CrossRef]
- Brand-Williams, W.; Cuvelier, M.E.; Berset, C. Use of a free radical method to evaluate antioxidant activity. LWT 1995, 28, 25–30. [Google Scholar] [CrossRef]
- Benzie, I.F.; Strain, J.J. The ferric reducing ability of plasma (FRAP) as a measure of “antioxidant power”: The FRAP assay. Anal. Biochem. 1996, 239, 70–76. [Google Scholar] [CrossRef] [PubMed] [Green Version]
- Lipan, L.; Moriana, A.; López Lluch, D.B.; Cano-Lamadrid, M.; Sendra, E.; Hernández, F.; Carbonell-Barrachina, Á.A. Nutrition quality parameters of almonds as affected by deficit irrigation strategies. Molecules 2019, 24, 2646. [Google Scholar] [CrossRef] [PubMed] [Green Version]
- Lipan, L.; Martín, P.M.J.; Sánchez, R.L.; Cano-Lamadrid, M.; Sendra, E.; Hernández, F.; Burló, F.; Vázquez-Araújo, L.; Andreu, L.; Carbonell-Barrachina, A.A. Almond fruit quality can be improved by means of deficit irrigation strategies. Agric. Water Manag. 2019, 217, 236–242. [Google Scholar] [CrossRef]
- Kay, B.D.; VandenBygaart, A.J. Conservation tillage and depth stratification of porosity and soil organic matter. Soil Tillage Res. 2002, 66, 107–118. [Google Scholar] [CrossRef]
- Laborde, J.P.; Wortmann, C.S.; Blanco-Canqui, H.; McDonald, A.J.; Baigorria, G.A.; Lindquist, J.L. Short-term impacts of conservation agriculture on soil physical properties and productivity in the Midhills of Nepal. Agron. J. 2019, 111, 2128–2139. [Google Scholar] [CrossRef]
- He, J.; Kuhn, N.J.; Zhang, X.M.; Zhang, X.R.; Li, H.W. Effects of 10 years of conservation tillage on soil properties and productivity in the farming–pastoral ecotone of Inner Mongolia, China. Soil Use Manag. 2009, 25, 201–209. [Google Scholar] [CrossRef]
- Eze, S.; Dougill, A.J.; Banwart, S.A.; Hermans, T.D.G.; Ligowe, I.S.; Thierfelder, C. Impacts of conservation agriculture on soil structure and hydraulic properties of Malawian agricultural systems. Soil Tillage Res. 2020, 201, 104639. [Google Scholar] [CrossRef]
- Ghosh, B.N.; Dogra, P.; Sharma, N.K.; Bhattacharyya, R.; Mishra, P.K. Conservation agriculture impact for soil conservation in maize–wheat cropping system in the Indian sub-Himalayas. Int. Soil Water Conserv. Res. 2015, 3, 112–118. [Google Scholar] [CrossRef] [Green Version]
- Thierfelder, C.; Wall, P.C. Investigating conservation agriculture (CA) systems in Zambia and Zimbabwe to mitigate future effects of climate change. J. Crop Improv. 2010, 24, 113–121. [Google Scholar] [CrossRef]
- Bahri, H.; Annabi, M.; M’Hamed, H.C.; Frija, A. Assessing the long-term impact of conservation agriculture on wheat-based systems in Tunisia using APSIM simulations under a climate change context. Sci. Total Environ. 2019, 692, 1223–1233. [Google Scholar] [CrossRef]
- Abazi, U.; Lorite, I.J.; Cárceles, R.B.; Martínez, R.A.; Durán, Z.V.H.; Francia, M.J.R.; Gómez, J.A. WABOL: A conceptual water balance model for analyzing rainfall water use in olive orchards under different soil and cover crop management strategies. Comput. Electron. Agric. 2013, 91, 35–48. [Google Scholar] [CrossRef] [Green Version]
- Krstić, Đ.; Vujić, S.; Jaćimović, G.; D’Ottavio, P.; Radanović, Z.; Erić, P.; Ćupina, B. The effect of cover crops on soil water balance in rain-fed conditions. Atmosphere 2018, 9, 492. [Google Scholar] [CrossRef] [Green Version]
- Meyer, N.; Bergez, J.E.; Constantin, J.; Belleville, P.; Justes, E. Cover crops reduce drainage but not always soil water content due to interactions between rainfall distribution and management. Agric. Water Manag. 2020, 231, 105998. [Google Scholar] [CrossRef]
- Belmonte, S.A.; Celi, L.; Stahel, R.J.; Bonifacio, E.; Novello, V.; Zanini, E.; Steenwerth, K.L. Effect of long-term soil management on the mutual interaction among soil organic matter, microbial activity and aggregate stability in a vineyard. Pedosphere 2018, 28, 288–298. [Google Scholar] [CrossRef]
- Luján Soto, R.; Martínez-Mena, M.; Cuéllar Padilla, M.; de Vente, J. Restoring soil quality of woody agroecosystems in Mediterranean drylands through regenerative agriculture. Agric. Ecosyst. Environ. 2021, 306, 107191. [Google Scholar] [CrossRef]
- Al-Kaisi, M.M.; Douelle, A.; Kwaw-Mensah, D. Soil microaggregate and macroaggregate decay over time and soil carbon change as influenced by different tillage systems. J. Soil Water Conserv. 2014, 69, 574–580. [Google Scholar] [CrossRef] [Green Version]
- Xu, J.M.; Tang, C.; Chen, Z.L. The role of plant residues in pH change of acid soils differing in initial pH. Soil Biol. Biochem. 2006, 38, 709–719. [Google Scholar] [CrossRef]
- Limousin, G.; Tessier, D. Effects of no-tillage on chemical gradients and topsoil acidification. Soil Tillage Res. 2007, 92, 167–174. [Google Scholar] [CrossRef]
- Sithole, N.J.; Magwaza, L.S. Long-term changes of soil chemical characteristics and maize yield in no-till conservation agriculture in a semi-arid environment of South Africa. Soil Tillage Res. 2019, 194, 104317. [Google Scholar] [CrossRef]
- Husson, O.; Brunet, A.; Babre, D.; Charpentier, H.; Durand, M.; Sarthou, J.P. Conservation Agriculture systems alter the electrical characteristics (Eh, pH and EC) of four soil types in France. Soil Tillage Res. 2018, 176, 57–68. [Google Scholar] [CrossRef]
- Roldán, A.; Caravaca, F.; Hernández, M.T.; García, C.; Sánchez-Brito, C.; Velásquez, M.; Tiscareño, M. No-tillage, crop residue additions, and legume cover cropping effects on soil quality characteristics under maize in Patzcuaro watershed (Mexico). Soil Tillage Res. 2003, 72, 65–73. [Google Scholar] [CrossRef]
- Soni, P.; Rai, A.; Basak, N.; Kumar, P.; Sundha, P. Productivity and profitability of sorghum-wheat cropping system in saline soils as influenced by conservation agriculture practices. Range Manag. Agrofor. 2021, 42, 277–285. [Google Scholar]
- Yadav, D.; Vishwakarma, A.K.; Sharma, N.K.; Biswas, A.K.; Ojasvi, P.R.; Kumar, D.; Singh, D. Sustaining the properties of black soil in Central India through crop residue management in a conservation-agriculture-based soybean–wheat system. Land Degrad. Dev. 2021, 32, 2906–2921. [Google Scholar] [CrossRef]
- Demir, Z.; Tursun, N.; Işık, D. Effects of different cover crops on soil quality parameters and yield in an apricot orchard. Int. J. Agric. Biol. 2019, 21, 399–408. [Google Scholar]
- Balesdent, J.; Chenu, C.; Balabane, M. Relationship of soil organic matter dynamics to physical protection and tillage. Soil Tillage Res. 2000, 53, 215–230. [Google Scholar] [CrossRef]
- Lal, R. Soil carbon sequestration to mitigate climate change. Geoderma 2004, 123, 1–22. [Google Scholar] [CrossRef]
- Six, J.; Ogle, S.M.; Breidt, F.J.; Conant, R.T.; Mosiers, A.R.; Paustian, K. The potential to mitigate global warming with no-tillage management is only realized when practised in the long term. Glob. Change Biol. 2004, 10, 155–160. [Google Scholar] [CrossRef] [Green Version]
- Durán, Z.V.H.; Cárceles, R.B.; García-Tejero, I.F.; Gálvez, R.B.; Cuadros, T.S. Benefits of organic olive rainfed systems to control soil erosion and runoff and improve soil health restoration. Agron. Sustain. Dev. 2020, 40, 41. [Google Scholar] [CrossRef]
- Ferreira, I.; Arrobas, M.; Claro, A.; Rodrigues, M. Soil management in rainfed olive orchards may result in conflicting effects on olive production and soil fertility. Span. J. Agric. Res. 2013, 11, 472. [Google Scholar] [CrossRef]
- Repullo-Ruibérriz de Torres, M.A.; Moreno, G.M.; Ordóñez, F.R.; Rodríguez, L.A.; Cárceles, R.B.; García, T.I.F.; Durán, Z.V.H.; Carbonell, B.R.M. Cover crop contributions to improve the soil nitrogen and carbon sequestration in almond orchards (SW Spain). Agronomy 2021, 11, 387. [Google Scholar] [CrossRef]
- Ranaivoson, L.; Naudin, K.; Ripoche, A.; Affholder, F.; Rabeharisoa, L.; Corbeels, M. Agro-ecological functions of crop residues under conservation agriculture. A review. Agron. Sustain. Dev. 2017, 37, 26. [Google Scholar] [CrossRef] [Green Version]
- Mazzoncini, M.; Sapkota, T.B.; Bàrberi, P.; Antichi, D.; Risaliti, R. Long-term effect of tillage, nitrogen fertilization and cover crops on soil organic carbon and total nitrogen content. Soil Tillage Res 2011, 114, 165–174. [Google Scholar] [CrossRef]
- Almeida, D.S.; Menezes-Blackburn, D.; Zhang, H.; Haygarth, P.M.; Rosolema, C.A. Phosphorus availability and dynamics in soil affected by long-term ruzigrass cover crop. Geoderma 2019, 337, 434–443. [Google Scholar] [CrossRef]
- Villamil, M.B.; Bollero, G.A.; Darmody, R.G.; Simmons, F.W.; Bullock, D.G. No-till corn/soybean systems including winter cover crops: Effects on soil properties. Soil Sci. Soc. Am. J. 2006, 70, 1936–1944. [Google Scholar] [CrossRef]
- Sujatha, D.V.; Kavitha, P.; Naidu, M.V.S. Influence of green manure and potassium nutrition on soil potassium fractions and yield of rice crop. Int. J. Curr. Microbiol. Appl. Sci. 2017, 6, 13–23. [Google Scholar] [CrossRef]
- Palm, C.; Blanco-Canqui, H.; DeClerck, F.; Gatere, L.; Grace, P. Conservation agriculture and ecosystem services: An overview. Agric. Ecosyst. Environ. 2014, 187, 87–105. [Google Scholar] [CrossRef] [Green Version]
- Page, K.L.; Dang, Y.P.; Dalal, R.C. The ability of conservation agriculture to conserve soil organic carbon and the subsequent impact on soil physical, chemical, and biological properties and yield. Front. Sustain. Food Syst. 2020, 4, 1–17. [Google Scholar] [CrossRef] [Green Version]
- Beltrán, M.J.; Sainz-Rozas, H.; Galantini, J.A.; Romaniuk, R.I.; Barbieri, P. Cover crops in the Southeastern region of Buenos Aires, Argentina: Effects on organic matter physical fractions and nutrient availability. Environ. Earth Sci. 2018, 77, 428. [Google Scholar] [CrossRef]
- Feng, Y.; Liu, Q.; Tan, C.; Yang, G.; Qin, X.; Xiang, Y. Water and nutrient conservation effects of different tillage treatments in sloping fields. Arid Land Res. Manag. 2014, 28, 14–24. [Google Scholar] [CrossRef]
- Demir, Z.; Işık, D. The Comparative Effects of Different Cover Crops on DTPA-Extractable Micronutrients in Orchards with Loam and Clay Textured Soils. JAFAG 2019, 36, 107–116. [Google Scholar] [CrossRef]
- Jat, H.S.; Datta, A.; Sharma, P.C.; Kumar, V.; Yadav, A.K.; Choudhary, M.; Choudhary, V.; Gathala, M.K.; Sharma, D.K.; Jat, M.L.; et al. Assessing soil properties and nutrient availability under conservation agriculture practices in a reclaimed sodic soil in cereal-based systems of North-West India. Arch. Agron. Soil Sci. 2017, 64, 531–545. [Google Scholar] [CrossRef] [PubMed] [Green Version]
- Sharma, S.; Dhaliwal, S.S. Conservation agriculture based practices enhanced micronutrients transformation in earthworm cast soil under rice-wheat cropping system. Ecol. Eng. 2021, 163, 106195. [Google Scholar] [CrossRef]
- Beltran, M.; Brutti, L.; Romaniuk, R.; Bacigaluppo, S.; Salvagiotti, F.; Sainz-Rozas, H.; Galantini, J. Soil organic matter quality, macro and micronutrient availability in response to the inclusion of wheat as cover crop. Cienc. Suelo 2016, 34, 67–79. [Google Scholar]
- Khoshgoftarmanesh, A.H.; Schulin, R.; Chaney, R.L.; Daneshbakhsh, B.; Afyuni, M. Micronutrient-efficient genotypes for crop yield and nutritional quality in sustainable agriculture. A review. Agron. Sustain. Dev. 2010, 30, 83–107. [Google Scholar] [CrossRef] [Green Version]
- Gao, D.; Zhou, X.; Duan, Y.; Fu, X.; Wu, F. Wheat cover crop promoted cucumber seedling growth through regulating soil nutrient resources or soil microbial communities? Plant Soil 2017, 418, 459–475. [Google Scholar] [CrossRef]
- Keiluweit, M.; Nico, P.; Harmon, M.E.; Mao, J.D.; Pett-Ridge, J.; Kleber, M. Long-term litter decomposition controlled by manganese redox cycling. Proc. Natl. Acad. Sci. USA 2015, 112, E5253–E5260. [Google Scholar] [CrossRef] [Green Version]
- Chaudhari, P.R.; Ahire, D.V.; Ahire, V.D.; Chkravarty, M.; Maity, S. Soil Bulk Density as related to Soil Texture, Organic Matter Content and available total Nutrients of Coimbatore Soil. Int. J. Sci. Res. Publ. 2013, 3, 1–8. Available online: http://www.ijsrp.org/research-paper-0213.php?rp=P14721 (accessed on 19 September 2022).
- Kumar, V.; Srivastava, A.; Singh, V.; Kumar, S.; Bhatt, M. Availability of macro & micronutrients and their correlation with some physico-chemical properties in soils of Udham Singh Nagar district of Uttarakhand. IJCS 2018, 6, 1445–1449. [Google Scholar]
- Zuber, S.M.; Villamil, M.B. Meta-analysis approach to assess effect of tillage on microbial biomass and enzyme activities. Soil Biol. Biochem. 2016, 97, 176–187. [Google Scholar] [CrossRef] [Green Version]
- Habig, J.; Swanepoel, C. Effects of conservation agriculture and fertilization on soil microbial diversity and activity. Environments 2015, 2, 358–384. [Google Scholar] [CrossRef]
- Bhattacharyya, R.; Bhatia, A.; Das, T.K.; Lata, S.; Kumar, A.; Tomer, R.; Singh, G.; Kumar, S.; Biswas, A.K. Aggregate-associated N and global warming potential of conservation agriculture-based cropping of maize-wheat system in the north-western Indo-Gangetic Plains. Soil Tillage Res. 2018, 182, 66–77. [Google Scholar] [CrossRef]
- Parihar, C.M.; Singh, A.K.; Jat, S.L.; Dey, A.; Nayak, H.S.; Mandal, B.N.; Saharawat, Y.S.; Jat, M.L.; Yadav, O.P. Soil quality and carbon sequestration under conservation agriculture with balanced nutrition in intensive cereal-based system. Soil Tillage Res. 2020, 202, 104653. [Google Scholar] [CrossRef]
- Sofo, A.; Ciarfaglia, A.; Scopa, A.; Camele, I.; Curci, M.; Crecchio, C.; Xiloyannis, C.; Palese, A.M. Soil microbial diversity and activity in a Mediterranean olive orchard using sustainable agricultural practices. Soil Use Manag. 2014, 30, 160–167. [Google Scholar] [CrossRef]
- Ferrández-Cámara, M.; Martínez-Nicolás, J.J.; Alfosea-Simón, M.; Cámara-Zapata, J.M.; Melgarejo Moreno, P.; García-Sánchez, F. Estimation of Diagnosis and Recommendation Integrated System (DRIS), Compositional Nutrient Diagnosis (CND) and Range of Normality (RN) Norms for Mineral Diagnosis of Almonds Trees in Spain. Horticulturae 2021, 7, 481. [Google Scholar] [CrossRef]
- Sulas, L.; Mercenaro, L.; Campesi, G.; Nieddu, G. Different cover crops affect nitrogen fluxes in Mediterranean vineyard. Agron. J. 2017, 109, 2579–2585. [Google Scholar] [CrossRef]
- Martínez-Mena, M.; Garcia-Franco, N.; Almagro, M.; Ruiz-Navarro, A.; Albaladejo, J.; de Aguilar, J.M.; Gonzalez, D.; Querejeta, J.I. Decreased foliar nitrogen and crop yield in organic rainfed almond trees during transition from reduced tillage to no tillage in a dryland farming system. Eur. J. Agron. 2013, 49, 149–157. [Google Scholar] [CrossRef]
- Herencia, J.; Maqueda, C. Effects of time and dose of organic fertilizers on soil fertility, nutrient content and yield of vegetables. J. Agric. Sci. 2016, 154, 1343–1361. [Google Scholar] [CrossRef]
- Arrobas, M.; Ribeiro, A.; Barreales, D.; Pereira, E.L.; Rodrigues, M.A. Soil and foliar nitrogen and boron fertilization of almond trees grown under rainfed conditions. Eur. J. Agron. 2019, 106, 39–48. [Google Scholar] [CrossRef] [Green Version]
- Morais, M.C.; Aires, A.; Barreales, D.; Rodrigues, M.A.; Ribeiro, A.C.; Gonçalves, B.; Silva, A.P. Combined Soil and Foliar Nitrogen Fertilization Effects on Rainfed Almond Tree Performance. J. Soil Sci. Plant Nutr. 2020, 20, 2552–2565. [Google Scholar] [CrossRef]
- Arroyo, F.T.; Herencia, J.F.; Capote, N. Phenology, growth, and yield of almond cultivars under organic and conventional management in southwestern Spain. Span. J. Agric. Res. 2022, 20, e0901. [Google Scholar] [CrossRef]
- López-Garrido, R.; Madejón, E.; León-Camacho, M.; Girón, I.; Moreno, F.; Murillo, J.M. Reduced tillage as an alternative to no-tillage under Mediterranean conditions: A case study. Soil Tillage Res. 2014, 140, 40–47. [Google Scholar] [CrossRef]
- Melhaoui, R.; Addi, M.; Houmy, N.; Abid, M.; Mihamou, A.; Serghini-Caid, H.; Sindic, M.; Elamrani, A. Pomological characterization of main almond cultivars from the North Eastern Morocco. Int. J. Fruit Sci. 2019, 19, 413–422. [Google Scholar] [CrossRef]
- Roncero, J.M.; Álvarez-Ortí, M.; Pardo-Giménez, A.; Rabadán, A.; Pardo, J.E. Review about Non-Lipid Components and Minor Fat-Soluble Bioactive Compounds of Almond Kernel. Foods 2020, 9, 1646. [Google Scholar] [CrossRef]
- Muncharaz, M. El Almendro—Manual Técnico; Mundi-Prensa: Madrid, Spain, 2004. [Google Scholar]
- Gama, T.; Wallace, H.M.; Trueman, S.J.; Hosseini-Bai, S. Quality and shelf life of tree nuts: A review. Sci. Hortic. 2018, 242, 116–126. [Google Scholar] [CrossRef]
- Huang, G. Almond Shelf Life Factors; Technical Summary; Almond Board of California: Modesto, CA, USA, 2014; pp. 1–4. Available online: https://www.almonds.com/sites/default/files/2020-04/2014aq0007_shelf_life_factors.pdf (accessed on 22 June 2022).
- Fornés Comas, J.; Socias i Company, R.; Alonso Segura, J.M. Shell hardness in almond: Cracking load and kernel percentage. Sci. Hortic. 2019, 245, 7–11. [Google Scholar] [CrossRef]
- Pérez-Sánchez, R.; Morales-Corts, M.R. Agromorphological Characterization and Nutritional Value of Traditional Almond Cultivars Grown in the Central-Western Iberian Peninsula. Agronomy 2021, 11, 1238. [Google Scholar] [CrossRef]
- Lipan, L.; Cano-Lamadrid, M.; Hernández, F.; Sendra, E.; Corell, M.; Vázquez-Araújo, L.; Moriana, A.; Carbonell-Barrachina, Á.A. Long-Term Correlation between Water Deficit and Quality Markers in HydroSOStainable Almonds. Agronomy 2020, 10, 1470. [Google Scholar] [CrossRef]
- Barreira, J.C.M.; Pereira, J.A.; Oliveira, M.B.P.P.; Ferreira, I.C.F.R. Sugars Profiles of Different Chestnut (Castanea sativa Mill.) and Almond (Prunus dulcis) Cultivars by HPLC-RI. Plant Foods Hum. Nutr. 2010, 65, 38–43. [Google Scholar] [CrossRef]
- Egea, G.; González-Real, M.M.; Baille, A.; Nortes, P.A.; Sánchez-Bel, P.; Domingo, R. The effects of contrasted deficit irrigation strategies on the fruit growth and kernel quality of mature almond tres. Agric. Water Manag. 2009, 96, 1605–1614. [Google Scholar] [CrossRef]
- Nanos, G.D.; Kazantzis, I.; Kefalas, P.; Petrakis, C.; Stavroulakis, G.G. Irrigation and harvest time affect almond kernel quality and composition. Sci. Hortic. 2002, 96, 249–256. [Google Scholar] [CrossRef]
- Valdés, A.; Vidal, L.; Beltrán, A.; Canals, A.; Garrigós, M.C. Microwave-Assisted Extraction of Phenolic Compounds from Almond Skin Byproducts (Prunus amygdalus): A Multivariate Analysis Approach. J. Agric. Food Chem. 2015, 63, 5395–5402. [Google Scholar] [CrossRef] [PubMed] [Green Version]
- Summo, C.; Palasciano, M.; De Angelis, D.; Paradiso, V.M.; Caponio, F.; Pasqualone, A. Evaluation of the chemical and nutritional characteristics of almonds (Prunus dulcis (Mill). D.A. Webb) as influenced by harvest time and cultivar. J. Sci. Food Agric. 2018, 98, 5647–5655. [Google Scholar] [CrossRef] [PubMed] [Green Version]
- Čolić, S.D.; Fotirić Akšić, M.M.; Lazarević, K.B.; Zec, G.N.; Gašić, U.M.; Dabić Zagorac, D.Č.; Natić, M.M. Fatty acid and phenolic profiles of almond grown in Serbia. Food Chem. 2017, 234, 455–463. [Google Scholar] [CrossRef] [Green Version]
- Salcedo, C.L.; López de Mishima, B.A.; Nazareno, M.A. Walnuts and almonds as model systems of foods constituted by oxidisable, pro-oxidant and antioxidant factors. Food Res. Int. 2010, 43, 1187–1197. [Google Scholar] [CrossRef]
- Čolić, S.D.; Bakić, I.V.; Dabić Zagorac, D.Č.; Natić, M.M.; Smailagić, A.T.; Pergal, M.V.; Pešić, M.B.; Milinčić, D.D.; Rabrenović, B.B.; Akšić, M.M.F. Chemical Fingerprint and Kernel Quality Assessment in Different Grafting Combinations of Almond Under Stress Condition. Sci. Hortic. 2021, 275, 109705. [Google Scholar] [CrossRef]
- Kodad, O.; Socias, I.; Company, R. Variability of oil content and of major fatty acid composition in almond (Prunus amygdalus Batsch) and its relationship with kernel quality. J. Agric. Food Chem. 2008, 56, 4096–4101. [Google Scholar] [CrossRef]
- Pérez-Murcia, M.D.; Bustamante, M.A.; Orden, L.; Rubio, R.; Agulló, E.; Carbonell-Barrachina, Á.A.; Moral, R. Use of Agri-Food Composts in Almond Organic Production: Effects on Soil and Fruit Quality. Agronomy 2021, 11, 536. [Google Scholar] [CrossRef]
- Lipan, L.; García-Tejero, I.F.; Gutiérrez-Gordillo, S.; Demirbaş, N.; Sendra, E.; Hernández, F.; Durán-Zuazo, V.H.; Carbonell-Barrachina, A.A. Enhancing nut quality parameters and sensory profile in three almond cultivars by different irrigation regimes. J. Agric. Food Chem. 2019, 68, 2316–2328. [Google Scholar] [CrossRef]
- Sánchez-Bel, P.; Egea, I.; Martinez-Madrid, M.C.; Flores, B.; Romojaro, F. Influence of irrigation and organic/inorganic fertilization on chemical quality of almond (Prunus amygdalus cv. Guara). J. Agric. Food Chem. 2008, 56, 10056–10062. [Google Scholar] [CrossRef]
- Gutiérrez-Gordillo, S.; Lipan, L.; Durán Zuazo, V.H.; Sendra, E.; Hernández, F.; Hernández-Zazueta, M.S.; Carbonell-Barrachina, Á.A.; García-Tejero, I.F. Deficit Irrigation as a Suitable Strategy to Enhance the Nutritional Composition of HydroSOS Almonds. Water 2020, 12, 3336. [Google Scholar] [CrossRef]
- Yada, S.; Huang, G.; Lapsley, K. Natural variability in the nutrient composition of California-grown almonds. J. Food Compos. Anal. 2013, 30, 80–85. [Google Scholar] [CrossRef] [Green Version]
- Sánchez-Rodríguez, L.; Cano-Lamadrid, M.; Carbonell-Barrachina, Á.A.; Wojdyło, A.; Sendra, E.; Hernández, F. Polyphenol profile in manzanilla table olives as afected by water deficit during specific phenological stages and Spanish-style processing. J. Agric. Food Chem. 2019, 67, 661–670. [Google Scholar] [CrossRef] [PubMed]
- Noguera-Artiaga, L.; Sánchez-Bravo, P.; Pérez-López, D.; Szumny, A.; Calin-Sánchez, Á.; Burgos-Hernández, A.; Carbonell-Barrachina, Á.A. Volatile, sensory and functional properties of hydroSOS pistachios. Foods 2020, 9, 158. [Google Scholar] [CrossRef] [Green Version]


| SMS | Soil Depth | |||||||
|---|---|---|---|---|---|---|---|---|
| 0–10 cm | 10–25 cm | |||||||
| Sand | Clay | Silt | Class | Sand | Clay | Silt | Class | |
| (%) | (%) | |||||||
| TT | 47 | 21 | 32 | Loam | 52 | 22 | 26 | Sandy clay loam |
| NT | 57 | 16 | 27 | Sandy loam | 56 | 18 | 26 | Sandy loam |
| VF | 58 | 17 | 25 | Sandy loam | 59 | 17 | 24 | Sandy loam |
| VS | 49 | 21 | 30 | Loam | 50 | 26 | 24 | Sandy clay loam |
| VS-VE | 59 | 21 | 20 | Sandy clay loam | 64 | 22 | 14 | Sandy clay loam |
| Date | Soil Management Strategies (SMS) | ||||
|---|---|---|---|---|---|
| TT | NT | VF | VS | VS-VE | |
| January–February | Moldboard tillage (30 cm) | ------ | ------ | ------ | ------ |
| March a | Fungicidal treatment (Cu oxychloride; 150 L/ha) | Fungicidal treatment (Cu oxychloride; 150 L/ha) | Fungicidal treatment (Cu oxychloride; 150 L/ha) | Fungicidal treatment (Cu oxychloride; 150 L/ha) | Fungicidal treatment (Cu oxychloride; 150 L/ha) |
| April | Tillage | Mechanical vegetation control | Disc harrow incorporation | Disc harrow incorporation | Disc harrow incorporation |
| April a | Insecticide treatment (K soap + pyrethrins; 200 L/ha) | Insecticide treatment (K soap + pyrethrins; 200 L/ha) | Insecticide treatment (K soap + pyrethrins; 200 L/ha) | Insecticide treatment (K soap + pyrethrins; 200 L/ha) | Insecticide treatment (K soap + pyrethrins; 200 L/ha) |
| August–September | Almond harvest | Almond harvest | Almond harvest | Almond harvest | Almond harvest |
| September–October b | ------ | ------ | Sowing V. faba (150 kg/ha) | Sowing V. sativa (100 kg/ha) | Sowing V. sativa + V. ervilia (100 kg/ha) |
| October | Fertilization c (NK (Ca) 3-9(8); 2 kg/tree) | Fertilization (NK (Ca) 3-9(8); 2 kg/tree) | Fertilization (NK (Ca) 3-9(8); 2 kg/tree) | Fertilization (NK (Ca) 3-9(8); 2 kg/tree) | Fertilization (NK (Ca) 3-9(8); 2 kg/tree) |
| October | Thinning pruning | Thinning pruning | Thinning pruning | Thinning pruning | Thinning pruning |
| Micronutrients/Sampling Year | Soil Management Systems | ||||
|---|---|---|---|---|---|
| TT | NT | VF | VS | VS-VE | |
| (mg kg−1) | |||||
| Fe | 0–10 cm | ||||
| 2016 | 1.66 ± 0.59 b | 1.84 ± 0.68 b | 2.04 ± 0.51 b | 2.70 ± 0.80 ab | 3.47 ± 0.62 a |
| 2021 | 1.53 ± 0.29 c | 2.20 ± 0.65 bc | 4.84 ± 1.06 a | 4.03 ± 1.32 ab | 4.87 ± 0.42 a |
| n.s. | n.s. | * | n.s. | * | |
| Cu | |||||
| 2016 | 0.21 ± 0.07 a | 0.11 ± 0.06 a | 0.21 ± 0.11 a | 0.13 ± 0.05 a | 0.19 ± 0.17 a |
| 2021 | 0.30 ± 0.04 b | 0.35 ± 0.14 b | 0.46 ± 0.10 ab | 0.59 ± 0.24 ab | 0.68 ± 0.17 a |
| n.s. | * | * | * | * | |
| Mn | |||||
| 2016 | 3.77 ± 0.47 ab | 4.70 ± 0.81 a | 3.23 ± 0.74 b | 4.32 ± 1.25 ab | 4.83 ± 0.86 a |
| 2021 | 4.99 ± 0.72 a | 3.62 ± 1.07 ab | 3.26 ± 0.80 b | 3.54 ± 0.73 ab | 3.15 ± 0.68 b |
| * | n.s. | n.s. | n.s. | * | |
| Zn | |||||
| 2016 | 3.07 ± 0.43 a | 2.93 ± 0.94 a | 3.50 ± 0.89 a | 3.32 ± 0.60 a | 2.92 ± 1.06 a |
| 2021 | 2.61 ± 0.16 a | 2.74 ± 0.24 a | 2.96 ± 0.22 a | 3.58 ± 1.00 a | 3.78 ± 0.94 a |
| n.s. | n.s. | n.s. | n.s. | n.s. | |
| 10–25 cm | |||||
| Fe | |||||
| 2016 | 1.37 ± 0.45 b | 1.69 ± 0.32 b | 1.80 ± 0.50 b | 2.19 ± 0.59 ab | 2.81 ± 0.92 a |
| 2021 | 1.83 ± 0.21 b | 1.74 ± 0.26 b | 3.93 ± 1.18 a | 2.86 ± 1.21 ab | 3.32 ± 1.03 ab |
| n.s. | n.s. | * | n.s. | n.s. | |
| Cu | |||||
| 2016 | 0.12 ± 0.03 a | 0.08 ± 0.04 a | 0.12 ± 0.05 a | 0.09 ± 0.01 a | 0.14 ± 0.05 a |
| 2021 | 0.23 ± 0.07 b | 0.51 ± 0.07 a | 0.37 ± 0.10 ab | 0.36 ± 0.15 ab | 0.50 ± 0.17 a |
| * | * | * | * | * | |
| Mn | |||||
| 2016 | 2.43 ± 0.38 b | 3.81 ± 0.48 a | 1.97 ± 0.72 b | 2.80 ± 0.97 ab | 3.08 ± 0.59 ab |
| 2021 | 3.40 ± 0.91 a | 2.06 ± 0.50 b | 2.15 ± 0.49 b | 2.63 ± 0.75 ab | 2.02 ± 0.40 b |
| * | * | n.s | n.s. | * | |
| Zn | |||||
| 2016 | 1.63 ± 0.56 a | 1.89 ± 0.72 a | 2.40 ± 0.87 a | 1.54 ± 0.25 a | 1.40 ± 0.42 a |
| 2021 | 2.09 ± 0.09 b | 2.27 ± 0.23 ab | 2.39 ± 0.37 ab | 2.31 ± 0.30 ab | 3.13 ± 0.88 a |
| n.s. | n.s. | n.s. | * | * | |
| ρb | AWC | pH | EC | SOC | Na | K | Mg | P | N | Fe | Cu | Mn | Zn | |
|---|---|---|---|---|---|---|---|---|---|---|---|---|---|---|
| Traditional tillage | ||||||||||||||
| ρb | 1 | |||||||||||||
| AWC | −0.790 ** | 1 | ||||||||||||
| pH | 0.632 * | −0.755 ** | 1 | |||||||||||
| EC | −0.746 ** | 0.675 * | −0.805 ** | 1 | ||||||||||
| SOC | −0.809 ** | 0.405 | −0.412 | 0.649 ** | 1 | |||||||||
| Na | −0.201 | 0.136 | 0.275 | −0.100 | 0.187 | 1 | ||||||||
| K | −0.505 | 0.145 | −0.168 | 0.211 | 0.840 *** | 0.202 | 1 | |||||||
| Mg | −0.453 | 0.135 | 0.237 | −0.042 | 0.530 | 0.374 | 0.566 | 1 | ||||||
| P | −0.389 | 0.299 | −0.179 | 0.055 | 0.285 | 0.259 | 0.318 | 0.689 * | 1 | |||||
| N | −0.520 | 0.378 | −0.647 * | 0.485 | 0.688 * | −0.062 | 0.750 ** | −0.038 | 0.025 | 1 | ||||
| Fe | 0.496 | −0.548 | 0.925 *** | −0.753 ** | −0.396 | 0.461 | −0.190 | 0.419 | 0.134 | −0.732 ** | 1 | |||
| Cu | −0.114 | 0.052 | −0.241 | 0.217 | 0.433 | 0.204 | 0.582 | −0.256 | −0.368 | 0.787 ** | −0.405 | 1 | ||
| Mn | −0.862 *** | 0.711 ** | −0.575 | 0.541 | 0.765 ** | 0.326 | 0.659 * | 0.602 | 0.722 ** | 0.563 | −0.345 | 0.149 | 1 | |
| Zn | −0.613 | 0.190 | −0.473 | 0.414 | 0.798 ** | 0.014 | 0.802 ** | 0.283 | 0.314 | 0.828 ** | −0.517 | 0.484 | 0.662 * | 1 |
| No Tillage | ||||||||||||||
| ρb | 1 | |||||||||||||
| AWC | −0.848 *** | 1 | ||||||||||||
| pH | −0.281 | 0.039 | 1 | |||||||||||
| EC | −0.482 | 0.377 | 0.085 | 1 | ||||||||||
| SOC | −0.631 * | 0.516 | −0.273 | 0.671 * | 1 | |||||||||
| Na | −0.301 | 0.455 | −0.110 | 0.754 ** | 0.619 | 1 | ||||||||
| K | −0.602 | 0.522 | −0.139 | 0.776 ** | 0.924 *** | 0.769 ** | 1 | |||||||
| Mg | −0.444 | 0.645 * | −0.406 | 0.380 | 0.738 ** | 0.709 ** | 0.804 ** | 1 | ||||||
| P | −0.167 | −0.010 | −0.011 | 0.163 | 0.463 | 0.075 | 0.550 | 0.442 | 1 | |||||
| N | −0.741 ** | 0.571 | −0.104 | 0.640 * | 0.968 *** | 0.602 | 0.906 *** | 0.699 * | 0.410 | 1 | ||||
| Fe | −0.428 | 0.259 | −0.189 | 0.525 | 0.859 *** | 0.506 | 0.904 *** | 0.725 ** | 0.813 ** | 0.827 *** | 1 | |||
| Cu | 0.684 * | −0.536 | 0.009 | −0.625 * | −0.800 ** | −0.580 | −0.925 *** | −0.746 ** | −0.638 * | −0.836 *** | −0.887 *** | 1 | ||
| Mn | −0.741 ** | 0.486 | 0.000 | 0.753 ** | 0.906 *** | 0.497 | 0.911 *** | 0.570 | 0.562 | 0.915 *** | 0.858 *** | −0.900 *** | 1 | |
| Zn | −0.643 * | 0.350 | 0.302 | 0.797 ** | 0.768 ** | 0.565 | 0.866 *** | 0.447 | 0.578 | 0.811 ** | 0.808 ** | −0.854 *** | 0.918 *** | 1 |
| Cover of Vicia faba | ||||||||||||||
| ρb | 1 | |||||||||||||
| AWC | −0.599 ** | 1 | ||||||||||||
| pH | 0.325 | −0.687 ** | 1 | |||||||||||
| EC | −0.708 ** | 0.504 * | −0.490 | 1 | ||||||||||
| SOC | −0.829 *** | 0.729 ** | −0.641 ** | 0.840 *** | 1 | |||||||||
| Na | −0.122 | 0.602 ** | −0.482 | −0.026 | 0.297 | 1 | ||||||||
| K | −0.738 *** | 0.862 *** | −0.668 ** | 0.802 *** | 0.847 *** | 0.335 | 1 | |||||||
| Mg | −0.560 * | 0.531 * | −0.503 * | 0.264 | 0.440 | 0.381 | 0.528 * | 1 | ||||||
| P | −0.630 ** | 0.671 ** | −0.740 *** | 0.878 *** | 0.896 *** | 0.198 | 0.854 *** | 0.332 | 1 | |||||
| N | −0.735 *** | 0.666 ** | −0.517 * | 0.823 *** | 0.777 *** | 0.077 | 0.757 *** | 0.180 | 0.759 *** | 1 | ||||
| Fe | −0.112 | 0.116 | −0.042 | 0.312 | 0.371 | −0.178 | 0.156 | −0.565 * | 0.380 | 0.349 | 1 | |||
| Cu | −0.229 | 0.123 | 0.005 | 0.347 | 0.431 | −0.253 | 0.135 | −0.392 | 0.421 | 0.340 | 0.901 *** | 1 | ||
| Mn | −0.690 ** | 0.580 ** | −0.545 * | 0.824 *** | 0.867 *** | 0.074 | 0.708 ** | 0.090 | 0.822 *** | 0.840 *** | 0.655 ** | 0.631 ** | 1 | |
| Zn | −0.419 | 0.522 * | −0.243 | 0.525 * | 0.662 ** | 0.163 | 0.492 | −0.281 | 0.586 ** | 0.658 ** | 0.850 *** | 0.773 *** | 0.789 *** | 1 |
| Cover of Vicia sativa | ||||||||||||||
| ρb | 1 | |||||||||||||
| AWC | −0.563 * | 1 | ||||||||||||
| pH | −0.096 | −0.534 * | 1 | |||||||||||
| EC | −0.675 ** | 0.690 ** | −0.400 | 1 | ||||||||||
| SOC | −0.370 | 0.686 ** | −0.715 ** | 0.821 ** | 1 | |||||||||
| Na | 0.325 | −0.022 | 0.231 | −0.134 | −0.230 | 1 | ||||||||
| K | −0.516 * | 0.714 ** | −0.587 * | 0.892 ** | 0.951 ** | −0.226 | 1 | |||||||
| Mg | −0.670 ** | 0.445 | −0.128 | 0.803 ** | 0.677 ** | −0.090 | 0.747 ** | 1 | ||||||
| P | −0.366 | 0.267 | −0.186 | 0.760 ** | 0.616 * | 0.104 | 0.660 ** | 0.871 ** | 1 | |||||
| N | −0.580 * | 0.720 ** | −0.559 * | 0.819 ** | 0.849 ** | −0.279 | 0.908 ** | 0.692 ** | 0.539 * | 1 | ||||
| Fe | −0.397 | 0.504 * | −0.680 ** | 0.596 * | 0.810 ** | −0.432 | 0.720 ** | 0.538 * | 0.395 | 0.709 ** | 1 | |||
| Cu | −0.036 | 0.486 | −0.772 ** | 0.462 | 0.709 ** | −0.064 | 0.577 * | 0.159 | 0.209 | 0.448 | 0.622 * | 1 | ||
| Mn | −0.583 * | 0.731 ** | −0.332 | 0.880 ** | 0.719 ** | 0.002 | 0.810 ** | 0.811 ** | 0.754 ** | 0.767 ** | 0.454 | 0.177 | 1 | |
| Zn | −0.308 | 0.483 | −0.601 * | 0.775 ** | 0.921 ** | −0.219 | 0.860 ** | 0.781 ** | 0.766 ** | 0.724 ** | 0.745 ** | 0.533 * | 0.726 ** | 1 |
| Cover of Vicia sativa and Vicia ervilia | ||||||||||||||
| ρb | 1 | |||||||||||||
| AWC | −0.669 * | 1 | ||||||||||||
| pH | 0.347 | −0.360 | 1 | |||||||||||
| EC | −0.666 * | 0.619 | −0.349 | 1 | ||||||||||
| SOC | −0.768 ** | 0.767 ** | −0.394 | 0.802 ** | 1 | |||||||||
| Na | −0.405 | 0.610 | 0.220 | 0.184 | 0.447 | 1 | ||||||||
| K | −0.614 | 0.779 ** | −0.335 | 0.849 *** | 0.767 ** | 0.527 | 1 | |||||||
| Mg | −0.555 | 0.675 * | 0.058 | 0.233 | 0.601 | 0.892 *** | 0.582 | 1 | ||||||
| P | −0.790 ** | 0.904 *** | −0.553 | 0.774 ** | 0.904 *** | 0.467 | 0.875 *** | 0.642 * | 1 | |||||
| N | −0.840 *** | 0.656 * | −0.395 | 0.725 ** | 0.920 *** | 0.552 | 0.732 ** | 0.641 * | 0.831 ** | 1 | ||||
| Fe | −0.678 * | 0.584 | −0.632 * | 0.797 ** | 0.828 ** | 0.069 | 0.561 | 0.124 | 0.731 ** | 0.781 ** | 1 | |||
| Cu | −0.822 ** | 0.768 ** | −0.365 | 0.865 *** | 0.942 *** | 0.525 | 0.905 *** | 0.653 * | 0.928 *** | 0.932 *** | 0.738 ** | 1 | ||
| Mn | −0.750 ** | 0.652 * | −0.596 | 0.890 *** | 0.681 * | 0.033 | 0.725 ** | 0.105 | 0.777 ** | 0.638 * | 0.830 ** | 0.746 ** | 1 | |
| Zn | −0.895 *** | 0.661 * | −0.203 | 0.834 *** | 0.914 *** | 0.457 | 0.756 ** | 0.596 | 0.821 ** | 0.912 *** | 0.727 ** | 0.945 *** | 0.716 ** | 1 |
| SMS | N | P | K | Zn | Fe | Mn | Cu |
|---|---|---|---|---|---|---|---|
| (%) | (mg kg−1) | ||||||
| TT | 1.69 ± 0.07 bc | 0.11 ± 0.00 b | 1.30 ± 0.13 a | 21.80 ± 2.02 ab | 209.03 ± 15.87 c | 17.70 ± 1.45 bc | 5.66 ± 0.80 a |
| NT | 1.58 ± 0.11 c | 0.10 ± 0.00 b | 1.22 ± 0.08 a | 17.31 ± 1.20 c | 308.35 ± 34.85 a | 12.43 ± 3.03 c | 6.12 ± 0.76 a |
| VF | 1.86 ± 0.02 ab | 0.10 ± 0.01 b | 1.15 ± 0.06 ab | 20.08 ± 0.87 bc | 256.48 ± 31.67 abc | 11.72 ± 2.13 c | 6.03 ± 1.30 a |
| VS | 1.99 ± 0.23 a | 0.11 ± 0.00 b | 1.24 ± 0.22 a | 19.71 ± 1.43 bc | 228.69 ± 4.36 bc | 26.50 ± 4.36 a | 5.86 ± 0.23 a |
| VS-VE | 2.02 ± 0.09 a | 0.13 ± 0.01 a | 0.93 ± 0.07 b | 23.83 ± 1.13 a | 275.76 ± 22.83 ab | 21.88 ± 4.06 ab | 6.87 ± 0.76 a |
| SMS | Moisture | Water Activity |
|---|---|---|
| (%) | (aw) | |
| TT | 3.35 ± 0.20 b | 0.55 ± 0.05 n.s. |
| NT | 3.19 ± 0.08 b | 0.53 ± 0.05 n.s. |
| VF | 3.82 ± 0.26 a | 0.57 ± 0.06 n.s. |
| VS | 3.21 ± 0.23 b | 0.57 ± 0.05 n.s. |
| VS-VE | 3.29 ± 0.38 b | 0.52 ± 0.05 n.s. |
| SMS | Kernel Cutting Force | Kernel Color Coordinates | ||||||||
|---|---|---|---|---|---|---|---|---|---|---|
| Fracturability (mm) | Hardness (N) | Work to Shear (Ns) | Average Force (N) | Number of Fractures | L* | a* | b* | C | Hue | |
| TT | 1.65 ± 0.28 ab | 68.76 ± 15.59 ab | 56.40 ± 19.36 ab | 33.73 ± 8.43 ab | 12.48 ± 5.27 a | 45.63 ± 2.98 abc | 16.43 ± 0.89 a | 29.88 ± 2.68 ab | 34.13 ± 2.51 ab | 61.08 ± 2.23 bc |
| NT | 1.55 ± 0.33 abc | 67.98 ± 17.13 ab | 49.92 ± 17.55 bc | 32.44 ± 9.11 ab | 11.88 ± 5.17 a | 43.70 ± 3.00 c | 15.10 ± 1.78 b | 26.60 ± 3.73 c | 30.61 ± 3.97 c | 60.28 ± 2.23 c |
| VF | 1.71 ± 0.39 a | 73.11 ± 14.78 a | 64.33 ± 23.90 a | 36.48 ± 8.45 a | 13.50 ± 6.15 a | 44.22 ± 3.25 bc | 16.01 ± 1.14 a | 28.35 ± 2.67 bc | 32.57 ± 2.70 bc | 60.47 ± 1.86 c |
| VS | 1.49 ± 0.32 bc | 58.25 ± 9.75 c | 38.55 ± 10.85 c | 26.18 ± 5.86 c | 11.50 ± 5.15 a | 45.99 ± 4.43 ab | 16.48 ± 1.93 a | 31.30 ± 4.49 a | 35.39 ± 4.78 a | 62.11 ± 1.65 ab |
| VS-VE | 1.37 ± 0.34 c | 60.57 ± 14.66 bc | 40.23 ± 14.88 c | 28.91 ± 6.96 bc | 11.78 ± 5.89 a | 46.56 ± 4.82 a | 16.16 ± 1.64 a | 31.47 ± 3.22 a | 35.40 ± 3.43 a | 62.78 ± 1.81 a |
| SMS | Organic Acids (OA) | Sugars | |||||||
|---|---|---|---|---|---|---|---|---|---|
| Oxalic | Citric | Tartaric | Malic | ƩOA | Sucrose | Glucose | Fructose | ƩSugars | |
| (g kg−1) | (g kg−1) | ||||||||
| TT | 2.03 ± 0.09 a | 3.10 ± 0.14 abc | 2.48 ± 0.10 a | 6.33 ± 4.23 ab | 13.95 ± 4.39 ab | 36.23 ± 2.62 a | 6.64 ± 1.50 b | 6.52 ± 1.11 ab | 49.38 ± 2.18 a |
| NT | 1.90 ± 0.07 a | 2.66 ± 0.39 c | 2.14 ± 0.15 ab | 7.17 ± 0.84 ab | 13.88 ± 1.34 ab | 27.84 ± 2.37 b | 14.18 ± 0.40 a | 6.50 ± 0.77 ab | 48.50 ± 3.28 a |
| VF | 2.09 ± 0.11 a | 3.56 ± 0.16 a | 2.32 ± 0.13 ab | 9.45 ± 4.32 a | 17.41 ± 4.45 a | 26.34 ± 1.68 b | 15.32 ± 1.24 a | 5.68 ± 0.68 b | 47.33 ± 2.99 a |
| VS | 2.04 ± 0.12 a | 3.39 ± 0.58 ab | 2.01 ± 0.26 b | 3.85 ± 0.42 ab | 11.29 ± 1.25 ab | 29.58 ± 2.55 b | 14.94 ± 1.14 a | 6.96 ± 1.06 ab | 51.45 ± 4.59 a |
| VS-VE | 1.98 ± 0.04 a | 2.78 ± 0.06 bc | 1.56 ± 0.22 c | 3.41 ± 0.26 b | 9.73 ± 0.44 b | 37.98 ± 2.26 a | 6.86 ± 1.02 b | 7.74 ± 1.04 a | 52.58 ± 2.27 a |
| SMS | ABTS•+ | DPPH• | FRAP | TPC | SFA | MUFA | PUFA | Total Fatty Acids |
|---|---|---|---|---|---|---|---|---|
| (mmol Trolox kg−1) | (g GAE kg−1) | (g kg−1) | ||||||
| TT | 7.27 ± 0.67 b | 13.99 ± 1.27 a | 7.71 ± 1.66 a | 2.16 ± 1.23 c | 39.36 ± 2.01 a | 144.56 ± 10.09 a | 65.13 ± 4.52 a | 249.25 ± 15.88 a |
| NT | 10.42 ± 3.00 a | 14.84 ± 0.75 a | 8.34 ± 2.14 a | 2.73 ± 1.25 bc | 33.78 ± 4.59 b | 121.08 ± 11.69 bc | 58.03 ± 6.30 bc | 213.00 ± 22.58 b |
| VF | 11.08 ± 1.63 a | 16.03 ± 2.98 a | 8.97 ± 1.43 a | 2.65 ± 0.49 bc | 36.89 ± 1.15 ab | 132.87 ± 8.36 ab | 63.28 ± 2.92 ab | 233.17 ± 7.57 a |
| VS | 12.35 ± 1.18 a | 16.11 ± 0.63 a | 10.50 ± 2.56 a | 3.88 ± 1.61 ab | 35.22 ± 1.38 b | 114.12 ± 14.10 c | 52.20 ± 6.56 c | 201.50 ± 12.79 b |
| VS-VE | 11.22 ± 3.06 a | 14.68 ± 0.33 a | 10.44 ± 2.02 a | 5.14 ± 1.03 a | 38.89 ± 1.81 a | 139.01 ± 3.68 a | 61.07 ± 1.93 ab | 238.75 ± 4.50 a |
| Soil Parameter | Almond Quality Parameters | ||||||||||||||||
|---|---|---|---|---|---|---|---|---|---|---|---|---|---|---|---|---|---|
| Oxalic | Citric | Tartaric | Malic | ƩOA | Sucrose | Glucose | Fructose | ƩSugars | ABTS•+ | DPPH• | FRAP | TPC | SFA | MUFA | PUFA | Total Fatty Acids | |
| SOC | −0.236 | −0.363 * | −0.723 *** | −0.658 *** | −0.700 *** | 0.555 *** | −0.388 | 0.623 *** | 0.565 *** | 0.216 | −0.086 | 0.383 * | 0.607 *** | 0.041 | −0.179 | −0.440 ** | −0.250 |
| N | −0.123 | −0.164 | −0.410 * | −0.613 *** | −0.607 *** | 0.445 ** | −0.281 | 0.501 ** | 0.495 ** | 0.115 | −0.054 | 0.292 | 0.392 * | 0.003 | −0.261 | −0.497 ** | −0.325 |
| P | 0.335 | 0.355 | −0.430 ** | −0.354 | −0.305 | 0.248 | −0.082 | 0.268 | 0.358 | 0.342 | 0.201 | 0.448 ** | 0.479 ** | 0.241 | −0.039 | −0.226 | −0.063 |
| K | 0.310 | 0.267 | 0.544 *** | 0.079 | 0.157 | 0.357 | −0.475 ** | −0.141 | −0.076 | −0.515 ** | −0.186 | −0.269 | −0.348 | 0.484 ** | 0.498 ** | 0.421* | 0.533 ** |
| AWC | −0.190 | −0.201 | −0.320 | −0.566 *** | −0.563 *** | 0.334 | −0.173 | 0.446 ** | 0.434 ** | 0.098 | −0.053 | 0.231 | 0.297 | −0.118 | −0.359 | −0.551 *** | −0.424 ** |
Disclaimer/Publisher’s Note: The statements, opinions and data contained in all publications are solely those of the individual author(s) and contributor(s) and not of MDPI and/or the editor(s). MDPI and/or the editor(s) disclaim responsibility for any injury to people or property resulting from any ideas, methods, instructions or products referred to in the content. |
© 2023 by the authors. Licensee MDPI, Basel, Switzerland. This article is an open access article distributed under the terms and conditions of the Creative Commons Attribution (CC BY) license (https://creativecommons.org/licenses/by/4.0/).
Share and Cite
Cárceles Rodríguez, B.; Durán Zuazo, V.H.; Herencia Galán, J.F.; Lipan, L.; Soriano, M.; Hernández, F.; Sendra, E.; Carbonell-Barrachina, Á.A.; Gálvez Ruiz, B.; García-Tejero, I.F. Soil Management Strategies in Organic Almond Orchards: Implications for Soil Rehabilitation and Nut Quality. Agronomy 2023, 13, 749. https://doi.org/10.3390/agronomy13030749
Cárceles Rodríguez B, Durán Zuazo VH, Herencia Galán JF, Lipan L, Soriano M, Hernández F, Sendra E, Carbonell-Barrachina ÁA, Gálvez Ruiz B, García-Tejero IF. Soil Management Strategies in Organic Almond Orchards: Implications for Soil Rehabilitation and Nut Quality. Agronomy. 2023; 13(3):749. https://doi.org/10.3390/agronomy13030749
Chicago/Turabian StyleCárceles Rodríguez, Belén, Víctor Hugo Durán Zuazo, Juan Francisco Herencia Galán, Leontina Lipan, Miguel Soriano, Francisca Hernández, Esther Sendra, Ángel Antonio Carbonell-Barrachina, Baltasar Gálvez Ruiz, and Iván Francisco García-Tejero. 2023. "Soil Management Strategies in Organic Almond Orchards: Implications for Soil Rehabilitation and Nut Quality" Agronomy 13, no. 3: 749. https://doi.org/10.3390/agronomy13030749