Article

Response of Water-Nitrogen Distribution and Use to Water Deficit under Different Applied Nitrogen Fertilizer Rates in Bromus inermis Grassland

College of Water Conservancy and Hydropower Engineering, Gansu Agricultural University, Lanzhou 730070, China
*
Author to whom correspondence should be addressed.
Agronomy 2023, 13(3), 745; https://doi.org/10.3390/agronomy13030745
Submission received: 3 February 2023 / Revised: 25 February 2023 / Accepted: 1 March 2023 / Published: 3 March 2023

Abstract

:
This study was about the water-nitrogen regulation model and its soil nutrient environment effect for increasing the yield and efficiency of Bromus inermis in the Hexi Corridor, Gansu Province, China. Bromus inermis was used as the research object in this study and four irrigation management types and four nitrogen application levels were set. The four irrigation management types (controlled by the percentage of field capacity (θf) at the jointing stage) were 75–85% (W0), 65–85% (W1), 55–85% (W2) and 45–85% (W3). The four nitrogen application levels were pure nitrogen 0 kg·ha−1 (N0), 60 kg·ha−1 (N1), 120 kg·ha−1 (N2) and 180 kg·ha−1 (N3). The effects of water-nitrogen regulation on the spatial and temporal distribution of soil moisture and nitrate nitrogen (NO3–N), plant height, chlorophyll content, yield and water-nitrogen use efficiency of Bromus inermis were studied. Results demonstrated that (1) soil water content (SWC) was mainly affected by irrigation and W1 treatment helped maintain shallow soil (0–40 cm) water’s stability and avoided water redundancy or deficit in the 60–80 cm soil layer. The distribution of soil NO3–N was mainly affected by nitrogen application. The N2 treatment could effectively increase the NO3–N content in shallow soil (0–40 cm) and prevent nitrate-nitrogen leaching in the 60–100 cm soil layer. (2) Irrigation and nitrogen application could significantly increase the plant height and chlorophyll content of each cut of Bromus inermis. The average plant height and chlorophyll content of the N2W1 treatment were 66.99% and 30.30% higher than N0W3. (3) At the same time, irrigation and nitrogen application could significantly increase the yield of each cut of Bromus inermis, and the interaction between the two had a significant effect on the total yield. The total yield of the N2W1 treatment was the highest (12,259.54 kg·ha−1), 157.95% higher than N0W3. Irrigation and nitrogen application could significantly improve the water-nitrogen use efficiency of Bromus inermis, and their interaction only significantly impacted the partial-factor productivity of the applied nitrogen (PFPN). Meanwhile, the N2W2 treatment had the highest water use efficiency (WUE) (23.12 kg·m−3), and the N1W1 treatment had the highest PFPN (170.87 kg·kg−1). In summary, the moderate nitrogen application rate (120 kg·ha−1) combined with mild water deficit (65–85% θf at the jointing stage) could not only promote the high yield of Bromus inermis, but also avoid the leaching of water and nitrogen in deep soil. It is a suitable water and nitrogen management mode for Bromus inermis in the Hexi Corridor of Gansu Province, China.

1. Introduction

The high-quality development of the herbage industry is the key to improving the ecological environment of grassland and ensuring national food security [1,2]. However, the limited long-term supply of water and fertilizer restricts the healthy development of the herbage industry [3]. On the one hand, the shortage of water resources and the lack of soil nitrogen have restricted the normal growth and output of herbage and, to some extent, restricted the expansion and distribution of forage, increasing the dependence on natural grassland and leading to the deterioration of the ecological environment [4,5]. On the other hand, the current herbage market has a strong demand for high-quality herbage [6,7], forcing farmers to blindly invest excessive water and nitrogen resources in pursuit of high yield and efficiency, resulting in the lower utilization of water and fertilizer resources, soil nitrogen leaching loss and serious groundwater pollution [8,9]. Therefore, researching the production potential of water and nitrogen management in the forage industry would help alleviate the shortage of forage supply and the waste of water and fertilizer resources.
Water and nitrogen are the main environmental factors limiting crop growth and yield formation, and they are also the important factors affecting the soil nutrient environment. There are obvious interactions between water and nitrogen [10,11]. As a good solvent and carrier, water can accelerate the dissolution and mineralization of nitrogen fertilizer in the soil and transport it to crop roots by diffusion or mass flow [12,13], thus promoting the absorption and utilization of nutrients by plants. Nitrogen application can increase soil water potential and activate deep soil water, thus increasing soil water availability and improving crop growth environment [14]. Many studies have shown that the optimal allocation of water and nitrogen could give full play to the coupling effect of water and nitrogen, achieve the high yield and high efficiency of crops and effectively avoid the waste of resources. Cong et al. [15] found in the study of the North China Plain that the mode of nitrogen reduction and water adaptation with nitrogen application of 255 kg·ha−1 and irrigation of 370 mm could not only meet the growing needs of winter wheat but also increased the utilization of soil water storage by 41.12 mm and reduced nitrate leaching by 15.87% compared with high nitrogen water (nitrogen application of 330 kg·ha−1 and irrigation of 495 mm). Ahmad et al. [16] found in Pakistan that the response of maize plant height and grain yield to nitrogen fertilizer depended on water availability. When the nitrogen application rate was 240 kg·ha−1, there was no significant difference in maize plant height and grain yield between full irrigation and 80% full irrigation. However, it could improve WUE and economic benefits. Bahrami et al. [17] found that in the arid and semi-arid regions of Iran, under full irrigation, the WUE of quinoa with 250 kg·ha−1 nitrogen application was 42% higher than that without nitrogen application. In contrast, within 75% full irrigation, the value could reach 67% and the accumulation of nitrate nitrogen (NO3–N) in the upper soil increased while the loss of NO3–N in the deep soil reduced. That was, reasonable water deficit and nitrogen fertilizer application could help to improve water and nitrogen use efficiency. García-López et al. [18] found in the semi-arid region of southern Spain that increasing the nitrogen application rate could not increase sunflower yield when water was seriously deficient and when the irrigation amount was 60–80% of full irrigation. The nitrogen application rate was 100–150 kg·ha−1. There was a significant interaction effect between water and nitrogen on sunflower yield. However, the previous water-nitrogen regulation research pays more attention to food and economic crops. There are few studies on forage production and obvious spatial differences in water and nitrogen supply thresholds.
The Hexi Corridor of Gansu Province is the main producing area of high-quality herbage in China. However, the problems of natural grassland degradation, low forage yield caused by perennial drought and soil nutrient loss are more prominent [19]. At the same time, planting artificial grassland could help improve soil structure, maintain ecosystem stability and promote the herbage industry’s vigorous development and the effective recovery of degraded grassland [20,21]. Bromus inermis is considered the best grass planting in the Hexi Corridor of Gansu Province because of its cold and drought resistance, large leaf size, good palatability, rich nutrition and strong adaptability [22]. Currently, most studies on Bromus inermis focus on germplasm resource screening, genetic theory and the mixed-sowing effect of leguminous and gramineous pasture [21,23,24]. There needs to be more systematic research on the growth characteristics and yield changes of Bromus inermis under the water-nitrogen regulation mode in the Hexi Corridor of Gansu Province. In summary, this study used three-year-old Bromus inermis as the object aiming to: (1) clarify the effects of water-nitrogen regulation on the spatial and temporal distribution of water and nitrogen in grassland, and the growth, yield and water and nitrogen use efficiency of Bromus inermis; (2) obtain the high yield, high efficiency and eco-friendly water-nitrogen regulation mode of Bromus inermis in the Hexi Corridor of Gansu Province, China.

2. Materials and Methods

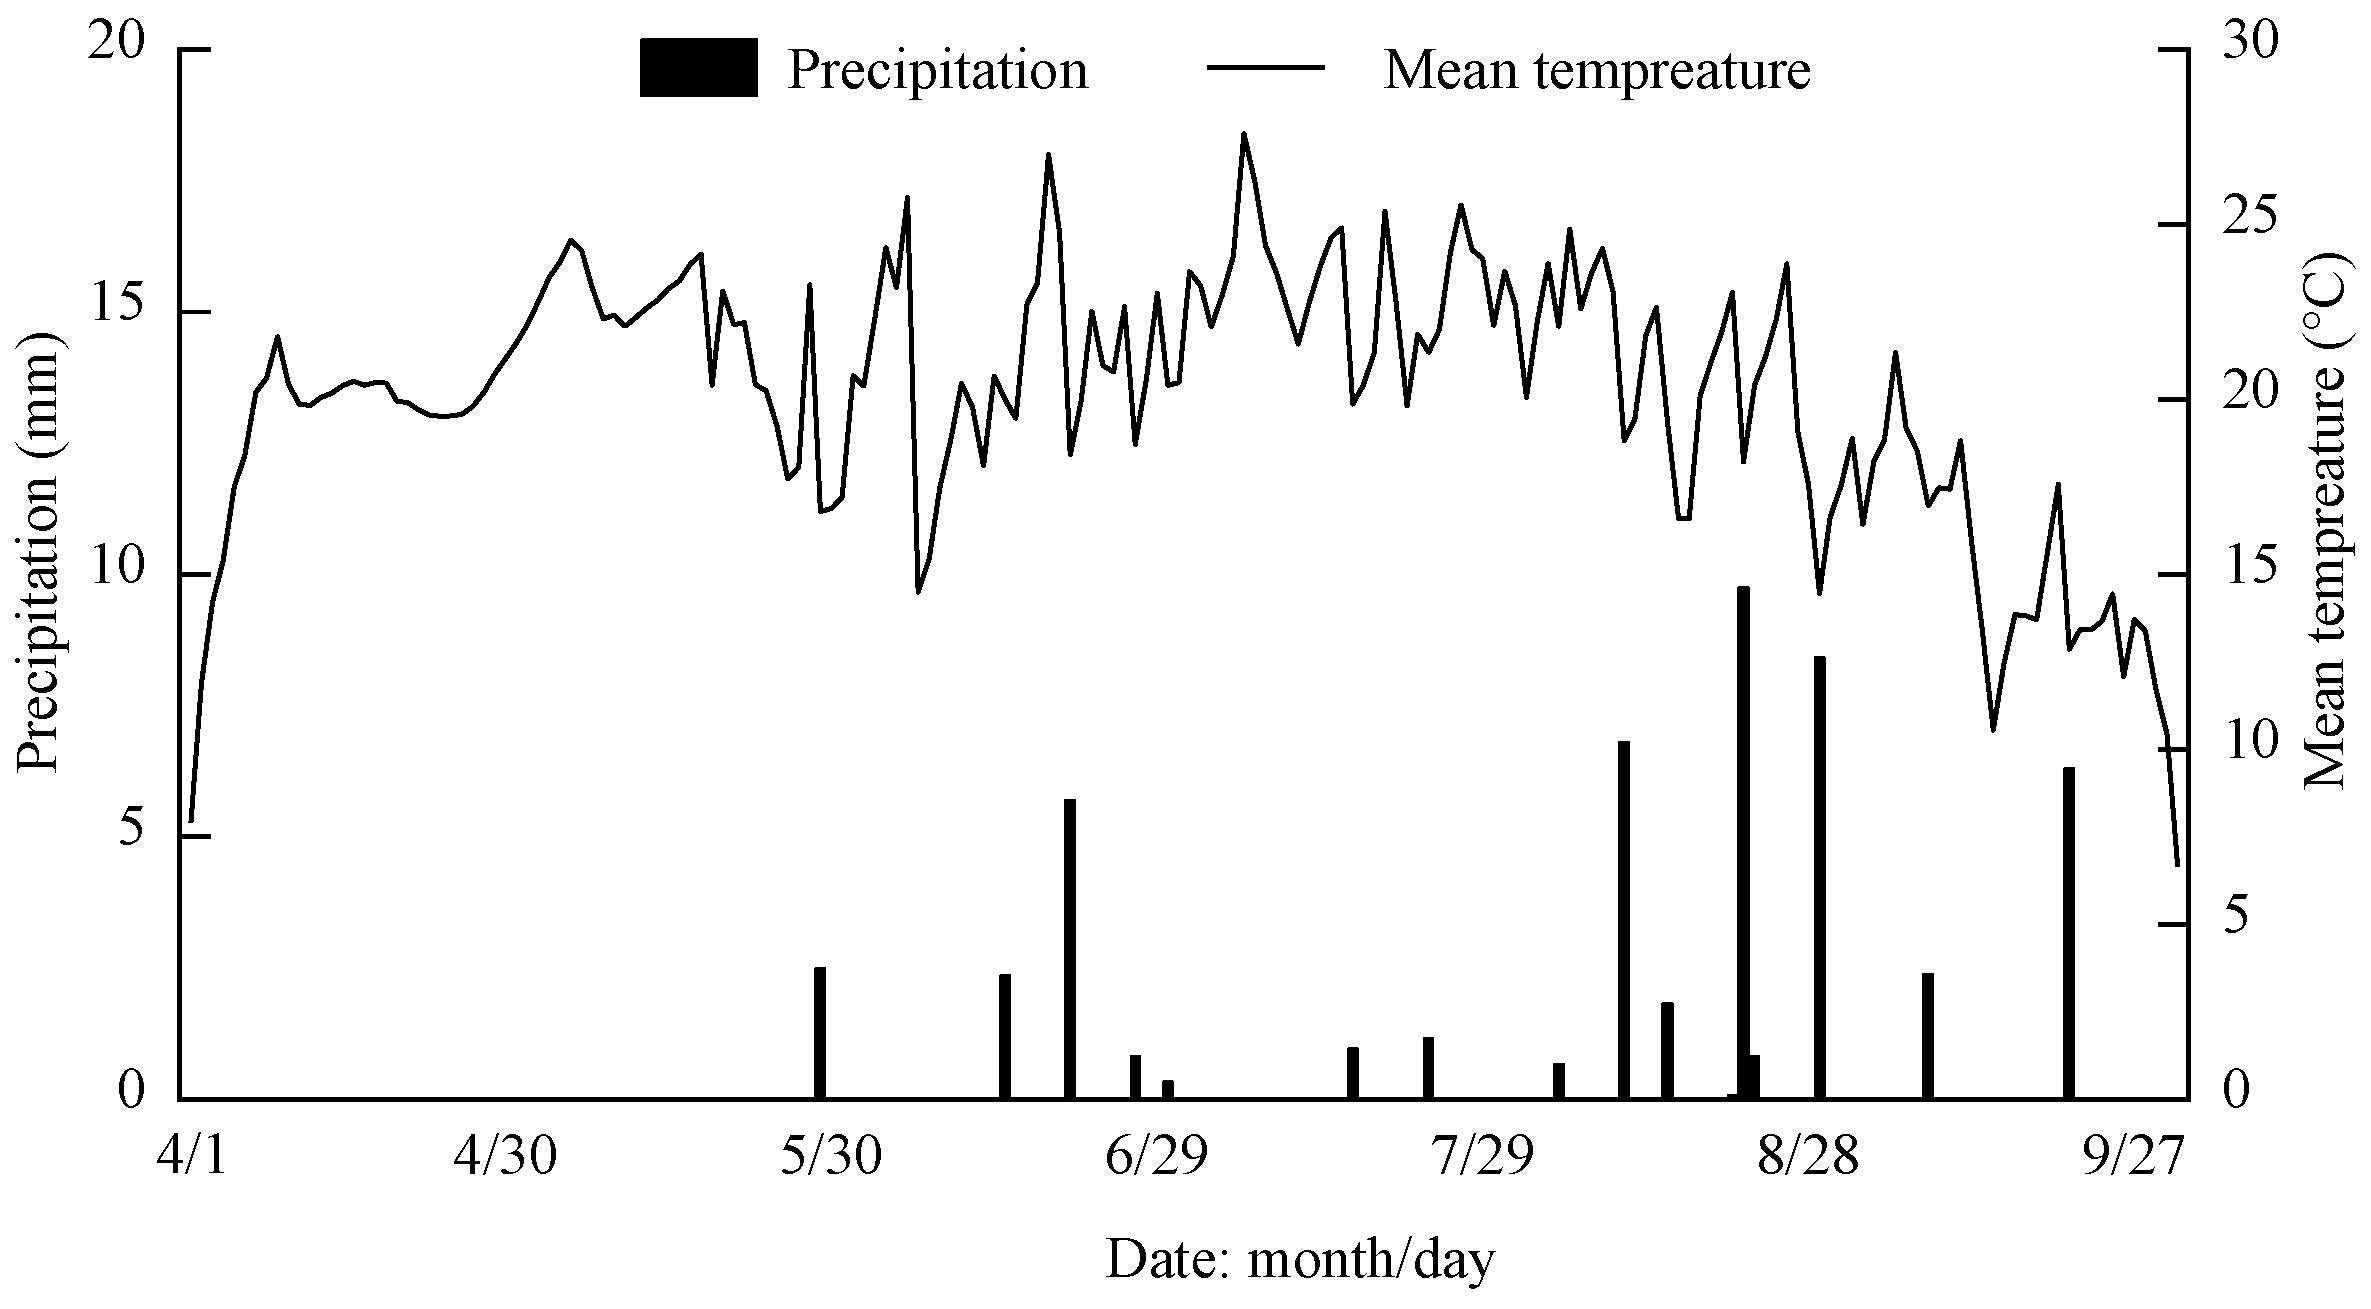
2.1. Description of the Experimental Site

The experiment was conducted at Minghua Township Test Station (39°67′ N, 98°47′ E, altitude 1387 m), Sunan Yugu Autonomous County, Zhangye, Gansu Province, China, from April to October 2020. The experimental region had a typical inland arid climate, with annual sunshine hours of 3034 h, precipitation of 90 mm, evaporation of 1731 mm, temperature of 7.3 °C and a frost-free period of 131 d on average, respectively. The meteorological data were measured by a small intelligent agrometeorological station (TH-CQX meteorological Station, Tianhe Environment Technology Co., Ltd, Weifang, Shandong, China). The precipitation during the growth period of Bromus inermis was 50.9 mm, and the average temperature was 20.1 °C (Figure 1). The soil type of the experimental region was sandy loam, and the soil layer of 0–120 cm had an average dry bulk density of soil of 1.51 g·cm−3, a field capacity of 34.0%, a wilting coefficient of 8.8% (volumetric water content) and a pH of 7.4. The nutrient contents of the topsoil in the experimental region were as follows: 3.16 g·kg−1 of organic matter, 0.22 g·kg−1 of total nitrogen, 0.24 g·kg−1 of total phosphorus, 7.60 g·kg−1 of total potassium, 7.65 mg·kg−1 of NO3–N, 3.18 mg·kg−1 of available phosphorus and 257.66 mg·kg−1 of available potassium.

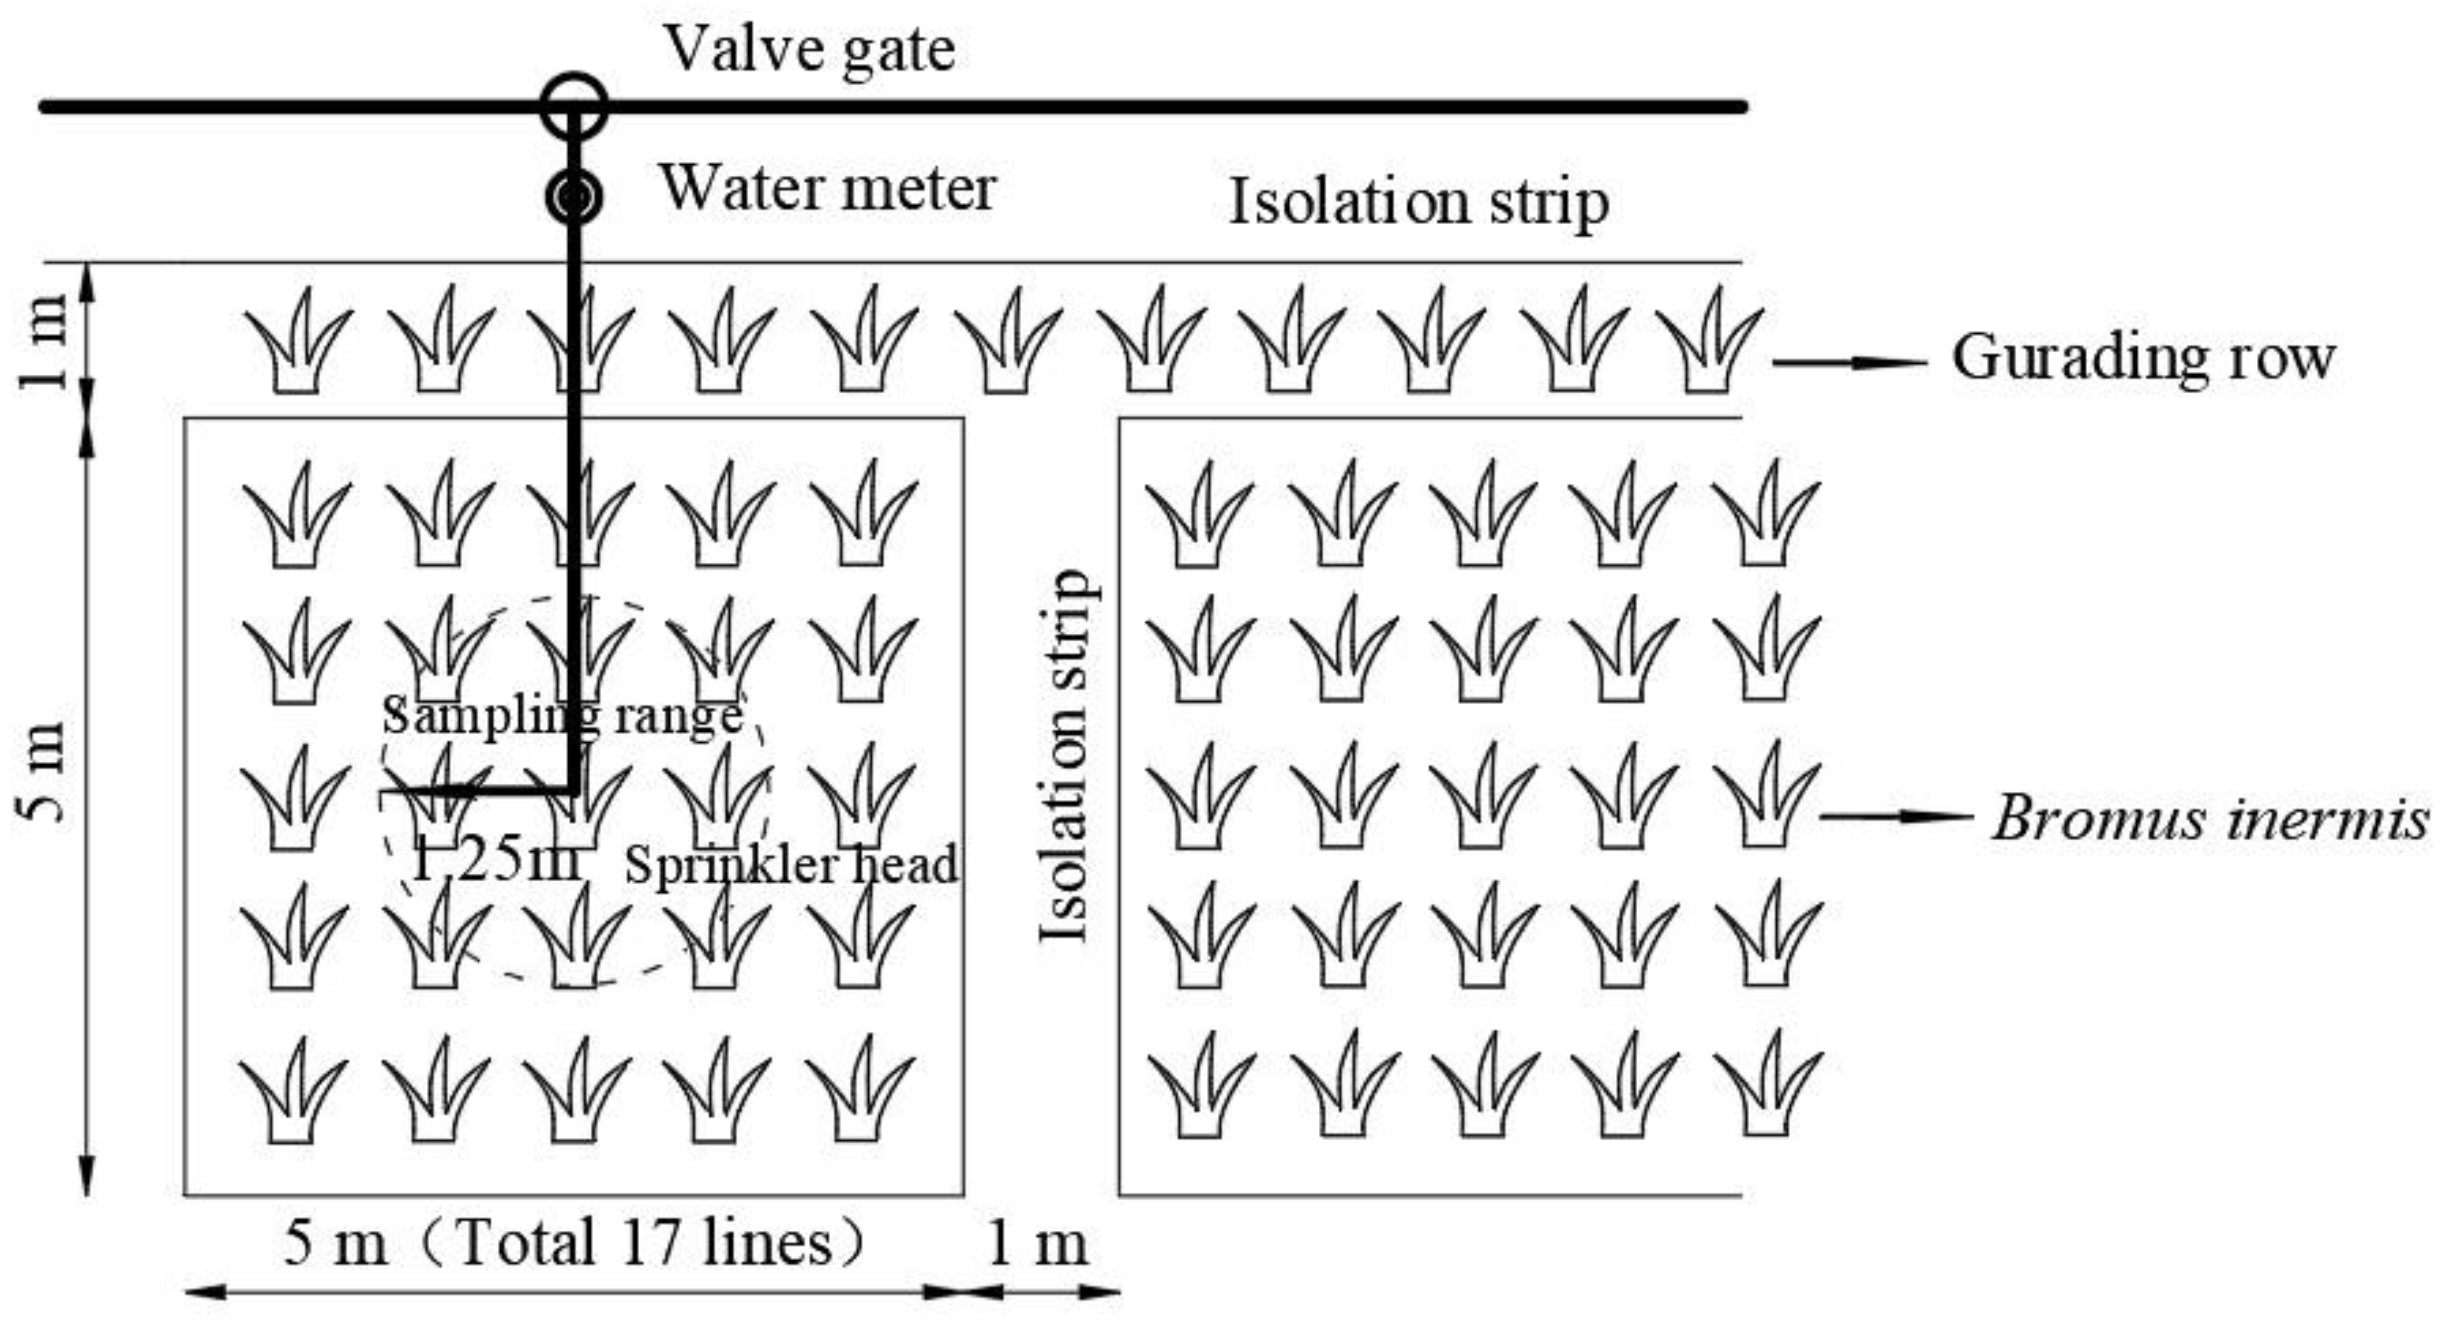
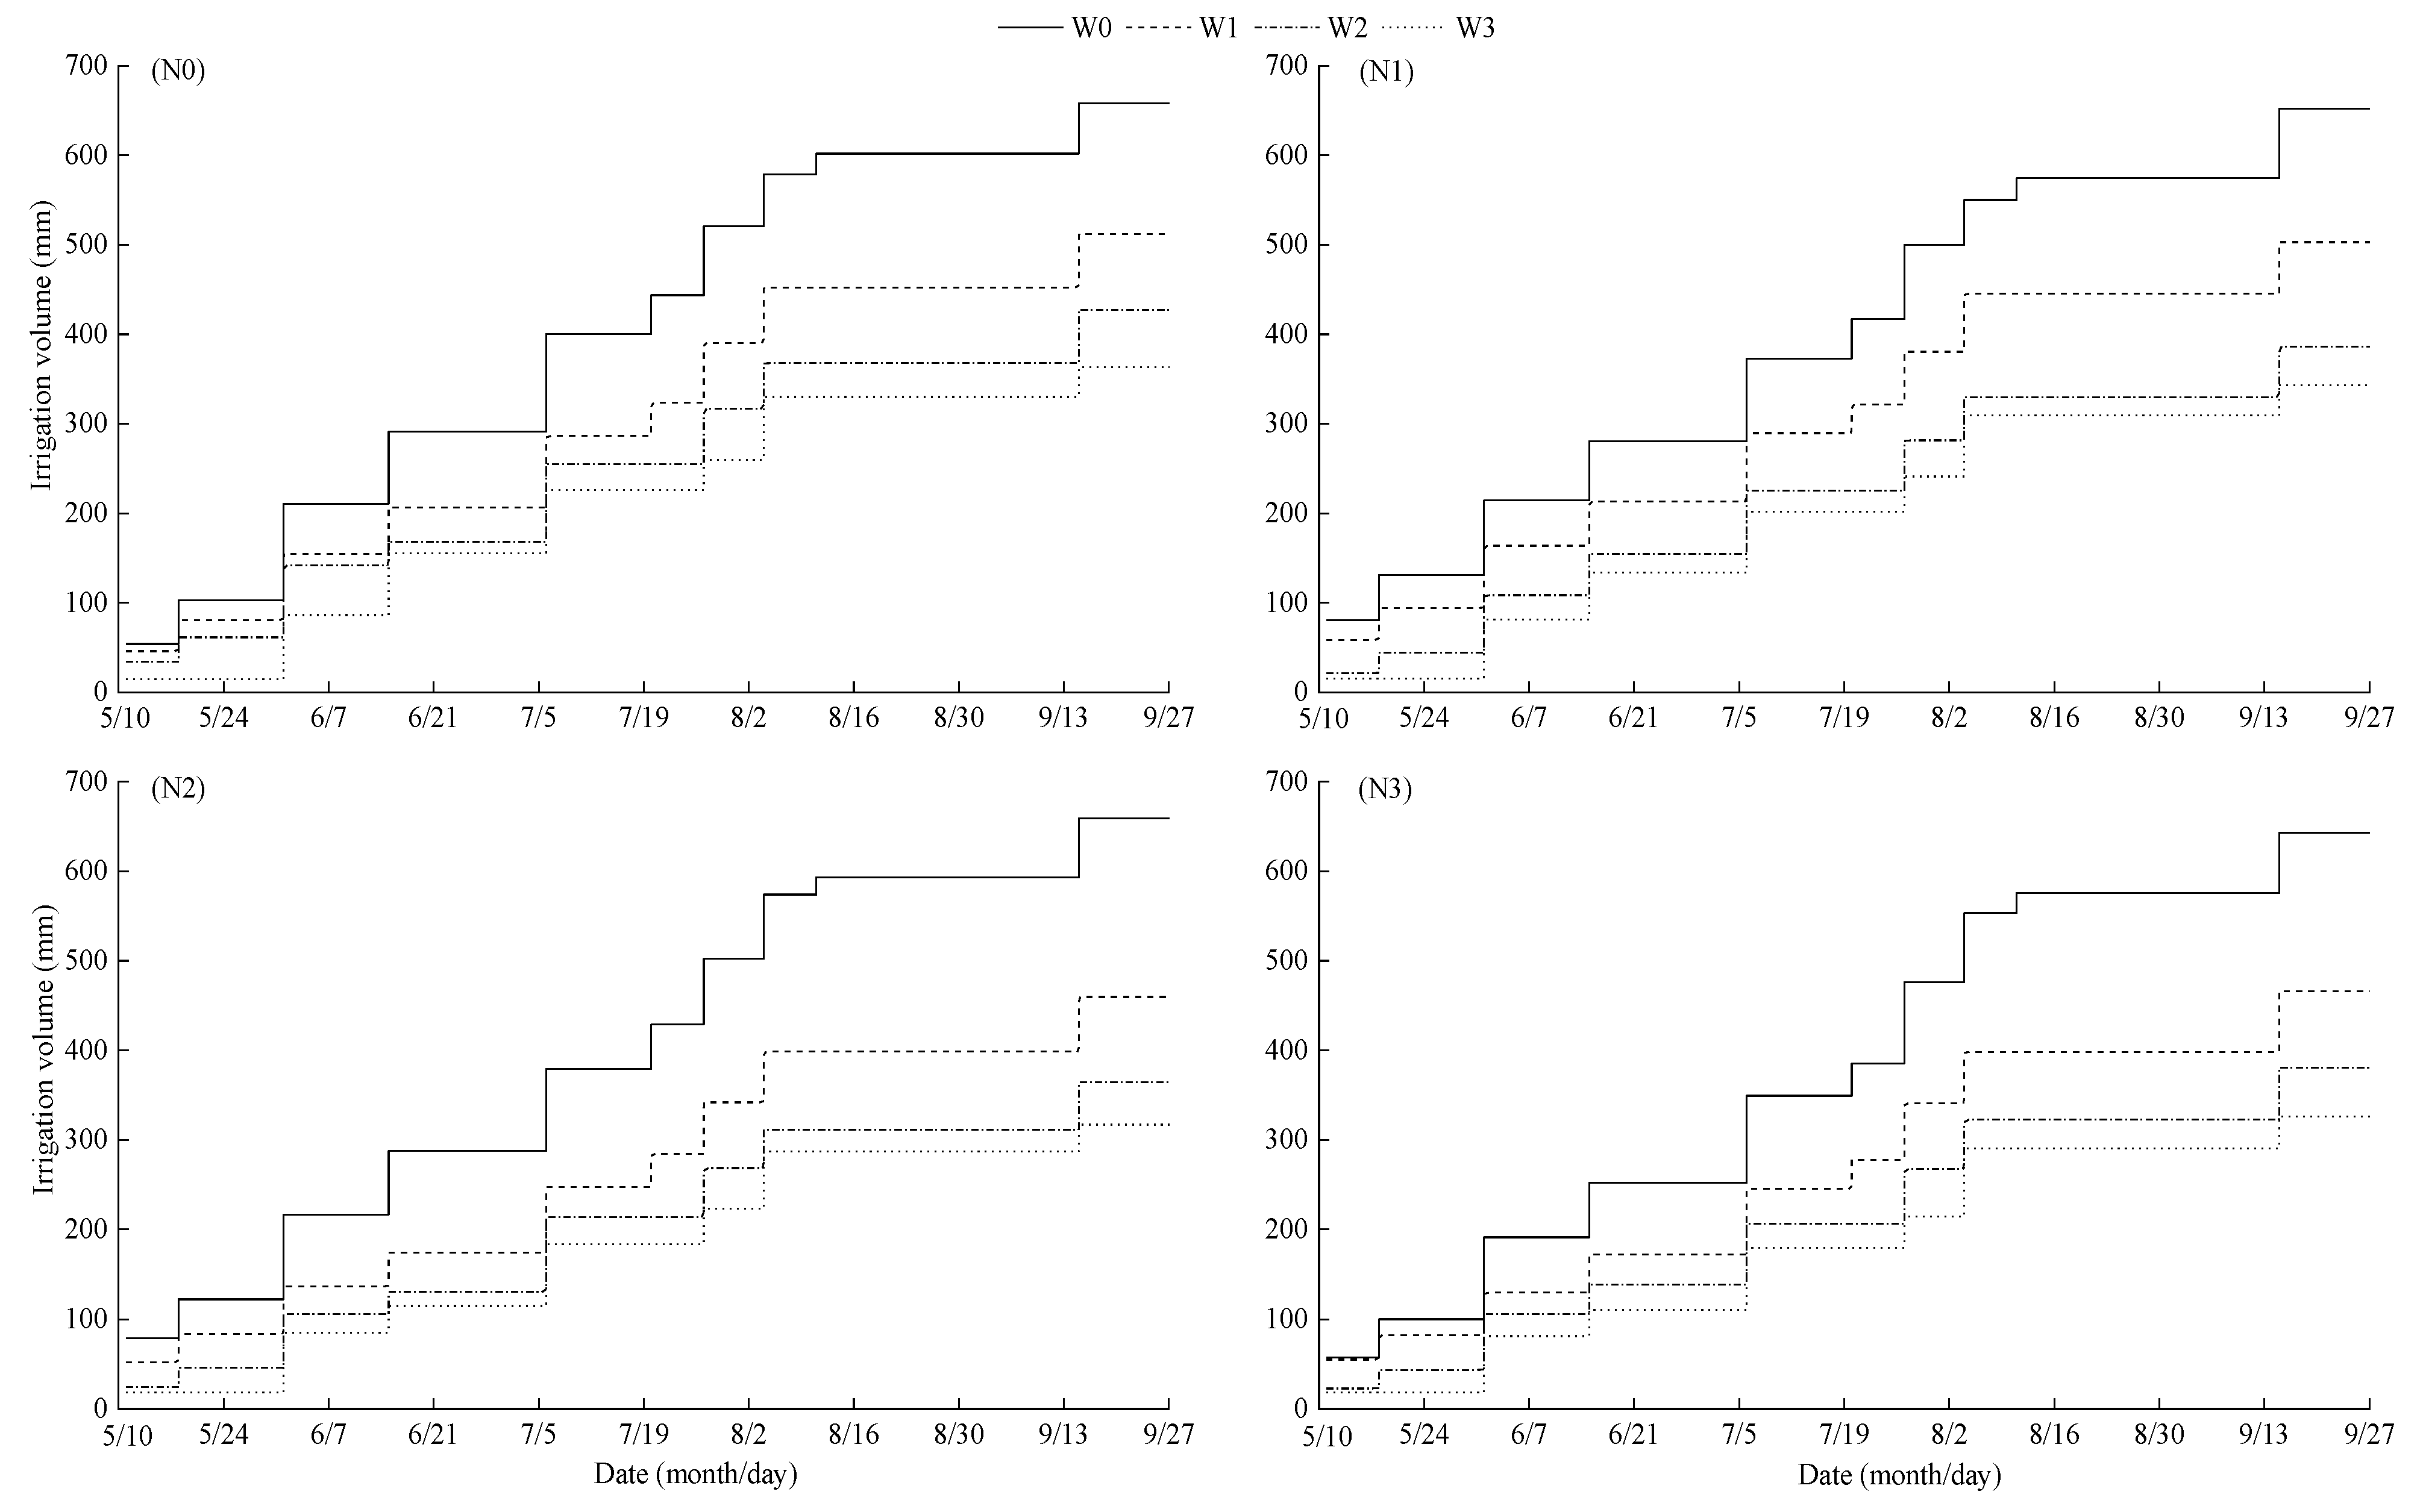
2.2. Experimental Design and Field Management

The Bromus inermis (Bromus inermis cv. Carlton, provided by Pratacultural College of Gansu Agricultural University, Lanzhou, Gansu, China) was sown through drill-sowing on 8 May 2018. The sowing amount, the sowing depth and the spacing were 30 kg·ha−1, 2 cm and 30 cm, respectively. From sowing to the beginning of the experiment, each plot was under unified management. The irrigation method was spray irrigation. PE hot-melt pipes were laid in each residential area and sprinklers (Butterfly sprinkler, provided by DaYu Water-saving Co., Ltd., JiuQuan, GanSu, China) were arranged in the center with a spraying radius of 2–4 m (Figure 2).
The experiment adopted a two-factor complete randomized block with 4 irrigation management and 4 nitrogen (pure nitrogen) application levels. According to the local production practice and other research [25], irrigation management was 75–85% field water capacity (θf, W0, full irrigation), 65–85% θf (W1, slight water deficit), 55–85% θf (W2, moderate water deficit) and 45–85% θf (W3, severe water deficit). The upper and lower limits of water content were set based on the percentage of soil volume water content in theθf at the jointing stage. In the meantime, full irrigation was conducted for the rest of the growth period. The planned depth of the wet layer was 80 cm. Irrigation began when the average soil moisture content in the planned wetting layer reached the lower limit of each irrigation management until it reached the upper limit (85% θf). Meanwhile, valves and water meters (with an accuracy of 0.0001 m3) were installed independently in each community to control water. The irrigation process of each treatment is shown in Figure 3. The nitrogen application levels (pure nitrogen, urea, China National Petroleum Corporation, Beijing, China, N ≥ 46%) were 0 kg·ha−1 (N0, no nitrogen), 60 kg·ha−1 (N1, low nitrogen), 120 kg·ha−1 (N2, medium nitrogen) and 180 kg·ha−1 (N3, high nitrogen). It was applied at the returning green stage of the first cut and the regeneration stages of the second and third cuts (in the middle of April, the first ten days of June and the beginning of August 2020). The application ratio of the three cuts was 5:3:2. There were a total of 16 treatments, each repeated three times, which comprised 48 plots, each measuring 25 m2 (5 m × 5 m). The interval between plots was 1 m. Meanwhile, a protective row 1 m wide was set around the test site. Before the test was carried out, water was uniformly irrigated to the field water capacity. During the experiment, Bromus inermis was mowed three times (at the end of the heading stage) on 10 June, 31 July and 27 September. Meanwhile, other field management was consistent with the local high-yield fields of Bromus inermis.

2.3. Indicators and Methods for Measurement

2.3.1. Soil Moisture Content (SWC, %)

A probe tube was randomly arranged at a distance of 1.25 m from the center of each small area, and the soil moisture content (SWC) of the 0–120 cm soil layer was measured by portable time-domain reflectometer TDR (PICO-BT, IMKO GMBH, Ettlingen, Germany). It was measured every 7 days, and additional surveys were carried out before and after irrigation and after precipitation. Meanwhile, it was calibrated with the drying method every 15 days. The soil moisture data were applied to determine the irrigation time and volume.

2.3.2. Soil NO3–N Content (mg·kg−1)

After each cut of Bromus inermis was mowed, random sampling points were selected at a distance of 1.25 m from the center of each plot (keeping a distance from the TDR measuring tube); the measured depth was 1 m (10 cm interval within 0–40 cm, 20 cm interval within 40–100 cm). After the soil sample was air-dried, it was screened by a 2 mm sifter. Finally, the soil NO3–N content was determined through KCl digest-indophenol blue colorimetry of 2 mol/L.

2.3.3. Plant Height (cm) and Chlorophyll Content

Before cutting each cut of Bromus inermis, 7 plants with similar growth potential were randomly selected from each plot and the plant height (accurate to 0.1 cm) was measured with steel tapes. Meanwhile, the chlorophyll content was measured with a hand-held chlorophyll meter (Nissan SPAD-502, Japan).

2.3.4. Yield (kg·ha−1)

After the end of the heading period, two 1 m × 1 m sample areas in each plot were cut at 5 cm from the ground and fixation was conducted at 105 °C for 30 min. Then, samples were dried at 75 °C for 48 h. Finally, the dried weight was weighed and converted into yield.

2.3.5. Water-Nitrogen Use Efficiency

(1)
WUE (kg·m−3) [17]
W U E = Y / E T a
E T a = I + P + U Δ W D R
where Y is the yield of Bromus inermis (kg·ha−1); ETa is the water consumption (mm); I is the irrigation volume (mm); P is the effective precipitation (mm); U is the amount of groundwater recharge (mm) (the groundwater depth is ignored due to its depth); D is the amount of deep leakage (mm), which is ignored; R is the surface runoff (mm), which is ignored; ΔW is the change of soil moisture from the beginning to the end of the test (mm).
(2)
PFPN (kg·kg−1) [24]
P F P N = Y / N
where N is nitrogen application rate (kg·ha−1).

2.4. Data Analysis

IBM SPSS Statistics 23.0 software (IBM Inc., New York, NY, USA) was used for the statistical analysis of the data. Two-way ANOVA was used to test the effects of water and nitrogen and their interaction on the plant height, chlorophyll content, yield and water-nitrogen use efficiency of Bromus inermis (p < 0.05). The figures were produced using Origin 9.0 (Originlap Crop., Northampton, MA, USA) and Surfer 18 (Golden Software Inc., Golden, CO, USA).

3. Results

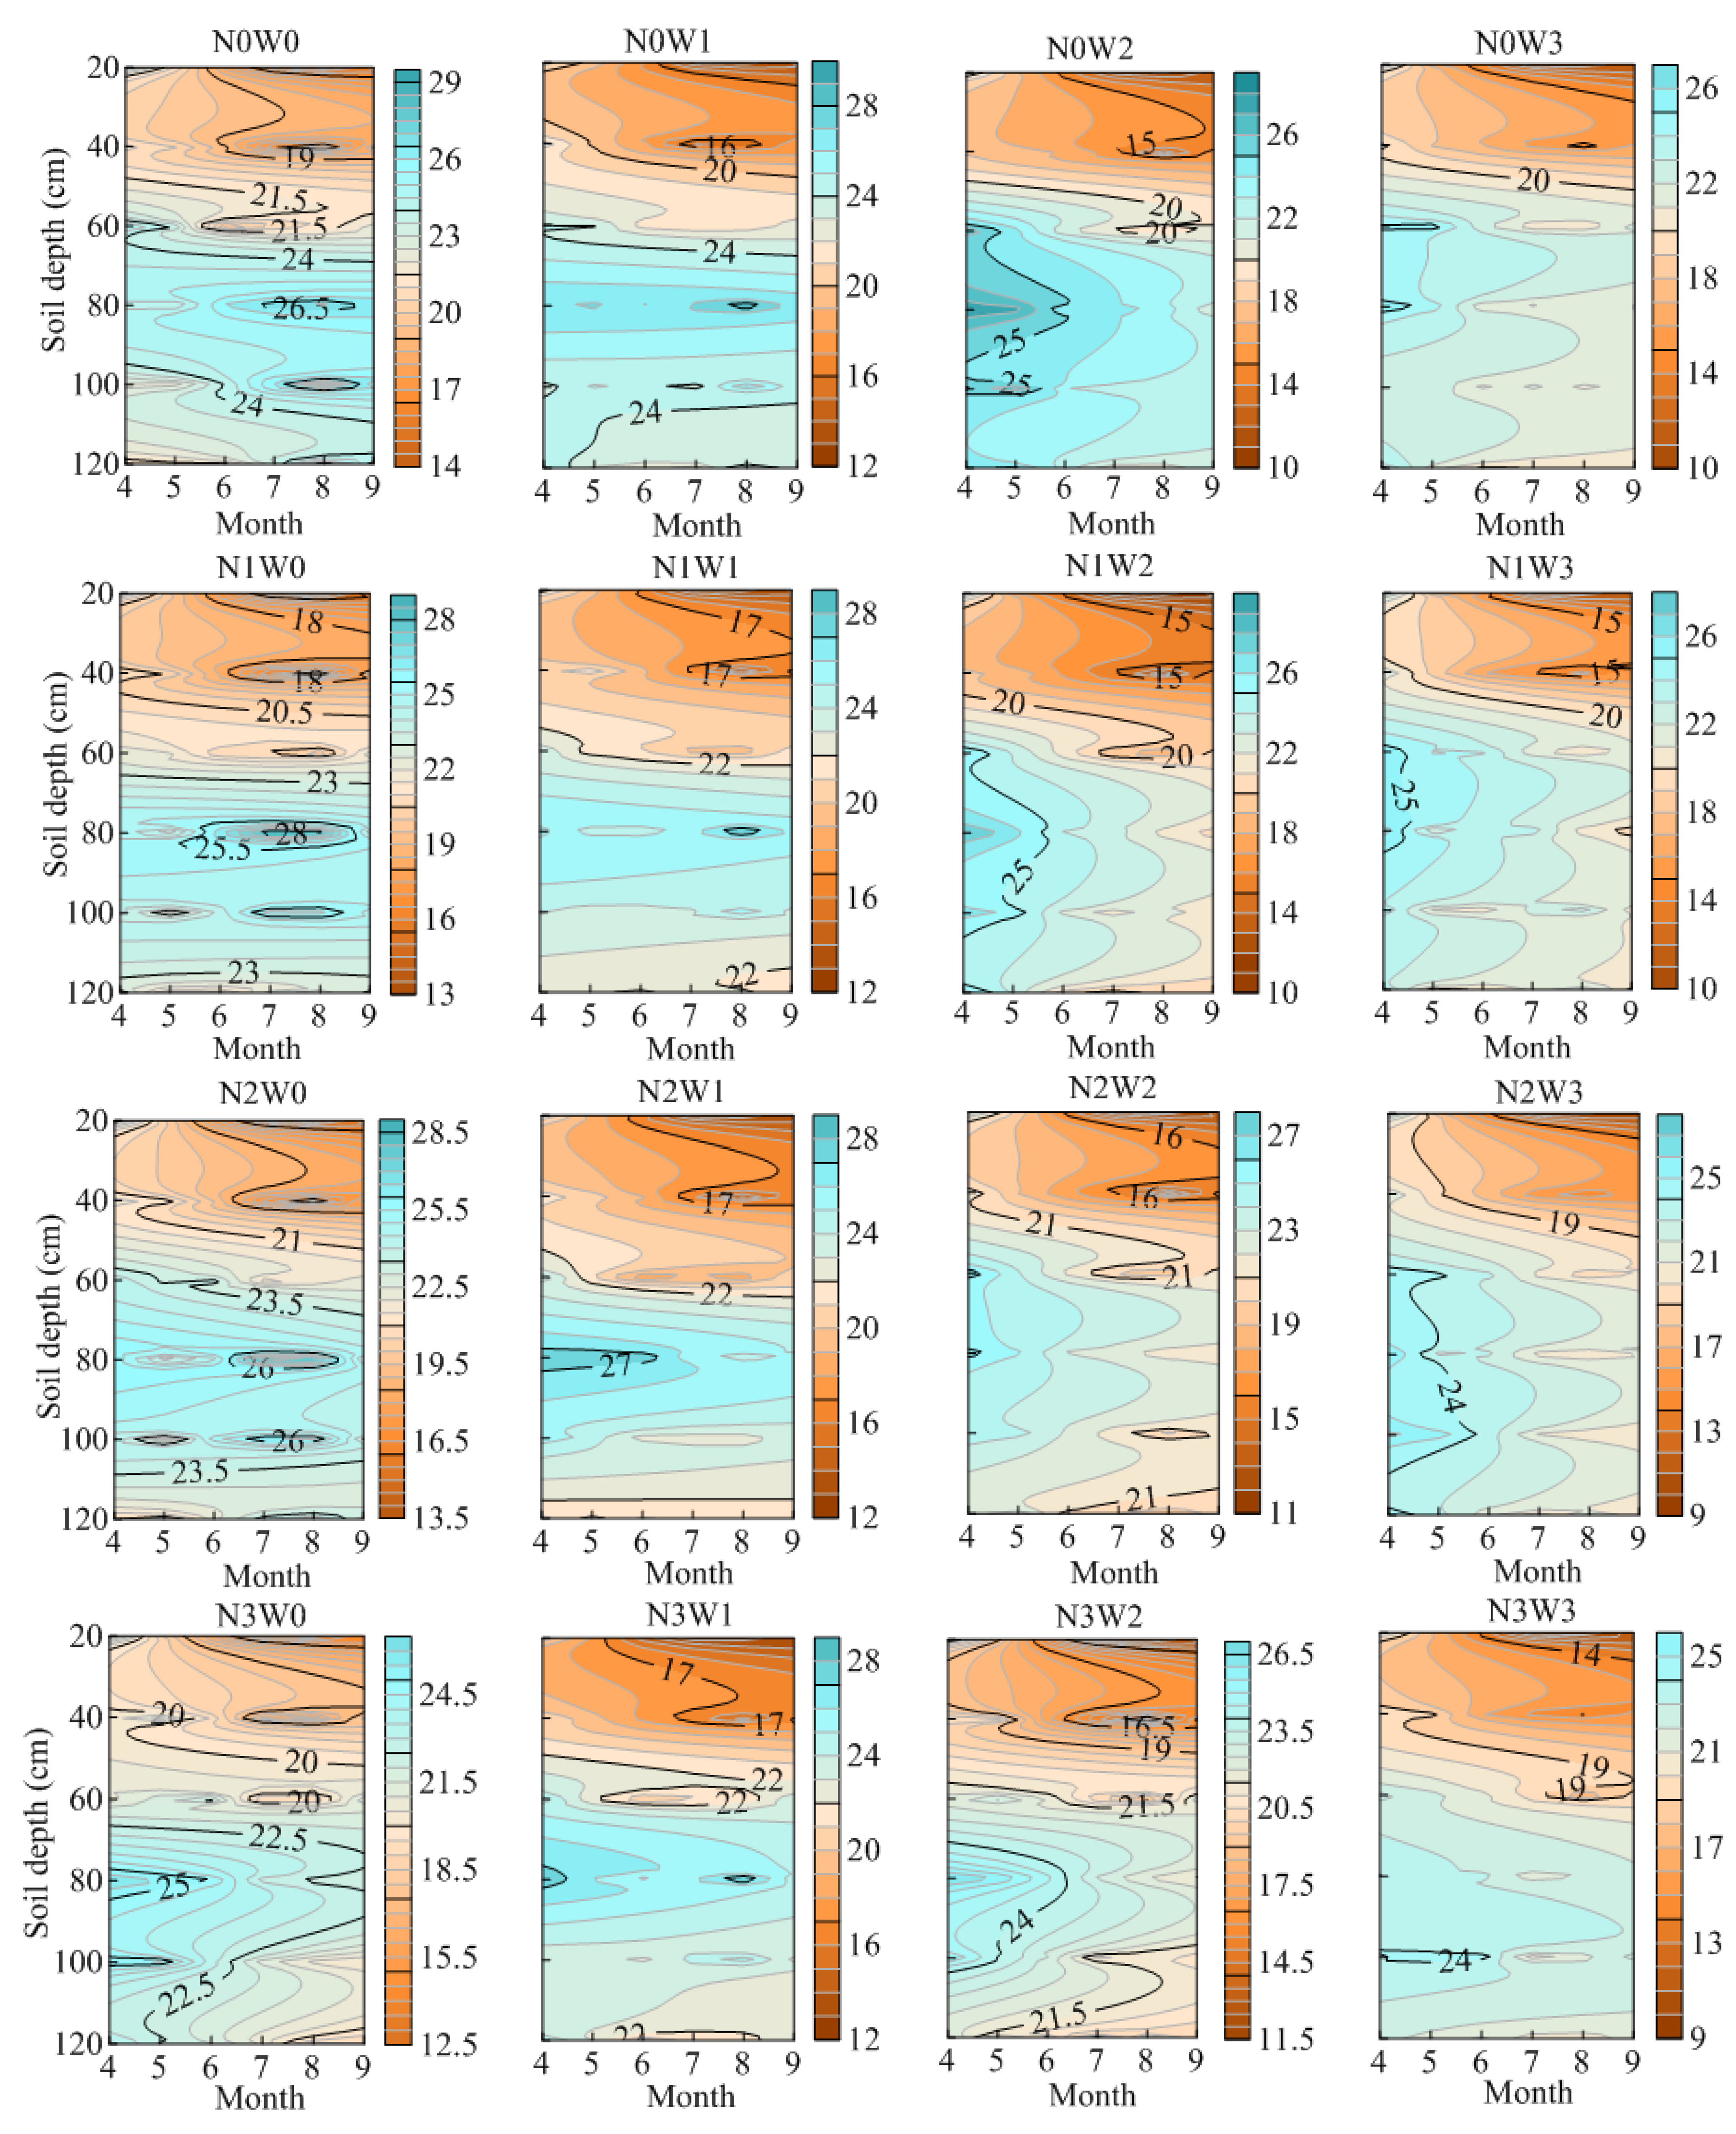
3.1. Effects of Water-Nitrogen Regulation on Soil Moisture Distribution

The temporal and spatial distribution of SWC in the 0–120 cm soil layer of Bromus inermis is shown in Figure 4. The SWC of the 0–120 cm soil layer increased first and then decreased with increasing soil depth. Furthermore, the SWC of the 0–40 cm soil layer had the most obvious change with the advance of time, and the overall trend was decreasing. Under the same nitrogen application conditions, the decreasing trend from W3 to W0 gradually became weaker (p < 0.05), and the SWC of the W3 treatment changed the most. The SWC of N0, N1, N2 and N3 treatment under different water conditions varied from −6.83% to 2.13%, −7.71% to 2.59%, −7.05% to 1.69% and −4.84% to 2.57%, respectively. The SWC of the 60–80 cm soil layer increased significantly with increasing depth, and the treatments of W0, W1, W2 and W3 increased by 2.34–4.71%, 2.97–4.62%, 1.10–4.20% and −0.17–3.72%, respectively. The SWC change in the 60–80 cm soil layer was not uniform in the time dimension. Under the same nitrogen application, the SWC of the W0 treatment increased slowly, with a prominent water accumulation area at 80 cm in July and August; the SWC of the W1 treatment had no obvious or weak change, which could ensure the relative balance of water supply and demand of Bromus inermis; the W2 and W3 treatments showed a slow downward trend. The SWC of the 100–120 cm soil layer had no significant change in time and space.

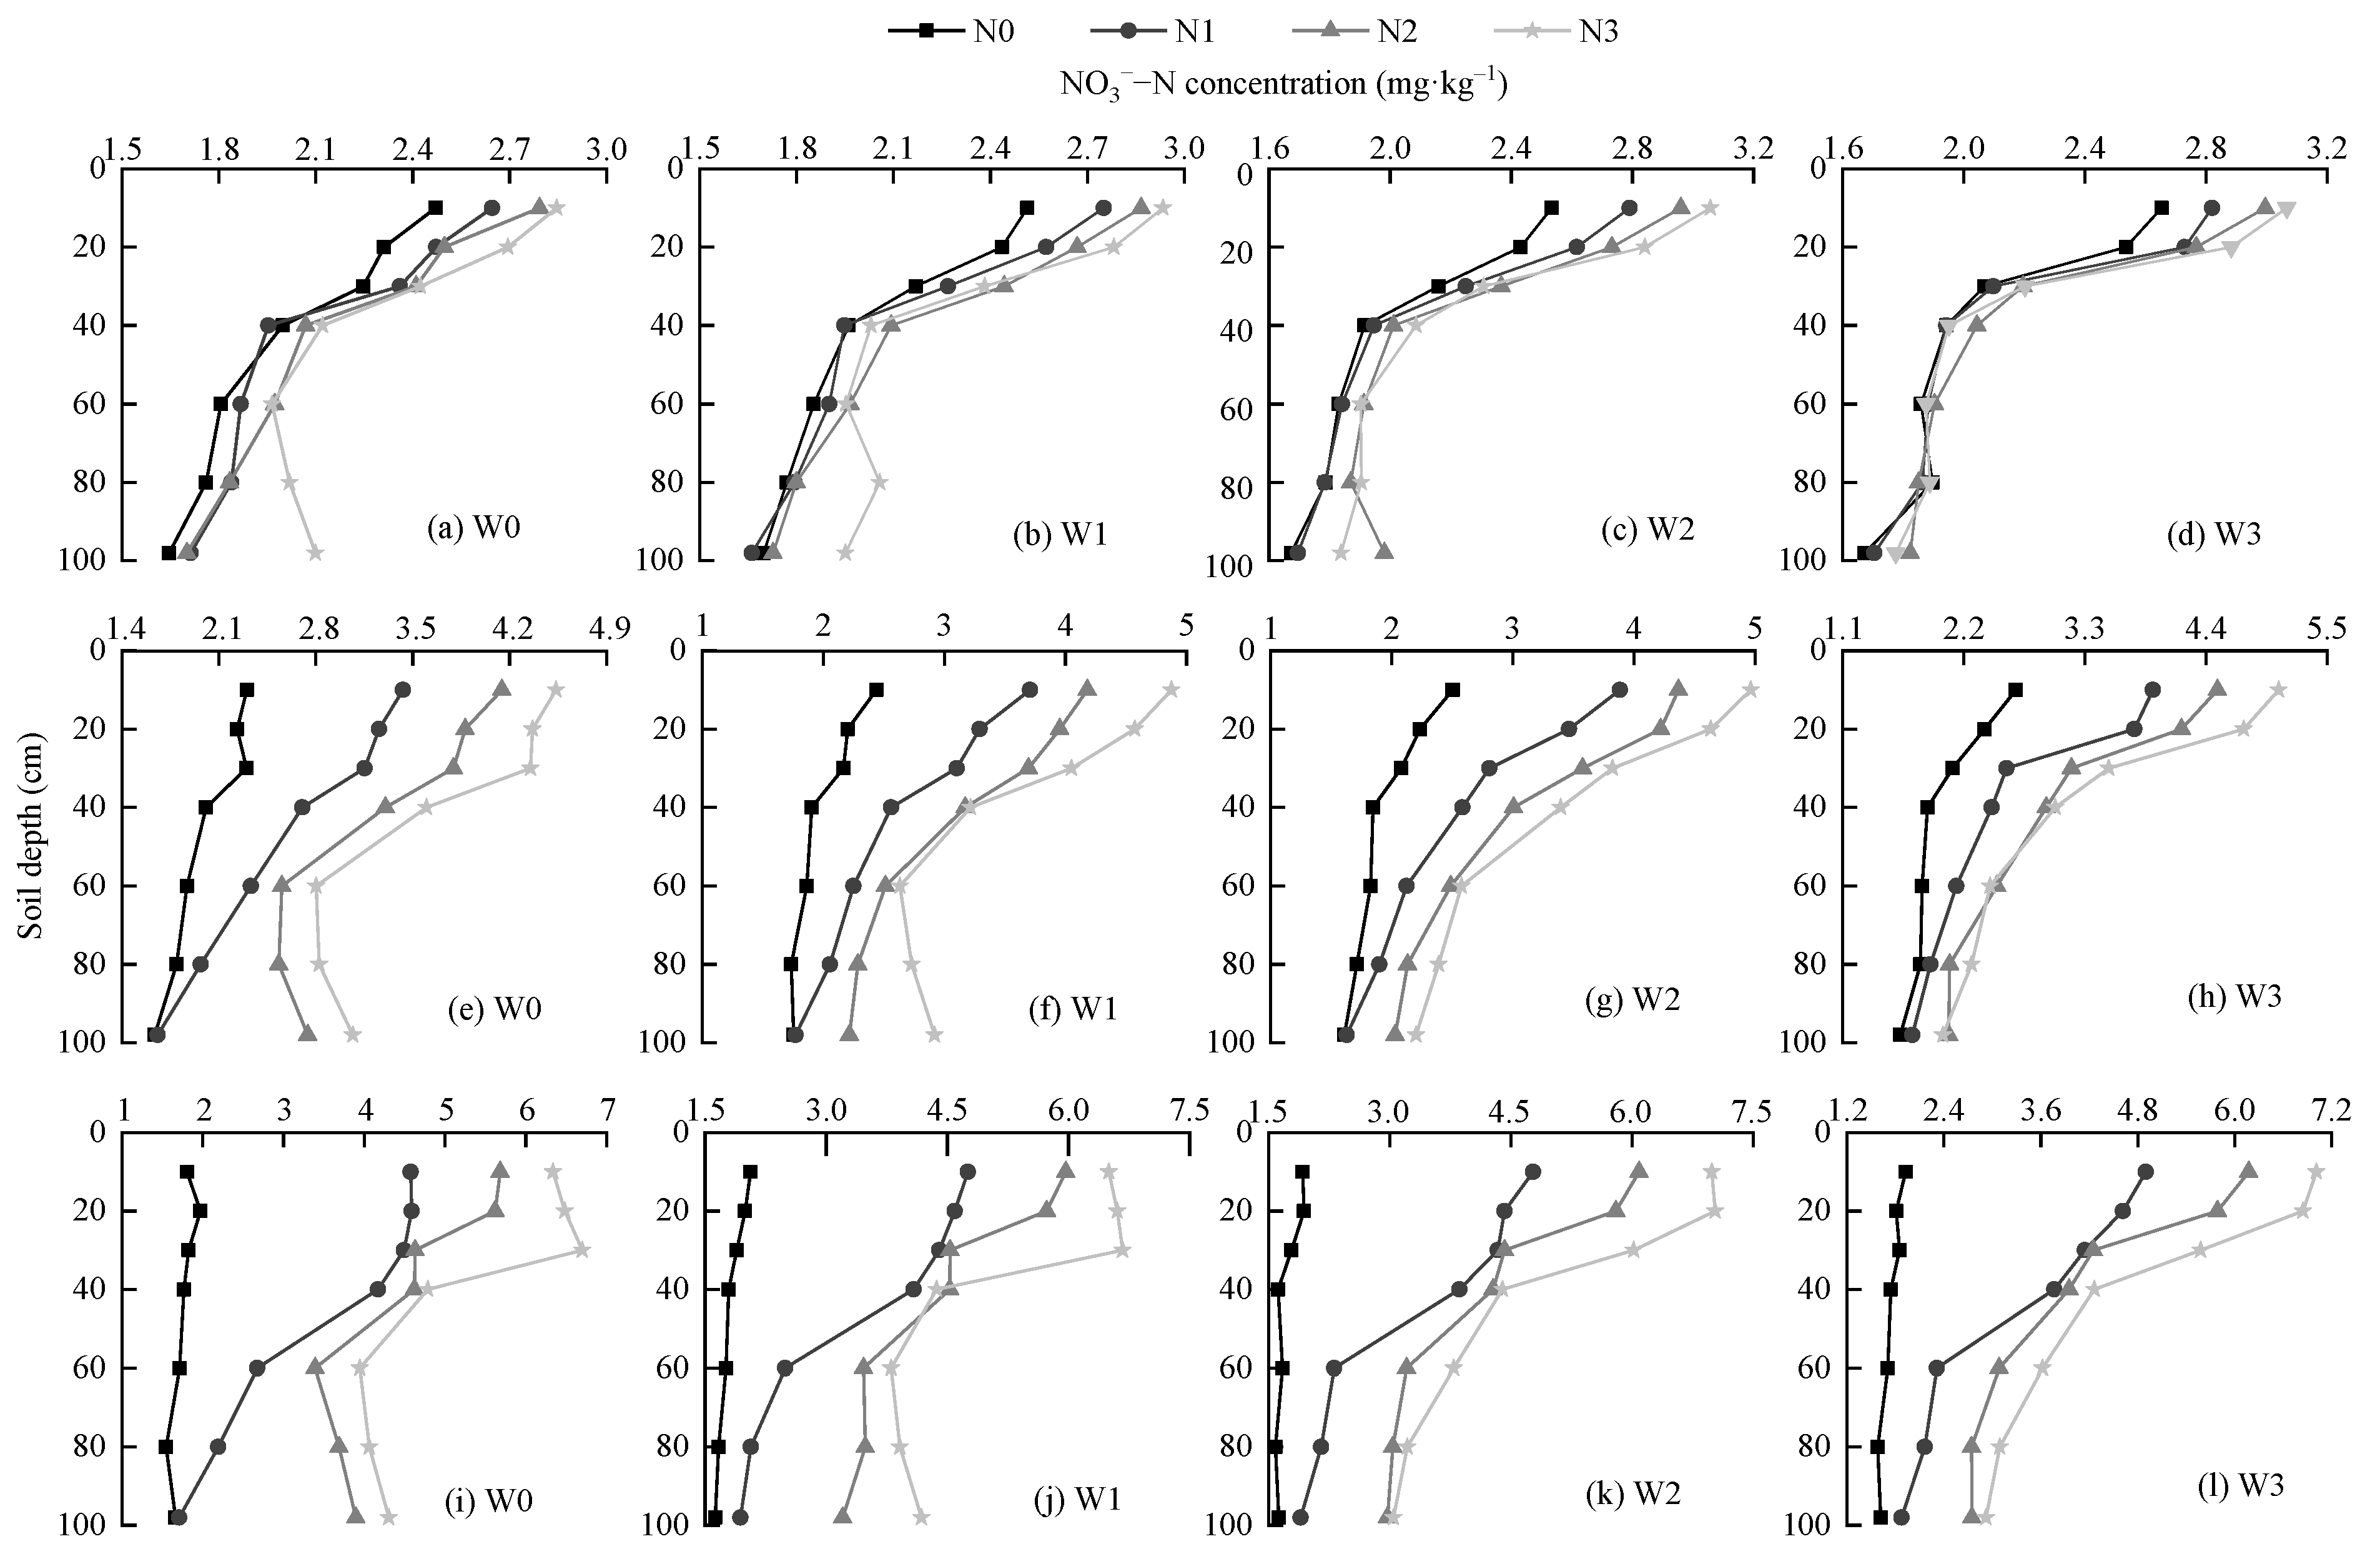
3.2. Effects of Water-Nitrogen Regulation on Distribution of Soil NO3–N

The variation of NO3–N content in the 0–100 cm soil layer of Bromus inermis is shown in Figure 5. At the same irrigation level, the content of NO3–N in different soil layers of N1, N2 and N3 treatments enhanced with increasing cut times. However, increasing cut times decreased the content of the N0 treatment. The content of NO3–N in each treatment decreased with increasing soil depth. The content of NO3–N in the 0–40 cm soil layer was most affected by nitrogen application. The content of NO3–N in N1, N2 and N3 treatment was 4.25–6.24%, 8.23–11.39%, 9.83–13.86% (the first cut), 40.71–47.10%, 63.96–75.20%, 81.11–94.21% (the second cut) and 130.22–141.92%, 168.06–183.68%, 211.80–236.65% (the third cut) higher than in N0 treatment. The content of NO3–N in the 60–100 cm soil layer remained stable, but the content of NO3–N in N2W0, N3W0 and N3W1 treatments showed an increasing trend with the increase in soil depth in the second and third cuts. This phenomenon indicated that high water and high nitrogen easily caused soil NO3–N deep-layer leakage.

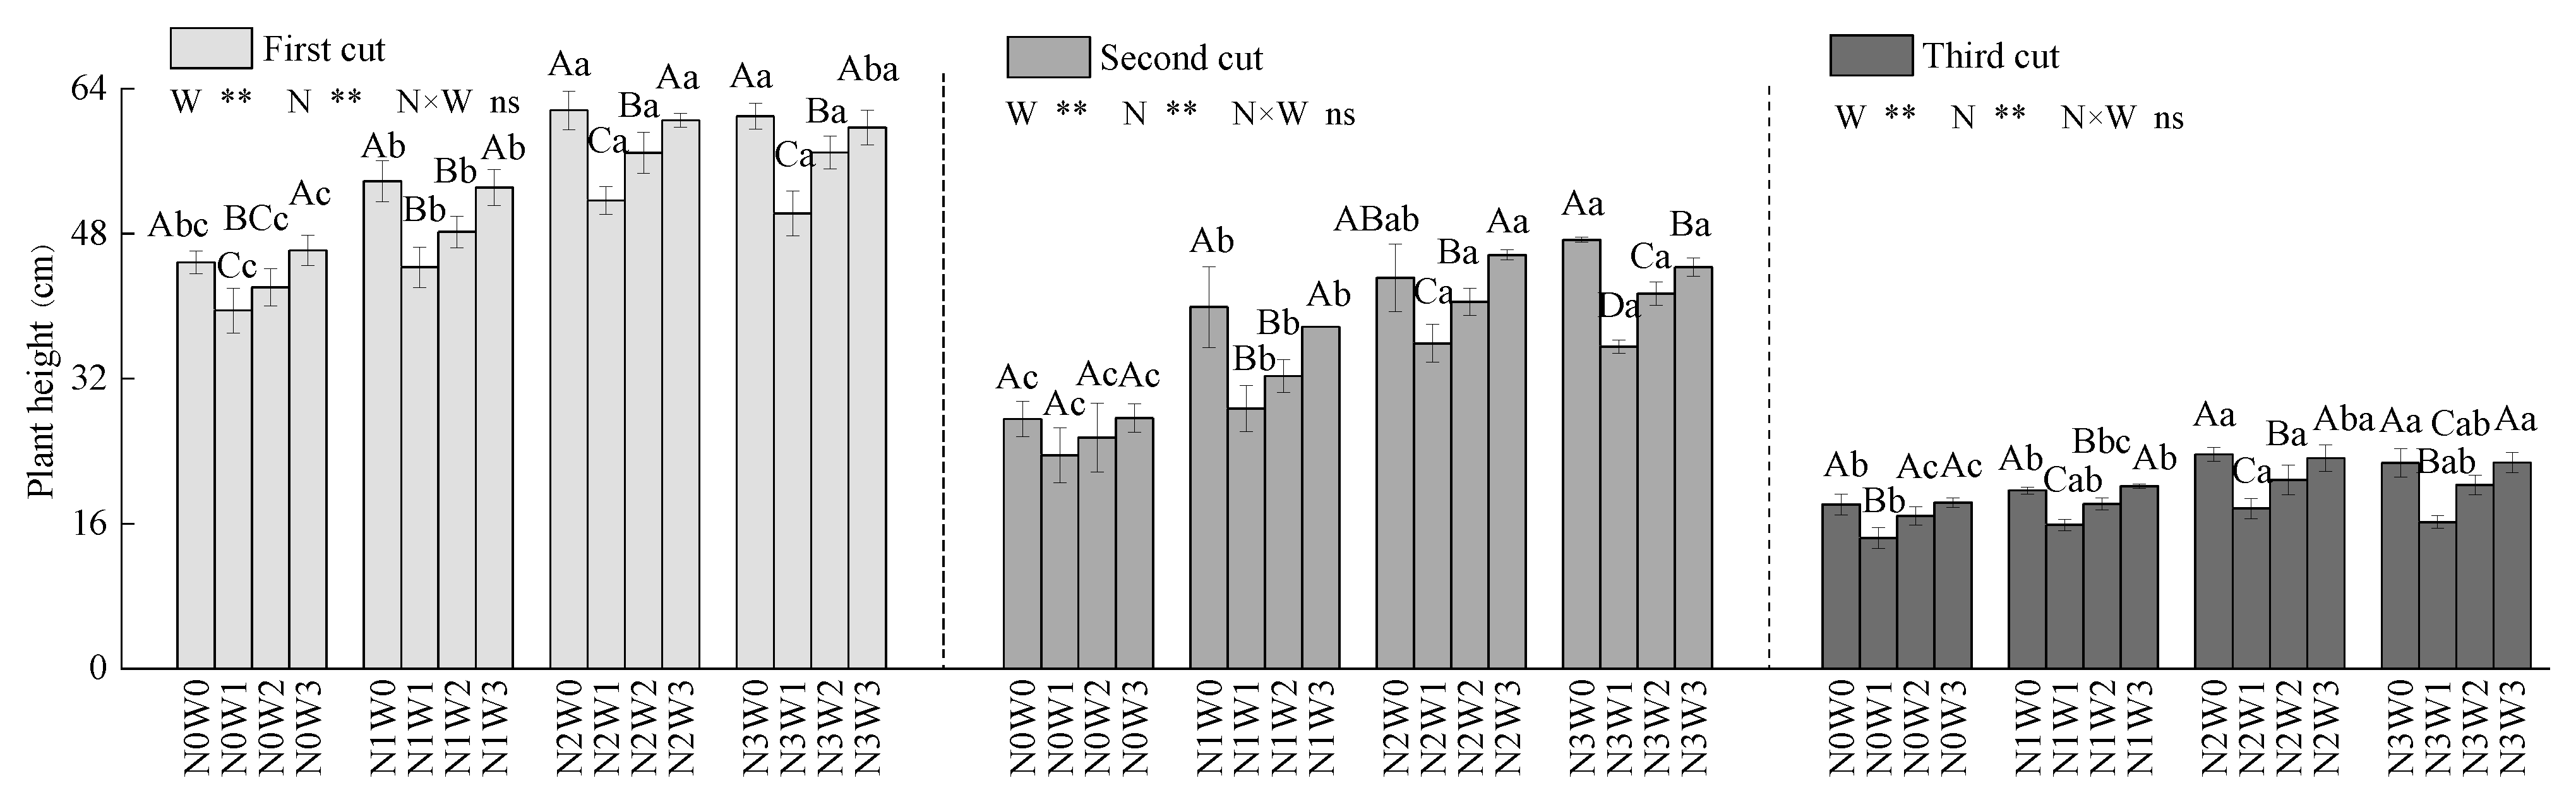
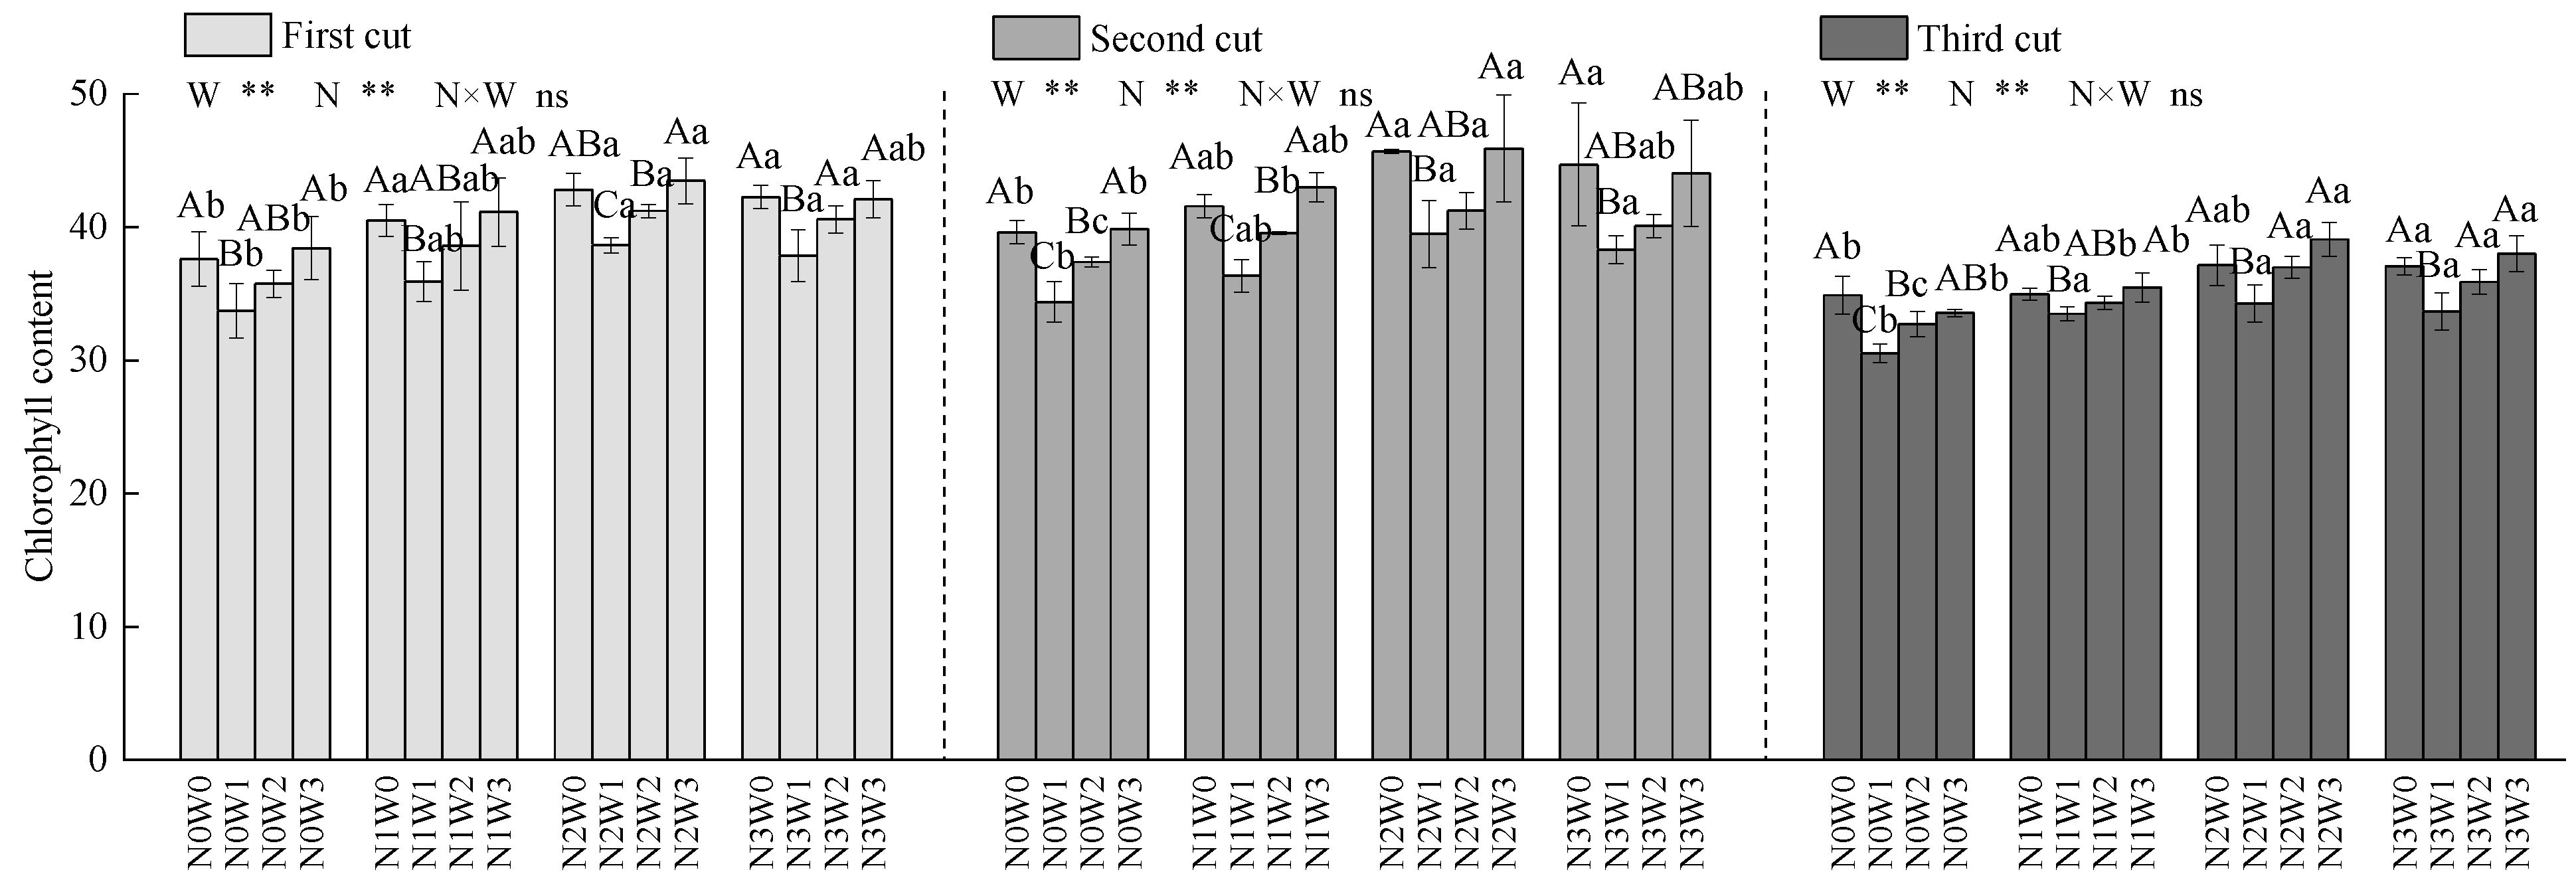
3.3. Effects of Water-Nitrogen Regulation on Plant Height and Chlorophyll Content of Bromus inermis

3.3.1. Plant Height

In Figure 6, the plant height of Bromus inermis decreased with increasing cut times, and the overall performance was as follows: the first cut > the second cut > the third cut. The effects of irrigation and nitrogen application on the plant height of three cuts reached a significant level (r = 0.963, 0.955 and 0.935, p < 0.01). At the same nitrogen application level, the plant height of each cut increased first and then stabilized with increasing irrigation level. W0, W1 and W2 increased significantly by 13.42–40.36%, 16.77–40.62% and 6.43–25.41% compared with W3. Furthermore, there was no significant difference between W0 and W1 treatments. At the same irrigation level, the plant height of each cut increased first and then stabilized with increasing nitrogen application. N1, N2 and N3 significantly increased by 7.86–44.81%, 22.62–65.13% and 12.15–71.78% compared with N0, without significant difference between N2 and N3 treatments. The interaction of water and nitrogen had no significant effect on the plant height of the three cuts. However, the average plant height of N1W2, N2W1 and N3W0 was 27.32%, 66.99% and 69.02% higher than N0W3.

3.3.2. Chlorophyll Content

In Figure 7, irrigation and nitrogen application had a significant impact on the chlorophyll content of each cut (r = 0.827, 0.820 and 0.894, p < 0.01) and the impact on the chlorophyll content of each cut was identical. The chlorophyll content of the first cut was slightly lower than the second cut, but both were significantly higher than that of the third cut. Under the same nitrogen application level, the chlorophyll content of each cut increased with increasing irrigation amount. Compared with the W3 treatment, the chlorophyll content of the first, second and third cut of the W0 treatment increased significantly by 10.79–12.77%, 14.37–16.68% and 4.38–14.34%, without significant differences between the W0, W1 and W2 treatments. At the same irrigation level, the chlorophyll content of each cut increased with an increasing nitrogen application rate. Compared with the N0 treatment, the chlorophyll content of the first, second and third cuts of the N3 treatment increased by 9.54–13.53%, 7.25–12.85% and 6.20–13.23%, without significant differences between N1, N2 and N3 treatment. The interaction of water and nitrogen had no significant effect on the chlorophyll content of the three cuts, but the average chlorophyll content of N1W2, N2W1 and N3W0 was 14.08%, 30.30% and 25.78% higher than N0W3.

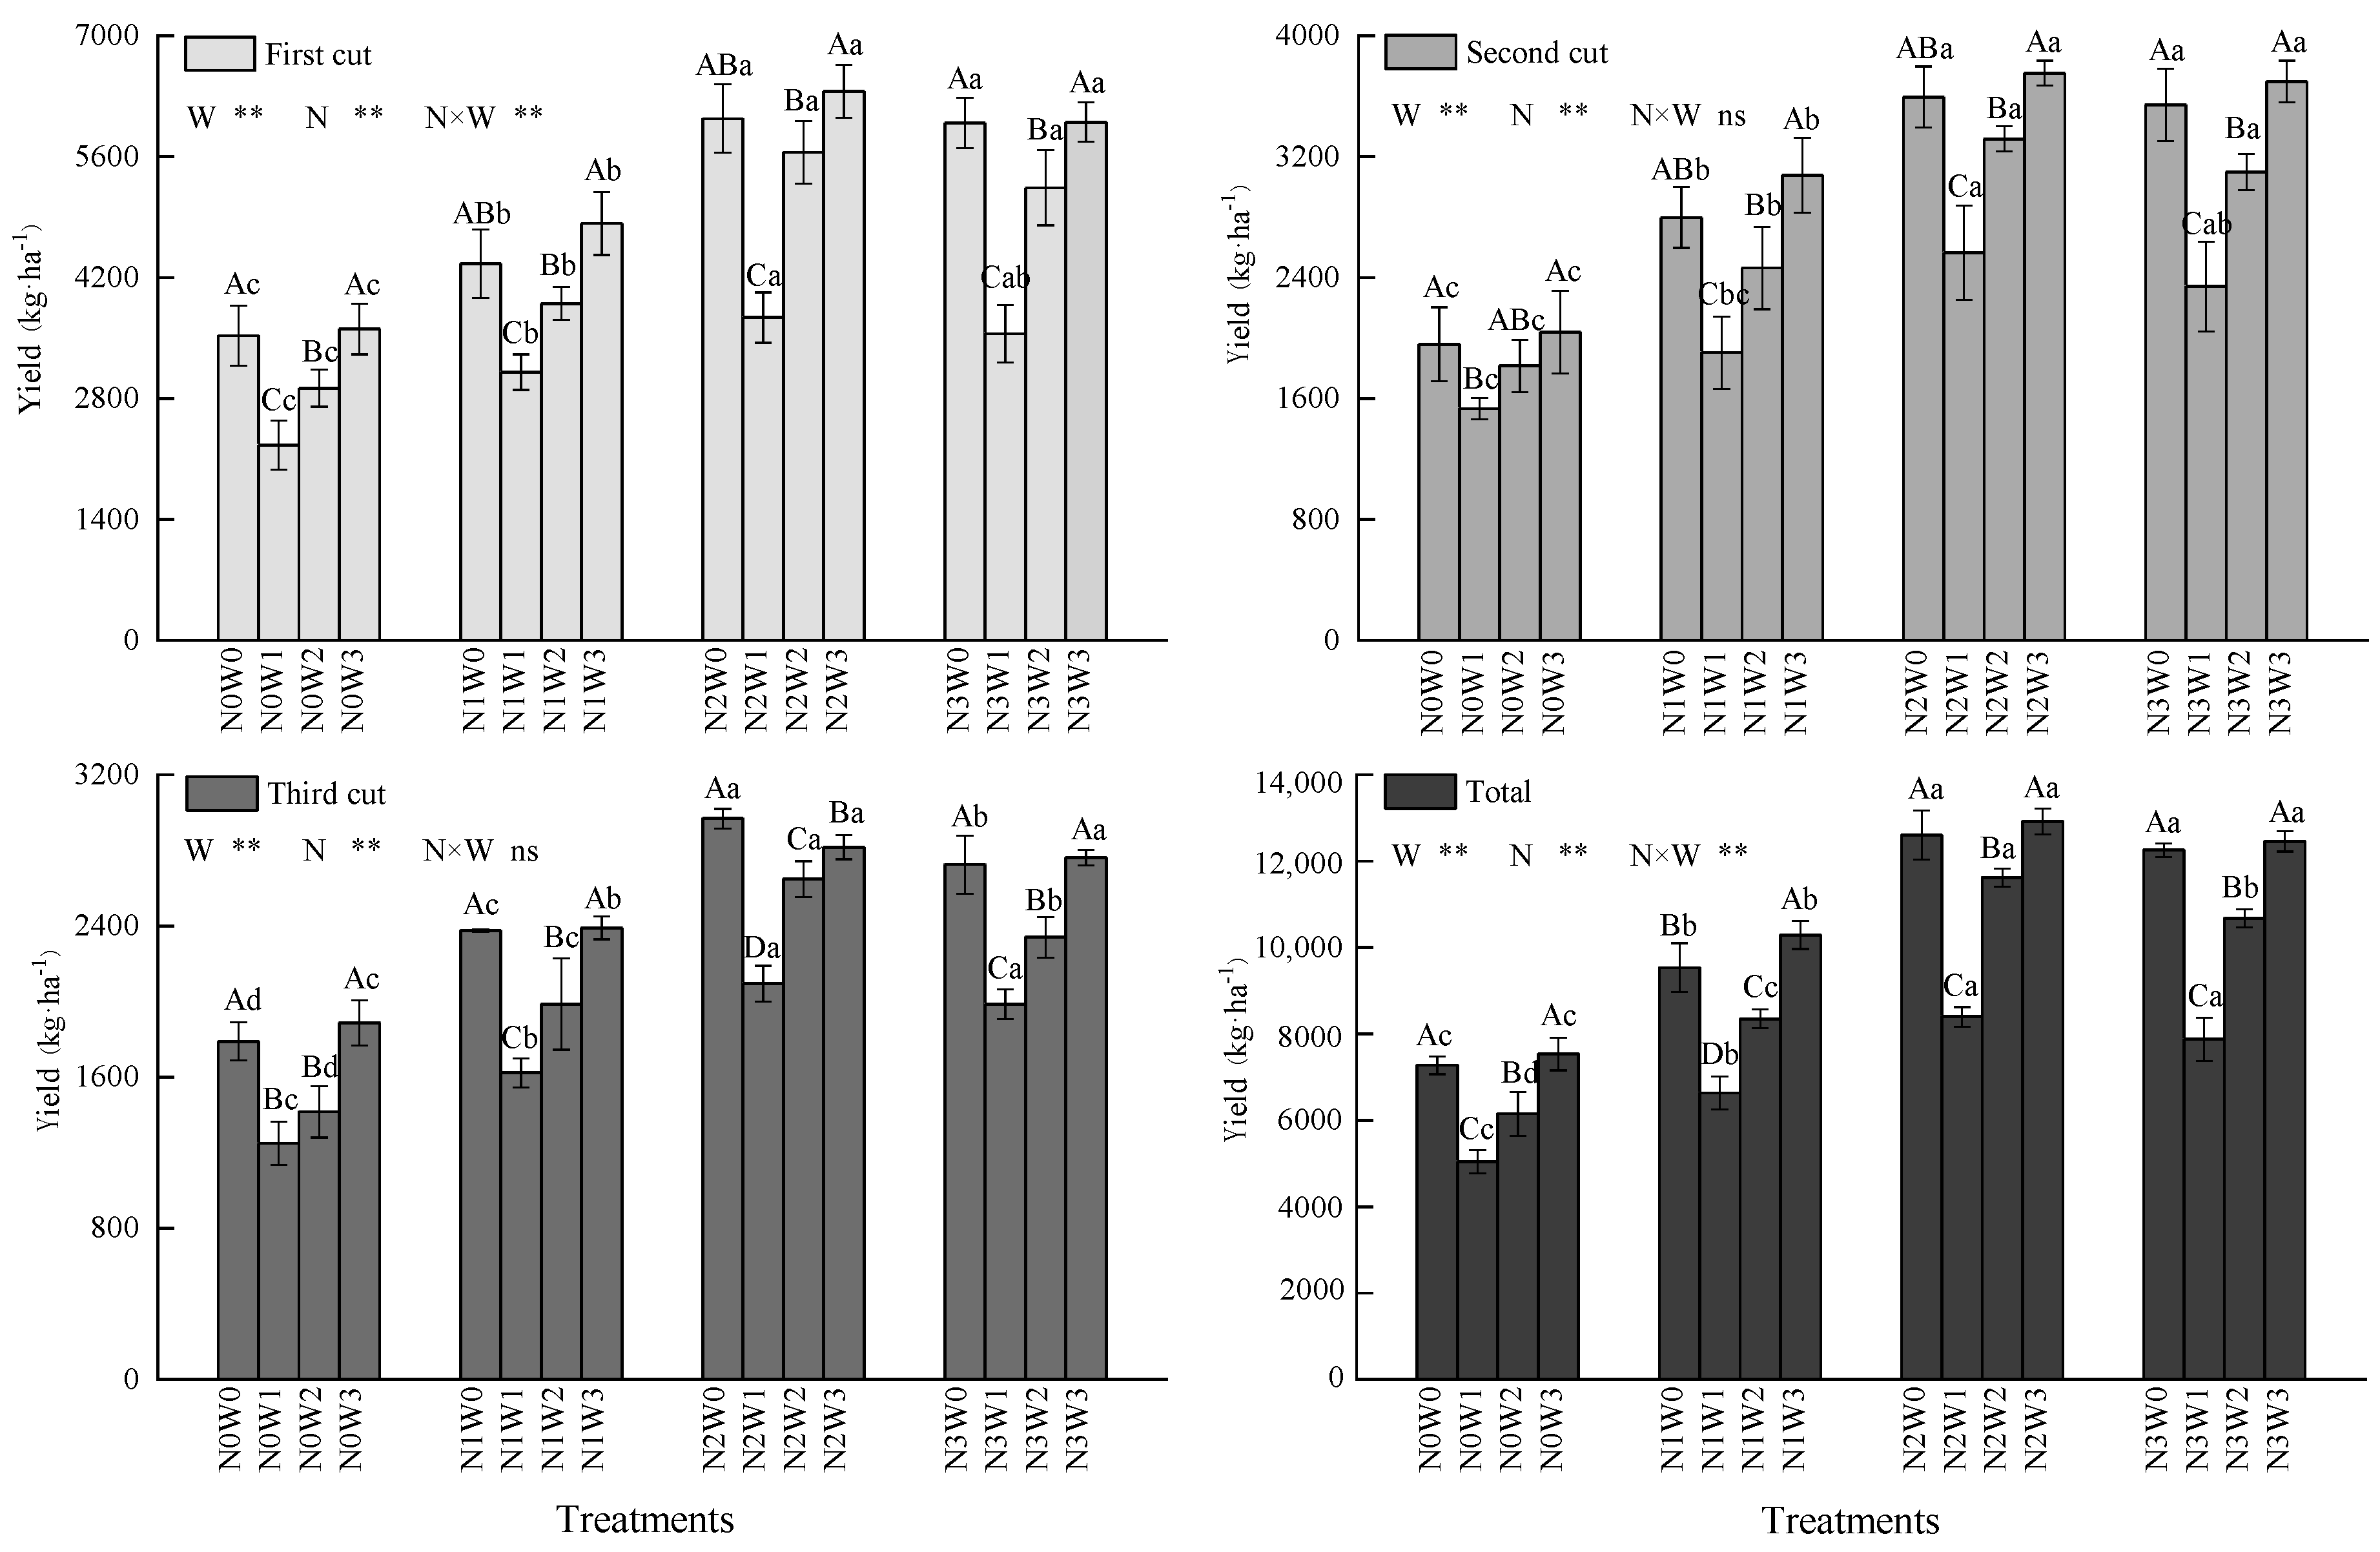
3.4. Effect of the Water-Nitrogen Regulation on Yield of Bromus inermis

According to Figure 8, the yield of Bromus inermis was the first cut > the second cut > the third cut. The effects of irrigation and nitrogen application on the yield of Bromus inermis in the third cut were extremely significant (r = 0.965, 0.963 and 0.974, p < 0.01). At the same nitrogen application level, the yield of each cut increased first and then decreased with increasing irrigation amount and reached the peak value in the W1 treatment. Compared with the W3 treatment, the yield of the first, second and third cuts of the W1 treatment increased 55.34–70.07%, 33.06–61.60% and 34.45–51.05%, without significant differences between the W0 and W1 treatments. At the same irrigation level, the yield of each cut increased first and then decreased with an increasing nitrogen application rate and reached the peak value in the N2 treatment. Compared with the N0 treatment, the yield of the first, second and third cuts of the N2 treatment increased 65.27–93.56%, 67.40–83.98% and 49.20–86.95% without significant differences between the N2 and N3 treatments. Irrigation and nitrogen application only had a significant interaction on the first cut yield and total yield of Bromus inermis. Compared with N0W3, the total yield of N1W2, N2W1 and N3W0 increased by 66.65%, 157.95% and 144.72% (r = 0.990, p < 0.01). Meanwhile, the total yield of Bromus inermis under N2W1 treatment reached a peak of 12,259.54 kg·ha−1.

3.5. Effect of Water-Nitrogen Regulation on Water-Nitrogen Use Efficiency of Bromus inermis

According to Table 1, the effects of irrigation and nitrogen application on the water-nitrogen use efficiency of Bromus inermis reached a significant level (r = 0.976 and 0.994, p < 0.01). Under the same nitrogen application level, WUE increased and then decreased with increasing irrigation water, and the W2 treatment was the highest. In detail, it increased by 28.31–34.68%, −0.81–5.08% and 13.08–22.41%, higher than W0, W1 and W3 treatment. At the same irrigation level, WUE increased and then decreased with an increasing nitrogen application rate. The N2 treatment was the highest, which was 49.81–62.16%, 19.69–29.10% and 6.01–11.27% higher than N0, N1 and N3 treatment. The PFPN of Bromus inermis was W1 > W0 > W2 > W3 under the same nitrogen application treatment and N1 > N2 > N3 under the same water treatment. Compared with W0, W3 and W2 treatment, W1 increased by 1.60–7.93%, 53.91–58.09% and 11.24–16.63%. Meanwhile, N1 increased by 43.73–59.28% and 133.34–152.49% compared with the N2 and N3 treatments. The analysis of variance showed that the interaction of water and nitrogen on WUE was not significant. However, the interaction on PFPN was significant (p < 0.05). Among all treatments, the WUE of the N2W2 treatment was the highest (23.12 kg·m−3), and the PFPN of the N1W1 treatment was the highest (171.52 kg·kg−1). Furthermore, the water-nitrogen utilization efficiency of the N2W1 treatment was 15.78 kg·m−3 and 110.52 kg·kg−1.

4. Discussion

4.1. Effects of the Water-Nitrogen Regulation on the Spatiotemporal Distribution of Water and Nitrogen in Bromus inermis

Soil moisture is the main factor affecting grassland ecosystem productivity in arid and semi-arid areas [26]. In this study, the SWC of the 0–40 cm soil layer gradually decreased with time, which may be related to the climate and plant growth and development in the test area [27]. At the beginning of the experiment, the low atmospheric temperature and light radiation had little effect on the evaporation and transpiration of Bromus inermis. In addition, the soil water demand of Bromus inermis in the early growth stage was low. However, the surface SWC gradually decreased with the rising temperature, intensifying light and increasing water consumption of herbage growth. Under the same nitrogen application treatment, the fluctuation range of SWC in the 0–40 cm soil layer in time was W3 > W2 > W1 > W0. Probably, intensifying water deficit inhibited the normal growth and development of Bromus inermis, resulting in the reduction of surface vegetation coverage and strong surface evaporation. In this study, the SWC of the 60–80 cm soil layer under different water-nitrogen treatments did not have a unified change with time. The SWC of the W0 treatment increased slowly with time. The SWC of the W1 treatment did not have significant changes, but the SWC of the W2 and W3 treatments showed a slow decline trend. This phenomenon might be related to the root distribution and resource allocation differences caused by different water treatments [28]. Meanwhile, Tu et al. [29] found that the SWC of the 0–100 cm soil layer in artificial grassland increased first and then decreased, and the SWC of the 0–60 cm soil layer changed greatly. Hou et al. [30] believed that the SWC gradually decreased with increasing soil depth within the range of 0–100 cm, and the soil moisture fluctuated greatly in the 0–30 cm soil layer. In contrast, the results of this study were more similar to Chen et al. [31] due to the difference in water supply between artificial grassland and natural grassland. The soil water supply of natural grassland is heavily dependent on natural precipitation, especially in arid and semi-arid areas with scarce precipitation and serious evaporation, resulting in water being absorbed and utilized by plants or evaporated before flowing into the deep soil. Compared with natural grassland, artificial grassland is affected by artificial water regulation. After meeting crop water demand as well as normal evaporation and transpiration, water will seep under gravity. However, whether natural or artificial grassland, its deep soil is less affected by external factors, playing the role of a soil reservoir [32]. Meanwhile, its SWC is maintained in a stable range. Therefore, surface and shallow SWC have substantial spatial variability.
Improving soil fertility is an effective way to improve herbage growth and grassland productivity. As a nitrogen form easily absorbed and used by crops, the content of NO3–N determines the soil nitrogen supply capacity to a certain extent [33]. Under the same irrigation level, the NO3–N content in the soil profile of each cut increased with increasing nitrogen application rate. Meanwhile, it decreased first and then stabilized with an increasing soil depth (except for N2W0, N3W0 and N3W1), which was consistent with the research results of Sahoo et al. [34]. Nitrogen fertilizer could not be directly absorbed and used by crops after being applied to the soil. It needed to be converted into NO3–N through the action of nitrification. In the meantime, increasing nitrogen application can improve the soil mineralization rate, significantly improving soil fertility [35]. The NO3–N content of the soil profile in each treatment was concentrated in 0–40 cm shallow soil. Oliveira et al. [36] and Wu et al. [37] found that soil moisture also affected the rate of nitrogen nitrification. An appropriate water supply could convert solid nitrate into liquid nitrate ions for crop absorption and utilization. However, continuous and sufficient irrigation could lead to water redundancy in deep soil, forming an anaerobic environment in local areas. As a result, the smooth progress of nitrification was inhibited, and the soil NO3–N content did not increase but decreased. However, water supply has no obvious effect on the NO3–N content of the soil profile in this experiment, which may be related to the soil texture of the test site or the determination time of NO3–N. In addition, the NO3–N content of the 60–100 cm soil layer treated with N2W0, N3W0 and N3W1 showed a gradually increasing trend with increasing cut times. This phenomenon indicated that excessive irrigation under high nitrogen conditions could easily lead to the leaching of soil NO3–N, with a risk of groundwater pollution.

4.2. Effects of Water-Nitrogen Regulation on the Growth of Bromus inermis

Plant height is an important indicator of herbage growth and production performance. Plants can maximize the distribution, interception and utilization of light energy by adjusting plant height [38]. Wang et al. [39] found that the plant height of oat and common vetch decreased with the aggravation of the water deficit. In the meantime, Fessehazion et al. [40] proposed in a study of ryegrass that the plant height of ryegrass increased linearly with increasing irrigation water. However, Sha et al. [41] believed that the continuous increase in irrigation volume could not further improve the plant height of alfalfa, and the irrigation of 6000 m3·ha−1 was more conducive to the alfalfa growth than 6750 m3·ha−1. Some scholars also believed that nitrogen addition had a threshold for the plant height of herbage. In addition, the threshold range was related to the basic soil fertility, crop type and irrigation gradient in the experimental area [38]. This study is consistent with previous research results. Irrigation and nitrogen application can significantly improve the plant height of each cut, and the plant height of Bromus inermis will not change significantly after irrigation and nitrogen application exceeding 65–85% θf and 120 kg·ha−1. In addition, the interaction of water and nitrogen in this study had no significant interaction with the plant height in each cut. This phenomenon might be related to the lodging phenomenon caused by excessive water and nitrogen application, which was aroused by the overgrowth of plant nutrition, excessive length of stems and leaves and undeveloped mechanical tissue of stems.
Chlorophyll is a necessary catalyst for plant photosynthesis, and its content directly or indirectly affects the photosynthetic rate and nutrient accumulation of forage [42]. This study showed that both irrigation and nitrogen application could significantly increase the chlorophyll content in each cut of Bromus inermis, consistent with the results of Muhammad et al. [43]. The added irrigation could effectively alleviate the original chlorophyll decomposition phenomenon induced by plant water shortage and promote chlorophyll synthesis, improving the chlorophyll content of plant leaves [44]. As the main component of chlorophyll, the moderate addition of nitrogen can enhance the nitrogen metabolism as well as the synthesis and activity of photosynthetic enzymes in plants, improving the photosynthetic capacity of plants [45]. However, this study found a threshold value for the effect of irrigation and nitrogen application on the chlorophyll content of each cut. High water and high fertilizer would, on the contrary, reduce the chlorophyll content. This phenomenon might be related to the theory of the optimal resource allocation of plants. When the water and nitrogen supply exceeded the threshold of herbage absorption, the reasons for the decrease in plant chlorophyll content had the following aspects: (1) Too many resources were allocated to the above-ground part, resulting in excessive plant nutrition and the phenomenon of overgrowth and lodging, further increasing the shading area between plants. This process was not conducive to the regular progress of forage photosynthesis, decreasing chlorophyll content. (2) Persistent water and nitrogen supply affected the upward transport of plant water and nutrients by inhibiting the sensitivity of grass root respiration and reducing the number and activity of soil microorganisms, resulting in the low chlorophyll content of grass. In addition, the chlorophyll content of the first cut in this study was slightly lower than the second cut but significantly higher than the third cut, which might be related to the light intensity between different cuts.

4.3. Effects of Water-Nitrogen Regulation on Yield and Water-Nitrogen Use Efficiency of Bromus inermis

This study showed that irrigation and nitrogen application significantly affected the yield and water-nitrogen use efficiency of Bromus inermis. The yield and WUE increased first and then decreased with the increase in irrigation and nitrogen application. PFPN increased first and then decreased with the increase in irrigation water and continued to decrease with the increase in nitrogen application. The three reached the peak value in different treatments, which were N2W3, N2W2 and N1W3. This was consistent with the results of Kumar et al. [46] and Al-Solaimani et al. [47]. This further showed that water and nitrogen were the key factors affecting the yield and water-nitrogen use efficiency of Bromus inermis. Only by optimizing the allocation could researchers achieve the high yield and high efficiency of crops. Moreover, in the appropriate range of water and nitrogen application, water and nitrogen had a significant coupling effect on the total yield of Bromus inermis. This effect was related to the degree of soil drought and the amount of fertilizer application. When the irrigation mode was W3, the soil was severely dry, and the effect of applying nitrogen fertilizer on yield increase was low. This was because severe drought stress would inhibit the growth of plant roots, which was not conducive to the absorption and utilization of water and nutrients by plants. Even excessive nitrogen fertilizer might cause the phenomenon of seedling burning [48]. When the irrigation mode was W1 treatment, the soil was in suitable water conditions, and nitrogen application was beneficial to the reproduction of soil-ammoniating bacteria, which could significantly increase the content of soil ammonium nitrogen, was not easy to lose, and played a positive role in the accumulation of herbage yield [43]. However, excessive nitrogen application would promote water consumption, increase crop water consumption and lead to low WUE. Excessive irrigation would inhibit plant root respiration, reduce the number and activity of soil microorganisms and affect the soil respiration rate [49], resulting in slow growth and even the death of plants. Furthermore, this study showed that although applying 60 kg·ha−1 of nitrogen could obtain the best PFPN, its yield and WUE were significantly lower than applying 120 kg·ha−1 of nitrogen, which might be due to the poor soil in the experimental area. Compared with water, the growth of Bromus inermis was more susceptible to nitrogen limitation, and the yield increase in Bromus inermis was obvious after a small amount of nitrogen application. However, if nitrogen were added further, the yield increase would decrease slightly, decreasing the PFPN of Bromus inermis. Moreover, too low nitrogen addition limited the positive effect of water compensation on the growth and development of Bromus inermis, which needed to realize the synergistic effect of water and nitrogen resources fully.

5. Conclusions

The soil water and NO3–N content in the 0–40 cm soil layer were the most sensitive to water-nitrogen regulation. Full irrigation (W0) and high nitrogen application (N3) could easily cause the risk of soil water and nitrogen leaching in the 60–100 cm soil layer. The plant height, chlorophyll content and yield (12,259.54 kg·ha−1) of Bromus inermis with mild water deficit (W1, 65–85% θf) and moderate nitrogen application (N2, 120 kg·ha−1) were the highest. In addition, the water-nitrogen use efficiency was high (120 kg·ha−1 and 171.52 kg·kg−1). Meanwhile, it could not only meet the water and nitrogen absorption of Bromus inermis but also avoid water and nitrogen loss, which was an appropriate water and nitrogen management mode for Bromus inermis production in the Hexi Corridor, Gansu Province, China.

Author Contributions

Conceptualization, investigation, formal analysis, writing—review and editing, Y.K., M.Y., Z.T., Q.J. and Y.J.; writing—original draft, Y.K., Y.M., Y.J. and A.W.; funding acquisition, supervision, Y.M., M.Y., G.Q., Q.J. and J.W.; project administration, Z.T., G.Q., J.W. and A.W. All authors have read and agreed to the published version of the manuscript.

Funding

This study was funded by the National Natural Science Foundation Project, China (Grant Nos. 52069001, 51969003 and 52269009); the Industrial Support Project of the Gansu Provincial Department of Education, China (Grant No. 2021CYZC-20); the Lanzhou Science and Technology Project (Grant No. 2022-2-60); the Innovation Fund Project of higher education in Gansu Province (Grant No. 2020B-131 and 2022B-101); the “High-efficient Utilization and Innovation of Water and Soil Resources of Characteristic Crops in Northwest China” of Gansu Agricultural University (Grant No. GAU-XKTd-2022-09); the Sheng Tongsheng Innovation Funds of Gansu Agricultural University (Grant No. GSAU-STS-2021-18) and the Special Project for the Construction of Scientific Research Team of the College of Water Conservancy and Hydropower Engineering, Gansu Agricultural University, China (Grant No. Gaucwky-01).

Data Availability Statement

Data are contained within the article.

Acknowledgments

The authors would like to thank all funds and lab facilities. We also gratefully acknowledge the anonymous reviewers for their constructive comments.

Conflicts of Interest

The authors declare no conflict of interest.

References

  1. Paul, B.K.; Groot, J.C.; Maass, B.L.; An, M.N.; Herrero, M.; Tittonell, P.A. Improved feeding and forages at a crossroads: Farming systems approaches for sustainable livestock development in East Africa. Outlook AGR 2020, 49, 13–20. [Google Scholar] [CrossRef] [PubMed]
  2. Halli, H.M.; Govindasamy, P.; Choudhary, M.; Srinivasan, R.; Prasad, M.; Wasnik, V.K.; Yadav, V.K.; Singh, A.K.; Kumar, S.; Vijay, D.; et al. Range grasses to improve soil properties, carbon sustainability, and fodder security in degraded lands of semi-arid regions. Sci. Total Environ. 2022, 851, 158211. [Google Scholar] [CrossRef]
  3. Oliveira, E.M.D.; Oliveira, J.D.C.; Oliveira, R.A.D.; Oliveira, R.M.D.; Cecon, P.R. Determination of xaraés grass quality submitted to irrigation water levels and nitrogen and potassium doses. Eng. Agríc. 2017, 37, 64–74. [Google Scholar] [CrossRef] [Green Version]
  4. Ma, Q.; Zhang, X.; Wu, Y.; Yang, H.; Wang, Z. Optimizing water and nitrogen strategies to improve forage oat yield and quality on the Tibetan Plateau using apsim. Agronomy 2022, 12, 933. [Google Scholar] [CrossRef]
  5. Brueck, H.; Erdle, K.; Gao, Y.; Giese, M.; Zhao, Y.; Peth, S.; Lin, S. Effects of N and water supply on water use-efficiency of a semiarid grassland in Inner Mongolia. Plant Soil 2010, 328, 495–505. [Google Scholar] [CrossRef]
  6. Martin, N.P.; Russelle, M.P.; Powell, J.M.; Sniffen, C.J.; Smith, S.I.; Tricarico, J.M.; Grant, R.J. Invited review: Sustainable forage and grain crop production for the US dairy industry. J. Dairy Sci. 2017, 100, 9479–9494. [Google Scholar] [CrossRef] [PubMed] [Green Version]
  7. Bowen, M.K.; Chudleigh, F.; Buck, S.; Hopkins, K. Productivity and profitability of forage options for beef production in the subtropics of northern Australia. Anim. Prod. Sci. 2016, 58, 332–342. [Google Scholar] [CrossRef]
  8. Martínez-Dalmau, J.; Berbel, J.; Ordóñez-Fernández, R. Nitrogen fertilization. A review of the risks associated with the inefficiency of its use and policy responses. Sustainability 2021, 13, 5625. [Google Scholar] [CrossRef]
  9. Martinez, P.; Blanco, M. Sensitivity of agricultural development to water-related drivers: The case of Andalusia (Spain). Water 2019, 11, 1854. [Google Scholar] [CrossRef] [Green Version]
  10. Tan, J.; Liu, F.; Xu, T.; Tan, X. Exploration of water–nitrogen coupling effects in paddy field based on ORYZA (v3) model. J. Sci. Food Agric. 2022, 102, 396–406. [Google Scholar] [CrossRef]
  11. Plett, D.C.; Ranathunge, K.; Melino, V.J.; Kuya, N.; Uga, Y.; Kronzucker, H.J. The intersection of nitrogen nutrition and water use in plants: New paths toward improved crop productivity. J. Exp. Bot. 2020, 71, 4452–4468. [Google Scholar] [CrossRef] [PubMed]
  12. Nie, T.Z.; Huang, J.Y.; Zhang, Z.X.; Chen, P.; Li, T.C.; Dai, C.L. The inhibitory effect of a water-saving irrigation regime on CH4 emission in Mollisols under straw incorporation for 5 consecutive years. Agric. Water Manag. 2023, 278, 108163. [Google Scholar] [CrossRef]
  13. Crevoisier, D.; Popova, Z.; Mailhol, J.C.; Ruelle, P. Assessment and simulation of water and nitrogen transfer under furrow irrigation. Agric. Water Manag. 2008, 95, 354–366. [Google Scholar] [CrossRef] [Green Version]
  14. Qiang, S.; Zhang, F.; Zhang, Y.; Yan, S.; Fan, J.; Xiang, Y. Nitrogen application affects grain yield by altering the soil moisture and nitrate-N of maize/wheat cropping system in dryland areas of northwest China. Irrig. Drain. 2021, 70, 16–26. [Google Scholar] [CrossRef]
  15. Cong, X.; Pang, G.Z.; Zhang, L.Z.; Xu, Z.H.; Yang, J.L.; Mou, X.Y. Effects of nitrogen-reducing and suitable water on photosynthetic characteristics of winter wheat and distribution of soil water and nitrogen. Trans. Chin. Soc. Agric. Mach. 2021, 52, 324–332. [Google Scholar] [CrossRef]
  16. Ahmad, I.; Wajid, S.A.; Ahmad, A.; Cheema, M.J.M.; Judge, J. Optimizing irrigation and nitrogen requirements for maize through empirical modeling in semi-arid environment. Environ. Sci. Pollut. Res. 2019, 26, 1227–1237. [Google Scholar] [CrossRef]
  17. Bahrami, M.; Talebnejad, R.; Sepaskhah, A.R.; Bazile, D. Irrigation regimes and nitrogen rates as the contributing factors in quinoa yield to increase water and nitrogen efficiencies. Plants 2022, 11, 2048. [Google Scholar] [CrossRef] [PubMed]
  18. García-López, J.; Lorite, I.J.; García-Ruiz, R.; Ordoñez, R.; Dominguez, J. Yield response of sunflower to irrigation and fertilization under semi-arid conditions. Agric. Water Manag. 2016, 176, 151–162. [Google Scholar] [CrossRef]
  19. Ren, J.Z.; Zhu, X.Y. The basic pattern of grassland agriculture in Hexi Corridor of China is contrary to its system-the mechanism of grassland degradation. Acta Prataculturae Sin. 1995, 4, 69–79. [Google Scholar]
  20. Kiss, R.; Deák, B.; Tóthmérész, B.; Miglécz, T.; Tóth, K.; Török, P.; Lukács, K.; Godó, L.; Körmöczi, Z.; Radócz, S.; et al. Establishment gaps in species-poor grasslands: Artificial biodiversity hotspots to support the colonization of target species. Restor. Ecol. 2021, 29, e13135. [Google Scholar] [CrossRef] [Green Version]
  21. Bao, G.; Lu, G.; Guo, J.; Bao, J. Effects of grazing, cutting and decapitating on grass populations on the artificial grassland in subtropical zone of China. J. Appl. Ecol. 2003, 14, 1327–1331. [Google Scholar] [PubMed]
  22. Tang, Z.X.; Yin, M.H.; Qi, G.P.; Kang, Y.X.; Ma, Y.L.; Wang, J.H.; Jia, Q.; Jiang, Y.B.; Wang, A.X. Effects of optimal irrigation and nitrogen coupling on Bromus inermis yield, nitrogen, phosphorus, and potassium stoichiometric characteristics. J. Plant Nutr. Fertil. 2022, 28, 532–545. [Google Scholar]
  23. Saeidnia, F.; Majidi, M.M.; Dehghani, M.R.; Mirlohi, A.; Araghi, B. Multi environmental evaluation of persistence and drought tolerance in smooth bromegrass (Bromus inermis): Genetic analysis for stability in combining ability. Crop Pasture Sci. 2021, 72, 565–574. [Google Scholar] [CrossRef]
  24. Wang, A.X.; Ma, Y.L.; Qi, G.P.; Kang, Y.X.; Yin, M.H.; Wang, J.H.; Jia, Q.; Tang, Z.X.; Jiang, Y.B. Water and nitrogen regulation patterns for productivity improvement of Bromus inermis and alfalfa mixed grassland. J. Soil Water Conserv. 2022, 36, 322–330. [Google Scholar] [CrossRef]
  25. Kang, W.Y.; Qi, G.P.; Kang, Y.X.; Yin, M.H.; Ma, Y.L.; Zhang, H.B. Influence of various irrigation schedules on yield and quality of grass-legume mixed artificial grassland. Water Resour. Plan. Des. 2020, 198, 103–109. [Google Scholar]
  26. Wang, L.; D’Odorico, P.; O’Halloran, L.R.; Caylor, K.; Macko, S. Combined effects of soil moisture and nitrogen availability variations on grass productivity in African savannas. Plant Soil 2010, 328, 95–108. [Google Scholar] [CrossRef]
  27. Lozano-Parra, J.; Schnabel, S.; Pulido, M.; Gómez-Gutiérrez, Á.; Lavado-Contador, F. Effects of soil moisture and vegetation cover on biomass growth in water-limited environments. Land Degrad. Dev. 2018, 29, 4405–4414. [Google Scholar] [CrossRef]
  28. von Haden, A.C.; Dornbush, M.E. Patterns of root decomposition in response to soil moisture best explain high soil organic carbon heterogeneity within a mesic, restored prairie. Agric. Ecosyst. Environ. 2014, 185, 188–196. [Google Scholar] [CrossRef]
  29. Tu, N.L.; Ba-Yin, Q.K.L.; Mo, R.G.; Cao, X.S. Soil moisture characteristics of different vegetation types in the Mu Us Sandyland. Yellow River 2020, 42, 63–64, 72. [Google Scholar] [CrossRef]
  30. Hou, Q.; Miao, B.L.; Wang, Y.S.; Dong, C.L. Effects of water stress on soil moisture in semiarid typical steppe. J. Arid. Meteorol. 2020, 38, 987–993. [Google Scholar] [CrossRef]
  31. Chen, J.; Song, N.P.; Chen, L.; Wang, X.; Wang, Q.X. Soil moisture dynamics and its response to precipitation in different cover types of desert steppe. J. Soil Water Conserv. 2021, 35, 198–206. [Google Scholar] [CrossRef]
  32. Lin, P.F.; Zhu, X.; He, Z.B.; Du, J.; Chen, L.F. Research progress on soil moisture temporal stability. Acta Ecol. Sin. 2018, 38, 3403–3413. [Google Scholar] [CrossRef]
  33. Yin, M.; Li, Y.; Li, H.; Xu, Y.; Zhou, C.; Zhang, T. Effects of nitrogen application rates on root growth and nitrogen use of summer maize. Trans. Chin. Soc. Agric. Mach. 2016, 47, 129–138. [Google Scholar] [CrossRef]
  34. Sahoo, S.; Mukhopadhyay, P.; Sinha, A.K.; Bhattacharya, P.M.; Rakesh, S.; Kumar, R.; Padbhushan, R.; Bijay, S.; Parmar, B.; Vishwakerma, A.; et al. Yield, nitrogen-use efficiency, and distribution of nitrate-nitrogen in the soil profile as influenced by irrigation and fertilizer nitrogen levels under zero-till wheat in the eastern Indo-Gangetic plains of India. Front. Environ. Sci. 2022, 10, 1329. [Google Scholar] [CrossRef]
  35. Rushimisha, I.E.; Wang, W.; Li, Y.; Li, X. Translocation of nitrate in rice rhizosphere and total nitrogen uptake improvement under interactive effect of water and nitrogen supply. Commun. Soil Sci. Plant Anal. 2023, 54, 378–391. [Google Scholar] [CrossRef]
  36. Oliveira, H.C.; Sodek, L. Effect of oxygen deficiency on nitrogen assimilation and amino acid metabolism of soybean root segments. Amino Acids 2013, 44, 743–755. [Google Scholar] [CrossRef] [PubMed]
  37. Wu, L.L.; Tian, C.; Zhang, L.; Huang, J.; Zhu, L.F.; Zhang, J.H.; Cao, X.C.; Jin, Q.Y. Research advance in the roles of water-nitrogen-oxygen factors in mediating rice growth, photosynthesis and nitrogen utilization in paddy soils. Chin. J. Appl. Ecol. 2021, 32, 1498–1508. [Google Scholar] [CrossRef]
  38. Li, Z.P.; Song, M.D.; Fen, H. Dynamic characteristics of leaf area index and plant height of winter wheat influenced by irrigation and nitrogen coupling and their relationships with yield. Trans. Chin. Soc. Agric. Eng. 2017, 33, 195–202. [Google Scholar] [CrossRef]
  39. Wang, J.H.; Li, G.; Yin, M.H.; Qi, G.P.; Kang, Y.X.; Ma, Y.L. Effects of regulated deficit irrigation on the soil environment and forage growth of mixed-species forage plantings in China’s high-cold desert area. Acta Prataculturae Sin. 2022, 31, 95–106. [Google Scholar] [CrossRef]
  40. Fessehazion, M.K.; Annandale, J.G.; Everson, C.S.; Stirzaker, R.J.; Tesfamariam, E.H. Evaluating of soil water balance (SWB-Sci) model for water and nitrogen interactions in pasture: Example using annual ryegrass. Agric. Water Manag. 2014, 146, 238–248. [Google Scholar] [CrossRef]
  41. Sha, B.P.; Xie, Y.Z.; Gao, X.Q.; Cai, W.; Fu, B.Z. Effects of coupling of drip irrigation water and fertilizer on yield and quality of alfalfa in the yellow river irrigation district. Acta Prataculturae Sin. 2021, 30, 102–114. [Google Scholar] [CrossRef]
  42. Zheng, Y.M.; Zhou, L.M.; Zheng, Y.P.; Wu, Z.F.; Sun, X.W.; Ding, T.Y.; Shen, P.; Wang, C.B. Relationship between carbon metabolism indices of peanut leaves and nitrogen fixation ability of nodules. J. Plant Nutr. Fertil. 2021, 27, 75–86. [Google Scholar] [CrossRef]
  43. Muhammad, I.; Yang, L.; Ahmad, S.; Farooq, S.; Al-Ghamdi, A.A.; Khan, A.; Zeeshan, M.; Elshikh, M.S.; Abbasi, A.M.; Zhou, X.B. Nitrogen fertilizer modulates plant growth, chlorophyll pigments and enzymatic activities under different irrigation regimes. Agronomy 2022, 12, 845. [Google Scholar] [CrossRef]
  44. Kochsiek, A.; Ciganda, V.; Bryan, N.; Hite, L.; Awada, T. Ecophysiological responses of Schizachyrium scoparium to water and nitrogen manipulations. Great Plains Res. 2006, 16, 29–36. [Google Scholar]
  45. Ge, Y.Q.; Yan, Y.L.; Liang, Y.; Gan-Zhu, Z.B.; Hu, G.Z.; Yang, J.; Gao, Z.Q.; He, S.C.; Dan-Jiu, L.B. The effects of nitrogen deposition on soil respiration in an Alpine Meadow in Northern Tibet. Chin. J. Agrometeorol. 2019, 40, 214–221. [Google Scholar] [CrossRef]
  46. Kumar, R.; Pareek, N.K.; Kumar, U.; Javed, T.; Al-Huqail, A.A.; Rathore, V.S.; Nangia, V.; Choudhary, A.; Nanda, G.; Ali, H.M.; et al. Coupling effects of nitrogen and irrigation levels on growth attributes, nitrogen use efficiency, and economics of cotton. Front. Plant Sci. 2022, 13, 890181. [Google Scholar] [CrossRef]
  47. Al-Solaimani, S.G.; Alghabari, F.; Ihsan, M.Z.; Fahad, S. Water deficit irrigation and nitrogen response of Sudan grass under arid land drip irrigation conditions. Irrig. Drain. 2017, 66, 365–376. [Google Scholar] [CrossRef]
  48. Saravia, D.; Farfán-Vignolo, E.R.; Gutiérrez, R.; De Mendiburu, F.; Schafleitner, R.; Bonierbale, M.; Khan, M.A. Yield and physiological response of potatoes indicate different strategies to cope with drought stress and nitrogen fertilization. Am. J. Potato Res. 2016, 93, 288–295. [Google Scholar] [CrossRef] [Green Version]
  49. Dell, E.A.; Carley, D.S.; Rufty, T.; Shi, W. Heat stress and N fertilization affect soil microbial and enzyme activities in the creeping bentgrass (Agrostis stolonifera L.) rhizosphere. Appl. Soil Ecol. 2012, 56, 19–26. [Google Scholar] [CrossRef]
Figure 1. Meteorological characteristics of the experimental site from April to October in 2020.
Agronomy 13 00745 g001
Figure 2. Layout plan of experimental plot.
Agronomy 13 00745 g002
Figure 3. Irrigation process of each treatment during the growth period of Bromus inermis. N0, N1, N2 and N3 refers to the nitrogen application level is 0 kg·ha−1, 60 kg·ha−1, 120 kg·ha−1 and 180 kg·ha−1, respectively. 2.3. Indicators and Methods for Measurement.
Agronomy 13 00745 g003
Figure 4. Effects of water-nitrogen regulation on temporal and spatial distribution of soil moisture. The legends on the right of the figure all represent SWC, unit: %. N0, N1, N2 and N3 refers to the nitrogen application level is 0 kg·ha−1, 60 kg·ha−1, 120 kg·ha−1 and 180 kg·ha−1, respectively. W0, W1, W2 and W3 refers to full irrigation (75–85% θf), slight water deficit (65–85% θf), moderate water deficit (55–85% θf) and severe water deficit (45–85% θf), respectively.
Agronomy 13 00745 g004
Figure 5. Effects of water-nitrogen regulation on temporal and spatial distribution of NO3–N concentration. (ad), (eh) and (il) represent soil NO3–N concentration in the first, second and third cut of Bromus inermis under the four irrigation management types, respectively.
Agronomy 13 00745 g005
Figure 6. Effects of water-nitrogen regulation on plant height of Bromus inermis. Different capital letters indicate the difference between different irrigation management types under the same nitrogen application level, and different lowercase letters indicate the difference between different nitrogen application levels under the same irrigation management (p < 0.05). W and N refer to irrigation management and nitrogen application level, respectively; N × W refers to interaction effect between the two. ** indicates an extremely significant difference (p < 0.01); ns indicates no significant difference (p > 0.05).
Agronomy 13 00745 g006
Figure 7. Effects of water-nitrogen regulation on chlorophyll content of Bromus inermis. Different capital letters indicate the difference between different irrigation management types under the same nitrogen application level, and different lowercase letters indicate the difference between different nitrogen application levels under the same irrigation management (p < 0.05). W and N refer to irrigation management and nitrogen application level, respectively; N × W refers to interaction effect between the two. ** indicates an extremely significant difference (p < 0.01); ns indicates no significant difference (p > 0.05).
Agronomy 13 00745 g007
Figure 8. Effects of water-nitrogen regulation on yield of Bromus inermis. Different capital letters indicate the difference between different irrigation management types under the same nitrogen application level, and different lowercase letters indicate the difference between different nitrogen application levels under the same irrigation management (p < 0.05). W and N refer to irrigation management and nitrogen application level, respectively; N × W refers to interaction effect between the two. ** indicates an extremely significant difference (p < 0.01); ns indicates no significant difference (p > 0.05).
Agronomy 13 00745 g008
Table 1. Water use efficiency and partial-factor productivity of applied nitrogen of Bromus inermis under water-nitrogen regulation.
TreatmentWater Use
Efficiency
(WUE, kg·m−3)
Partial-Factor Productivity of Applied Nitrogen (PFPN, kg·kg−1)TreatmentWater Use Efficiency
(WUE, kg·m−3)
Partial-Factor Productivity of Applied Nitrogen (PFPN, kg·kg−1)
N0W01.06 ± 0.03 Cc-N2W01.72 ± 0.10 Ca105.03 ± 4.74 Ab
N0W11.41 ± 0.06 Ad-N2W12.20 ± 0.04 Aa107.69 ± 2.51 Ab
N0W21.43 ± 0.08 Ad-N2W22.31 ± 0.05 Aa96.81 ± 1.69 Bb
N0W31.26 ± 0.10 Bc-N2W31.89 ± 0.09 Ba69.97 ± 1.92 Cb
N1W01.34 ± 0.12 Cb158.92 ± 9.43 BaN3W01.62 ± 0.01 Ba68.11 ± 0.87 Ac
N1W11.81 ± 0.09 Ac171.52 ± 5.42 AaN3W12.06 ± 0.06 Ab69.20 ± 1.28 Ac
N1W21.79 ± 0.03 Ac139.14 ± 3.56 CaN3W22.08 ± 0.05 Ab59.33 ± 1.18 Bc
N1W31.58 ± 0.09 Bb110.52 ± 6.27 DaN3W31.73 ± 0.10 Bab43.77 ± 2.80 Cc
Test of variance of significance
IndexNWN × W
WUE108.021 **35.696 **0.956 ns
PFPN282.156 **38.345 **3.274 *
Note: Different capital letters indicate the difference between different irrigation management types under the same nitrogen application level, and different lowercase letters indicate the difference between different nitrogen application levels under the same irrigation management (p < 0.05). ** indicates an extremely significant difference (p < 0.01); * indicates a significant difference (p < 0.05); ns indicates no significant difference (p > 0.05).
Disclaimer/Publisher’s Note: The statements, opinions and data contained in all publications are solely those of the individual author(s) and contributor(s) and not of MDPI and/or the editor(s). MDPI and/or the editor(s) disclaim responsibility for any injury to people or property resulting from any ideas, methods, instructions or products referred to in the content.

