Article

The Physicochemical and Nutritional Value of Fresh and Processed Portulacaria afra (Spekboom) Leaves

1
Department of Sustainable Food Systems and Development, University of the Free State, Bloemfontein 9300, Free State, South Africa
2
Department of Animal Science, University of the Free State, Bloemfontein 9300, Free State, South Africa
*
Author to whom correspondence should be addressed.
Agronomy 2023, 13(3), 709; https://doi.org/10.3390/agronomy13030709
Submission received: 26 January 2023 / Revised: 22 February 2023 / Accepted: 24 February 2023 / Published: 27 February 2023

Abstract

:
Wild-growing edible flora should be investigated to improve human food sustainability and security. Portulacaria afra (spekboom) is an undervalued edible succulent plant that thrives in harsh conditions in Southern Africa. This study determined whether the indigenous edible spekboom can be harnessed as a sustainable, nutritious food source and ingredient. Physicochemical and nutritional analyses were conducted on fresh and processed leaves (preserves, chutney, pickles, and spice). The physicochemical characteristics included morphology, color, texture, °Brix, pH, water activity, moisture content, titratable acidity, and ascorbic acid. Nutritional value determinants included crude protein, crude fiber, gross energy, and total fat content. The small, dark green fresh leaves had a soft texture and a very low sugar and fat content. Although the water content was high, water activity was low. The pH and titratable acidity showed high acidity. Leaves were high in ascorbic acid and low in protein, energy, insoluble fiber, and total fats. The leaves were successfully processed into preserved products providing possible applications in the food industry other than fresh leaves. The high acidity could be researched for application as a functional ingredient. This study provided basic information on an unexplored plant that may have potential in the food industry.

1. Introduction

The World Health Organization’s Sustainable Development Goals 1 (No poverty), 2 (Zero hunger), 3 (Good health and well-being), 8 (Decent work and economic growth) and 15 (Life on land) aim to end hunger, and improve nutrition, well-being, economic, and social status of people worldwide [1]. However, global food security is a growing concern because population increases result in increased demand for food, which presents a challenge for agricultural systems [2].
In Southern Africa, there are growing concerns over the sustainability of major crops [3]. The dominant agricultural strategies for adequate food supplies will have to be adapted to increase with demand, especially since climate change is an ever-increasing concern [4]. Politicians, policymakers, and researchers are calling for agricultural approaches that are resilient to climate change and feasible for small-scale farmers [4], yet the poor and food insecure are still vulnerable and suffer from food insecurity and undernourishment [3]. Crops that are resilient, increase food availability, increase nutrition security, protect genetic resources, and generate income opportunities are needed [5]. In South Africa, national agricultural and food policies should ensure that poor rural communities are educated on the role that indigenous plants could play in food security [6]. Most participants in a study, conducted in the North West province of South Africa, knew that indigenous plants grew easily and were drought, pest, and disease resistant. The participants also indicated that cultivating indigenous plants for personal or commercial use was sustainable and could increase food security [6]. Edible wild plants have the potential to strengthen and broaden the food basket and thereby increase dietary diversity. These plants cannot be ignored, especially when they are indigenous, resilient, freely available, and adapted to survive marginal conditions [6]. Ignored, underutilized, and undervalued crops could play a role in delivering the WHO’s 2015 agenda by supporting sustainability, biodiversity, climate-resilient agriculture, and food security [6,7,8].
One of the indigenous edible plants that grows in South Africa is Portulacaria afra (L.) Jacq. (P. afra) in the family Didiereaceae, also referred to as spekboom. The spekboom is a succulent plant distributed widely across the warm semi-arid regions of South Africa. It is indigenous to the sub-tropical Albany Thicket biome, a region of dense woodland in the Eastern Cape of which Grahamstown is the administrative capital [9]. Spekboom plants cover 1.7 million hectares of the thicket ecosystem; however, a successful restoration project conducted in Camdeboo National Park showed the efficacy of planting unrooted and rooted truncheons in clusters in trenches or micro-basins [10]. Spekboom is a straggling, multiple-branched small tree shrub with an attractive green color, leaves ranging from 2.4 to 4.5 cm, and reaching heights of 2.5 m in a thicket environment [11] (Figure 1 and Figure 2).
Researchers and journalists alike are interested in the spekboom because of its palatable leaves and carbon-sequestration ability, which is about a hundred times more efficient than a pine tree of comparable size [12,13]. A hectare-size spekboom population can absorb between four to ten tons of carbon from the atmosphere yearly, and with optimal conditions, carbon absorption is comparable to the Amazon rainforest. Hence, the spekboom is one of the foremost climate change-combating plants [12,13].
The spekboom has been labelled a medicinal plant, nutritional supplement, and functional food because of its high antioxidant capacity and novel bioactive compounds. The phytochemicals in the leaves, roots, and stems include quinones, phenols, steroids, coumarins, saponins, and terpenoids. The roots and stems are of interest because of their flavonoid and phenolic constituents. Plants also contain antimicrobial activity against Escherichia coli and Staphylococcus aureus and protect against enzyme functions [14,15,16].
Research on spekboom as a food source is minimal, but several wild and domestic animals such as chickens, tortoises, ostriches, sheep, cattle, goats, kudu, and other antelope find the leaves exceptionally palatable [12]. The spekboom also sustains large animals such as rhinoceros, buffalos, and elephants in wildlife conservation parks, which include the Addo Elephant National Park and surrounding private game reserves such as Shamwari close to Gheberha (South Africa) [12,17,18,19]. Thus, it is a good food source for animals [19]. The Zulus and Xhosas have embraced and used spekboom leaves as food and medicine for centuries, specifically for skin ailments, inflammation, vomiting, and diarrhoea [20,21], but much of the traditional knowledge was lost in modern times [22]. Currently, the plant’s value as a food source is still to be recognized and could enhance food security.
Recently, popular magazines published salad and stew recipes containing spekboom leaves [23]. Foraged or homegrown Spekboom leaves could be used as a vegetable in dishes, supplementing or replacing more expensive ingredients. There is, however, no traceable research on the nutritional content of spekboom. Thus, there is a need for studies on the physical, chemical, and nutritional characteristics of the spekboom as a food source. Once the nutritional characteristics are known, a lengthened shelf life and quality nutritious preserved products can be explored for marketing and industry. Ultimately, spekboom could play a role in counteracting malnutrition and undernourishment. Therefore, this study established base information on the spekboom as a food source by determining the physicochemical properties and nutritional value of fresh leaves and four processed commercial products (preserves, chutney, pickles, and chicken spice).

2. Materials and Methods

2.1. Sample Collection and Preparation

Eighteen P. afra (spekboom) plants were purchased at a local nursery in Bloemfontein, South Africa and planted on the premises of the University of the Free State main campus in January 2021. Samples were collected from six plants, which were selected because of their larger size and even distribution in the lot. Three samples were collected from each of the six trees in April 2021 (late summer), and each sample consisted of ten leaves. The plants were similar in age, and the best quality leaves were collected from the northern side of the plants, which received full sunshine during the day (southern hemisphere). The leaves were picked from the node intersection on the branch. The samples were labelled, transported, and washed with chlorinated water and air-dried. Freeze-dried samples were prepared for nutritional analysis as described in Section 2.3.
The spekboom processed products were obtained from a commercial producer in Johannesburg, South Africa. The producer concealed the brand name of the products and supplied six samples from six different batches of each of the four products (preserve, chutney, pickle, and chicken spice). The ingredient list was supplied, but the formulation was not disclosed. The products (preserves, pickles, chutneys, and chicken spice) were obtained in sterilized Consol jars. The tests were performed on each of the six samples of each product. The ingredients of the products are indicated in Table 1.

2.2. Physicochemical Analysis

Three leaf samples from each tree were measured on a Radwag Ps 750/c/2 scale in grams (g) and the size was determined in centimeters (cm). Texture analysis was not conducted on spekboom products due to their physical properties. The texture of fresh leaves was determined using a CT3 Brookfield Texture Analyzer. A compression test with a pre-test speed of 0.00 mm/s, test speed of 0.50 mm/s, and post-speed of 0.50 mm/s was conducted. The load cell was 10,000 g, the trigger load was 7 g, and the target distance was 7 mm. Results were observed with texture Pro CT software [24]. Samples were tested in three places (top, middle, and bottom) on the fixture base table TA-CJ below the needle probe TA2/100 (stainless steel, 1.0 mm diameter and 43 mm long). The probe was lowered automatically, penetrating and fracturing the sample over the target distance of 7 mm. The force needed to fracture the sample was measured. Hardness was the highest force (g) used to penetrate the sample over the target distance; the higher the reading, the softer the sample [25]. Hardness work performed was the energy (Megajoules) needed to break the strength and internal bonds within the specimen when fracturing the sample (MJ); the higher the value, the greater the energy required to fracture the sample. Deformation (mm) was the distance the probe moved before the sample fractured, the shorter the distance, the harder the sample. Peak load (g) was the maximum force necessary to tear the sample apart; the higher the value, the more force was needed to pull the sample apart [24,25].
A Konica Minolta Chroma CR-400 meter determined the color of the samples. The colorimeter was placed on top of the leaf, and each leaf was scanned twice, at different sections not far from each other. The two readings were averaged for each sample. The Hunter color scale indicating CIELAB and CIELCH values was used [26]. Measurement readings were in L*, a*, and b* of CIELAB. L* measured color lightness with values ranging from 0 (black) to 100 (white); a* represented red (positive values) and green (negative values); and b* represented yellow (positive values) and blue (negative values). Chroma (C*) represented the relative color saturation ranging from 0 (unsaturated or dull color) to 100 (brightness). Hue (h°) represented the position of colors in degrees on a color wheel where 0° was red, 90° was yellow, 180° was green, and 270° was blue. Both C* and h° coordinates were calculated from a* and b* with an online color parameter converter [27].
To determine viscosity, fresh leaves and products were homogenized into pulp using a Mellerware Robot 500 Inox Stick Blender. The fresh leaf samples were mixed 1:1 (grams) with distilled water, while the product samples (preserves, pickles, and chutneys) were homogenized as is. The fresh leaf samples were centrifuged using a roto head setting of 18 and a temperature of 4 °C at a speed of 8000 rpm for 15 min, and the volume (ml) of the supernatant was determined. A Brookfield DV3T Viscometer with a spindle number sc4-21 was used to determine the viscosity (cP) of each homogenized extract sample. The viscosity measurements were obtained using different speeds to indicate the flow properties of the fluid. The rate was set at 50 and 75 rpm at a controlled temperature of 25 °C. A container attached to the viscometer was filled with the 7 mL supernatant extract. The different speeds were observed for one minute and 16 s. The viscosity values were above 10% [28].
Total soluble solids (°Bx) for the fresh leaves and products (preserves, pickles, chutneys, and chicken spice) were determined by using a Hanna Instrument, HI96801, 0–85% Refractometer. One mL of extracted juice from the leaves and half a mL from the products were tested in the refractometer. The results were presented in degrees Brix (°Bx) [29].
An RS232 Novasina Thermoconstanter measured the water activity of the fresh leaves and products. A thermoconstanter was set at 190 and a temperature of 25 °C. The fresh leaves were chopped into small pieces, and two mL of fresh leaves and each of the products were analyzed. The results were presented on the screen of the thermoconstanter and recorded.
An Eco Therm oven was used to determine the moisture content of fresh leaves and products. Each sample was placed on a metal petri dish and weighed before being placed in the oven for 24 h at 102 °C, then weighed again after 24 h. The moisture content (%) was determined according to [30].
To determine the acidity of the samples, the leaves were crushed using a Mellerware stick blender, and distilled water was added at a ratio of 1:1 (grams) as a thinner pulp consistency was required to allow the insertion of the pH probe. The pulp was transferred into a plastic beaker, and a calibrated Eutech pH 2700 Ph/mV/°C/°F probe was inserted into the pulp to determine the pH [29]. To determine the titratable acidity, five mL of supernatant was combined with 35 mL distilled water, and 3 mL phenolphthalein was added. Sodium hydroxide was added in 0.50 mL steps and gently stirred using a magnetic stirrer. The endpoint of the reaction was indicated with a faint pink color. The sodium hydroxide titrated was recorded and expressed in milliliters (ml) before the final calculation. Titratable acidity expressed as citric acid (%) could not be determined for the chicken spice due to its physical properties. The final titratable acidity was expressed as TA (%), expressed as citric acid; the following equation was used for the calculation [23]. %   Titratable   acidity   expressed   as   citric   acid :
Titratable   acidity = titre   ( mL ) × 192.12   ( Molecular   weight   of   citric   acid ) 3   ( mL   of   phenolphthalein   indicator ) × 1000
The 2,6-dichloroindophenol titration method [31] was used to conduct the ascorbic acid analysis. A pipette was used to withdraw 5 mL of the supernatant extract, and the extract was combined with 1 mL acetic acid. For spekboom products such as pickles and chutney, 35 mL distilled water was added to the mixture of supernatant extract and acetic acid to ensure a liquid consistency. Ten mL dichlorophenol–indophenol solution was titrated at a rate of 0.50 mL at a time and gently stirred with a magnetic stirrer to ensure even distribution. The endpoint of the reaction was indicated with a faint pink color. Ascorbic acid in chicken spices was not conducted due to its physical properties. The results were expressed as mg/100 g ascorbic acid, and the following equation was used for the calculation:
mg/100 mg = (T − B)/(St − B) (20) (DF)
T = titration value; B = blank (0.01); St = standard solutions (5.18); and DF = dilution factor.
The dilution factor of pickles and chutney was different compared to the fresh leaves and the preserve because it required an additional amount of dilution (35 mL distilled water). The following dilution factor calculation was used:
DF = (V1 + V2)/V1
V1 = sample volume; and V2 = distilled water volume.

2.3. Nutritional Value Analysis

Fresh leaves (composite samples) and products (preserves, chutney, and pickles) were frozen at −18 °C for five days and freeze-dried for 48 h at −36 °C to obtain powder samples for analysis. Organic matter was determined by incineration for 5 hours at 550 °C in a muffle furnace, cooled to room temperature in a desiccator, weighed accurately, and expressed as grams (g) ash/kg DM [32]. The organic material content was calculated by subtracting the ash content (g) from 1000 g and expressed as g OM/kg DM.
Crude protein was determined by thermal combustion. Nitrogen (N) was determined in a Leco Nitrogen analyzer [33,34]. Crude protein was calculated automatically with a Leco machine by multiplying the nitrogen (N) content by a factor of 6.25 [35].
To determine the crude protein (CP/kg DM) in fresh leaves and product samples, 0.6 g freeze-dried samples were weighed in duplicate glass pill vials and dried overnight (100 °C). The samples were removed from the oven to cool to room temperature in a desiccator. A range of 0.09 g and 0.25 g of each dry matter sample was placed in foil containers. The accurate mass was determined, and the value was transmitted to a computer. Verification was conducted to ensure that the mass shown on the scale corresponded correctly with the one shown on the computer. The foil was wrapped, and the sample was placed in the carousel of a Leco machine in the position shown on the computer. When three minutes had elapsed, the value on the computer screen was recorded [34].
Gross energy was determined by a Leco Automatic Calorimeter AC-500 series Oxygen Combustion Vessel [33]. Gross energy was the heat, measured in joules (J), which was released when a sample was completely oxidized in an adiabatic bomb calorimeter, and the results were presented in megajoules (MJ). The sample was mixed thoroughly and weighed to an accurate amount of 0.35 g and placed in a clean and oven-dry metal crucible. The weight was logged into a computer, and the fuse wire was connected tightly to two electrodes. The crucible was placed with one electrode under the fuse wire, and the fuse wire was positioned just above the sample. The crucible with the sample was placed in the bomb cylinder and closed. The bomb was placed in the gas filling site, and the oxygen charger was attached to the bomb; when the switch was pressed, the bomb automatically filled with oxygen until it reached 420 psi (28.96 bars).
A combustion vessel bucket was filled with 2000 mL water and placed in the combustion bucket well and positioned at the front of the calorimeter, and the calorimeter lid was closed. The analysis process was started, and after the ignition took place, the calorimeter ran the analysis for 8 min. After the analysis, the results were displayed on a computer screen. No calculation was necessary because the instrument provided the correct reading, namely MJ/kg DM.
Neutral detergent fiber (NDF) and acid detergent fiber (ADF) were determined as described by Goering and Van Soest [35] and Roberson and Van Soest [36]. To determine neutral and acid detergent fiber, one gram of the air-dried and sieved samples (in duplicate) was weighed into a glass pill vial, dried overnight, and transferred into sintered glass crucibles. The weight was determined accurately and placed into the hot extraction unit. The applicable acid or neutral detergent solution (100 mL) was added to the samples and boiled for 60 min.
The enzyme α-amylase was added to the neutral detergent samples. The samples were filtered with suction, washed three times with hot distilled water, and rinsed twice with acetone. The samples were dried overnight at 100 °C, cooled in a desiccator, and weighed accurately. The samples were incinerated in a muffle furnace, allowed to cool before removal, placed in a desiccator for 30 min, and weighed again. The NDF was expressed as g/kg DM and ADF as g/kg DM.
Before the Soxhlet method to determine total fat content was applied, related substances were extracted from the freeze-dried samples with hexane [34]. After the hexane and dissolved material were separated, the hexane was vaporized, and the mass of the remaining substances was determined. The remaining substance was mainly fat.
An oven flask was placed in a desiccator to cool for at least 30 min before weighing. The sample was mixed thoroughly, and 2 grams were weighed onto a Whatman filter paper and wrapped up to ensure no sample loss. The filter paper was placed in a thimble. The sample in the thimble was covered with a plug of high-grade fat-free cotton wool and the thimble was placed in a dry Soxhlet flask. The extracting unit was assembled, and 150 mL of hexane was added to the flask. Extraction lasted for 4 hours. The hexane was decanted into a beaker, and the thimble was removed. It was allowed to accumulate in the Soxhlet Flask. The flask was left to evaporate to almost dry, but not to boil completely dry, overnight at 100 °C, alternated at 248 °C. The flask was placed in a desiccator for 30 min, and the mass was determined accurately. A mass of 2 g was used, and the calculation was as follows:
HSS = ( D E ) mass   ( g )   sample
where D is the mass (g) of the sample plus flask after extraction; E is the mass (g) of the flask before extraction; and HSS = hexane-soluble substances (hexane replaces ether in the method).

2.4. Statistical Analysis

For the physicochemical and nutritional analysis of fresh spekboom leaves, a one-way analysis of variance (ANOVA) was used to determine the differences between the fresh leaves and products. For statistically significant differences, Tukey’s Honest Significant Difference (HSD) post hoc test was used to determine which groups were different (p ≤ 0.05). Summary statistics were calculated for each tree and tabulated. The nutritional values obtained from the freeze-dried samples (DM) were converted to demonstrate the “fresh weight” values. All calculations were carried out with XLSTAT software [37].

3. Results and Discussion

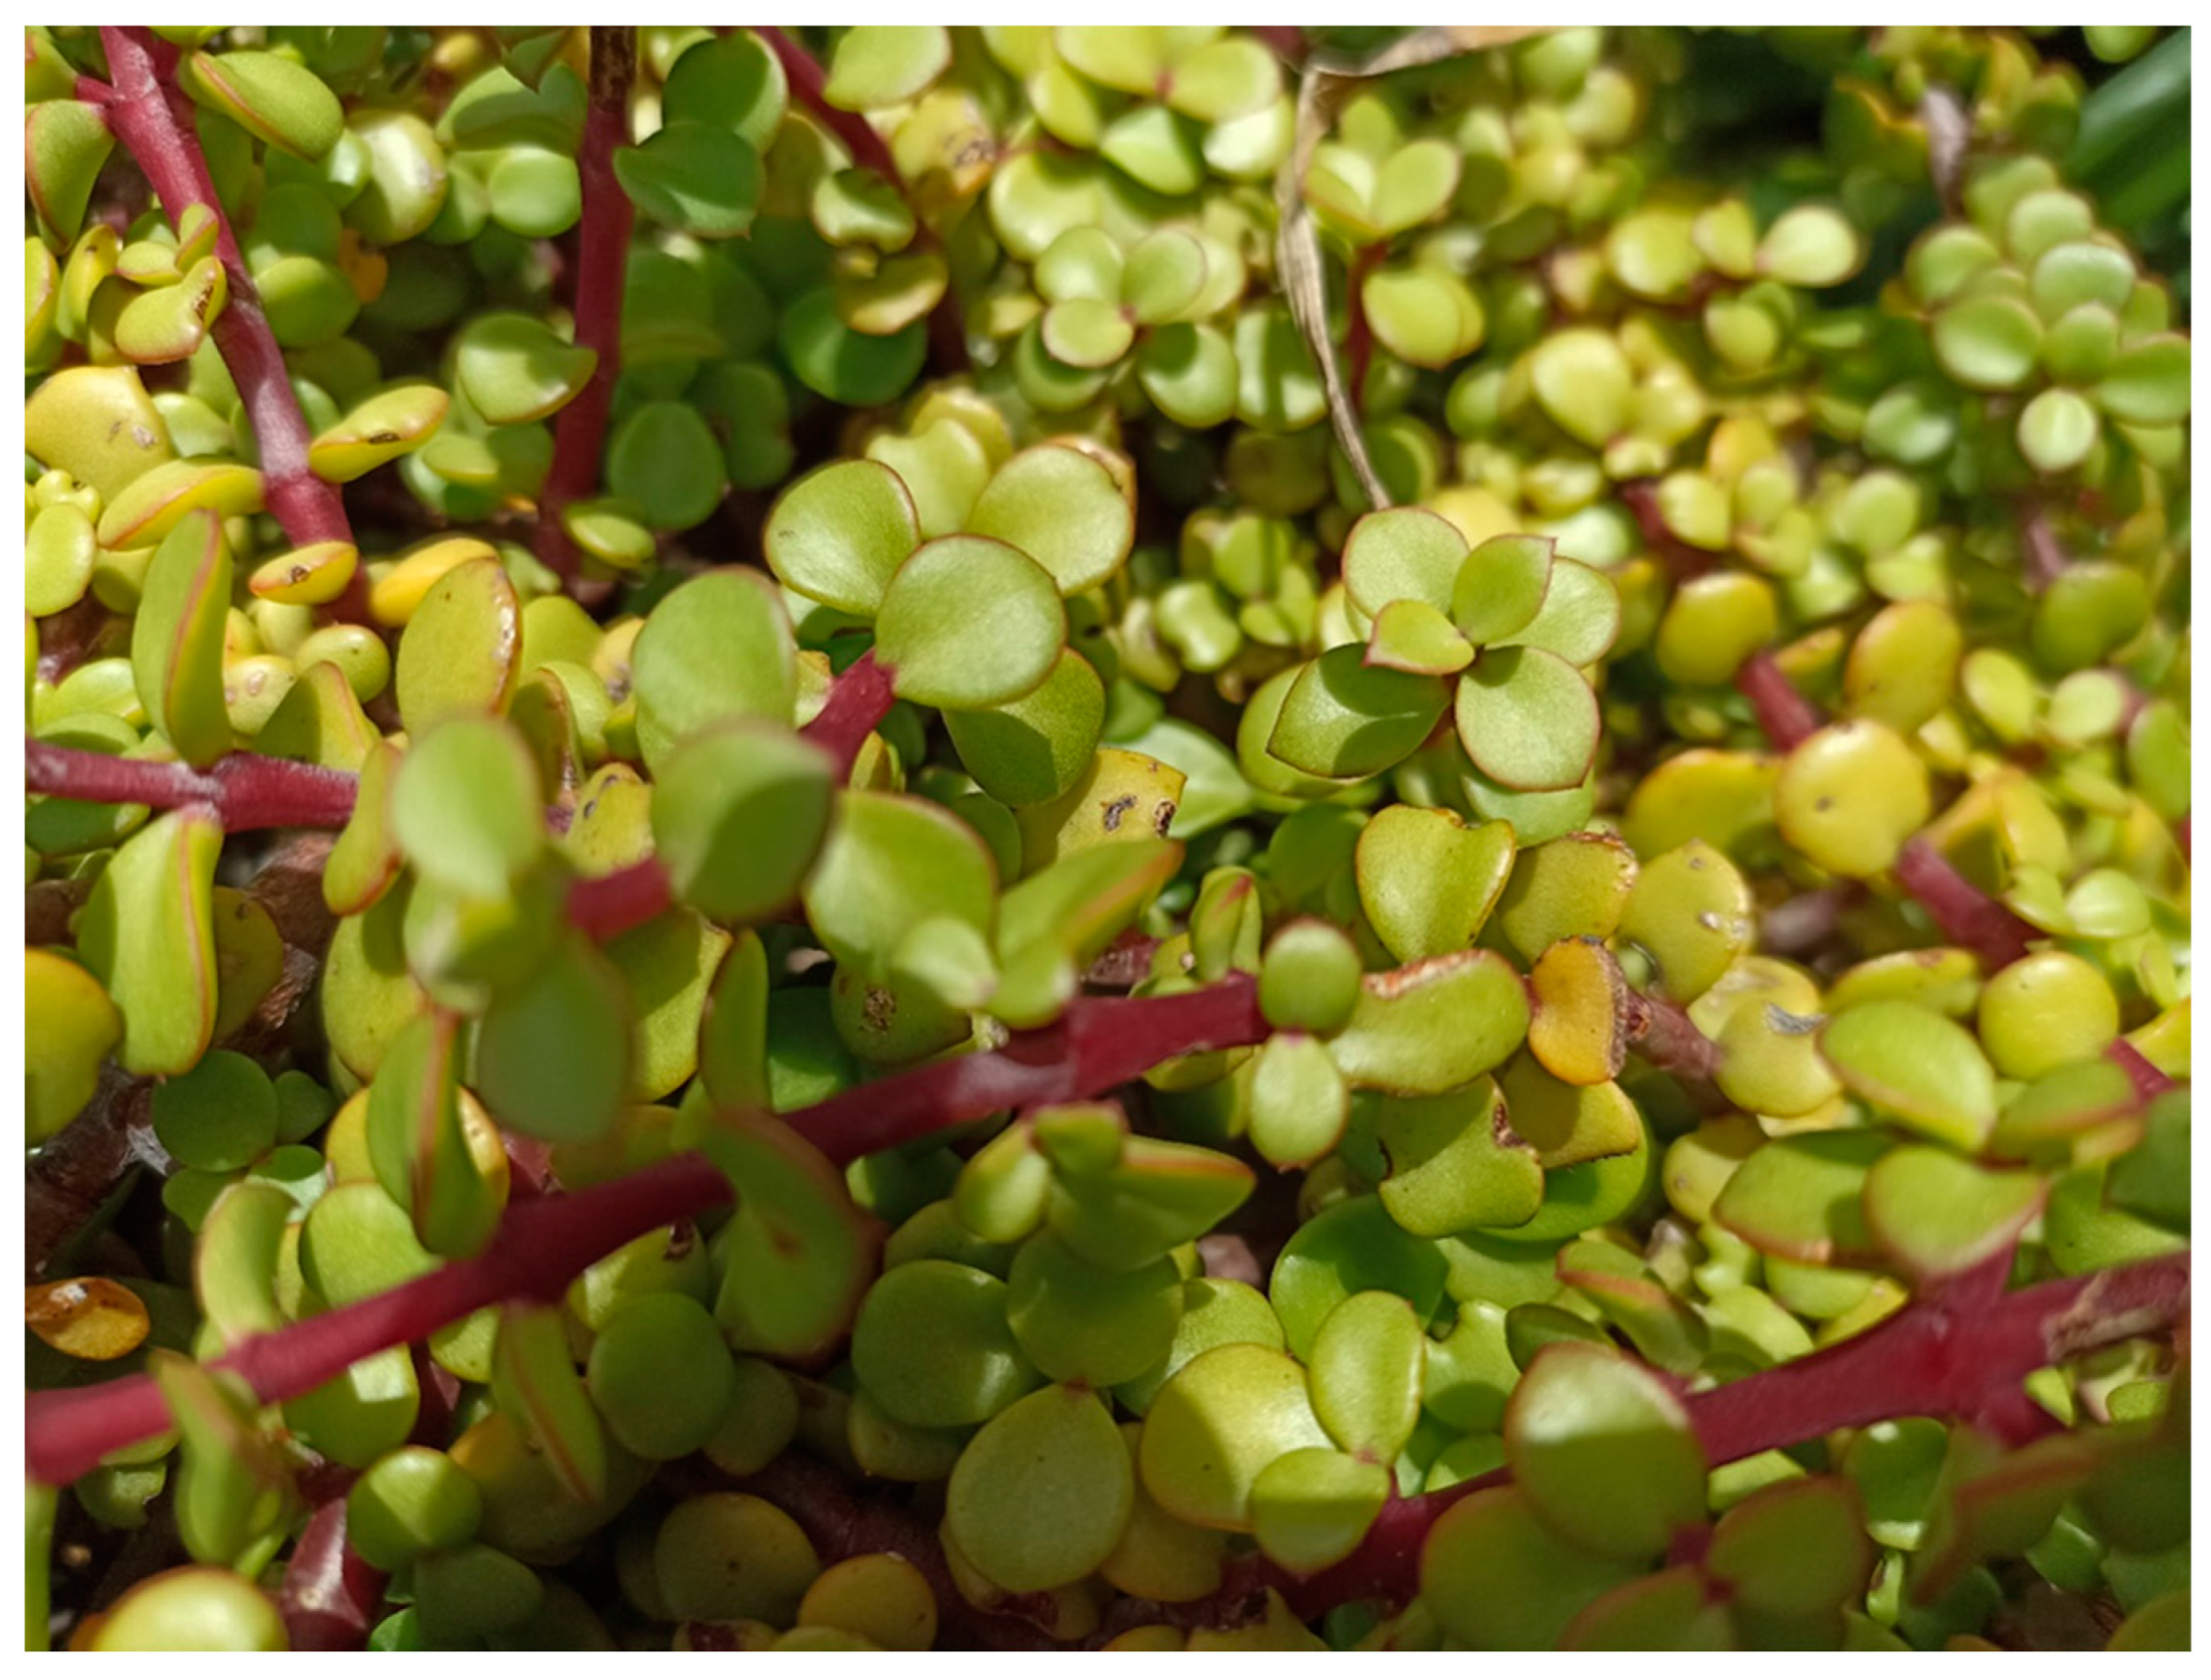
3.1. Morphology and Texture of Fresh Spekboom Leaves

The average weight for leaves was 0.64 g, average length was 2.20 cm, and the average width was 1.89 cm, indicating that the leaves were smaller and lighter in weight compared to most other vegetable leaves (Table 2; Figure 2). In terms of texture, the average hardness of fresh leaves was 51.16 g, hardness work was 0.38 MJ, and target deformation was 1.47 mm. Research on the hardness of nopalitos and green peppers was recorded as 503.67 g and 1137.61 g, respectively; hardness work was 8.43 mJ and 20.87 mJ, respectively; and the peak load was 2684.17 g and 2708.17 g, respectively [25]. Thus, spekboom leaves were softer than nopalitos and green peppers.

3.2. Physicochemical Characteristics of Spekboom Leaves Compared to Processed Spekboom Products

The color of fruits and vegetables is a critical attribute as it assists in determining the health and ripeness of a crop [38]. In this study, the fresh spekboom leaves indicated that they were darker in color (42.34 L*), represented green color (−13.18 a*) and yellowness (22.37 b*), and the position of the fresh leaves was at a green position (121.22 h°) and unsaturated in color (Table 3). Spekboom plants have bright green leaves with a glossy red-brown trunk and bear a dense crown of succulent leaves and stems [23].
Chicken spices represented a darker (64.09 L*) color compared to spekboom fresh leaves (42.23 L*). The pickles (44.36 L*), preserves (34.87 L*), and chutney (31.77 L*) were much lighter compared to spekboom fresh leaves (42.23 L*). Chicken spices (−1.39 a*) were greener than fresh leaves (−13.20 a*), preserves (−15.85 a*), pickles (4.41 a*), and chutneys (9.48 a*), thus showing a light green color in the fresh leaves, preserves, pickles, and chutneys (Table 3). Pickles (26.62 b*) were not different from preserves (25.51 b*) in yellowness (b*) but were much lighter in yellowness than fresh leaves (22.40 b*), chutneys (18.28 b*), and chicken spices (14.98 b*). The fresh leaves (121.22 h°), preserves (121.86 h°), and chutneys (118.07 h°) indicated a green hue (h°) on the color wheel while chicken spices (95.57*) indicated a hue (h°) falling close to the yellow hue (Table 3). Saturation values showed that fresh leaves, and spekboom products were below 50, which represented a low saturation (dull color), with chicken spices presenting a much duller color value compared to fresh leaves and products (Table 3). On average, nopalitos were 50.08 L*, −17.58 a*, 28.41 b*, the chroma was 33.38, and hue −57.52 h° [39], which compared with the color coordinates of spekboom leaves.
The average viscosity for fresh leaves at 50 rpm was 762.48 cP (Table 4). Applying higher rotation speeds meant that the material was more pressured towards the walls of the container, resulting in a decreased density of the sample [40,41]. The average viscosity for fresh leaves at 75 rpm was 524.13 cP. The spindle rotation of 75 rpm presented a lower cP reading, indicating that the extract had a lower viscosity compared to the 50 rpm spindle rotation. Thus, the extract showed non-Newtonian, pseudoplastic (shear thinning) behavior.
The extracts from the fresh leaves at 50 rpm cP (762.48 cP) were higher in viscosity than the preserves (202.33 cP), pickles (539.12 cP), and chutneys (537 cP) (Table 4). Like the fresh leaves, the spekboom products also showed shear-thinning characteristics because the viscosity of the products measured lower at a higher-speed rotation. Comparing the viscosity measurements to other studies was problematic as viscosity measures are different at different speeds (rpm). However, nopalito extracts measured between 17.32 cP and 48.92 cP for different sizes at 100 rpm [42], and between 120 cP and 673.33 cP for different cactus pear cultivars at 20 rpm [40].
The average total soluble solids for fresh leaves were 22°Bx (Table 5) [43]. Green peppers at different harvesting levels ranged from 3°Bx to 4°Bx, thus indicating that green peppers had higher sugar content than fresh spekboom leaves [44]. Chutneys (59.05°Bx) were higher in dissolved solids than fresh leaves (2.22°Bx), preserves (22.95°Bx), and pickles (22.95°Bx). Sweetness measured as 60°Bx was equivalent to sugar content of 60% [45]. In addition, canned products such as preserves, chutneys, pickles, and marmalades range from 65 to 68°Brix [45], making them higher in sweetness than the spekboom products. Although spekboom chutneys presented a high sugar content (59°Bx), they still had a lower sugar content compared to most other preserves, pickles, and chutneys eaten by consumers.
The average water activity for fresh leaves was 0.94 (Table 5) [46], which supported the growth of bacteria, yeast, and mold. The fresh spekboom leaves showed values below the 0.99 and 0.98 water activity limit levels, making them less susceptible to bacteria such as Clostridium botulinum type E and Pseudomonas fluorescens. Fresh leaves (0.94) were not significantly different from the preserves (0.85) and pickles (0.89) but were higher than the chutneys (0.69) and chicken spices (0.49). The water activity level that limits the growth of most pathogenic bacteria is 0.90 and 0.70 for spoilage molds, and the lower limit for all microorganisms is 0.60 [46]. It was noted that apart from the fresh leaves, all spekboom products were in a range of 0.49 to 0.89. The water activity level of fresh leaves and products showed that they might have been less susceptible to bacterial contamination.
The average moisture content of fresh leaves was 93.18% (Table 5). The moisture content in fruits and vegetables varies, with cucumbers at 95%, broccoli at 89%, green peppers at 94%, and 13 different underutilized green leafy vegetables ranging between 82.1 g/100 g and 95.3 g/100 g [47,48], indicating fresh spekboom leaves are in a similar range. The moisture content for fresh leaves (93.18) was significantly (p ≤ 0.05) higher than the preserves (43.07), pickles (69.45), and chutneys (41.46). Preserved products such as preserves, chutneys, pickles, and marmalades contain 30 to 35% moisture content [45]. Thus, the spekboom products had higher moisture content than other preserved products.
Fresh leaves were close to that of fresh lemon and vinegar in terms of acidity (Table 5). The fresh spekboom leaves ranged from 2.9 to 3.4 pH, while 149 out of 379 beverages tested in the USA had a pH of <3.0 [49]. The most acidic beverage was lemon juice (pH 2.25). Thus, spekboom leaves were in the safe pH range for consumption, although the leaves were sour. The pH of chicken spices (pH 5.55) was significantly higher (p ≤ 0.05) than fresh leaves (pH 3.28), preserves (pH 3.21), pickles (pH 3.03), and chutney (pH 3.38). The low pH level of fresh spekboom leaves might assist in their preservation [50].
The average titratable acidity expressed as citric acid for fresh leaves was 0.06% (Table 5). Mpemba [51] reported the titratable acidity for green pepper (0.09%) and cucumber (0.02%), within a similar range. In comparison, fresh lemon juice and lime juice are rich sources of citric acid, containing about 1.44 and 1.38 citric acid respectively, placing them in a higher range compared to fresh leaves [52]. Pickles (0.18) were not significantly different (p ≤ 0.05) from chutneys (0.17), but significantly higher (p ≤ 0.05) than fresh leaves (0.06) and preserves (0.11) (Table 5). As an example, jams and marmalades produced from Nigerian tropical fruits had titratable acid values between 1.83 and 3.54%, thus would taste sourer than the spekboom products [53].
The ascorbic acid for fresh leaves (35.26 mg/100 g) was significantly higher than for preserves (5.06 mg/100 g), pickles (4.40 mg/100 g), and chutneys (4.66 mg/100 g). The ascorbic acid content in nopalitos was 13.04 mg/100 g [54]. The ascorbic acid content of twelve underutilized leafy vegetables in India varied between 3 mg/100 g (Coleus aromaticus) and 85 mg/100 (Polygala erioptera) with an average of 33.6 m/100 g. Delonix elata was an outlier with an ascorbic acid content of 295 mg/100 g [49]. The ascorbic acid content for eight African leafy vegetables ranges between 1 (Jew’s mallow) and 10 mg/100 g (Tsamma melon) [55].

3.3. Nutritional Analyses of Fresh Spekboom Leaves Compared to Processed Spekboom Products

Plant proteins are of lower quality than animal proteins and offer less protein [56]. Fresh spekboom leaves were very low in crude protein content (0.57 g/100 g) compared to other green leafy vegetables. The protein content of eight African leafy vegetables ranged from 0.5 g/100 g (black nightshade) to 5.0 g/100 g (spider flower) with an average of 3.31 g/100 g [56]. For thirteen underutilized green leafy vegetables from India, the protein content varied between 0.6 g/100 g (Coleus aromatics) and 7.1 g/100 g (Delonix elata) [49] with an average of 3.29 g/100 g [55]. Chicken spices (4.03 g/100 g) were significantly higher (p ≤ 0.05) in crude protein content than fresh leaves (0.57 g/100 g), preserves (0.70 g/100 g), pickles (1.58 g/100 g), and chutneys (0.45 g/100 g). The pickles were significantly higher (p ≤ 0.05) than fresh leaves, preserves, and chutneys in crude protein, possibly because of the seed (mustard, caraway, and dill) content (Table 6).
The gross energy in the preserves (891.26 KJ/100 g) was not significantly different (p ≤ 0.05) from the pickles (692.51 KJ/100 g) and chutney (774.42 KJ/100 g) but was significantly higher (p ≤ 0.05) than the chicken spices (484.42 KJ/100 g) and fresh leaves (61.15 KJ/100 g) (Table 6). In comparison to fresh leaves (61.15 kJ/100 g), the gross energy of green pepper was approximately 70.90 kJ/100 g, cucumber 45 KJ/100 g, and leaf lettuce 50 KJ/100 g [57]. Gross energy reported for eight African leafy vegetables ranged between 120 kJ (Chinese cabbage) and 319 kJ/100 g (Jew’s mallow) with an average of 232 kJ/100 g [56]
In terms of crude fiber (NDF), pickles (5.47 g/100 g) were not significantly different (p ≤ 0.05) from the chicken spices (5.79 g/100 g) but were significantly higher (p ≤ 0.05) than fresh spekboom leaves (1.17 g/100 g), preserves (1.61 g/100 g), and chutneys (1.19 g/100 g) (Table 6). Fresh spekboom leaves exhibited very low NDF (1.17 g/100 g) compared to six nopalito cultivars, which had higher NDF content ranging from 17.75 to 24.18 g/100 g [58].
For acid–detergent fiber (ADF), fresh leaves exhibited low crude fiber (0.40 g/100 g). The pickles (4.90 g/100 g) and chicken spices (3.71 g/100 g) contained higher crude fiber (ADF) compared to the spekboom products, thus reflecting the contents of the other ingredients (Table 6). The ADF content of six nopalito cultivars ranged from 7.88 to 9.22 g/100 g, which was higher than fresh spekboom, and the dietary fiber content of eight African leafy vegetables were 5.63 g/100 g on average [55].
The total fat content of fresh spekboom leaves (0.116 g/100 g), preserves (0.031 g/100 g), and chutneys (0.011 g/100 g) was less than 1%, whilst the pickles (6.142 g/100 g) and chicken spices (3.746 g/100 g) had higher total fat content due to the other ingredients such as the oil in the pickle brine (Table 6). Six nopalitos cultivars had an average of 0.61 fat, and eight leafy African vegetables had an average fat content of 0.31 g/100 g [56]. In fact, most vegetables have less than 1% fat content [57].

4. Conclusions

This research established baseline information on the physicochemical and nutritional characteristics of fresh spekboom leaves and related processed products. A good quality spekboom leaf is small and lightweight with a dull green surface color, hard surface, soft inside, and high moisture content. The spekboom had a lemony and sour taste with juicy moisture-filled leaves. The leaves exhibited nutritional value (crude protein, gross energy, fiber, and total fat) that was lower than other wild edible plants and green leafy vegetables. However, it was a good source of ascorbic acid. Fresh spekboom leaves can serve as an economical supplement or replacement for green leafy vegetables. Good quality preserved products made from spekboom leaves were marketable, proving its potential for the food industry. The spekboom thrives in marginalized areas and can be utilized year-round, making it a potential food source to reduce food insecurity and malnutrition. The indigenous plant can be applied in Southern Africa’s food system and in hot and dry areas in the world. Future research should include sensory analysis, in-depth nutritional analyses, and screening for bioactive compounds such as antioxidants and phenols.

Author Contributions

Writing—original draft preparation, investigation, formal analysis Z.P.M.; conceptualization, writing—review and editing, methodology, supervision, project administration A.d.T.; methodology, funding acquisition, validation, supervision, resources M.d.W.; Validation, supervision, A.H. All authors have read and agreed to the published version of the manuscript.

Funding

This research was funded by The University of the Free State (2020) Central Research Fund.

Data Availability Statement

The data presented in this study are available on request from the corresponding author. The data are not publicly available due to privacy restrictions.

Acknowledgments

The authors would like to thank Wilben Pretorius for the statistical analyses.

Conflicts of Interest

The authors declare no conflict of interest. The funders had no role in the design of the study; in the collection, analyses, or interpretation of data; in the writing of the manuscript; or in the decision to publish the results.

References

  1. Resolution A/RES/70/1, 2015—Google Scholar. Available online: https://scholar.google.com/scholar?start=0&q=(Resolution+A/RES/70/1,+2015)&hl=en&as_sdt=0,5#d=gs_cit&t=1673960614137&u=%2Fscholar%3Fq%3Dinfo%3AugQ_0uyrJKIJ%3Ascholar.google.com%2F%26output%3Dcite%26scirp%3D0%26hl%3Den (accessed on 17 January 2023).
  2. Diouf, J.; Sheeran, J. The State of Food Insecurity in the World: Addressing Food Insecurity in Protracted Crises; FAO: Rome, Italy, 2010. [Google Scholar]
  3. Mabhaudhi, T.; O’Reilly, P.; Walker, S.; Mwale, S. Opportunities for Underutilised Crops in Southern Africa’s Post-2015 Development Agenda. Sustainability 2016, 8, 302. [Google Scholar] [CrossRef] [Green Version]
  4. Hendriks, S. Food security in South Africa: Status quo and policy imperatives. Agrekon 2014, 53, 1–24. [Google Scholar] [CrossRef]
  5. Ebert, A.W. The role of vegetable genetic resources in nutrition security and vegetable breeding. Plants 2020, 9, 736. [Google Scholar] [CrossRef] [PubMed]
  6. Omotayo, A.O.; Aremu, A.O. Underutilized African indigenous fruit trees and food–nutrition security: Opportunities, challenges, and prospects. Food Energy Secur. 2020, 9, e220. [Google Scholar] [CrossRef]
  7. Lobell, D.B.; Burke, M.B.; Tebaldi, C.; Mastrandrea, M.D.; Falcon, W.P.; Naylor, R.L. Prioritizing climate change adaptation needs for food security in 2030. Science 2008, 319, 607–610. [Google Scholar] [CrossRef]
  8. Mabhaudhi, T.; Chibarabada, T.; Modi, A. Water-food-nutrition-health nexus: Linking water to improving food, nutrition and health in sub-Saharan Africa. Int. J. Environ. Res. Public Health 2016, 13, 107. [Google Scholar] [CrossRef] [Green Version]
  9. Duker, R.; Cowling, R.M.; du Preez, D.R.; Potts, A.J. Frost, Portulacaria Afra Jacq., and the boundary between the Albany subtropical thicket and Nama-Karoo biomes. S. Afr. J. Bot. 2015, 101, 112–119. [Google Scholar] [CrossRef]
  10. Mills, A.J.; Robson, A. Survivorship of spekboom (Portulacaria afra) planted within the subtropical thicket restoration programme. S. Afr. J. Sci. 2017, 113, 1–3. [Google Scholar] [CrossRef] [Green Version]
  11. Hankey, A. Portulacaria afra. Available online: http://pza.sanbi.org/portulacaria-afra (accessed on 14 January 2023).
  12. Baran, R.J. Portulacaria afra Monograph, the Elephant’s Food or Spekboom. Available online: https://www.magiminiland.org/Portulacaria.html (accessed on 13 June 2022).
  13. Delport, S. About the Spekboom The Wonder Plant of the 21st Century. Available online: https://www.facebook.com/187179314663175/posts/about-the-spekboomthe-wonder-plant-of-the-21st-century-by-stef-delportthe-spekbo/2100007213380366/?_rdc=1&_rdr (accessed on 13 July 2022).
  14. Basson, D.C.; Teffo, T.K.; Risenga, I.M. A phytochemical screening, antioxidant and antibacterial activity analysis in the leaves, stems and roots of Portulacaria Afra. J. Herbmed Pharmacol. 2023, 12, 109–117. [Google Scholar] [CrossRef]
  15. Adeleye, O.C.; Risenga, I.M. Screening of phytochemical profile and biological activities in the leaves, stems and roots of South African Portulacaria afra using four extraction solvents. Biomed. Pharmacol. J. 2022, 15, 1561–1572. [Google Scholar] [CrossRef]
  16. Tabassum, S.; Ahmad, S.; Rehman, K.; Khurshid, U.; Rao, H.; Alamri, A.; Ansari, M.; Ali, B.; Waqas, M.; Saleem, H.; et al. Phytochemical, biological, and in-silico characterization of Portulacaria afra Jacq.: A possible source of natural products for functional food and medicine. S. Afr. J. Bot. 2022, 150, 139–145. [Google Scholar] [CrossRef]
  17. Ambreen, A. Spekboom—Climate Change Super Hero—The Green Directory. Available online: https://www.thegreendirectory.net/blog/spekboom-climate-change-super-hero (accessed on 13 June 2022).
  18. Secuianu, M. Portulacaria afra Plants Guide: How to Grow & Care for “Elephant Bush”. Available online: https://gardenbeast.com/portulacaria-afra-guide/ (accessed on 23 January 2023).
  19. Van Zyl, M. 10 Things You Didn’t Know about Addo Elephant National Park. Available online: https://www.getaway.co.za/travel-ideas/destinations-travel-ideas/addo-elephant-national-park/ (accessed on 13 June 2022).
  20. Salaheldin, A.T.; El-Chaghaby, G.; El-Sherbiny, A.M. Green synthesis of silver nanoparticles using Portulacaria afra plant extract: Characterization and evaluation of its antibacterial, anticancer activities. Novel Res. Microbiol. J. 2019, 3, 215–222. [Google Scholar] [CrossRef] [Green Version]
  21. De Wet, H.; Nciki, S.; van Vuuren, S.F. Medicinal plants used for the treatment of various skin disorders by a rural community in Northern Maputaland, South Africa. J. Ethnobiol. Ethnomed. 2013, 9, 51.a. [Google Scholar] [CrossRef] [PubMed] [Green Version]
  22. Welcome, A.K.; van Wyk, B.E. An inventory and analysis of the food plants of Southern Africa. S. Afr. J. Bot. 2019, 122, 136–179. [Google Scholar] [CrossRef]
  23. Shamwari Spekboom—5 Amazing Facts About This Wonder Plant. Available online: https://www.shamwari.com/5-amazing-facts-about-spekboom/ (accessed on 13 June 2022).
  24. Brookfield Ametek. CT3 Texture Analyzer Operating Instructions Manual No. M08-372-F1116; Brookfield Ametek: Middleborough, MA, USA; Volume 8139, ISBN 5089466262.
  25. Du Toit, A.; Mpemba, O.S.; de Wit, M.; Venter, S.L.; Hugo, A. The influence of basic cooking methods on texture attributes of ‘Morado’ nopalitos. Acta Hortic. 2022, 1343, 369–376. [Google Scholar] [CrossRef]
  26. HunterLab CIE L * a * b Color Scale. Appl. Note 2007, 8, 1–4.
  27. ColorMine.org Convert Lab to Lch. Available online: http://colormine.org/convert/lab-to-lch (accessed on 7 December 2016).
  28. Brookfield Engineering Laboratories More Solutions to Sticky Problems. A Guide to Getting More from Your Brookfield Viscometer & Rheometer. Available online: www.brookfieldengineering.com/download/files/more_solutions.pdf (accessed on 12 August 2015).
  29. Sadler, G.D.; Murphy, P.A. PH and titratable acidity. In Instructor’s Manual for Food Analysis; Nielsen, S., Ed.; Springer: Berlin/Heidelberg, Germany, 2010; pp. 219–238. [Google Scholar]
  30. McClements, D.J. Food Emulsions: Principles, Practices, and Techniques, 2nd ed.; CRC Press: Boca Raton, FL, USA, 2004. [Google Scholar] [CrossRef]
  31. Nerdy, N. Determination of Vitamin C in Various Colours of Bell Pepper (Capsicum annuum L.) by Titration Method. ALCHEMY J. Penelit. Kim. 2018, 14, 164–177. [Google Scholar] [CrossRef] [Green Version]
  32. Trace Analysis Guide. Available online: https://www.inorganicventures.com/trace-analysis-guide/ashing-procedures (accessed on 15 January 2023).
  33. Leco FP-528. Protein/Nitrogen Determinator. FP-528 Instruction Manual, version 1.2.; Leco® Corporation: St. Joseph, MI, USA, 2001.
  34. Association of Official Analytical Chemists. International Official Methods of Analysis of AOAC International, 16th ed.; (920.39), M. 4.5.10; AOAC International: Rockville, MD, USA, 1995. [Google Scholar]
  35. Goering, H.K.; van Soest, P.J. Forage fiber analyses (apparatus, reagents, procedures, and some applications). In Agriculture Handbook; U.S. Agricultural Research Service: Beltsville, MD, USA, 1970; p. 20. [Google Scholar]
  36. Roberson, J.B.; van Soest, P.J. The detergent system of analysis and its application to human foods. In The Analysis of Dietary Fiber in Food; James, W.P.T., Theader, O.D., Eds.; Marcel Dekker: New York, NY, USA, 1981; pp. 123–158. [Google Scholar]
  37. XLSTAT 1.1; Statistical and Data Analysis Solution. XLSTAT: Boston, MA, USA, 2018.
  38. Barrett, D.M.; Beaulieu, J.C.; Shewfelt, R. Color, flavor, texture, and nutritional quality of fresh-cut fruits and vegetables: Desirable levels, instrumental and sensory measurement, and the effects of processing. Crit. Rev. Food Sci. Nutr. 2010, 50, 369–389. [Google Scholar] [CrossRef]
  39. Makhalemele, B.L.; de Wit, M.; Truter, M.M.; du Toit, A.; Fouche, H.J.; Hugo, A.; Venter, S.L. Morphological and physico-chemical properties of nopalitos from twenty cactus pear cultivars. Acta Hortic. 2022, 1343, 387–394. [Google Scholar] [CrossRef]
  40. Du Toit, A.; de Wit, M.; Fouché, J.H.; Taljaard, M.; Venter, S.; Hugo, A. Mucilage powder from cactus pears as functional ingredient: Influence of cultivar and harvest month on the physicochemical and technological properties. J. Food Sci. Technol. 2019, 56, 2404–2416. [Google Scholar] [CrossRef]
  41. Trachtenberg, S.; Mayer, A.M. Biophysical properties of opuntia Ficus-indica mucilage. Phytochemistry 1982, 21, 2835–2843. [Google Scholar] [CrossRef]
  42. Du Toit, A.; Mpemba, O.; de Wit, M.; Venter, S.L.; Hugo, A. The effect of size, cultivar and season on the edible qualities of nopalitos from South African cactus pear cultivars. S. Afr. J. Bot. 2021, 142, 459–466. [Google Scholar] [CrossRef]
  43. Magwaza, L.S.; Opara, U.L. Analytical methods for determination of sugars and sweetness of horticultural products—A review. Sci. Hortic. 2015, 184, 179–192. [Google Scholar] [CrossRef]
  44. Moreno-Reséndez, A.; Parcero-Solano, R.; Reyes-Carrillo, J.L.; Salas-Pérez, L.; Moncayo-Luján, M.d.R.; Ramírez-Aragón, M.G.; Rodríguez-Dimas, N. Organic manures improved the phenolic content, antioxidant capacity and soluble solids in pepper. Food Nutr. Sci. 2016, 7, 1401–1413. [Google Scholar] [CrossRef] [Green Version]
  45. Hedh, J. The Jam and Marmalade Bible: A Complete Guide to Preserving. Available online: https://www.amazon.com/Jam-Marmalade-Bible-Complete-Preserving/dp/1616086068 (accessed on 16 January 2023).
  46. Tapía, M.S.; Alzamora, S.M.; Chirife, J. Effects of Water Activity (aW) on microbial stability as a hurdle in food preservation. In Water Activity in Foods: Fundamentals and Applications; John Wiley & Sons: Hoboken, NJ, USA, 2020; pp. 323–355. [Google Scholar] [CrossRef]
  47. Whitbread, D. 17 Vegetables Highest in Water. Available online: https://www.myfooddata.com/articles/vegetables-high-in-water.php (accessed on 12 October 2021).
  48. Gupta, S.; Jyothi Lakshmi, A.; Manjunath, M.N.; Prakash, J. Analysis of nutrient and antinutrient content of underutilized green leafy vegetables. LWT 2005, 38, 339–345. [Google Scholar] [CrossRef]
  49. Reddy, A.; Norris, D.F.; Momeni, S.S.; Waldo, B.; Ruby, J.D. The PH of beverages in the United States. J. Am. Dental Assoc. 2016, 147, 255–263. [Google Scholar] [CrossRef] [Green Version]
  50. Brown, A.C. Understanding Food: Principles and Preparation, 3rd ed.; Adams, P., Rose, N., Feldman, E., Eds.; Thomson Wadsworth: Boston, MA, USA, 2007; ISBN 978-0-495-10745-3. [Google Scholar]
  51. Mpemba, O.S.; du Toit, A.; de Wit, M.; Venter, S.L.; Hugo, A. Edible characteristics of two nopalito cultivars compared to selected popular vegetables. Acta Hortic. 2022, 1343, 409–416. [Google Scholar] [CrossRef]
  52. Penniston, K.L.; Nakada, S.Y.; Holmes, R.P.; Assimos, D.G. Quantitative Assessment of Citric Acid in Lemon Juice, Lime Juice, and Commercially-Available Fruit Juice Products. J. Endourol. 2008, 22, 567–570. [Google Scholar] [CrossRef]
  53. Juliet Tamuno Emelike, N.; Njt, E. Quality attributes of jams and marmalades produced from some selected tropical fruits. J. Food Process. Technol. 2019, 10, 790. [Google Scholar] [CrossRef]
  54. 10 Vegetables High in Vitamin C—June 2020. Available online: https://www.healthsomeness.com/vegetables-with-vitamin-c/ (accessed on 18 January 2023).
  55. Van Jaarsveld, P.; Faber, M.; van Heerden, I.; Wenhold, F.; Jansen van Rensburg, W.; van Averbeke, W. Nutrient content of eight african leafy vegetables and their potential contribution to dietary reference intakes. J. Food Compos. Anal. 2014, 33, 77–84. [Google Scholar] [CrossRef] [Green Version]
  56. Whitney, E.; Rolfes, S.R. Understanding Nutrition, 14th ed.; Wadsworth Publishing Company: Belmont, CA, USA, 2015; ISBN 101305396456. [Google Scholar]
  57. Nutrition Information for Raw Vegetables|FDA. Available online: https://www.fda.gov/food/food-labeling-nutrition/nutrition-information-raw-vegetables (accessed on 18 January 2023).
  58. Makhalemele, B.L.; de Wit, M.; Truter, M.M.; du Toit, A.; Hugo, A.; Venter, S.L. The nutritional evaluation of nopalitos from six South African cactus pear cultivars. Acta Hortic. 2022, 1343, 377–386. [Google Scholar] [CrossRef]
Figure 1. Portulacaria afra (spekboom) in its natural habitat in the arid Karoo.
Agronomy 13 00709 g001
Figure 2. Close-up of P. afra (spekboom) leaves and branches.
Agronomy 13 00709 g002
Table 1. Ingredients used in the four commercial spekboom products.
Spekboom ProductIngredients
PreserveSpekboom leaves, tomatoes, sugar, lemon juice, ginger, chilli, vinegar
PicklesSpekboom leaves, honey, red wine vinegar, rooibos tea, onion, olive oil, mustard seeds, non-iodized salt, dill seeds, caraway seeds, black peppercorns, coriander seeds, cinnamon, pimento, bay leaves
ChutneySpekboom leaves, apple, onion, bell pepper, sugar, vinegar, salt, ginger, chilli, black pepper, nutmeg, cloves, coriander, and apricot jam (All Gold brand).
Chicken spiceDry spekboom leaves, sea salt, garlic flakes, sesame seeds, black pepper, onion flakes, thyme, rosemary, sage, marjoram
Table 2. Morphology and texture of fresh spekboom leaves.
Morphology (n = 180)Weight (g)0.64 ± 0.06
Length (cm)2.20 ± 0.02
Width (cm)1.89 ± 0.02
Texture (n = 180)Hardness (g)51.16 ± 13.73
Hardness work (mJ)0.38 ± 0.11
Deformation (mm)1.47 ± 0.05
Peak Load (g)51.25 ± 13.74
Table 3. Color comparison between fresh spekboom leaves and processed spekboom products.
ProductL*a*b*C*
Fresh leaves (n = 180)
Preserves (n = 6)
42.23 c ± 1.13−13.20 b ± 0.6722.40 b ± 1.20121.22 c ± 0.9026.15 c ± 1.21
34.87 b ± 2.02−15.85 a ± 2.0725.51 bc ± 2.04121.86 c ± 3.2830.06 d ± 2.35
Pickles (n = 6)
Chutneys (n = 6)
Chicken spices (n = 6)
44.36 c ± 1.09−4.41 d ± 2.2226.62 c ± 1.72101.32 b ± 1.0027.13 cd ± 1.65
31.77 a ± 1.08−9.48 c ± 0.8518.28 a ± 3.77118.07 c ± 4.6020.66 b ± 3.49
64.09 d ± 1.63−1.39 e ± 0.2714.98 a ± 0.6195.57 a ± 1.2615.04 a ± 0.60
Means with different superscripts in the same column differed significantly (p < 0.05).
Table 4. The viscosity yield comparison between fresh spekboom leaves and processed spekboom products.
Product50 rpm cP75 rpm cP
Fresh leaves (n = 18)762.48 c ± 31.31524.13 d ± 33.36
Preserves (n = 6)202.33 a ± 15.51178.29 a ± 18.15
Pickles (n = 6)539.12 b ± 57.27278.23 b ± 39.06
Chutneys (n = 6)537.00 b ± 27.63364.13 c ± 25.32
Means with different superscripts in the same column differed significantly (p < 0.05).
Table 5. The soluble solids, water activity, moisture content, pH, titratable acidity, and ascorbic acid in fresh spekboom leaves and processed spekboom products.
Product°Brix
(%)
Water
Activity
Moisture
Content
(%)
pH
(%)
Titratable
Acidity
(%)
Ascorbic Acid
(mg/100 g)
Fresh leaves (n = 18)
Preserves (n = 6)
2.22 a ± 0.410.94 c ± 0.0293.18 c ± 2.763.28 a ± 0.190.06 a ± 0.00635.26 a ± 7.40
54.88 c ± 2.910.85 c ± 0.0243.07 a ± 3.293.21 a ± 0.120.11 b ± 0.0195.06 b ± 1.46
Pickles (n = 6)
Chutneys (n = 6)
Chicken spices (n = 6)
22.95 b ± 1.690.89 c ± 0.0369.45 b ± 1.533.03 a ± 0.040.18 c ± 0.0274.40 b ± 1.40
59.05 d ± 2.210.69 b ± 0.1641.46 a ± 2.893.38 a ± 0.400.17 c ± 0.0054.66 b ± 0.33
32.97 c ± 1.560.49 a ± 0.0317.56 a ± 0.305.55 b ± 0.34N/AN/A
Means with different superscripts in the same column differed significantly (p < 0.05).
Table 6. Nutritional analyses of fresh spekboom leaves compared to processed spekboom products.
ProductCrude Protein
(g/100 g)
Gross Energy
(KJ/100 g)
Crude Fiber (NDF)
(g/100 g)
Crude Fiber (ADF)
(g/100 g)
Total Fat Content
(g/100 g)
Fresh leaves (n = 18)
Preserves (n = 6)
0.57 a ± 0.0661.15 a ± 5.081.17 a ± 0.180.40 a ± 0.070.12 a ± 0.011
0.70 a ± 0.12891.26 c ± 63.671.61 a ± 0.261.56 b ± 0.700.03 a ± 0.01
Pickles (n = 6)
Chutney (n = 6)
Chicken spices (n = 6)
1.58 b ± 0.20692.51 bc ± 46.735.47 b ± 0.924.90 d ± 0.706.14 c ± 0.58
0.45 a ± 0.14774.42 c ± 268.801.19 a ± 0.340.93 ab ± 0.320.01 a ± 0.01
4.03 c ± 0.62484.42 b ± 74.815.79 b ± 0.913.71 c ± 0.553.75 b ± 0.82
Means with different superscripts in the same column differed significantly (p < 0.05).
Disclaimer/Publisher’s Note: The statements, opinions and data contained in all publications are solely those of the individual author(s) and contributor(s) and not of MDPI and/or the editor(s). MDPI and/or the editor(s) disclaim responsibility for any injury to people or property resulting from any ideas, methods, instructions or products referred to in the content.

