Article

How Much Impact Has the Cover Crop Mulch in Mitigating Soil Compaction?—A Field Study in North Italy

1
Dipartimento Territorio e Sistemi Agro-Forestali, Università di Padova, Viale dell’università 16, 35020 Legnaro, Italy
2
Dipartimento di Scienze Agrarie, Alimentari e Agro-ambientali, Università di Pisa, Via del Borghetto 80, 56124 Pisa, Italy
*
Author to whom correspondence should be addressed.
Agronomy 2023, 13(3), 686; https://doi.org/10.3390/agronomy13030686
Submission received: 21 January 2023 / Revised: 21 February 2023 / Accepted: 24 February 2023 / Published: 26 February 2023

Abstract

:
Soil compaction was largely studied in different scenarios with laboratory and field scale experiments, with various soil conditions and traffic intensities. However, a detailed analysis to better understand the protective role of plant residues or cover crop mulch is still required. A field test was conducted in Northeast Italy aiming to fill this gap. Rye was chosen as a winter cover crop, and growth on a controlled traffic random block experimental field. Four different cover crop mulch treatments were compared to study the effects of root systems: roller crimper, flail mower, bare soil control and harvested biomass control. Four different traffic intensities were used to evaluate the multiple passages with 0, 1, 3, 5 traffic events. During traffic events, the mean normal stress was measured. Penetration resistance was then evaluated after trafficking and soil samples were collected. The obtained results showed a 19.3% cone index increase in bare soil compared to flail mower treatment after the first traffic event, while low differences were found in harvested biomass bulk density during the first and third traffic events. Moreover, mean normal stress increased 16.5% on harvested biomass treatment compared to the flail mower. These findings highlight that the cover crop maintains a lower soil penetration resistance during compaction events, helping the subsequent field operations. Furthermore, roller crimper and flail mower cover crop termination impact soil bearing capacity differently due to different soil moisture content. However, the results showed a low contribution of cover crop mulch on mitigating soil compaction effects during the experiment.

1. Introduction

Soil compaction is one of the main causes of soil degradation [1]. In fact, soil compaction induces a complex change in soil conditions and behaviour, including loss of soil porosity and pore function [2]. This phenomenon occurs when the load transmitted by vehicles applied a higher stress than the soil bearing capacity, which involves plastic soil deformation [3]. Different approaches can be used to mitigate soil compaction effects on soil and plant growth, such as enhancing soil bearing capacity [4], decreasing soil stress [5] or reducing the trafficked area [6]. During forestry operations, the use of brush mats as a soil protective layer was frequently adopted to decrease compaction and improve trafficability [7]. Conservation agriculture can match the same forestry strategy to mitigate compaction when residues are left on the surface, but the main aim is to mitigate soil erosion. Few experiments studied soil compaction mitigation on the surface residue layer. Ess et al. studied the cover crop effects on mitigating soil compaction with field experiments by analysing roots and surface biomass effects on soil characteristics and behaviour [8]. In addition, field tests with stress state transducers showed residues effects on soil stress compared to bare soil [9], but the quantity, type and conditions of residues was not defined. Other lab and bin experiments showed no differences between different amounts of residues mixed with soil on the compression index [10]. However, a bin experiment with surface residues showed that mean normal stress decreases less than 80 kPa comparing maize residues and bare soil treatment with no statistical differences in bulk density [10]. Other outcomes regarding residues effects on stress mitigation were obtained in a laboratory experiment, but they did not confirm the field test [11]. Recent findings obtained in a laboratory experiment showed that residues effects have subtly increased soil load-bearing capacity (e.g., 15 kPa in apparent precompression stress, 7%). Soil bulk density changes decreased below 100 kPa stress and increased over 400 kPa stress [12]. Few previous studies showed a complete approach to evaluate the residues effects on soil compaction [8]. Indeed, other studies were focused on residues effects only, without analysing the soil conditions due to the lying residues or cover crop growth [11,12]. The aim of our study was to test the effects of residues obtained from differing cover crop management on soil compaction in a real-scale field experiment by considering possible interactions and effects that affect the soil compaction phenomena during cropping operations, which are difficult to observe in laboratory experiments.

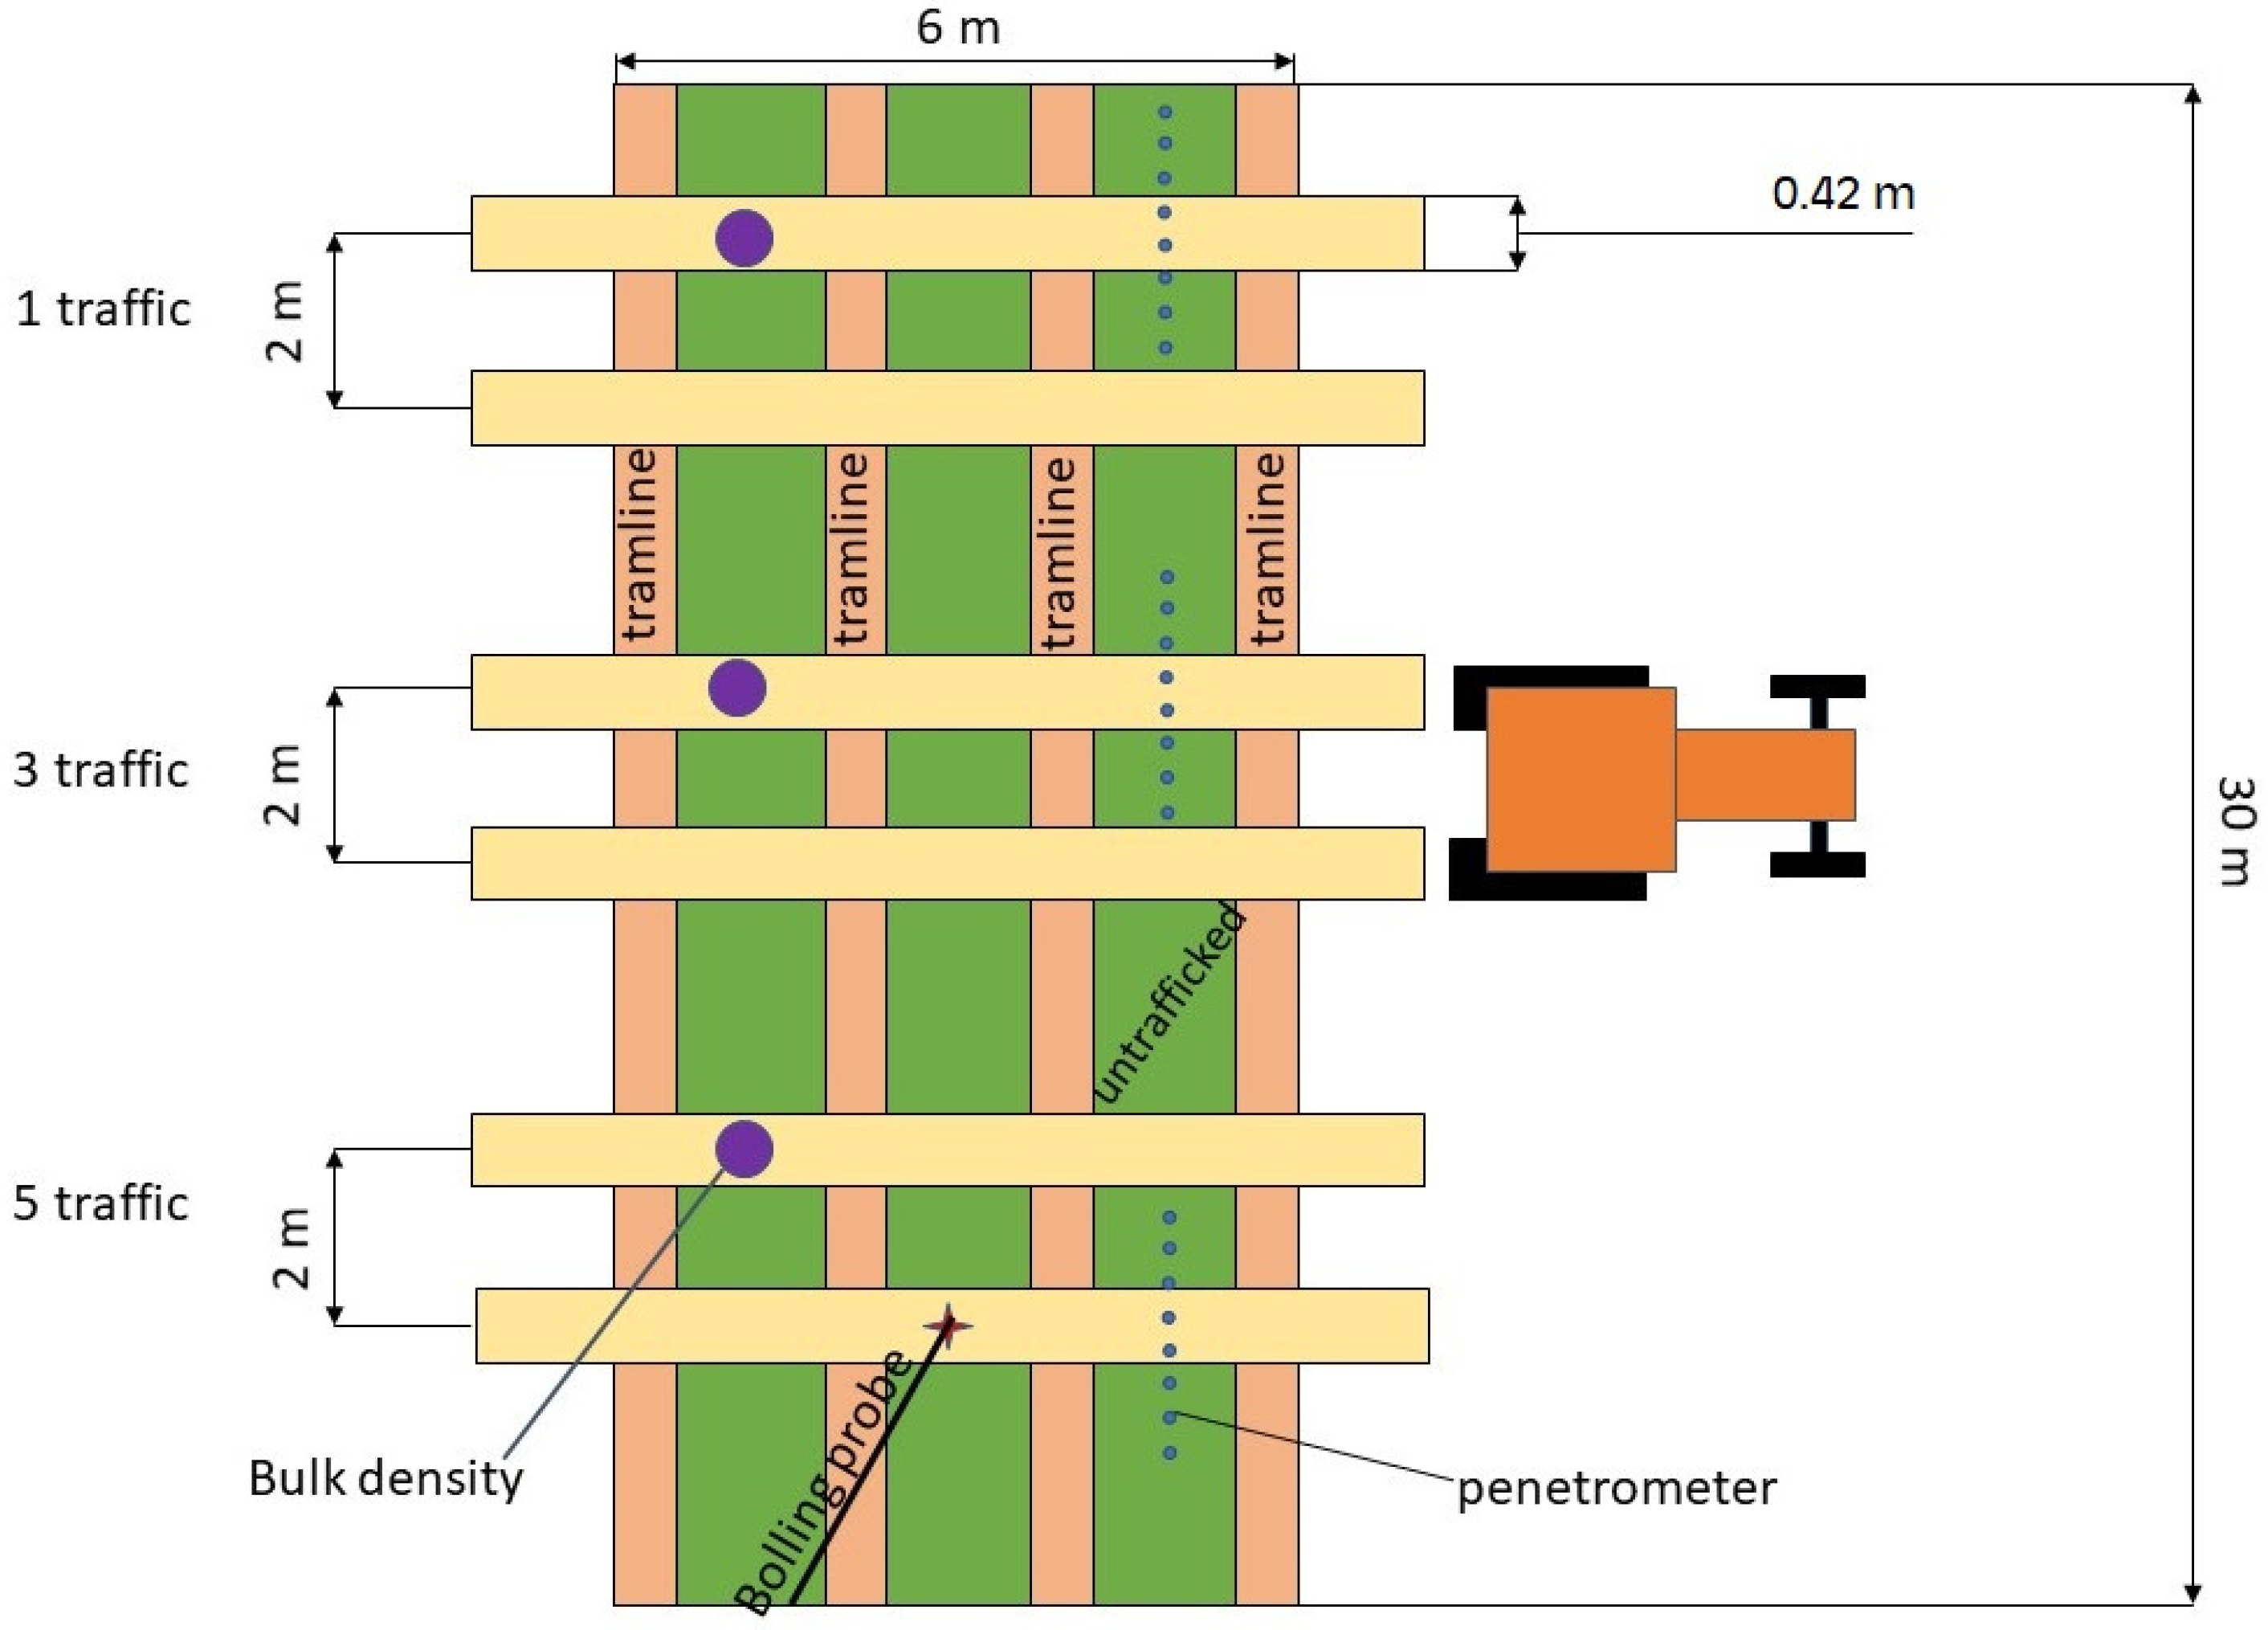
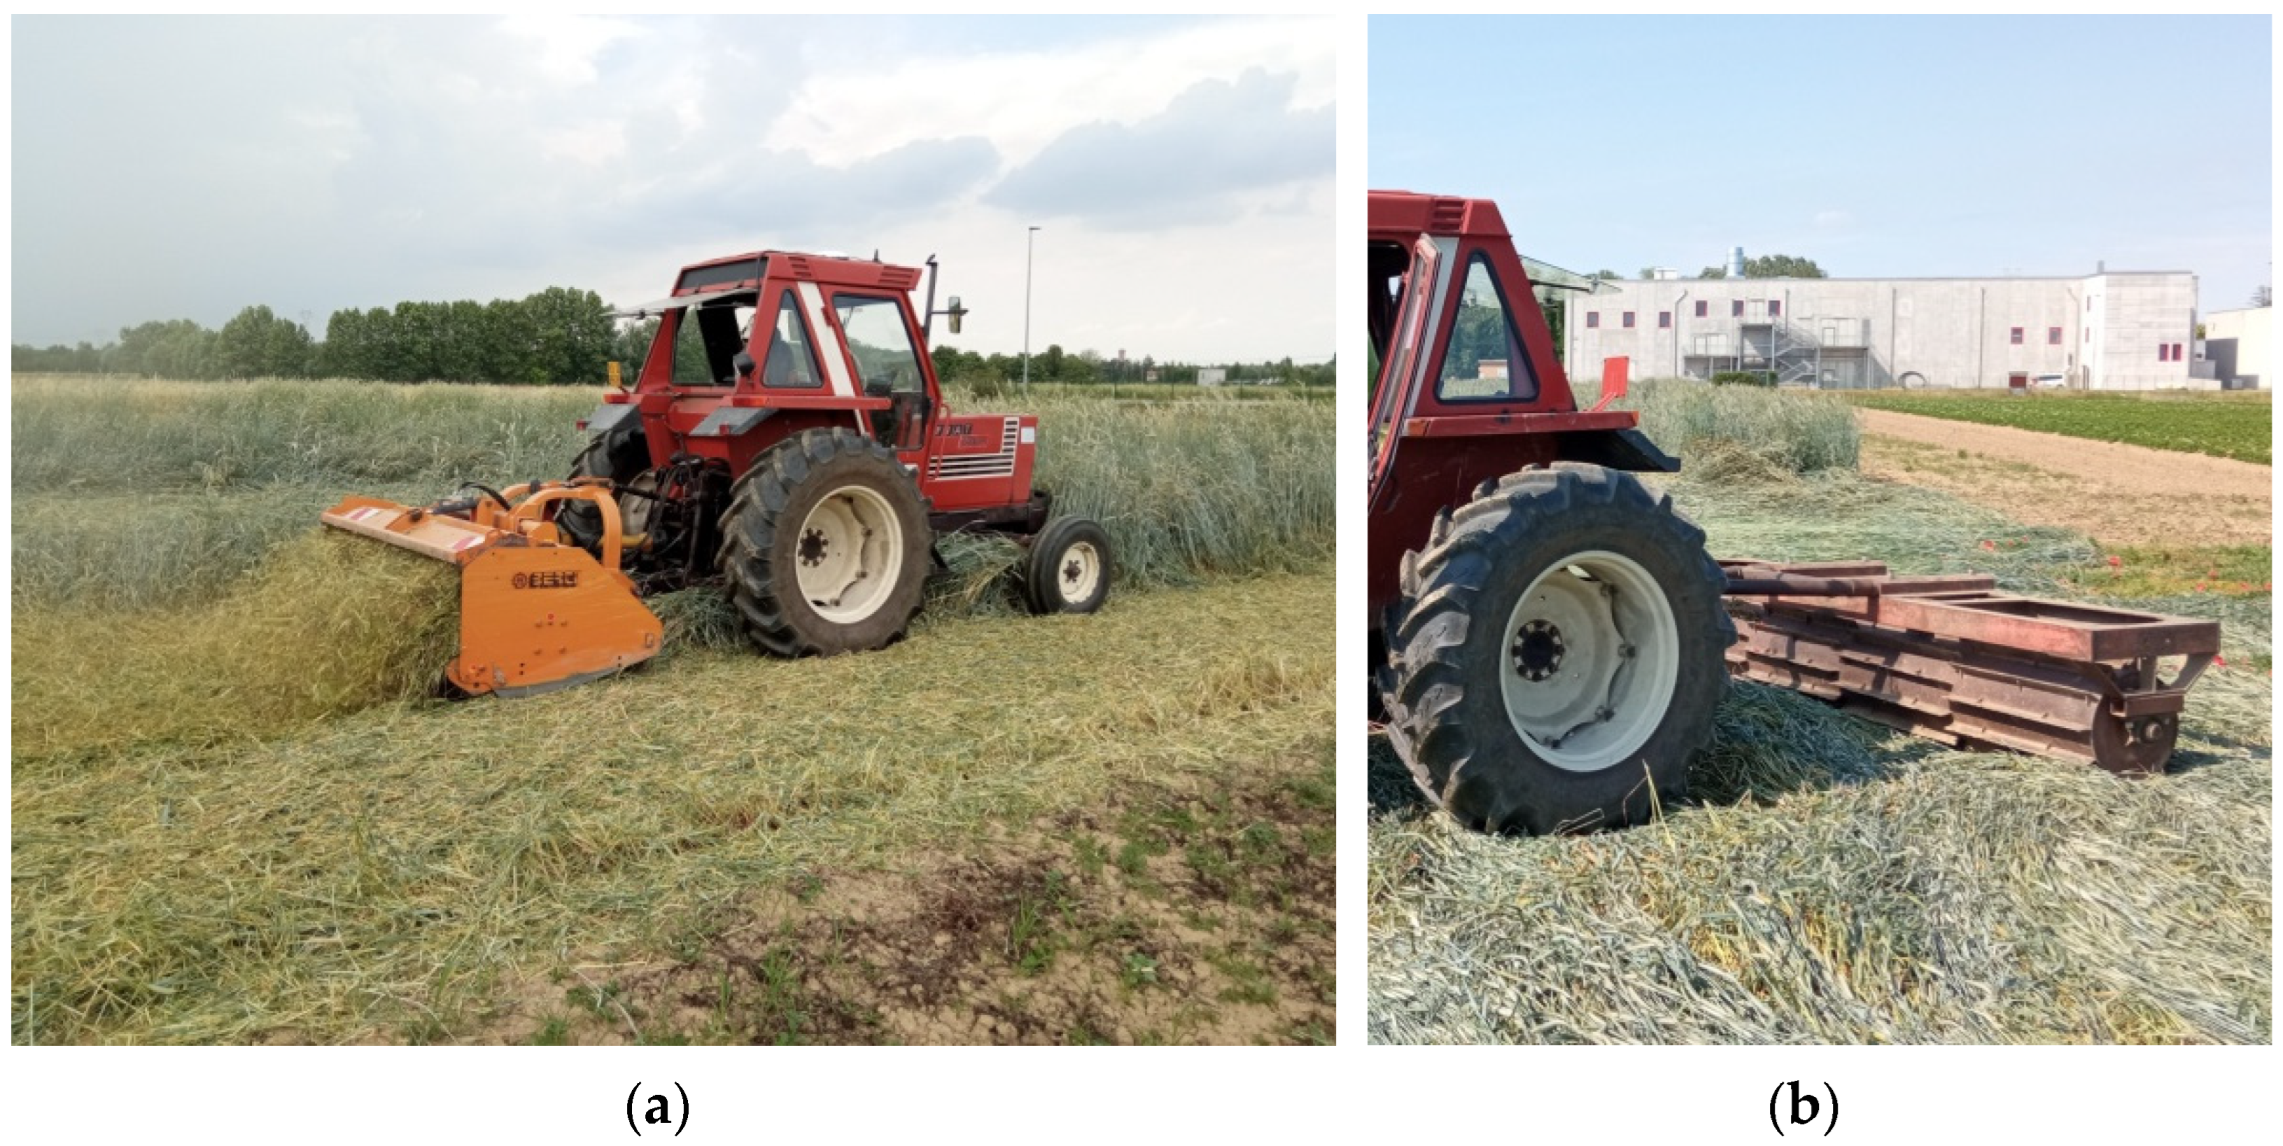
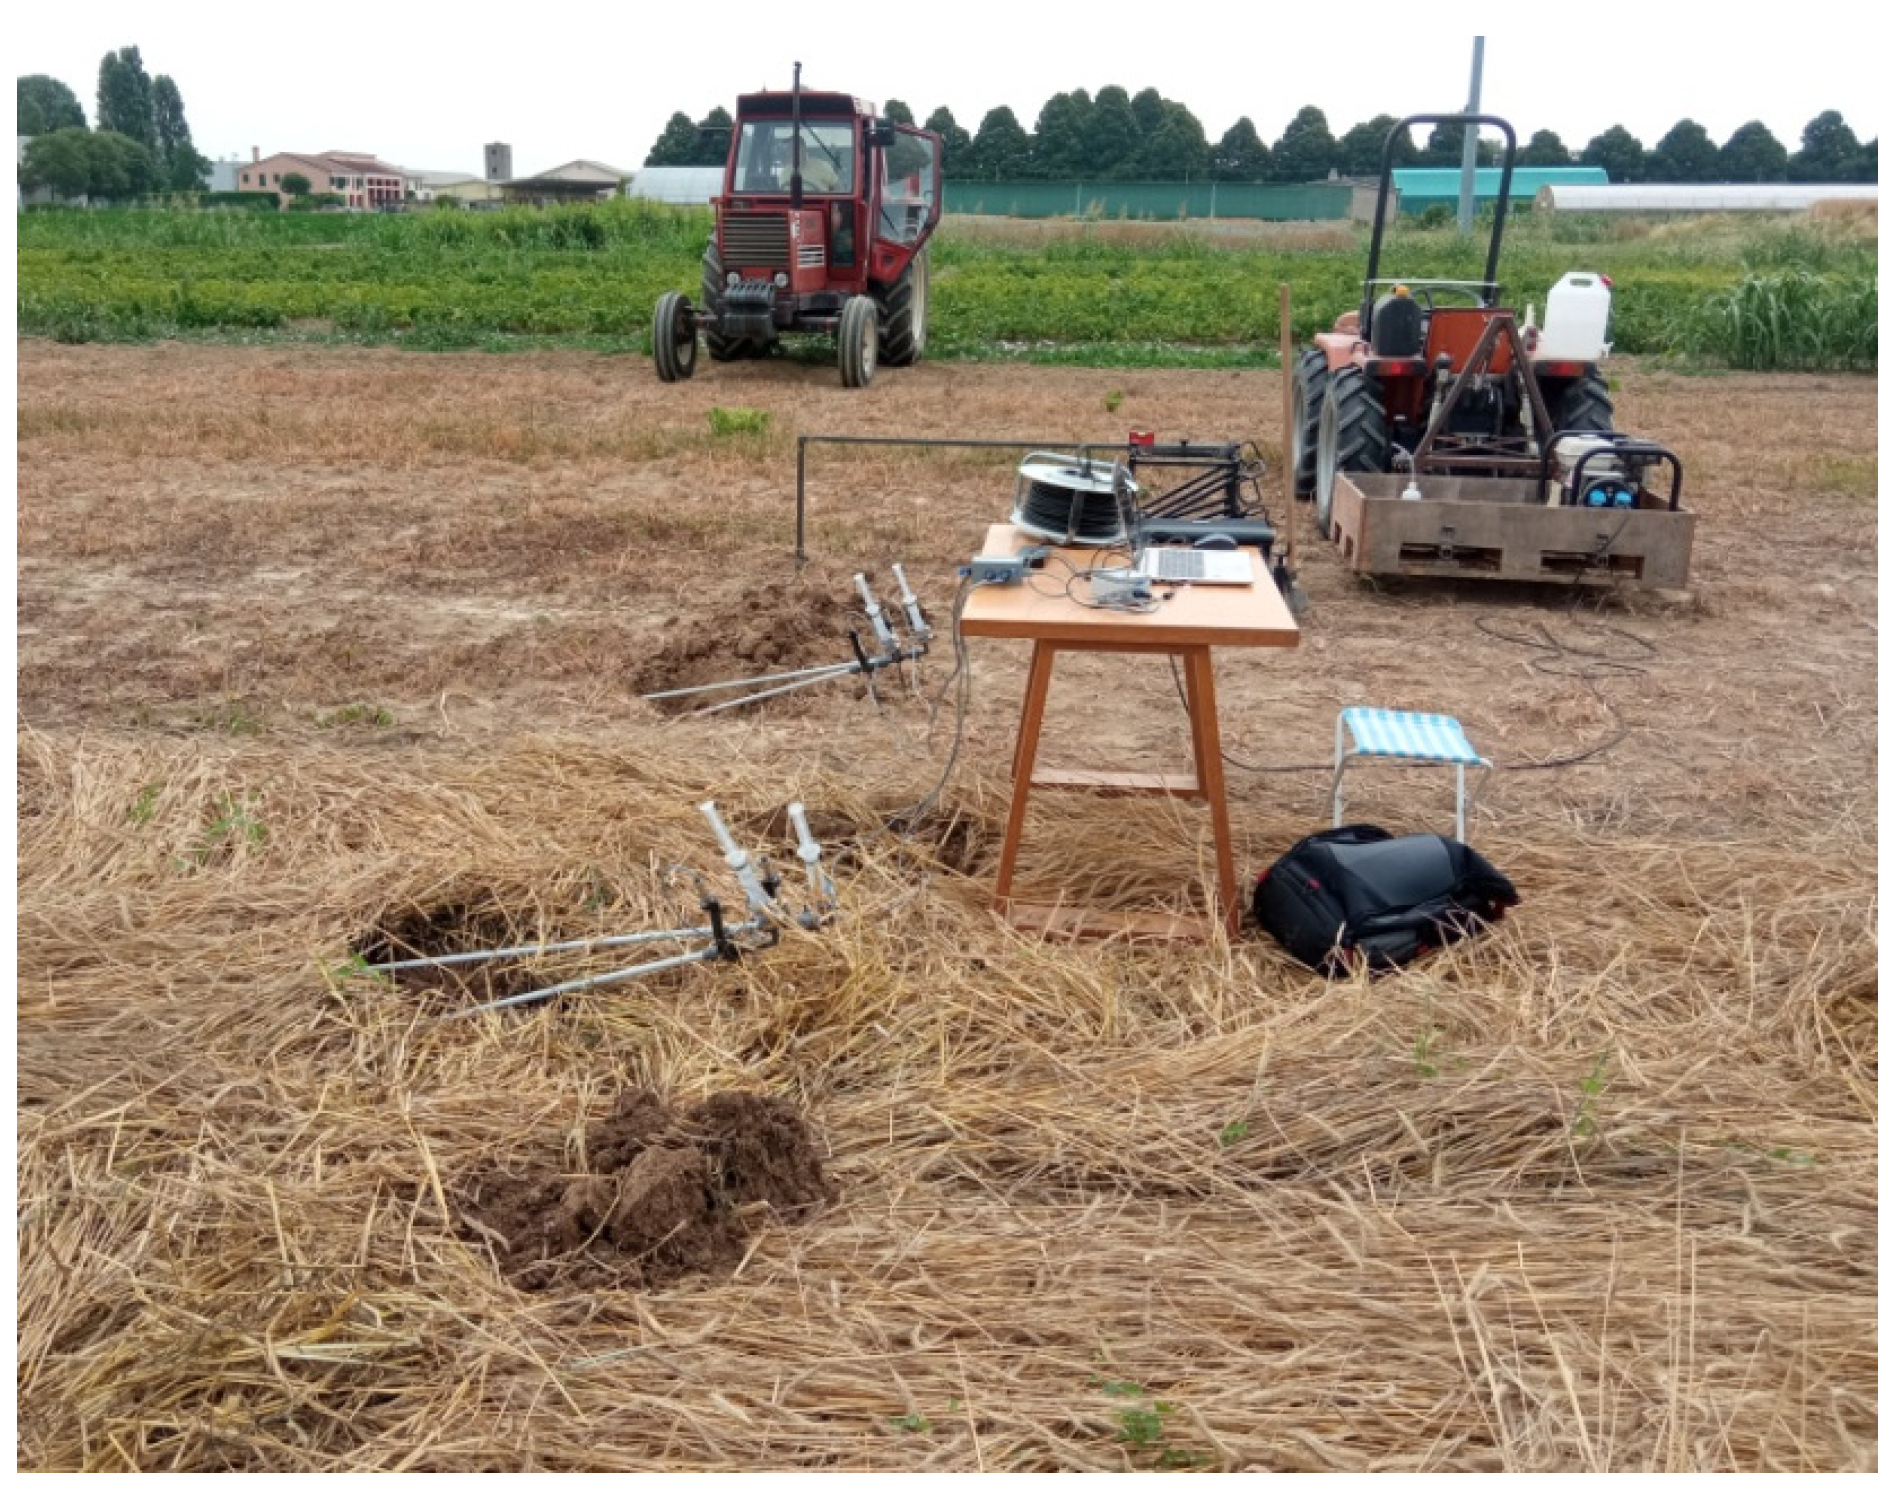
2. Materials and Methods

The field experiment was conducted on the University of Padova Experimental farm (Legnaro, Italy, 45°21′4″ N; 11°56′49″ E; 6 m a.s.l.) in 2022 (Figure 1). Temperatures rise from January (min average: −1.5 °C) to July (max average: 27.2 °C). The sub-humid climate receives approximately 850 mm of rainfall annually, with the highest average rainfall in June (100 mm) and October (90 mm). The lowest averages were recorded in January and February (50–60 mm). The soil texture of the experiment field is clay loam and was already analysed in another field experiment [13]. The soil was characterised by a 33.8% sand content, 37.0% silt and 29.2% clay. The organic matter content of the topsoil was 1.81%.
The area of the experiment was selected after preliminary soil variability analysis conducted using a high-resolution electromagnetic conductivity meter (CMD mini explorer 6 L, GF instrument, Brno, Czech Republic). Thus, a homogeneous area was selected, avoiding headlands. After this process the field was divided in plots and tilled to prepare a homogeneous seedbed. The field had a 45 cm depth ploughed on 26 October 2021 with a Bordin (Padova, Italy) double furrow plough, and all field operations were carried out following controlled traffic to avoid compaction in the sampling area. A Pegoraro (Lonigo, Italy) PTO powered rotary harrow was used for seedbed preparation, and rye (Secale cereale L.) was sown with a common Carraro row drill (Campodarsego, Italy) on 29 October 2021. Seeding rate was 165 kg ha−1 (cultivar: Antoninskie). One thousand seeds weight 23.9 g. No fertilizer was applied during the experiment. Bare soil treatments were also tilled, without sowing. On bare soil treatment, two weed controls were conducted with chemical herbicide (glyphosate 1.44 kg ha−1 each one).
Four cover crop mulch treatments were considered: roller crimper (Crimped), flail mower (Shredded), bare soil (Bare), harvested canopy (Harvested) (Figure 2 and Figure 3). The cover crop mulch was terminated with one passage of the roller crimper (Crimped treatment) or mounted flail mower (Berti Machine Agricole spa, Caldiero, Italy) (Harvested and shredded treatment) on 26 May 2022, following a random block design. The roller crimper involved in the test was built by modifying an iron smooth-roller. The roller crimper had a total mass of 880 kg and a working width of 3.3 m. The crimping action was achieved using twelve iron plates with 6 mm thickness and 60 mm height. Plates were welded orthogonally to the tangential plane of the roller surface, every 121.7 mm of circumference. The resulting external roller diameter was 585 mm. Mulch was removed by hand just before trafficking in the “Harvested” treatment. Two irrigations were applied with a hose-reel sprinkler irrigator (Irrigazione Veneta srl, Torri di Quartesolo, Italy) four days before traffic due to a drought during spring and summer 2022, the first of 50 mm and second of 15 mm.
The experimental plots were trafficked simultaneously 0, 1, 3 and 5 times at 4 km h−1, as shown in Figure 1 on the undisturbed sampling zone. The biomass samples were collected before traffic events. The soil samples were collected immediately after traffic events. The two-wheel drive tractor used for trafficking is described in Table 1.

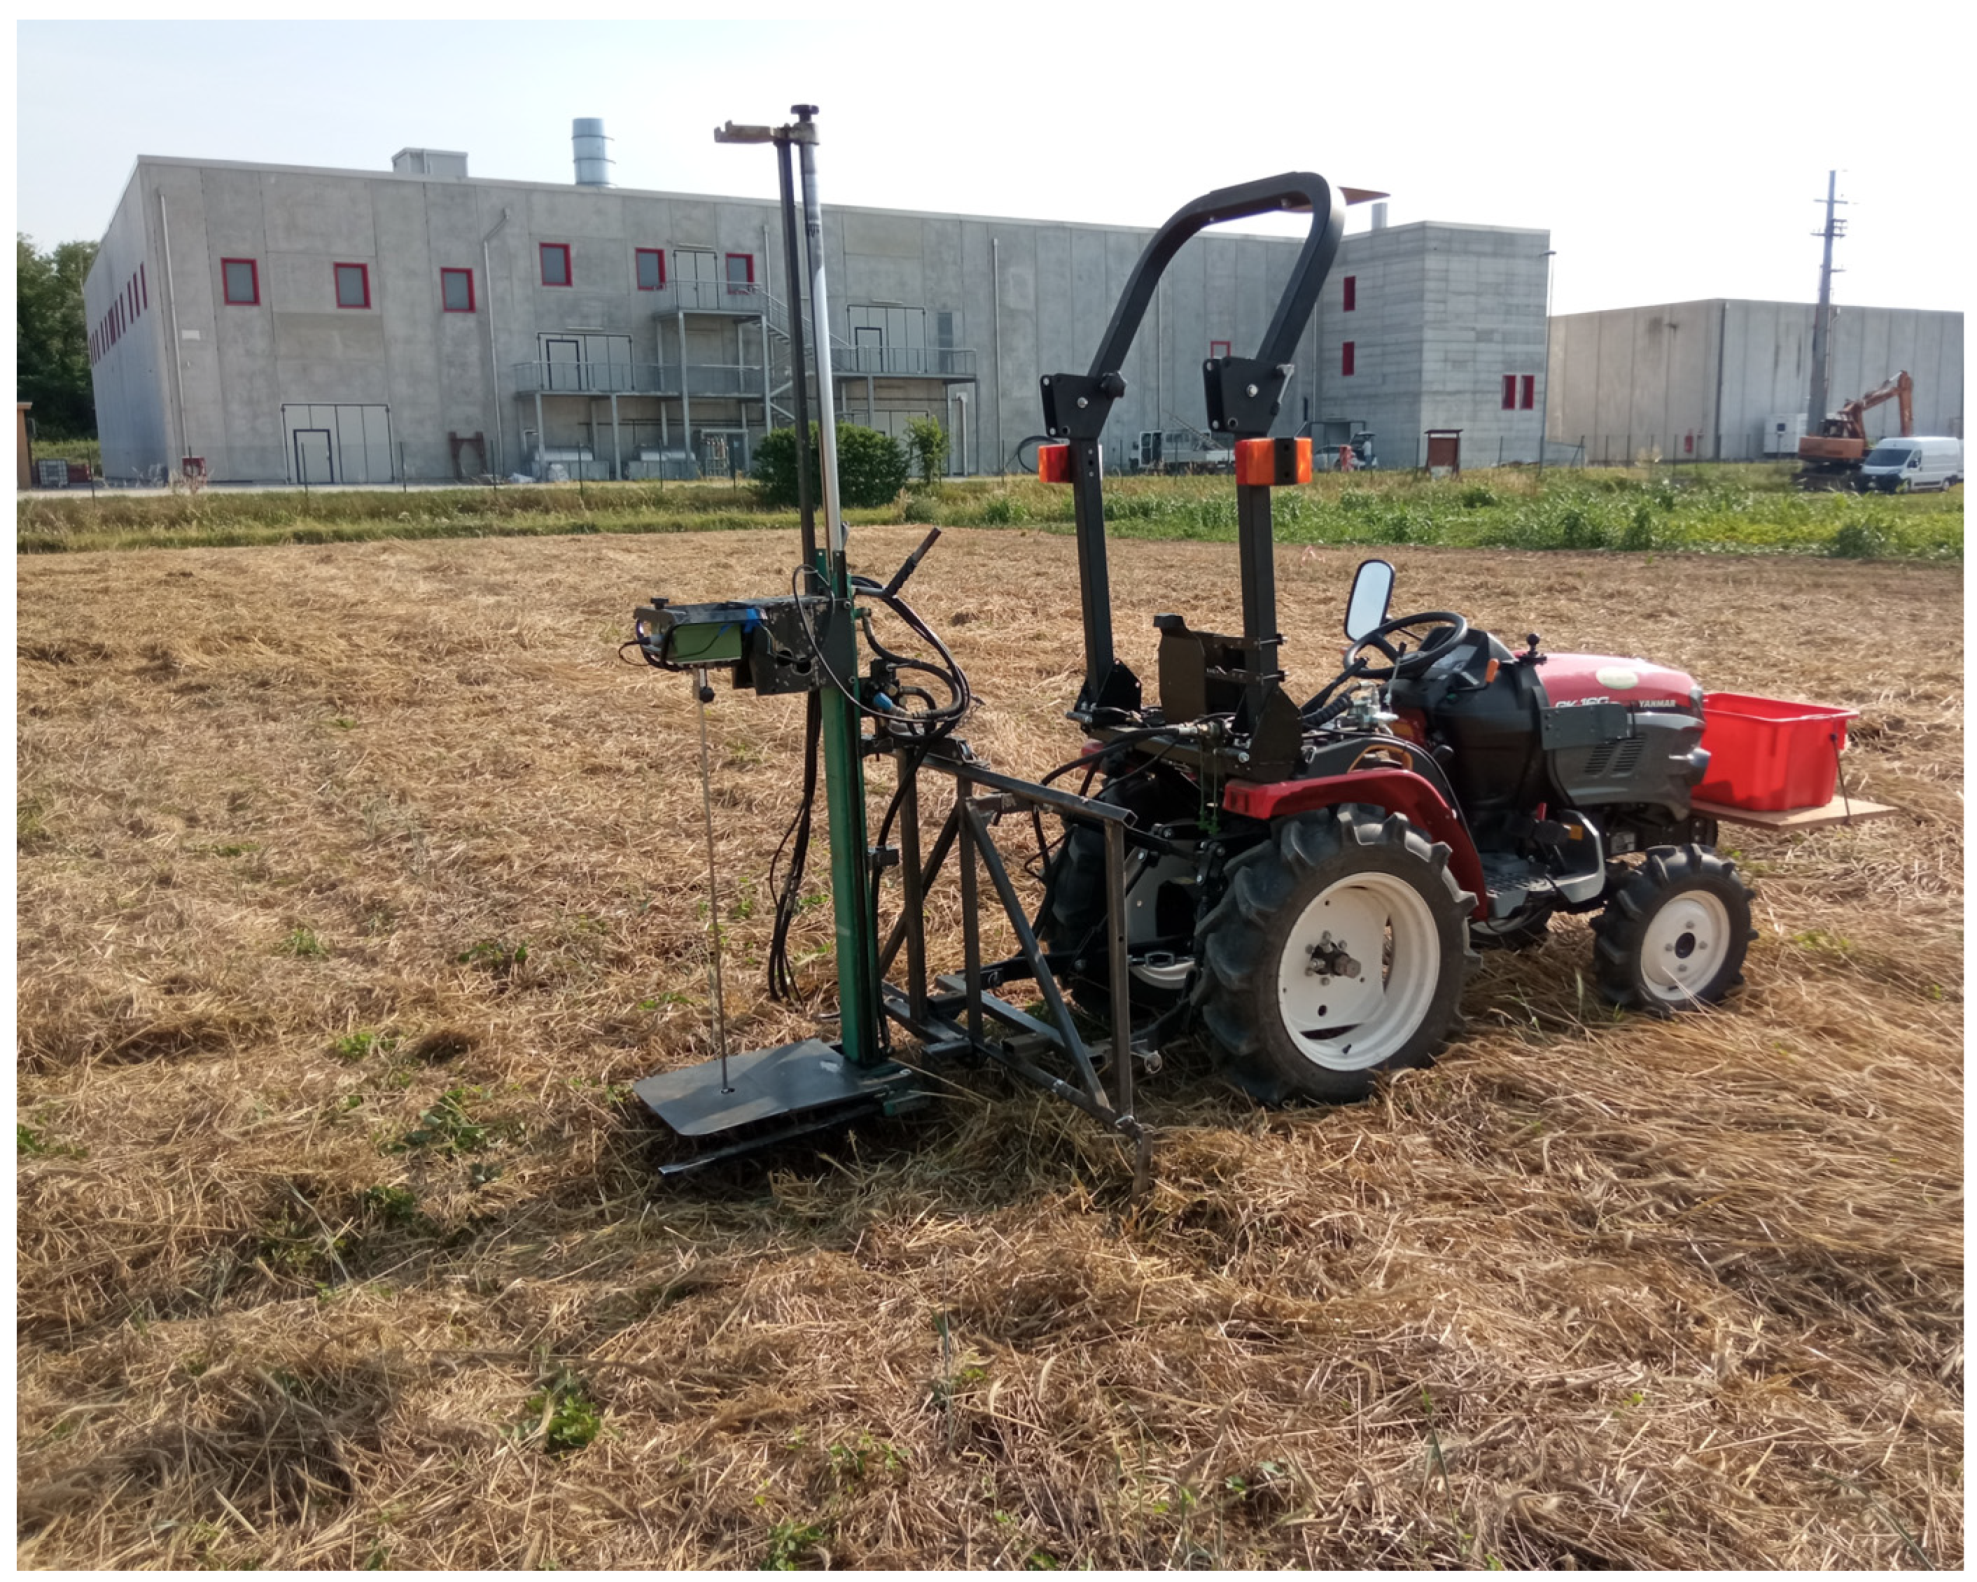
2.1. Soil Cone Index

Penetration resistance was measured with a cone penetrometer to evaluate the effect of traffic conditions on soil. The cone penetrometer (Penetrologger Eijkelkamp, Geesbek, The Netherlands) was inserted into the soil at a constant speed with a penetration rate of less than 2 cm s−1. The cone used in the penetrometer had a base diameter of 12.83 mm and cone angle of 30°, as specified in ASAE Standards S313.3 and EP 542 (ASAE Standards, 1999, 2001). The penetrometer was mounted on a designed iron frame fixed to the hydraulic piston (Figure 4). The iron frame allows the penetrometer to change the location of measurement horizontally. The hydraulic piston driven by the tractor allows for the uniform insertion speed during measurement. One transect centred on the wheel rut was performed for every level of traffic and cover crop mulch treatment for a total of 64 transects. Every transect had 15 penetration points spaced 5 cm with depth up to 60 cm. The cone index was calculated as the average of 7 centred on the rut penetration points on 4 defined depth layers: 5–15, 15–25, 25–35, 35–45 cm. After a preliminary data analysis, the deeper layer (35–45 cm depth) was not considered in the statistical analysis due to the presence of plough pan.

2.2. Rut Profile Analysis

Penetrometer data were used to analyse rut profile evolution after 0, 1, 3, 5 passages. The penetrometer was mounted on a hydraulic frame to start penetration every time from the same position. The ultrasonic depth sensor of the penetrometer allows for cone tip depth reading with a 1 cm interval. The value with zero before soil penetration was used to estimate the rut section area. Rut profile areas (cm2) were calculated using the following Equation (1):
R u t   p r o f i l e   a r e a = P d D 1
where:
Pd = distance measured with penetrometer ultrasonic sensor (cm)
D1 = distance between two penetrations (cm)

2.3. Soil Bulk Density and Soil Moisture
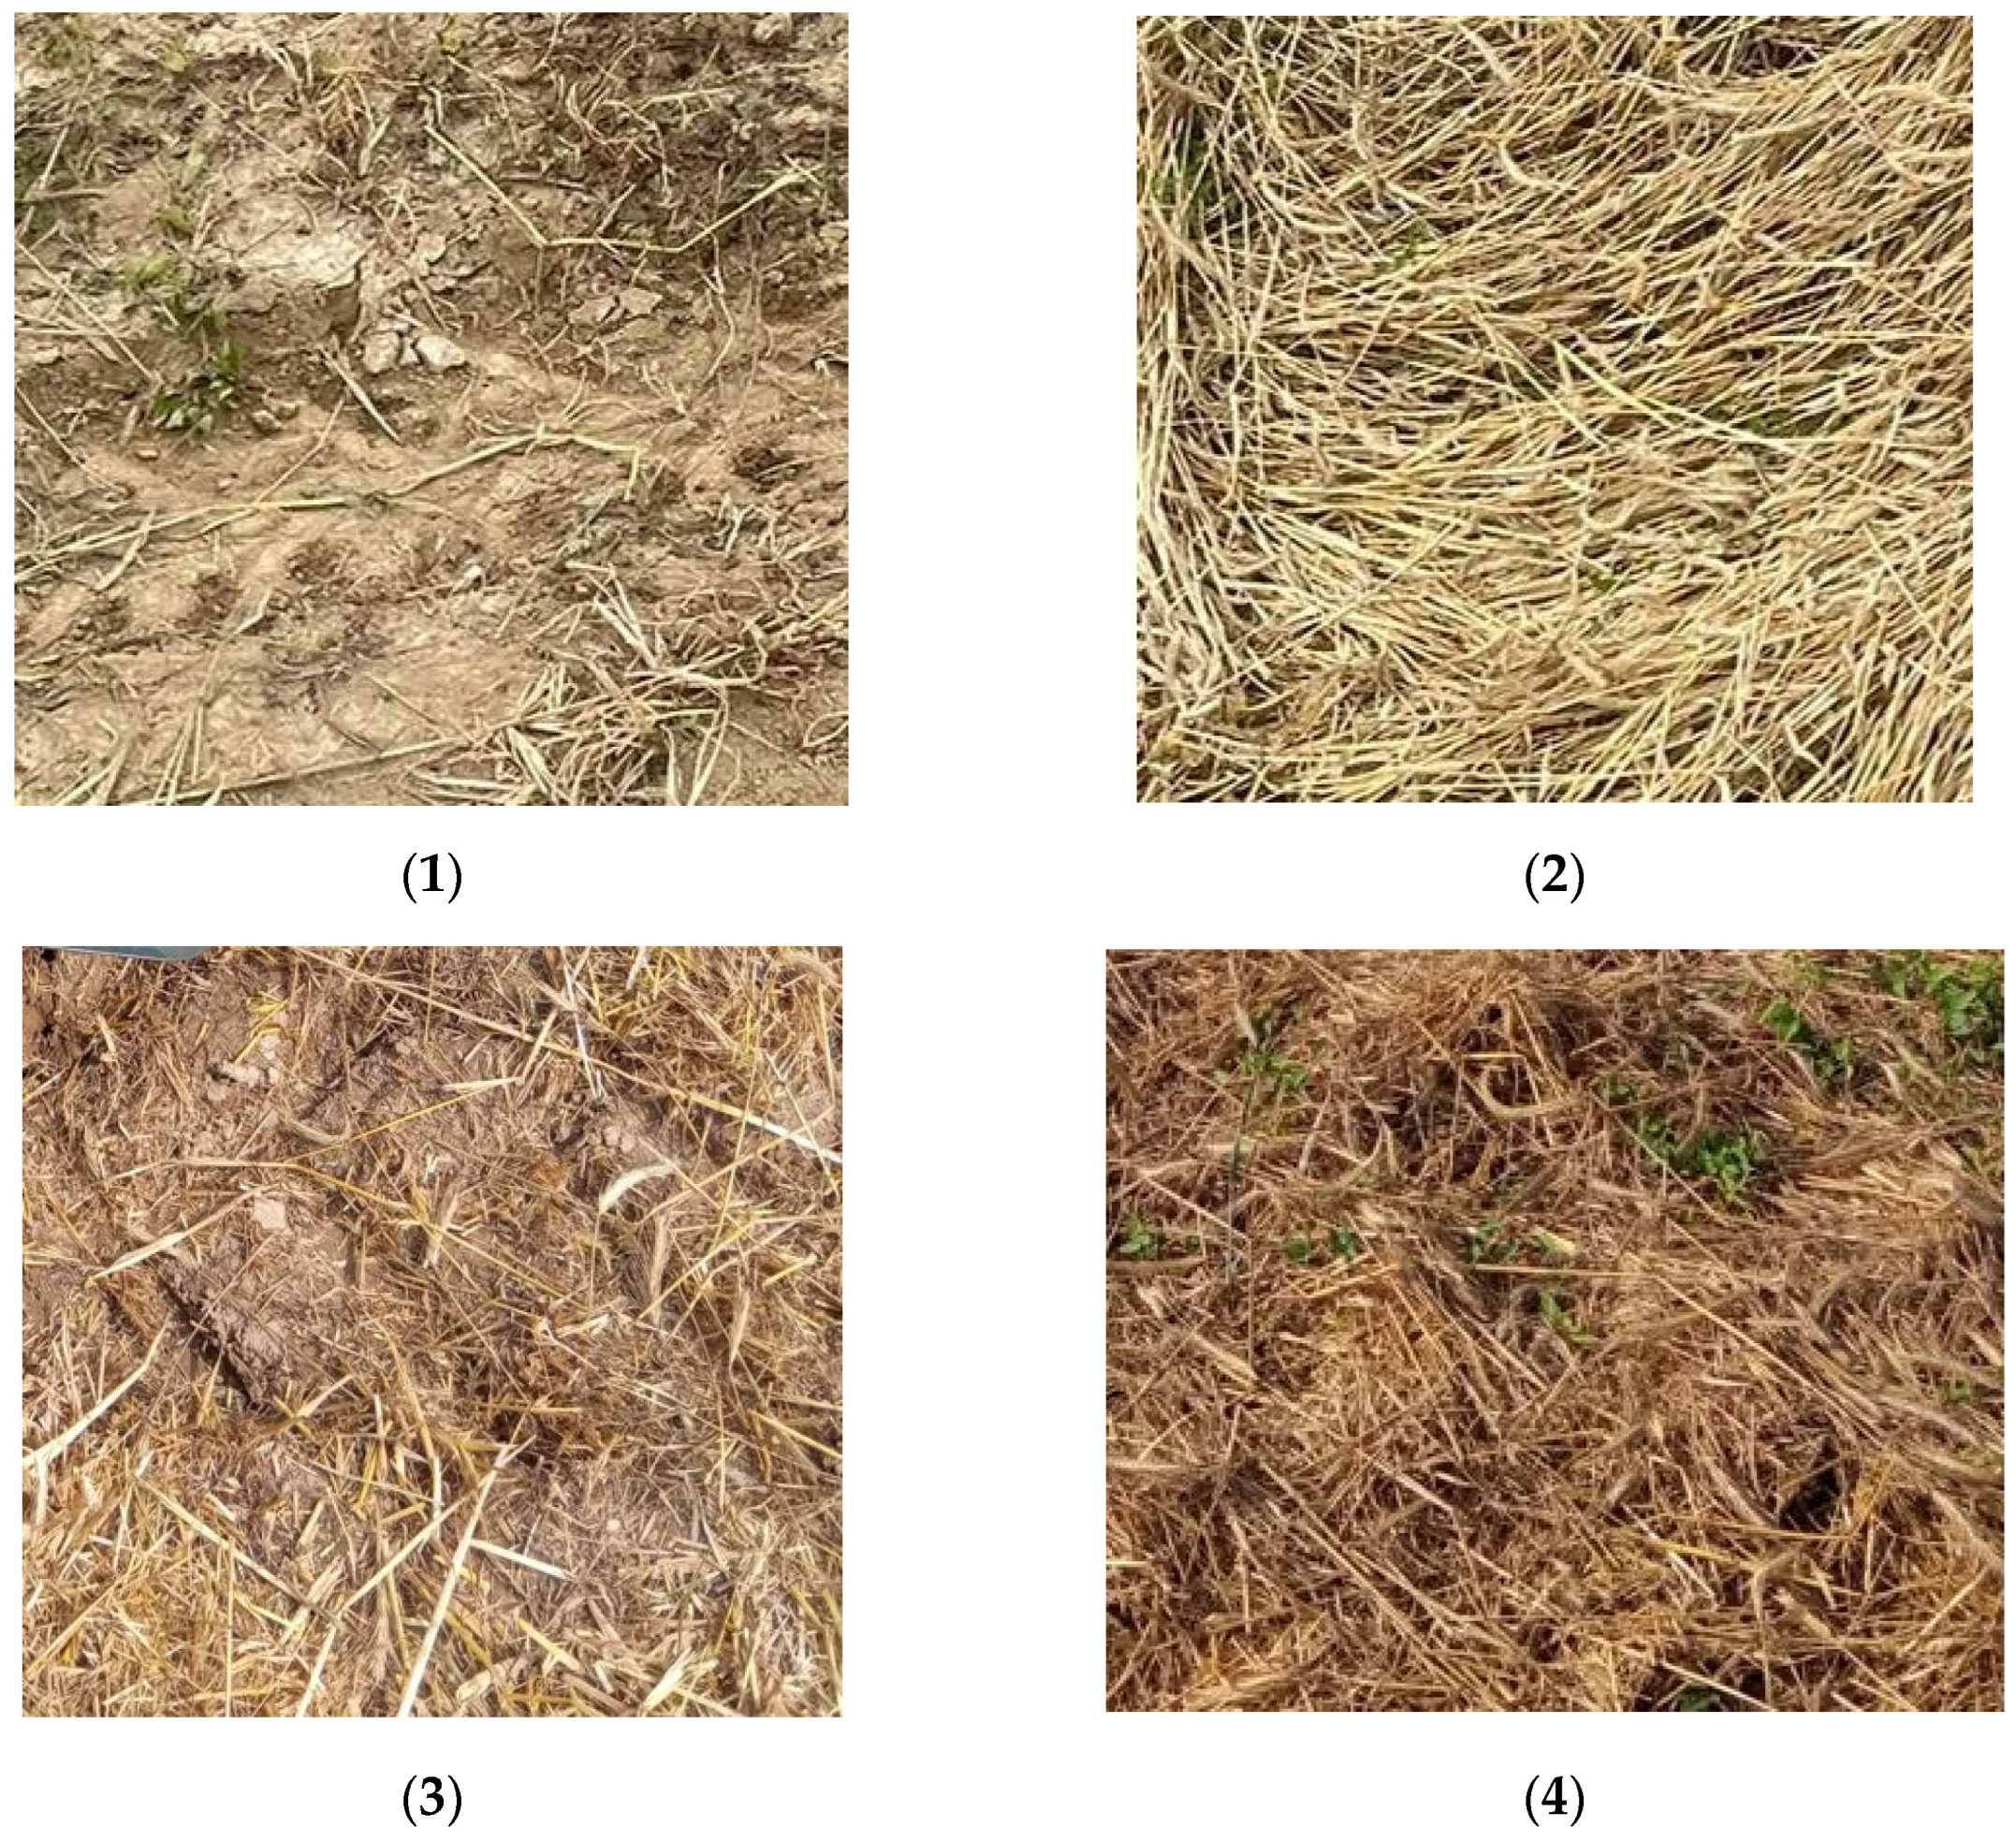
Soil samples were collected with a special hydraulic sampler up to 60 cm depth [14]. Frost storage was used to maintain samples during processing. The soil samples were divided into the following depth layers: 5–15, 15–25, 25–35, 35–45 cm. Samples were weighed and oven-dried at 105 °C until constant weight. Bulk densities (g cm−3) were calculated using the following Formula (2):
B u l k   D e n s i t y = m v
where:
m = dry mass of soil collected on undisturbed and defined volume “v” (g)
v = volume of soil sample (cm3).
The deeper layer (35–45 cm depth) was not considered in the statistical analysis due to the presence of plough pan.
Soil moistures were measured with undisturbed soil samples used to measure bulk density. Volumetric water content (%) was calculated using the following Formula (3):
V W C = 100 ( M - m ) ( d v )
where:
M = wet soil mass (g)
m= dry mass of soil collected on undisturbed and defined volume “v” (g)
d = water density (g cm−3)
v = volume of soil sample (cm3).
Additionally in this case, the deeper layer (35–45 cm depth) was not considered in the statistical analysis due to the presence of plough pan.

2.4. Biomass

Biomass samples were collected after trafficking the experimental field, using an iron wire square with 0.4 m side. Biomass was weighed and oven-dried at 105 °C until constant weight to measure dry mass and biomass moisture.

2.5. Mean Normal Stress

Mean normal stress was estimated using the Bolling probe [15,16]. The probes have a deformable cylindrical bulb and can easily be inserted in undisturbed soil at a defined depth with special installation tools. Sampling grids were created to align probe bulbs in order to define the trafficking and measuring area. Bulbs were filled with water and pressurized before trafficking. A Keller (Winterthur, Switzerland) hydraulic pressure sensor provided real time measurements. A laptop computer was connected to the sensor to monitor sampling and datalogging. Bolling probes were installed at 20 and 40 cm depths without damaging the cover crop mulch, as showed in Figure 5. Only maximum values, corresponding to the peak of rear axle traffic, were used. The first two passes were not considered during data analysis to avoid unreliable data due to soil deformation around the bulb zones. The pressure data under different depths were collected after each time compaction (five times in total; only the last three were considered in the analysis).
Mean normal stress σ m was calculated [15,16] from Bolling probe pressure data in order to compare the results in different cover crop mulch treatments. The following is the calculation Formula (4) of the mean normal stress (kPa):
σ m = 1 + v 3 ( 1 - v ) p i
where:
p i is the measured stress from the Bolling probe (kPa)
v is the Poisson ratio in the soil matrix
The value of the Poisson ratio for soils is usually between 0.20 and 0.45 [17,18,19,20,21]. We set the Poisson ratio as 0.3 in our study using data available from previous studies [16,19].

2.6. Statistics

The trials were arranged in a randomized block design. In each of the 4 blocks, all the 4 considered cover crop management strategies were tested, in randomized order, as fixed effect factors. The number of transits and depths of measurement were further introduced in the model as random factors. Data were treated with an analysis of variance (ANOVA) model considering the main effects of the 3 tested factors, their interactions, and the experimental blocks. The chosen significant threshold was p < 0.05. The Tukey HSD was chosen as the post hoc test.

3. Results

The statistical significance of the results obtained in the experiment are summarized in Table 2.

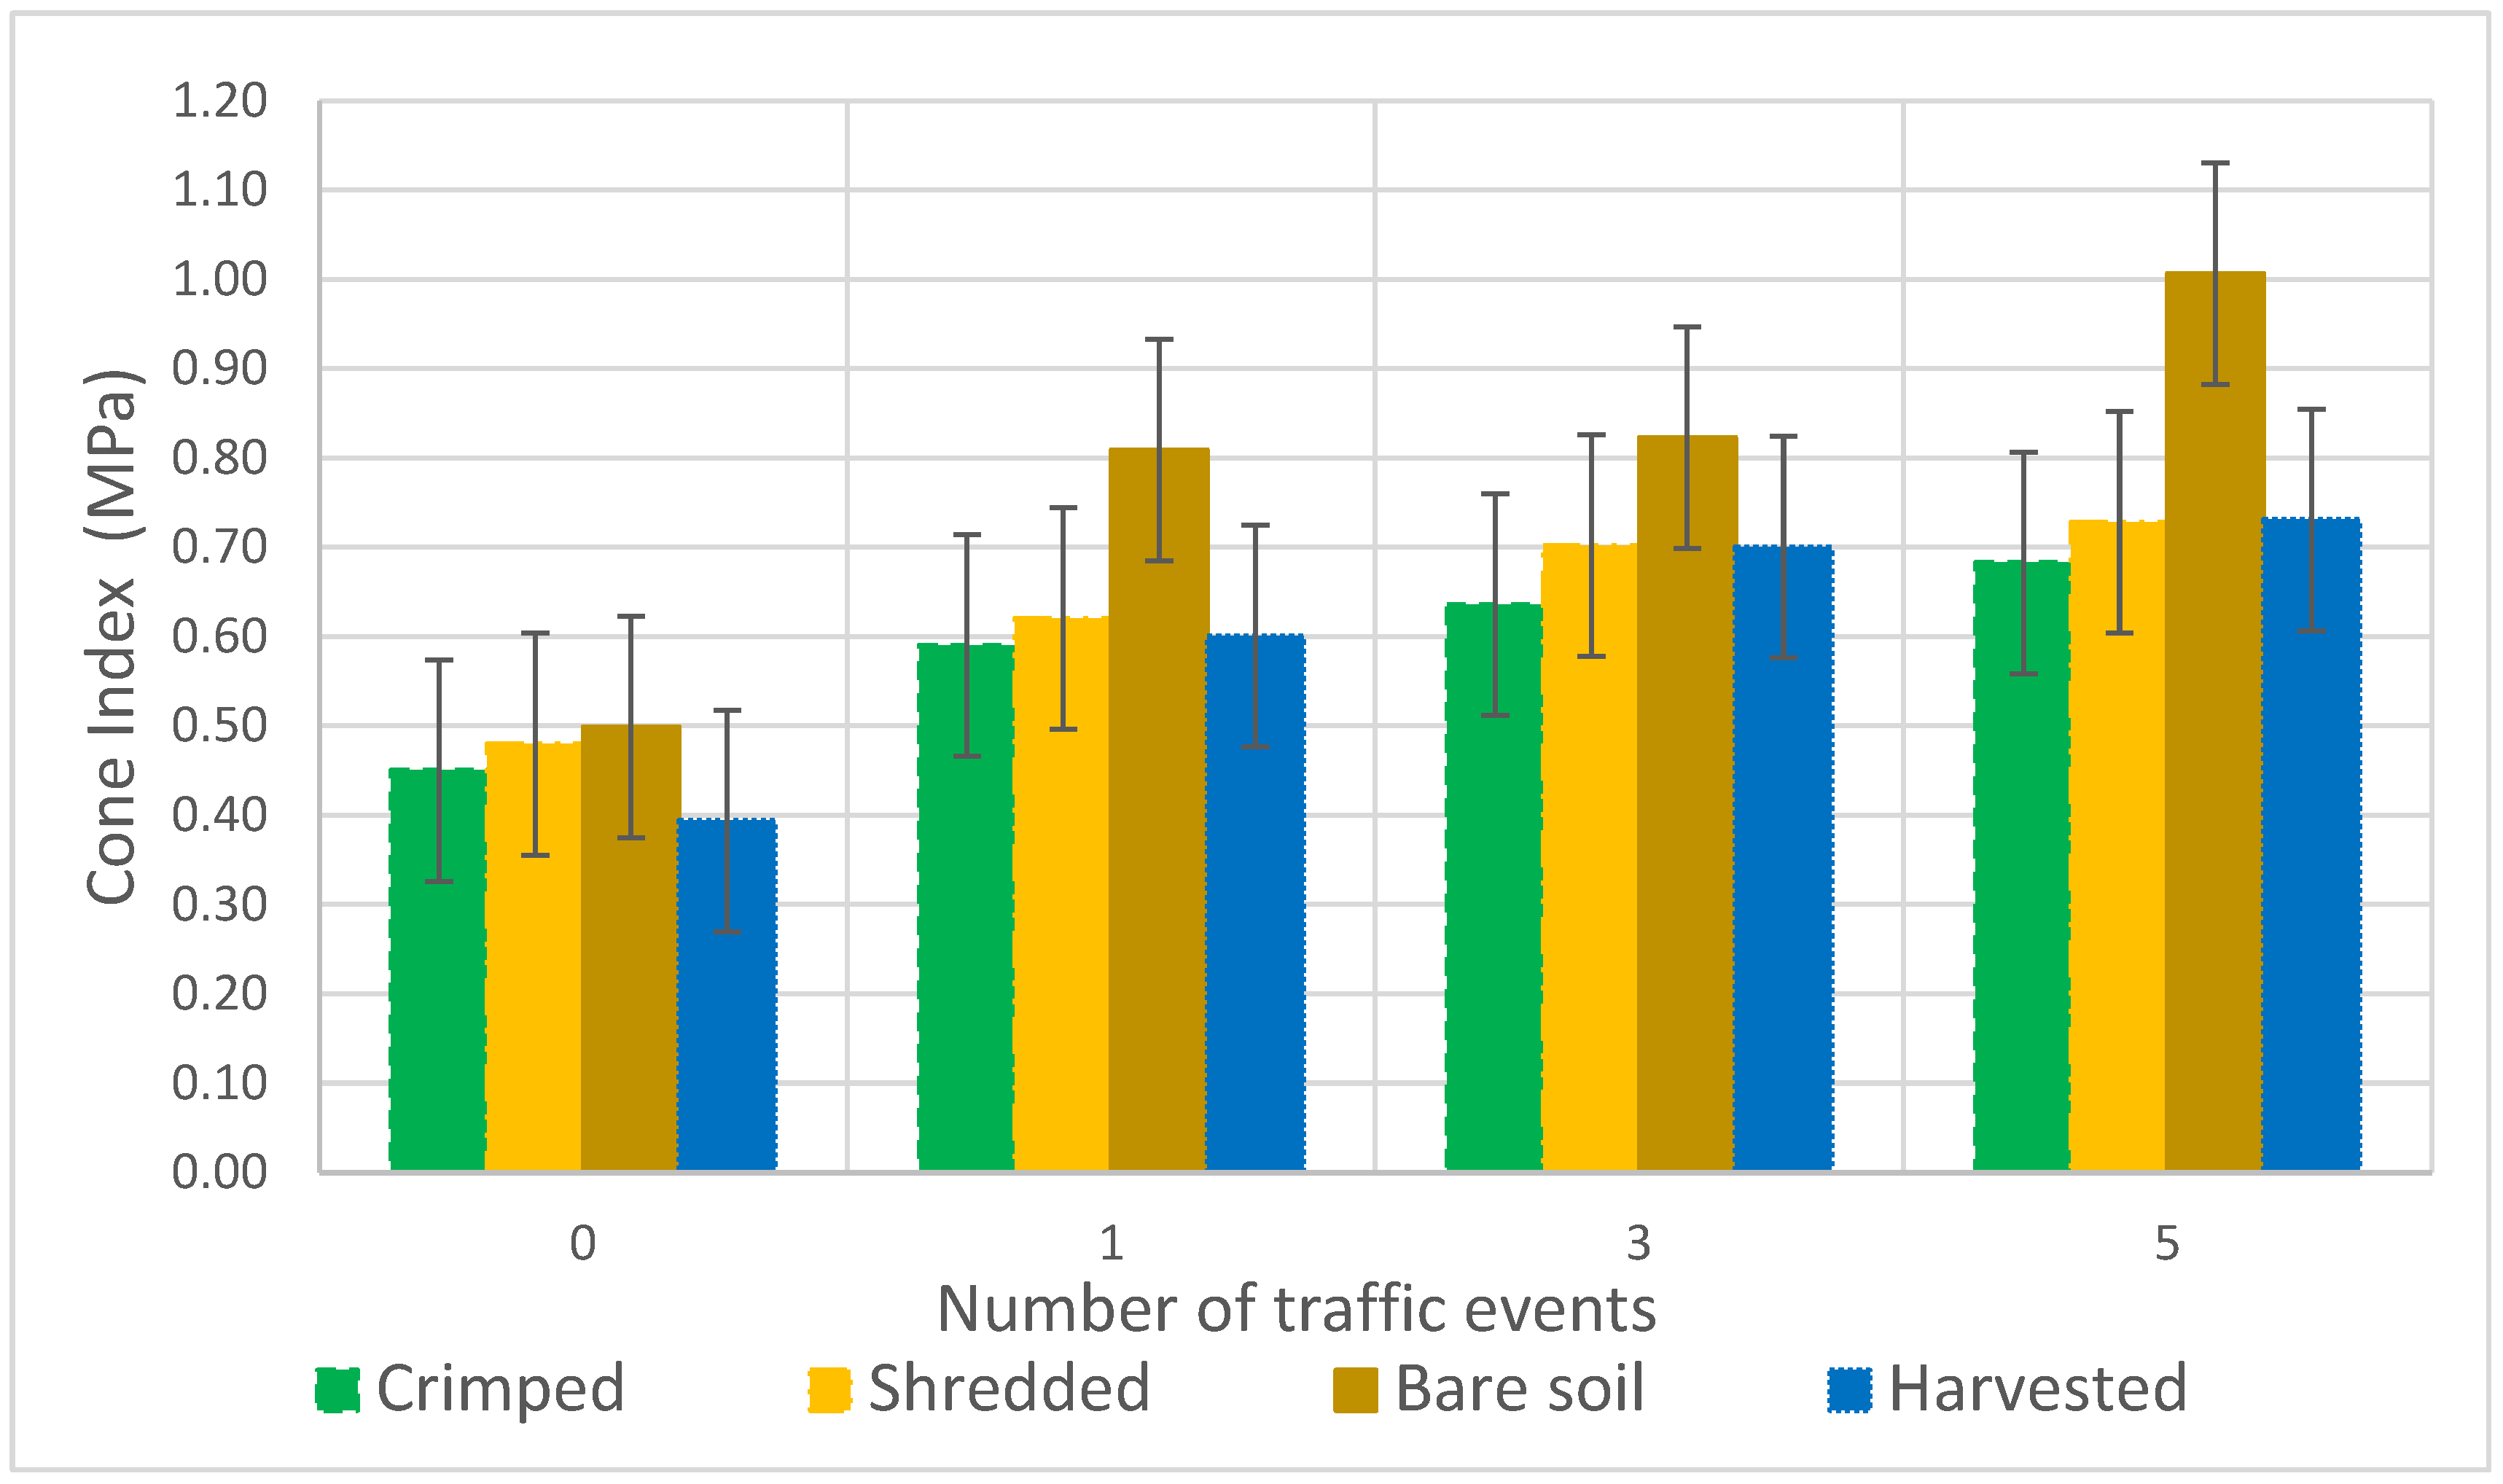
3.1. Soil Cone Index

The results of the statistical analysis of the data from the soil cone index obtained in the four compared treatments after different passages of the tractor are shown in Figure 6.
Because the soil was undisturbed, no differences between mulch treatment were found at the zero traffic event. After the first tractor transit, the CI of bare soils becomes statistically significantly higher in comparison to the treatments involving cover crops. Specifically, Bare results in a 19.33% higher CI compared to Shredded. The increasing penetration resistance is higher after the first traffic event, but with a residues effect that resulted in an increase of 62% on Bare and 53% on Harvested compared to an increase of 31% on Crimped and 29% on shredded. The other traffic events recorded a lower increase in penetration resistance. Bare also had higher values after the following traffic events. Harvested treatment showed no significant difference from the other cover-cropped treatments Crimped and Shredded. However, the study of the interaction with traffic highlights that this difference is statistically significant only in the first and fifth traffic events. Differences were also found in the third traffic event, but without statistical significance. Traffic effects show differences between the fifth and other traffic intensities and between zero and other traffic intensities only. No differences were found between the first and third traffic events (Figure 6).

3.2. Rut Profile Analysis

Rut profile analysis showed statistically significant differences between Shredded and Harvested-Bare mulch treatments. Bare and Harvested resulted in the higher rut profile area compared to the other treatments. Significant differences were also found between traffic treatments, as shown in Table 3. The increase in the number of traffic events was followed by an increase in the rut profile area. No interaction effect was found among the cover crop mulch treatments and number of traffic events.

3.3. Soil Bulk Density and Soil Moisture

The results of the statistical analysis of bulk density data obtained in the four compared treatments after each passage of the tractor are shown in Figure 7.
Bulk density increased significantly until the third traffic event. Zero traffic was statistically lower than other traffic events. One traffic event was statistically higher than the zero traffic event, but was statistically lower than three or more traffic intensities. No differences were found between the third and fifth passages. Cover crop mulch treatment was characterized by significantly lower bulk density on bare soil treatment compared to Harvested and Shredded. Crimped mulch treatment cannot be considered statistically different from the other mulch treatments. Statistically higher BD values were found on removed mulch treatment (Harvested) after the first and third passages in comparison with the other treatments when considering the interaction effect between traffic and cover crop mulch treatments. Moreover, BD also did not show differences between mulch treatment at zero and five traffic events. Statistical analysis also showed differences in bulk density in the soil layers between 5 and 15 cm depth and 15 and 25 cm depth. No differences were found between the deeper layer and the other layers.
Volumetric soil water content did not show any statistical difference at the different depths where it was analyzed. Interaction effects between traffic and mulch treatment were not detected during statistical analysis. Harvested and Shredded treatments resulted in significantly higher water content in comparison to Bare and Crimped treatments. No differences were found between Harvested and Shredded, nor between Bare and Crimped. Only zero traffic was significantly lower than the other traffic events. No differences in water content were found between the first, third and fifth passages. Removed mulch treatment (Harvested) showed a higher level of moisture at every traffic intensity.

3.4. Biomass

The results of the statistical analysis of mulch dry biomass are shown in Table 4.
Significant differences were found between the covered treatments (Crimped and Shredded) and not-covered treatments (Harvested and Bare). There were no statistical differences found between covered and not covered. Crimped treatment showed higher variability, probably caused by early bedding of cereal rye in a random position before crimping.

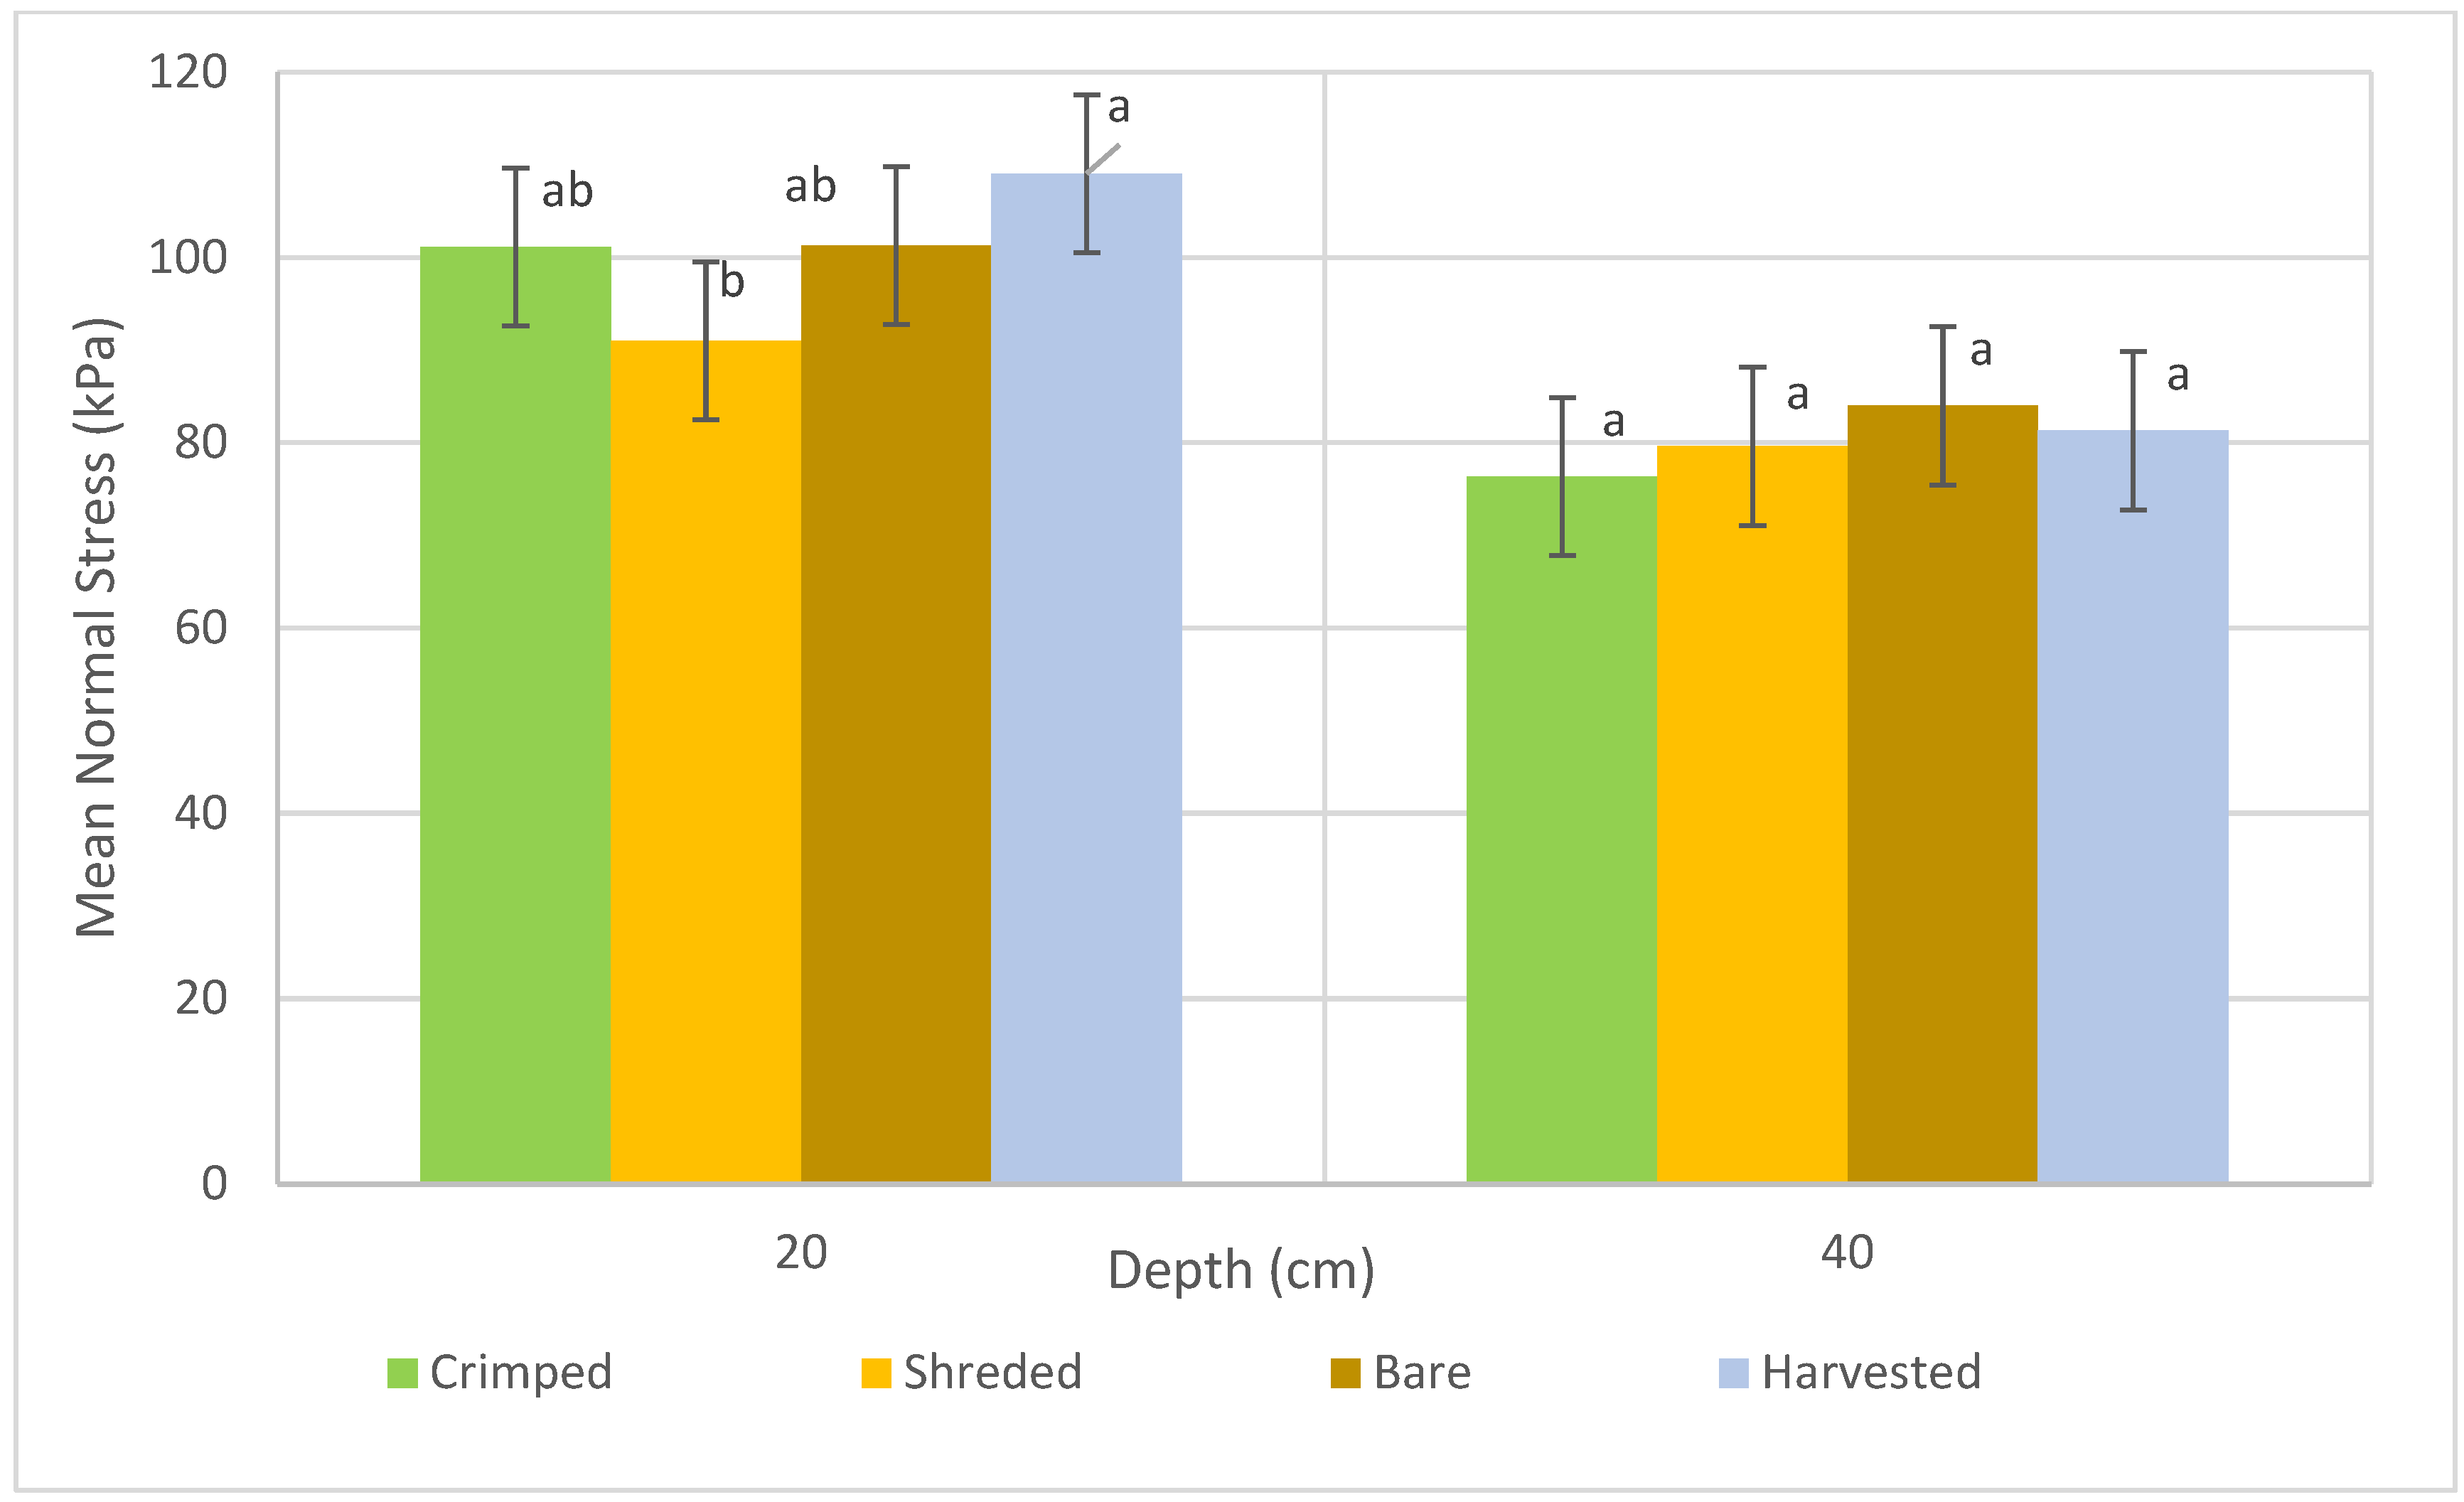
3.5. Mean Normal Stress

The results of the statistical analysis of soil mean normal stress determined at 20 and 40 cm obtained in the four compared treatments after each passage of the tractor are shown in Figure 8.
Significant differences were found between 20 and 40 cm depth mean normal stress. No statistical differences were found between treatment at 40 cm depth; only Harvested and Shredded can be considered different with p < 0.05. Strong variability was found in treatment Crimped at 20 cm depth, probably due to the spatial variability of rye biomass distribution caused by early crop bedding, before roller crimper passage. This effect could be mitigated by the flail mower action in treatment Shredded, resulting in less variability of stress data.

4. Discussion

4.1. Effect of Cover Crop Mulch

The effect of cover crop mulch on soil compaction could be divided into three different actions:
First, the cover crop presence, growth and termination method affect soil moisture. The higher volumetric water content found in treatment (Harvested, Shredded) can be explained by the increased water retention gained through cover crop root penetration, while their exudates improved soil pore stability, which was consistent with the study by Angers and Caron [22]. In contrast to our initial hypothesis, Crimped treatment shows low volumetric water content in comparison to other mulched treatments, probably due to incomplete termination immediately after crimping. The cover crop died slowly in the days after crimping and, in the meantime, water transpiration from the soil continued, as established in previous research [23]. This phenomenon probably did not happen in Harvested and Shredded treatments where termination was achieved with a flail mower. This tool causes the immediate death of the plant by cutting and shredding the stem, decreasing soil moisture loss. Furthermore, we hypothesized that the lower variability found on Shredded treatment mulch biomass was explained by the spreading effect of the flail mower compared to Crimped treatment. The rolling action during crimping, on Crimped treatment, probably did not modify the biomass distribution, maintaining the mulch rooted to the ground
Second, the root exudation and exploration change soil structure. The higher cone index on bare soil could be explained by the lack of cover crop root growing action, which stabilizes soil aggregates, mitigating the internal slaking of soil structure [24,25,26]. The internal slaking and the wetting and drying cycle cause the formation of a surface crust that could increase the susceptibility to soil compaction [25], resulting in increased penetration resistance, as observed in zero traffic; there was no difference in the cone index between all treatments, and there was an increase in the cone index in “Bare” after the traffic events. Indeed, the Bare treatment did not have a different soil moisture level compared to Crimped, but did record a higher cone index. The higher cone index in Bare could explain the slower increasing in bulk density compared to the cover cropped treatment, due to the phenomena described above.
Third are the surface residues. Indeed, “Shredded” resulted in 16.54% lower mean normal stress compared to “Harvested” treatment, and this finding could be explained by the surface residues effects. Moreover, this residues effects result was higher than a previous experiment on the effect of residues on soil compaction [10]. The differences recorded between “Shredded” and “Crimped” treatments suggest a different behaviour of the two cover crop termination methods considered in this experiment. This effect can be also divided to obtain a deep analysis on the direct residues effects on force transfer during traffic and on the effect of the termination method on soil bearing capacity, as analysed in the previous point. In this experiment, the strong variability found in “Crimped” limited the analysis of the residues effect.
All of this action at different magnitudes affects the soil compaction, but the main effects could be considered the change in soil structure. This could be explained by bulk density results during traffic events. Indeed, treatment with higher moisture content resulted in higher bulk density because higher soil moisture content increased the risk of soil compaction. The significant—but lower—difference in soil moisture (<3%) could only partially explain the difference with lower moisture Bare treatment because the Crimped treatment without different VWC from B is not different from the other mulching treatments. The secondary action of the residues could also be explained by the same results. In fact, the Shredded treatment did not have a different bulk density from Harvested, despite the significant decreasing in mean soil stress measured and compared to Harvested treatment. Moreover, no additive effects were measured on Crimped treatment, where both enhanced conditions, low water content and residue mulch can be found.

4.2. Effect of Repeated Traffic

All of the soil analyses highlight an increased susceptibility to soil compaction during multiple trafficking, especially comparing all the trafficked treatments with the zero traffic event. The VWC at zero traffic was significantly lower than after the other traffic events, probably due to a concentration effect caused by the loss of air-filled macroporosity. Moreover, the cone index had an average increase of 30.41% after the first traffic event and of 9.11% between the third and fifth traffic events. The rut profile area increased about 9.11% on the first wheeling and maintained a constant average increase of 8.86% for every traffic treatment. Cone index and rut profile analysis showed no difference between the first and third passages. Otherwise, bulk density significantly increased (7.21%) between zero and one passages and also between one and three traffic events (2.95%). These findings were aligned to the result obtained in other studies [27,28,29]. The repeated traffic effect on soil compaction was more relevant after five traffic events and less influenced by the residues effect. Indeed, no differences were found between different mulch treatments on soil bulk density after five traffic events.

5. Conclusions

Cover crop mulch can, in some cases, dissipate part of the machine load during traffic, but this effect could already be negligible with 4 Mg of tractor traffic. The residues effect changes with cover crop termination methods and affects soil susceptibility to compaction in different ways and magnitudes, first on soil water content. The use of a roller crimper could cause a slow cover crop termination that seems to determine an increase in the amount of water used by the cover crop during its life cycle and a decrease in soil water availability. Furthermore, the cover crop roots improve soil water retention, resulting in higher moisture content if termination occurs early in the season and according to the termination method. Moreover, the termination method affects the residue bearing capacity, and in some cases, counterbalances the lower soil bearing capacity with lower soil stress due to higher moisture content. Finally, the use of a cover crop can affect the soil structure, decreasing the penetration resistance and resulting in an easier soil penetration during the following operations, such as no-till planting or tillage. The findings of this study confirmed the results obtained in previous research, but underlined the variability of residues effects due to different soil conditions and cover crop termination methods. However, taking into account the limited load adsorbed by the surface residues layer, further studies are needed to increase the knowledge on how residues interact on soil compaction with light loads, as happens on a no-till planter closing wheel, where a compacting action was needed and could be disturbed by different types of residues.

Author Contributions

Conceptualization, M.B.; methodology, M.B. and F.G.; software, M.B.; validation, M.B., F.G. and L.S.; formal analysis, M.B., F.G. and K.L.; data curation, M.B. and L.G.; writing—original draft preparation, M.B.; writing—review and editing, L.G. and A.P.; supervision, A.P. and L.S.; project administration, L.S.; funding acquisition, L.S. All authors have read and agreed to the published version of the manuscript.

Funding

This research was completed during a PhD scholarship founded by IBF Servizi s.p.a.

Data Availability Statement

Data presented in this study are available on request from the corresponding author.

Acknowledgments

The authors acknowledge Roberto, Angelica, Marco, Francesco and all the workers of the experimental farm for the support given during the experimental activity.

Conflicts of Interest

The authors declare no conflict of interest.

References

  1. Osman, K.T. Physical Deterioration of Soil BT. In Soil Degradation, Conservation and Remediation; Osman, K.T., Ed.; Springer: Dordrecht, The Netherlands, 2014; pp. 45–67. ISBN 978-94-007-7590-9. [Google Scholar]
  2. Soane, B.D.; van Ouwerkerk, C. Soil Compaction Problems in World Agriculture. In Soil Compaction in Crop Production-Developments in Agricultural Engineering 11; Elsevier: Amsterdam, The Netherlands, 1994; pp. 1–21. [Google Scholar]
  3. Keller, T.; Lamandé, M.; Schjønning, P.; Dexter, A.R. Analysis of soil compression curves from uniaxial confined compression tests. Geoderma 2011, 163, 13–23. [Google Scholar] [CrossRef]
  4. Batey, T. Soil compaction and soil management—A review. Soil Use Manag. 2009, 25, 335–345. [Google Scholar] [CrossRef]
  5. ten Damme, L.; Stettler, M.; Pinet, F.; Vervaet, P.; Keller, T.; Munkholm, L.J.; Lamandé, M. Construction of modern wide, low-inflation pressure tyres per se does not affect soil stress. Soil Tillage Res. 2020, 204, 104708. [Google Scholar] [CrossRef]
  6. Antille, D.L.; Peets, S.; Galambošová, J.; Botta, G.F.; Rataj, V.; Macak, M.; Tullberg, J.N.; Chamen, W.C.T.; White, D.R.; Misiewicz, P.A.; et al. Review: Soil compaction and controlled traffic farming in arable and grass cropping systems. Agron. Res. 2019, 17, 653–682. [Google Scholar] [CrossRef]
  7. Poltorak, B.J.; Labelle, E.R.; Jaeger, D. Soil displacement during ground-based mechanized forest operations using mixed-wood brush mats. Soil Tillage Res. 2018, 179, 96–104. [Google Scholar] [CrossRef]
  8. Ess, D.R.; Vaughan, D.H.; Perumpral, J.V. Crop residue and root effects on soil compaction. Trans. ASAE 1998, 41, 1271–1275. [Google Scholar] [CrossRef]
  9. Holthusen, D.; Brandt, A.A.; Reichert, J.M.; Horn, R.; Fleige, H.; Zink, A. Soil functions and in situ stress distribution in subtropical soils as affected by land use, vehicle type, tire inflation pressure and plant residue removal. Soil Tillage Res. 2018, 184, 78–92. [Google Scholar] [CrossRef]
  10. Gupta, S.C.; Schneider, E.C.; Larson, W.E.; Hadas, A. Influence of corn residue on compression and compaction behavior of soils. Soil Sci. Soc. Am. J. 1987, 51, 207–212. [Google Scholar] [CrossRef]
  11. Reichert, J.M.; Brandt, A.A.; Rodrigues, M.F.; Reinert, D.J.; Braida, J.A. Load dissipation by corn residue on tilled soil in laboratory and field-wheeling conditions. J. Sci. Food Agric. 2016, 96, 2705–2714. [Google Scholar] [CrossRef]
  12. Cherubin, M.R.; Franchi, M.R.A.; de Lima, R.P.; de Moraes, M.T.; Luz, F.B. da Sugarcane straw effects on soil compaction susceptibility. Soil Tillage Res. 2021, 212, 105066. [Google Scholar] [CrossRef]
  13. Piccoli, I.; Sartori, F.; Polese, R.; Berti, A. Crop yield after 5 decades of contrasting residue management. Nutr. Cycl. Agroecosystems 2020, 117, 231–241. [Google Scholar] [CrossRef]
  14. Dal Ferro, N.; Piccoli, I.; Berti, A.; Polese, R.; Morari, F. Organic carbon storage potential in deep agricultural soil layers: Evidence from long-term experiments in northeast Italy. Agric. Ecosyst. Environ. 2020, 300, 106967. [Google Scholar] [CrossRef]
  15. Bolling, I. Bodenverdichtung und Triebkraftverhalten bei Reifen-Neue Meß-und Rechenmethoden; Lehrstuhl für Landmaschinen, Technische Universität: München, Germany, 1987. [Google Scholar]
  16. Berli, M.; Eggers, C.G.; Accorsi, M.L.; Or, D. Theoretical Analysis of Fluid Inclusions for In Situ Soil Stress and Deformation Measurements. Soil Sci. Soc. Am. J. 2006, 70, 1441–1452. [Google Scholar] [CrossRef]
  17. Défossez, P.; Richard, G.; Boizard, H.; O’Sullivan, M.F. Modeling change in soil compaction due to agricultural traffic as function of soil water content. Geoderma 2003, 116, 89–105. [Google Scholar] [CrossRef]
  18. Keller, T.; Ruiz, S.; Stettler, M.; Berli, M. Determining Soil Stress beneath a Tire: Measurements and Simulations. Soil Sci. Soc. Am. J. 2016, 80, 541–553. [Google Scholar] [CrossRef]
  19. de Lima, R.P.; Keller, T. Impact of sample dimensions, soil-cylinder wall friction and elastic properties of soil on stress field and bulk density in uniaxial compression tests. Soil Tillage Res. 2019, 189, 15–24. [Google Scholar] [CrossRef]
  20. Kirby, J.M. Soil stress measurement: Part I. Transducer in a uniform stress field. J. Agric. Eng. Res. 1999, 72, 151–160. [Google Scholar] [CrossRef]
  21. Naderi-Boldaji, M.; Alimardani, R.; Hemmat, A.; Sharifi, A.; Keyhani, A.; Tekeste, M.Z.; Keller, T. 3D finite element simulation of a single-tip horizontal penetrometer-soil interaction. Part II: Soil bin verification of the model in a clay-loam soil. Soil Tillage Res. 2014, 144, 211–219. [Google Scholar] [CrossRef]
  22. Angers, D.A.; Caron, J. Plant-induced changes in soil structure: Processes and feedbacks. Biogeochemistry 1998, 42, 55–72. [Google Scholar] [CrossRef]
  23. Mischler, R.A.; Curran, W.S.; Duiker, S.W.; Hyde, J.A. Use of a Rolled-rye Cover Crop for Weed Suppression in No-Till Soybeans. Weed Technol. 2010, 24, 253–261. [Google Scholar] [CrossRef]
  24. Chen, G.; Weil, R.R. Root growth and yield of maize as affected by soil compaction and cover crops. Soil Tillage Res. 2011, 117, 17–27. [Google Scholar] [CrossRef]
  25. Kooistra, M.J.; Tovey, N.K. Effects of Compaction on Soil Microstructure. In Developments in Agricultural Engineering; Elsevier: Amsterdam, The Netherlands, 1994. [Google Scholar]
  26. Roberson, E.B.; Firestone, M.K.; Sarig, S. Cover Crop Management of Polysaccharide-Mediated Aggregation in an Orchard Soil. Soil Sci. Soc. Am. J. 1991, 55, 734–739. [Google Scholar] [CrossRef]
  27. Seehusen, T.; Riggert, R.; Fleige, H.; Horn, R.; Riley, H. Soil compaction and stress propagation after different wheeling intensities on a silt soil in South-East Norway. Acta Agric. Scand. Sect. B Soil Plant Sci. 2019, 69, 343–355. [Google Scholar] [CrossRef]
  28. ten Damme, L.; Schjønning, P.; Munkholm, L.J.; Green, O.; Nielsen, S.K.; Lamandé, M. Soil structure response to field traffic: Effects of traction and repeated wheeling. Soil Tillage Res. 2021, 213, 105128. [Google Scholar] [CrossRef]
  29. Pulido-Moncada, M.; Munkholm, L.J.; Schjønning, P. Wheel load, repeated wheeling, and traction effects on subsoil compaction in northern Europe. Soil Tillage Res. 2019, 186, 300–309. [Google Scholar] [CrossRef]
Figure 1. Traffic pattern of the experimental field test for every covering plot. The picture shows how the traffic was managed during the experiment to avoid compaction on the sampling zone through the sampling area of the bulk density, penetrometer to measure cone index and Bolling probe to assess mean normal stress. A total of 16 covering plots were used with 4 different covering treatments and 4 replicates.
Agronomy 13 00686 g001
Figure 2. Different cover crop terminations: (a) flail mower, (b) roller crimper.
Agronomy 13 00686 g002
Figure 3. Effect of the four different cover crop managements compared in the experiment: (1) bare soil (Bare); (2) roller crimper (Crimped); (3) harvested canopy (Harvested); (4) flail mower (Shredded).
Agronomy 13 00686 g003
Figure 4. A penetrometer was installed on an iron frame with hydraulic ram to insert the cone tip at constant speed in the soil.
Agronomy 13 00686 g004
Figure 5. Installation position of the Bolling probe to measure the mean normal stress with different cover crop mulch treatments.
Agronomy 13 00686 g005
Figure 6. Cone index means after different numbers of traffic events and cover crop mulch treatments (Harvested; Bare soil; Crimped; Shredded). Residual standard errors were used on bar error.
Agronomy 13 00686 g006
Figure 7. Bulk density means resulted from different number of traffic events and cover crop mulch treatments (Harvested; Bare soil; Crimped; Shredded). Residual standard errors were used on the bar error.
Agronomy 13 00686 g007
Figure 8. Results of the statistical analysis of mean normal stress (kPa). Residual standard errors were used on the bar error. Treatments with the same letter are not significantly different.
Agronomy 13 00686 g008
Table 1. Technical data of the tractor used in the experiment.
NameUnitModel
Tractor Model Fiat 680
Total masskg4310
Front axlekg780
Rear axlekg3530
Rear tyreKleber traker420/85R30
Front tyreVredestein multirill7.50–16
Front tyre inflation pressurebar1.7
Rear tyre inflation pressurebar1.45
Table 2. Analysis of variance, with all soil properties and variables taken into account.
Analysis of Variance Summary
Cover Crop MulchTraffic EventsDepthSoil MoistureCCM
× TE
CCM
× Depth
Bulk Density<0.001<0.0010.04 0.02
Cone Index<0.001<0.001<0.001<0.0010.01
Volumetric Water Content<0.001<0.001ns ns
Rut profile area0.004<0.001 ns
Surface Biomass<0.001
Mean Normal Stress0.004 <0.001 0.001
ns = Not Significant; p-values are missing where factors were not involved in statistical analysis. CCM×TE is the interaction between cover crop mulch and traffic events, while CCM×epth is the interaction between cover crop mulch and depth.
Table 3. Result of statistical analysis on Rut area profiles (cm2).
TreatmentRut Profile AreaStandard Error TreatmentRut Profile AreaStandard Error
Crimped1405.9455.13ab51639.0650.56a
Shredded1328.7554.31b31495.6359.43b
Bare1507.1954.35a11365.0038.84bc
Harvested1498.4466.80a01240.6336.97c
alpha: 00.5
Treatments with the same letter are not significantly different.
Table 4. Result of statistical analysis on mulch dry biomass.
TreatmentMulch Dry Biomass (Mg ha−1)Standard Error
Crimped11.24a4.18
Shredded12.63a3.08
Bare1.14b0.61
Harvested3.54b4.49
Treatments with the same letter are not significantly different. Groups according to probability of means differences and alpha level (0.05).
Disclaimer/Publisher’s Note: The statements, opinions and data contained in all publications are solely those of the individual author(s) and contributor(s) and not of MDPI and/or the editor(s). MDPI and/or the editor(s) disclaim responsibility for any injury to people or property resulting from any ideas, methods, instructions or products referred to in the content.

