Article

Ions Transport in Seasonal Frozen Farmland Soil and Its Effect on Soil Salinization Chemical Properties

State Key Laboratory of Water Resources and Hydropower Engineering Science, Wuhan University, Wuhan 430072, China
*
Authors to whom correspondence should be addressed.
Agronomy 2023, 13(3), 660; https://doi.org/10.3390/agronomy13030660
Submission received: 13 November 2022 / Revised: 13 February 2023 / Accepted: 22 February 2023 / Published: 24 February 2023

Abstract

:
The salinization of farmland soil is exacerbated during the freeze–thaw (FT) process, endangering agricultural production. The change of soil salt ions results in the formation and development of soil salinization. The objectives of this study were to investigate the migration characteristics of salt ions during the FT process, identify the effects of inconsistencies in ions transport on the development of soil salinization chemical properties. A six-month field observation was conducted from November 2020 to April 2021 in the Hetao Irrigation District, China, a typical seasonally frozen soil area affected by salinization. Soil salt ions, soil moisture content (SMC), soil temperature, and pH were measured. Soil salt content (SSC), sodium adsorption ratio (SAR) were calculated. The ions accumulated in the frozen soil layer during the freezing period in the order of Cl > Mg2+ > Ca2+ > Na+ > SO42−, and accumulated in the topsoil during the thawing period in the order of Cl > Na+ > Mg2+ > Ca2+ > SO42−, while the change in HCO3 was mostly the opposite. The FT process changed the main salt anions from sulfate to chloride. After the FT process, the topsoil was endangered by high salinization, excess Cl toxicity, and a potential alkalization threat. This study has great guiding significance for the management and control of soil salinization before spring sowing in saline areas.

1. Introduction

Soil salinization and alkalization is an urgent environmental issue [1,2] that leads to the decrease of crop yields [3,4] and endangers agricultural production. The worldwide area of saline-alkali farmland is about 9.54 million km2 [5], of which one-third is located in northern China [6]. These saline farmlands are mostly affected by seasonal freeze–thaw (FT) process [7] that are accompanied by significant soil temperature variations [8], water phase changes between liquid water and ice [9], and water migration [10]. The precipitation, dissolution, adsorption, desorption, and migration of salt ions in soil are affected by changes in soil temperature and soil liquid water content [11], and are the key reasons for soil salinization [12]. Therefore, it is important to conduct field experiments to study the effect of FT process on soil ions transport and the influence of these processes on the development of soil salinization.
FT process can significantly influence water and salt migration in soil [13,14]. During the soil freezing process, the temperature gradient drives soil water and salt from the unfrozen layer to the frozen soil layer [15], causing the increase of soil moisture and salt content in the frozen layer [16]. Ice crystals form in frozen soil, and salt is separated out of the frozen water and enriched in the remaining unfrozen water [17]. Slower freezing rates can increase the exclusion of salt from frozen soil water, resulting in a steeper concentration gradient between the frozen soil layer and the unfrozen layer, which may drive salt migration towards the unfrozen layers [18]. During the thawing process, intense surface evaporation greatly reduces water in thawed soil and promotes salt accumulation in surface soil [19,20]. The residual frozen soil can restrain the evaporation and salt migration from the lower layer, and slow or reduce the infiltration of water and salt from the upper thawed layer [7]. However, the above studies mostly focused on the migration of the total salt in soil, which is actually a comprehensive process involving the movement of various soluble ions. For example, Chuvilin [21] observed that the freezing process induced the accumulation of light metal ions (such as sodium, calcium, and magnesium) in frozen soil, while the contents of copper and zinc had no significant change in the frozen layer. The experimental results of Wang et al. [22] showed that the Na+, Cl, and SO42− storage increments in the upper 0–1 m soil layer were identical to that of the soil total salt, but the storage of Na+, Cl, and SO42− decreased with the increasing storage of HCO3. However, these previous studies have mainly focused on changes in various soil soluble ion contents and their distribution characteristics, while the migration characteristics, driving factors, and influencing mechanisms of salt ions during soil freezing and thawing processes remain unclear.
At present, the migration characters of various salt ions and their influencing factors are mostly studied during the processes of soil leaching and evaporation. For example, Zhao et al. [23] conducted a soil column leaching experiment and found that the variation of Na+ content was similar to that of Cl; stronger than that of Ca2+, Mg2+, SO42−; and negatively correlated with HCO3. In addition, Kong et al. [24] reported that the decreasing order of salt ion capacity during the leaching process was as follows: Na+ > K+ > Ca2+ > Mg2+ and HCO3 > SO42− > CO32−. The inconsistencies in the migration of various ions in these studies are due to the combined effects of their physicochemical properties and the accompanying chemical reactions during the movement of the soil solution, such as the ionic charge [25], ionic radius [26], relative molecular/atomic mass [27], hydrolysis–complexation, precipitation–dissolution [28], adsorption–desorption, and ion exchange [29]. In addition, migration inconsistencies are intensified by environmental factors, such as the soil texture [30], the chemical composition of groundwater [31], and the land use types [32]. However, factors controlling the migration characters of salt ions during soil FT processes are significantly different. For example, the decrease of temperature during the soil freezing process can significantly reduce the solubility of chemical compounds such as Na2SO4 and MgSO4 [33]. Salts crystallize and precipitate out of the soil solution more easily as the liquid water content decreases [34,35], thus reducing the amount of freely migrating ions in the soil. However, the upward movement of soil water induced by low temperatures [36] can weaken this ionic-decrease effect, and make the movement of ions in the FT process more complex. Thus, it is of great importance to investigate how temperature affects ion migration during the FT process.
Differences in the migration of soil ions can significantly alter the salt chemical composition [37], further affecting soil salinization and alkalization [38]. For example, the pH of soil usually exceeds 10 when the CO32− and HCO3 contents are high [39,40], and higher levels of Na+ and lower levels of Ca2+/Mg2+ significantly increase the soil sodium adsorption ratio (SAR), thereby increasing soil alkalinity [41]. An imbalance of the soluble ion composition will also cause obvious single ion toxicity in soil structure and plants [42,43]. Thus, investigating the influence of FT processes on changes in salt chemical composition is of great significance to the guiding of spring irrigation and crop planting.
This paper conducted a six-month field observation during the FT process from November 2020 to April 2021 in Hetao irrigation district, a typical seasonal frozen soil district in China. The contents of soil soluble ions, soil moisture content (SMC), soil temperature, and soil pH values were measured, and the soil salt content (SSC), soil SAR were calculated. The aims of this paper were to (1) identify the migration characteristics of different salt ions and reveal the chemical mechanisms of the ions transport difference during the FT process; (2) reveal the effect of ions transport inconsistencies during the FT process on the development of soil salt chemical composition; and (3) assess how changes in the salt chemical composition affect soil alkalization properties.

2. Materials and Methods

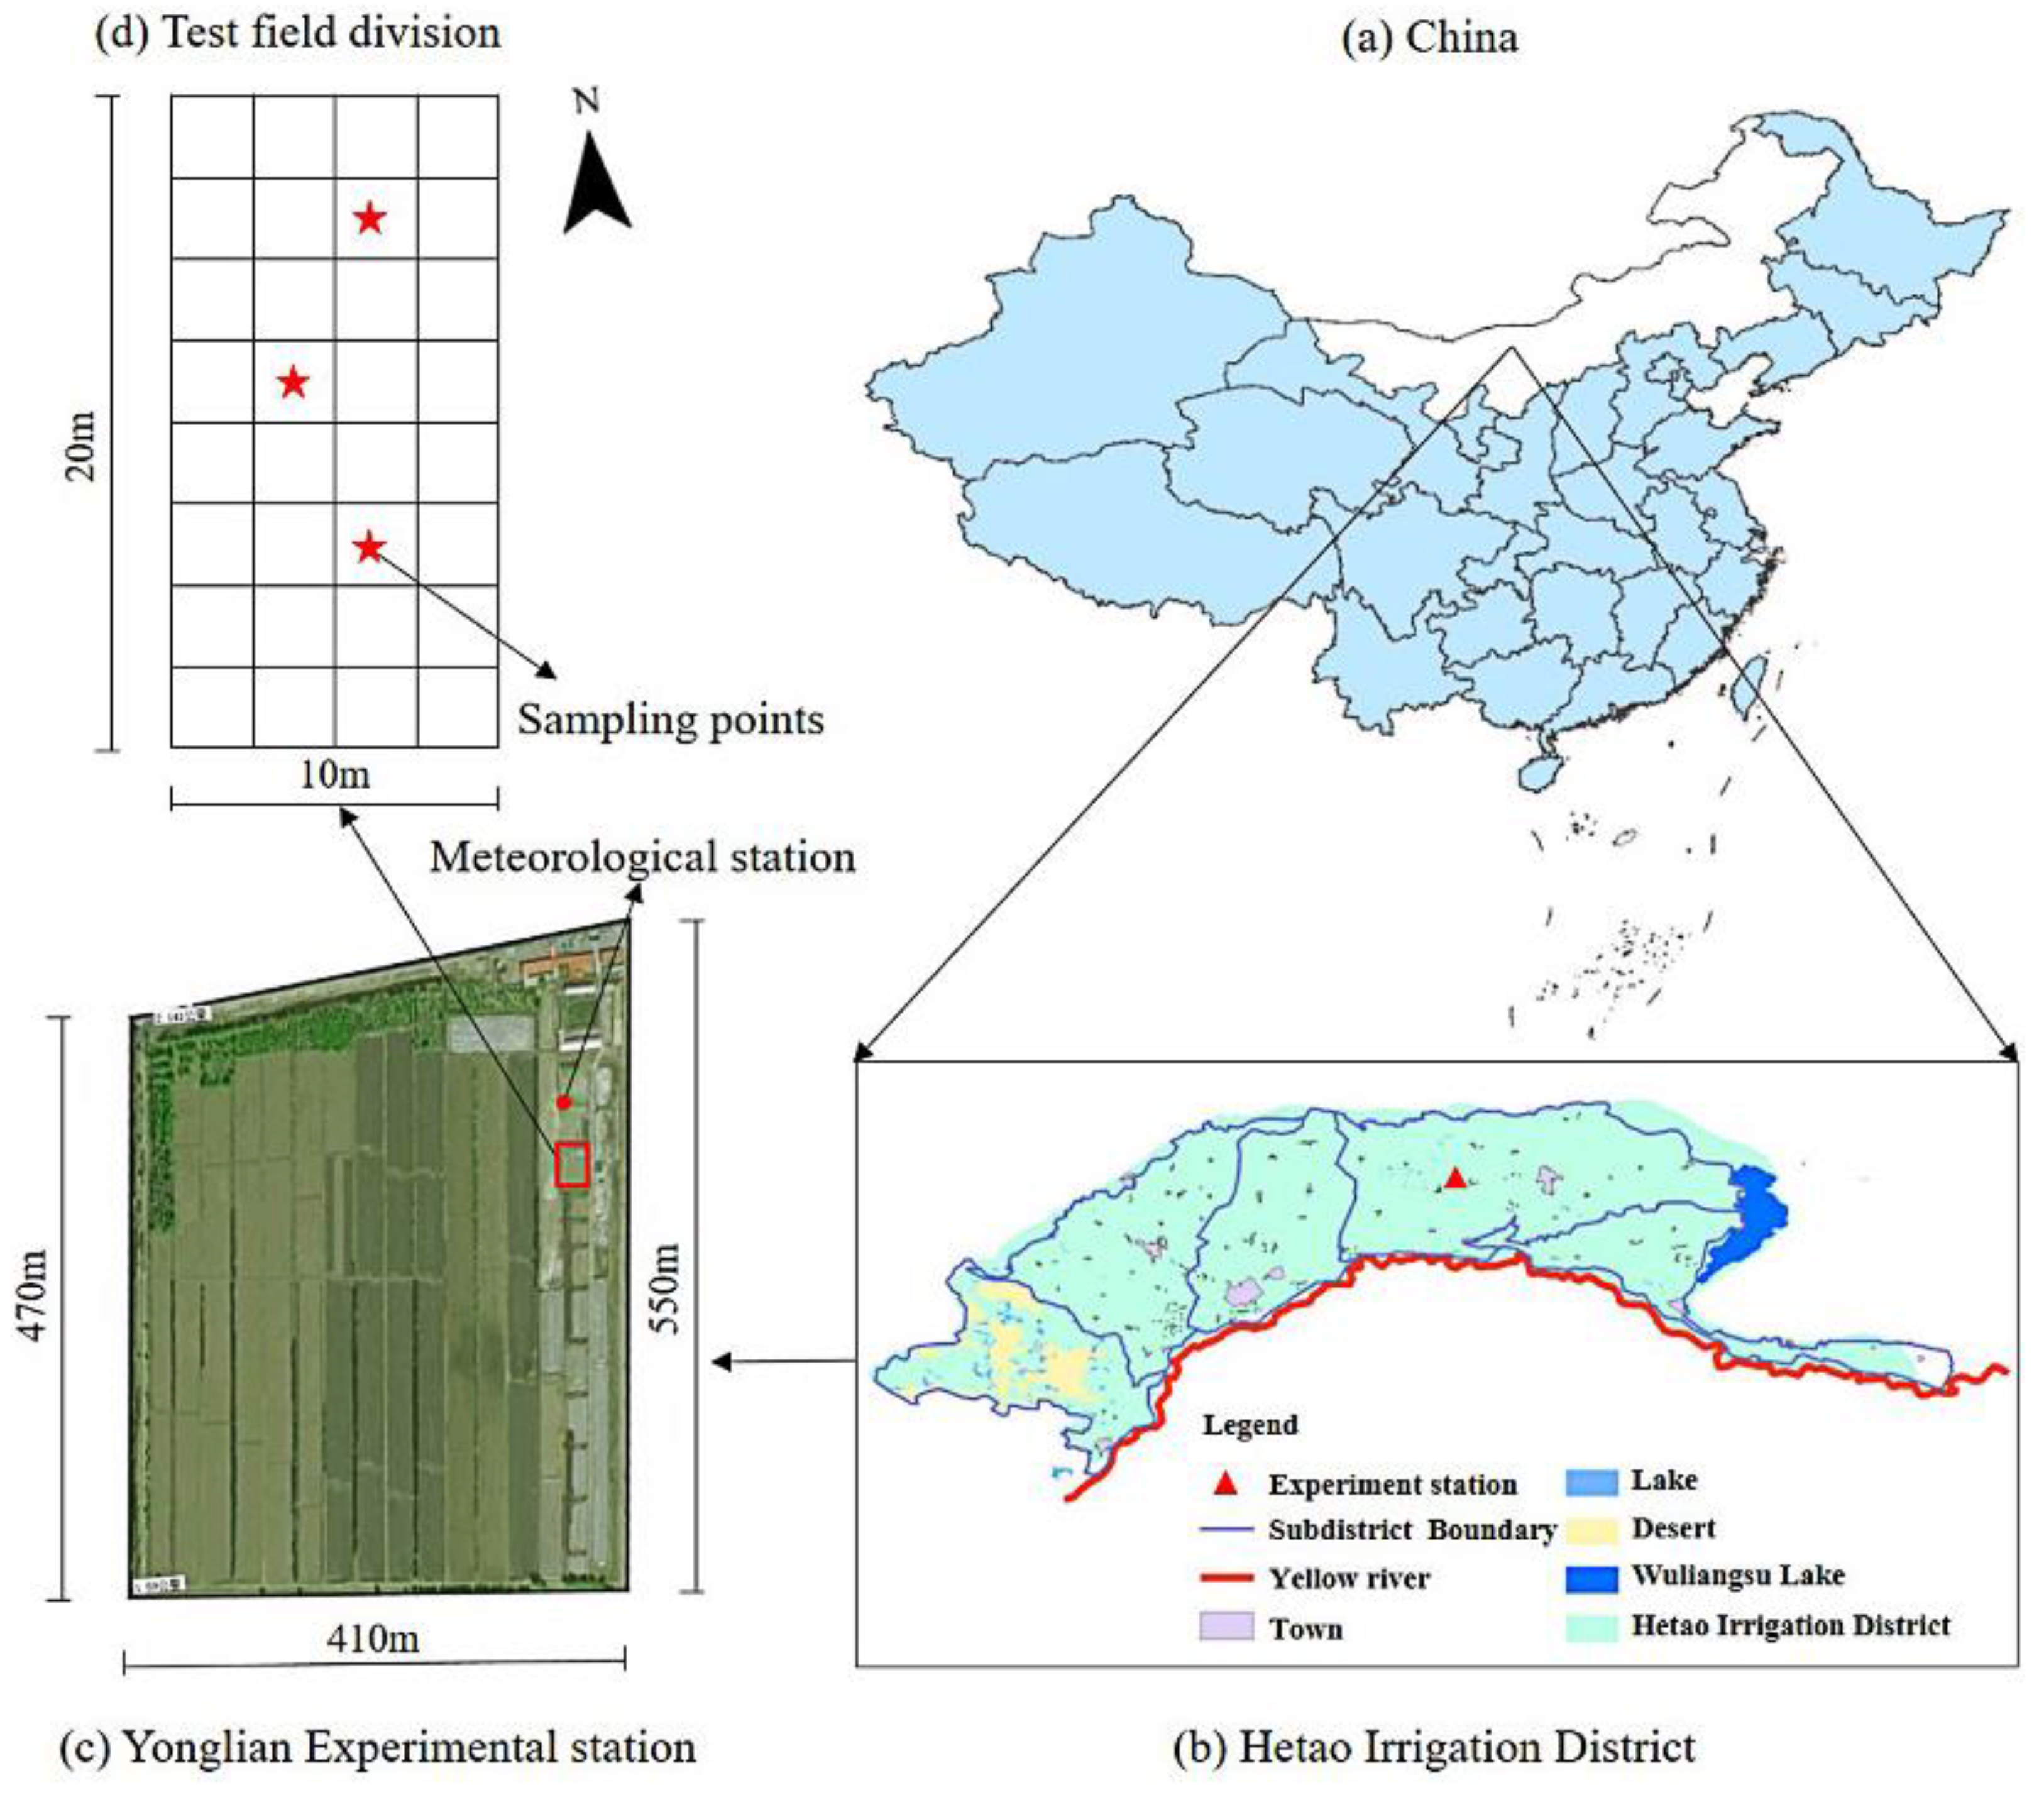
2.1. Study Site and Soil Sampling

The sampling site was located at the Yonglian experimental station (108°00′35″ E, 41°04′15″ N) of the Hetao Irrigation District, in the west of the Inner Mongolia Autonomous Region, China (Figure 1). The study area has a typical arid continental climate. The annual precipitation is 137–214 mm, the annual evaporation is 1993–2373 mm, and the annual average temperature is between 6 and 8 °C. Soils begin freezing in the second half of November, freeze to a depth of about 0.7–0.8 m, and completely thaw in late April of the following year. The duration of frozen ground is about 180 days.

2.2. Experiment Design

The experiments were conducted from November 2020 to April 2021. A 20 m × 10 m saline farmland planted with sunflower was selected as the experiment field. Considering the spatial variability of soil salinity, moisture and ion content in the experimental field, a pre-experiment was conducted. The test field was divided into 32 test plots (2.5 m × 2.5 m), and the SSC, SMC, soil texture, and ion content of each plot were texted. Three plots with similar SSC, SMC, soil texture, and ion content were selected as replicated to conduct the following FT tests, as shown in Figure 1d. The average value of the three sampling points was used as the analysis data.
Soil was oven-dried at 105 °C for 8 h to determine the soil water content, then sieved with a 2-mm sieve to the measure soil particles using a Microtrac S3500 laser particle size analyzer (Microtrac Inc., Largo, FL, USA). The soil was classified as a silt loam according to the USDA system [44]. Soil bulk density was also determined by using a steel ring (diameter: 5 cm, height: 5 cm) to sample soil and then dividing oven dried sample mass by ring volume. The cation exchange capacity (CEC) was determined by sodium acetate method. The basic soil properties at the beginning of the experiment in the 0–80 cm soil layer are listed in Table 1.
According to the meteorological data, collected by the meteorological station set 100 m away from the experimental field, six sampling time (2 November 2020, 9 December 2020, 10 January 2021, 22 February 2021, 19 March 2021, and 19 April 2021) were selected. At each sampling time, three soil cores were randomly sampled from each plot using artificial soil drilling, and soil was collected from the core of each soil pillar at depths of 0–5 cm, 5–10 cm, 10–20 cm, 20–30 cm, 30–40 cm, 40–60 cm, and 60–80 cm. Soil temperature was measured by seven auto sensors (WT0T1, Wang Yun Shan Information Technology Co., Ltd., Fujian, China) embedded in the soil profile at the depths of 2.5 cm, 7.5 cm, 15 cm, 25 cm, 35 cm, 50 cm, and 70 cm. The data were collected at 1-h intervals by a matched temperature data collector. The frozen and thawing depths were recorded according to the sampling situation.

2.3. Soil Sampling and Chemical Analysis

After the soil sampling, soil samples were transported to Wuhan University for analysis. Soil samples were divided into two portions. One portion was oven-dried at 105 °C for 8 h to determine the soil water content. The remaining portion was air-dried and sieved with a 2-mm sieve to make soil extract solutions (soil:water = 1:5) to determine the soil chemical properties. The pH of soil extract solutions (soil:water = 1:5) was measured using a pH meter (DZS-706 Multi-Parameter Analyzer, Hunan Lichen Instrument Technology, Hunan, China). The concentrations of CO32− and HCO3 were tested by the double indicator-neutralization titration method; the concentration of Cl was tested by direct titration with silver nitrate; the concentrations of Ca2+ and Mg2+ were tested by direct titrations with EDTA; SO42− was tested by the indirect EDTA titration method; and the concentrations of K+ and Na+ were tested by spectrophotometer (FP640, Shanghai Precision Scientific Instrument Co., Ltd., Shanghai, China).
The soil salt content (SSC) was calculated according to the sum of eight dominant soluble ions. The soil salinization grade was classified into five grades according to the SSC: none salinization soil (SSC < 0.2 g/100 g), mild salinization soil (0.2 ≤ SSC < 0.4 g/100 g), moderate salinization soil (0.4 ≤  SSC < 0.6 g/100 g), severe salinization soil (0.6 ≤  SSC < 1.0 g/100 g), salinized soil (SSC ≥ 1.0 g/100 g) [45,46].
The SAR of the soil solution can be calculated as follows [47]:
S A R = N a + / [ ( C a 2 + + M g 2 + ) / 2 ] 1 / 2

2.4. Estimation of Amount of Crystalline Sodium Sulfate

During the freezing and thawing process, the decrease of soil temperature led to the formation of ice crystals and reduced the soil liquid water content. Assuming that salt is completely excluded from ice crystals and exists only in soil liquid water, sodium sulfate with lower solubility will preferentially precipitate from soil liquid water to form salt crystals, as they are limited by the solubility of compounds. Because the solubility of sodium sulfate changes very slowly with temperature when the temperature decreases below 0 °C [48], this study selects the solubility of salt at 0 °C for calculation. The maximum concentration of sodium sulfate that can be dissolved in soil liquid water is calculated as follows:
c = θ u × m s M = a | T | b × m s M
θ u = a | T | b
where c is the maximum concentration of the sodium sulfate (mmol/100 g); θ u is the liquid water content (%), and a = 0.114 and b = 0.208, which are parameters related to the initial SMC and soil texture, respectively, estimated based on the empirical parameters proposed by Wu et al. (2015) [49]; ms is the solubility of the sodium sulfate, 4.9 (g); M is the relative molecular mass of Na2SO4·10H2O, 322; T is the soil temperature (°C).
Then the amount of sodium sulfate salts crystals is estimated as follows:
C = N c
where N is the molar concentration of sodium sulfate, based on the measured data (mmol/100 g); c is the maximum concentration of sodium sulfate that can be dissolved in soil solution (mmol/100 g).

2.5. Statistical Analysis

SPSS 24.0 and Origin 2021 software were used for data processing, graphing, and tabulation. Each data point was summarized by calculating the average value and standard deviation (S.D). The least significant difference (LSD) method was used to test the significance of the differences in soil salt ions at different times and in different soil layer. A significance level of p = 0.05 was set. The Shapiro-Wilk test was adopted to verify the normal distribution of the data. The Spearman correlation analysis was conducted to determine the relationship between the dominant soil soluble ions (Cl, SO42−, CO32−, HCO3, Na+, K+, Mg2+, and Ca2+) and the soil properties (SMC, SSC, pH, SAR). The correlation coefficient matrix was drawn using MATLAB.

3. Results

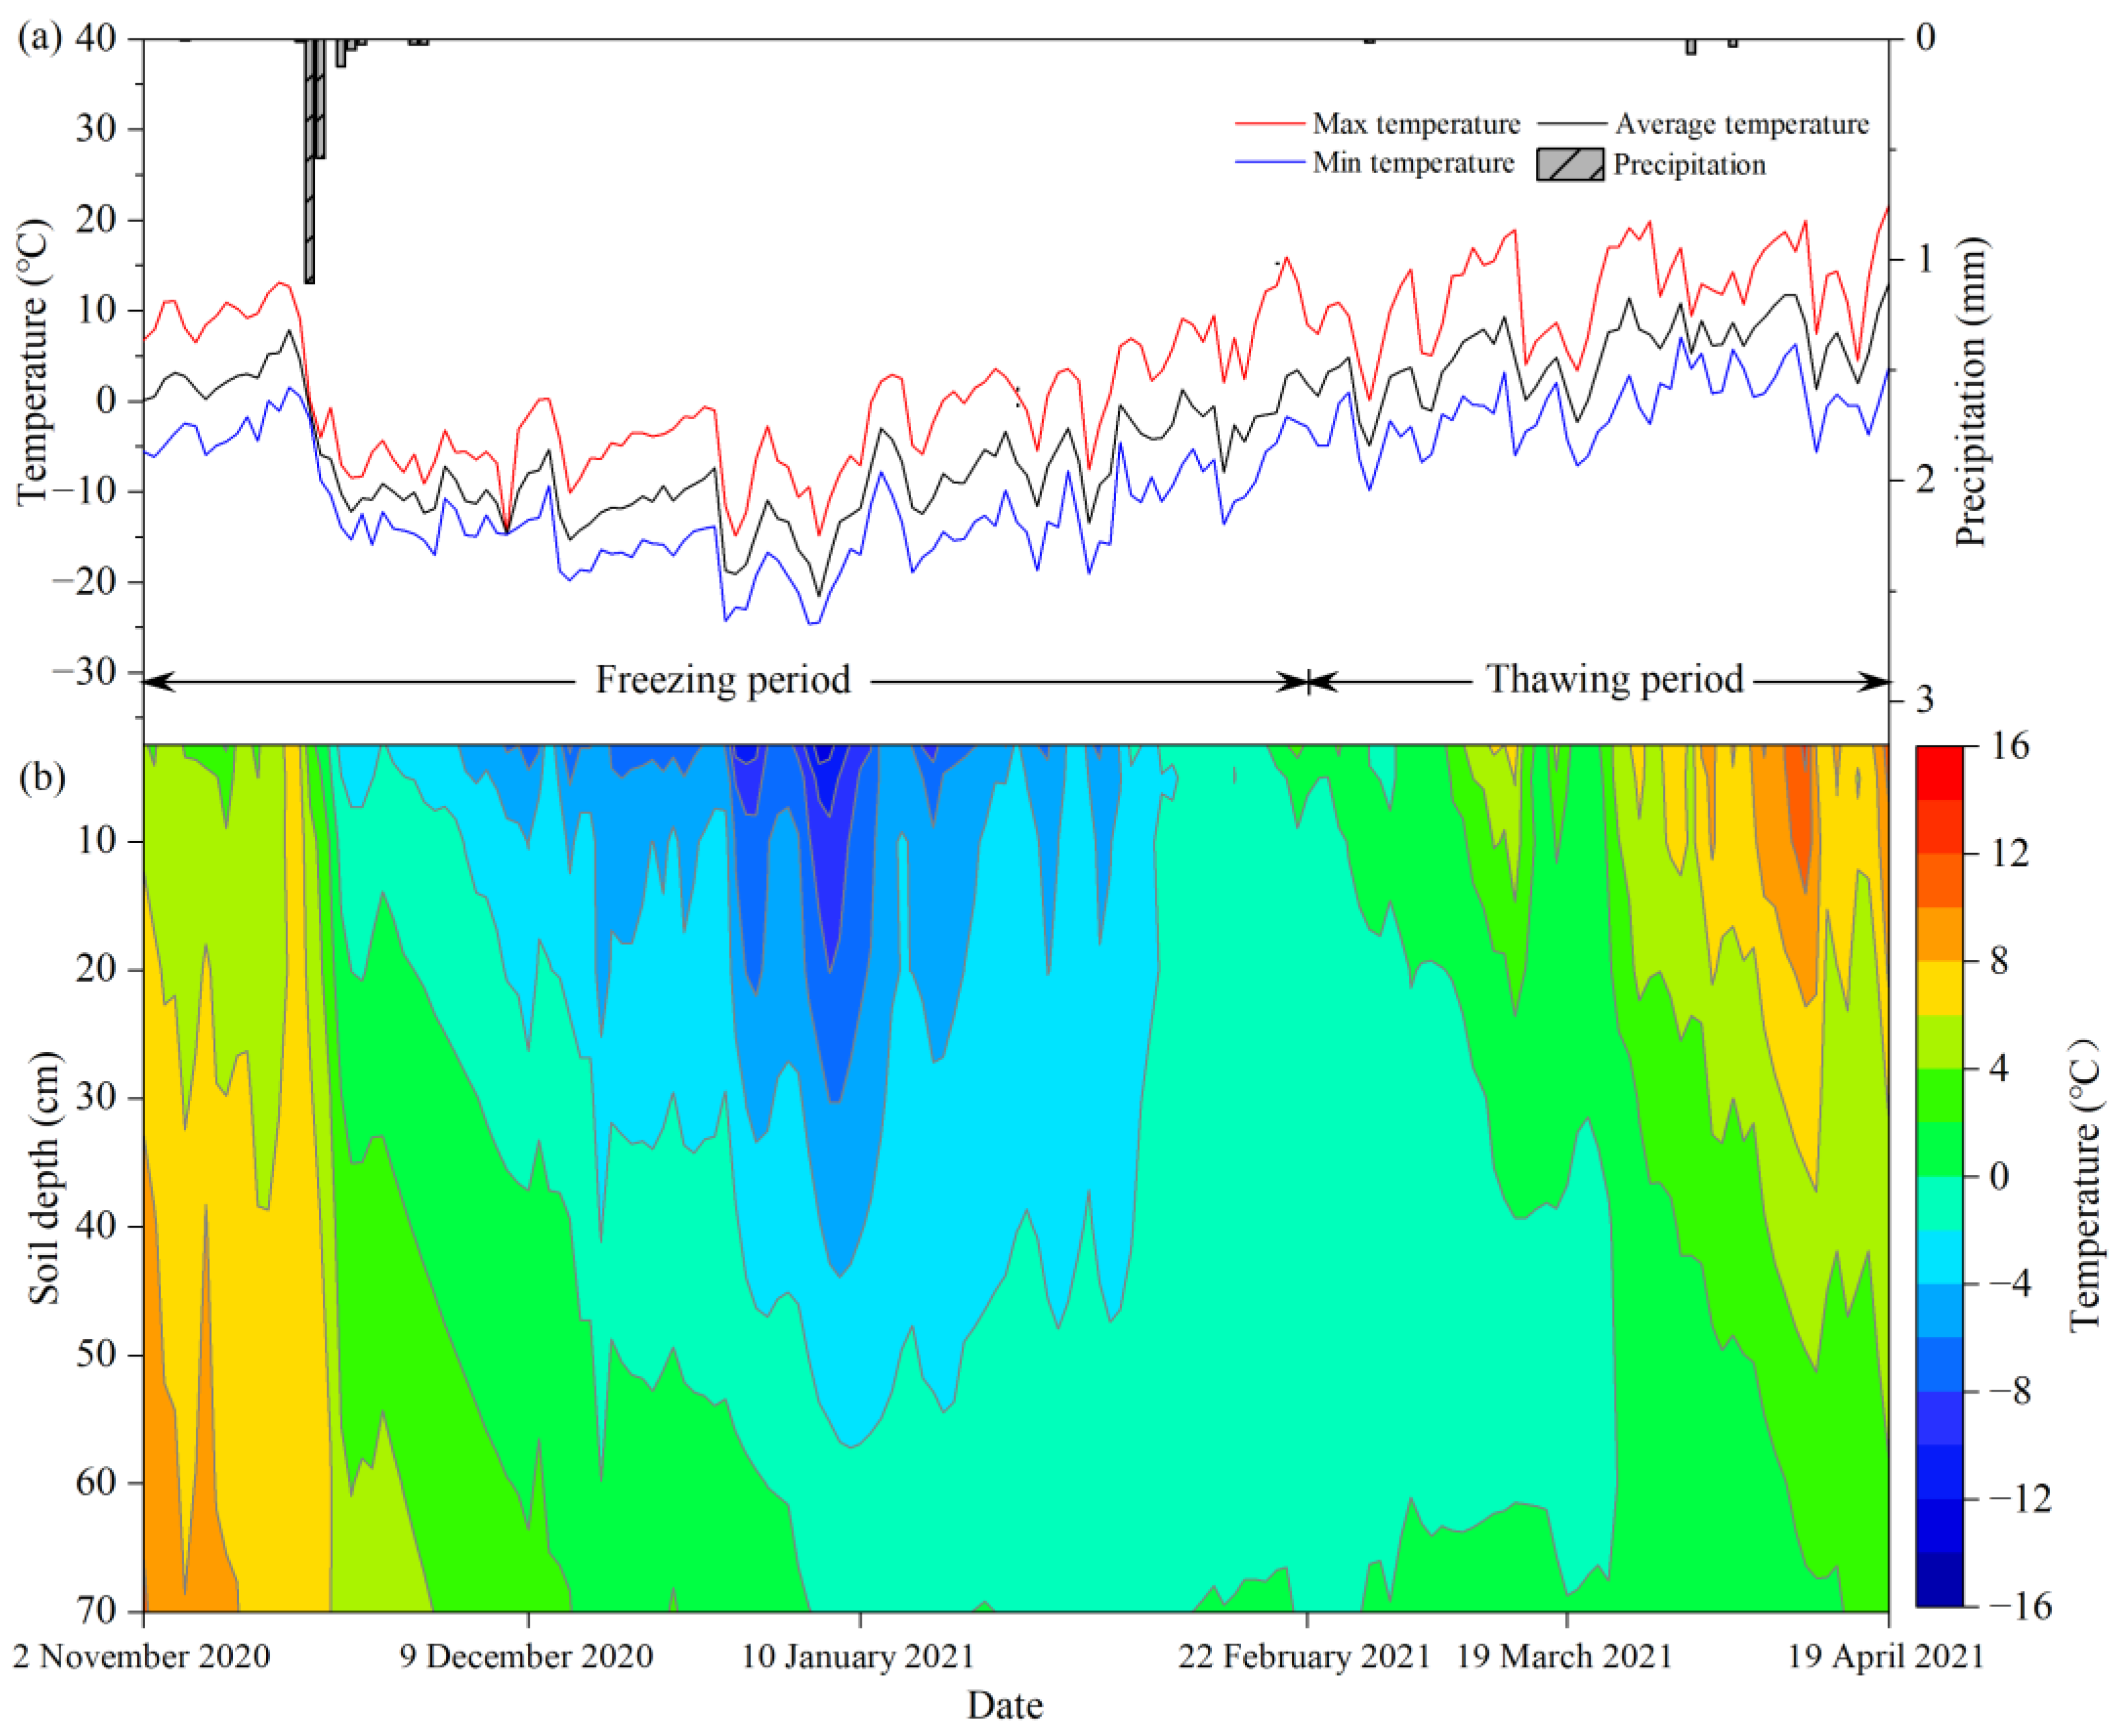
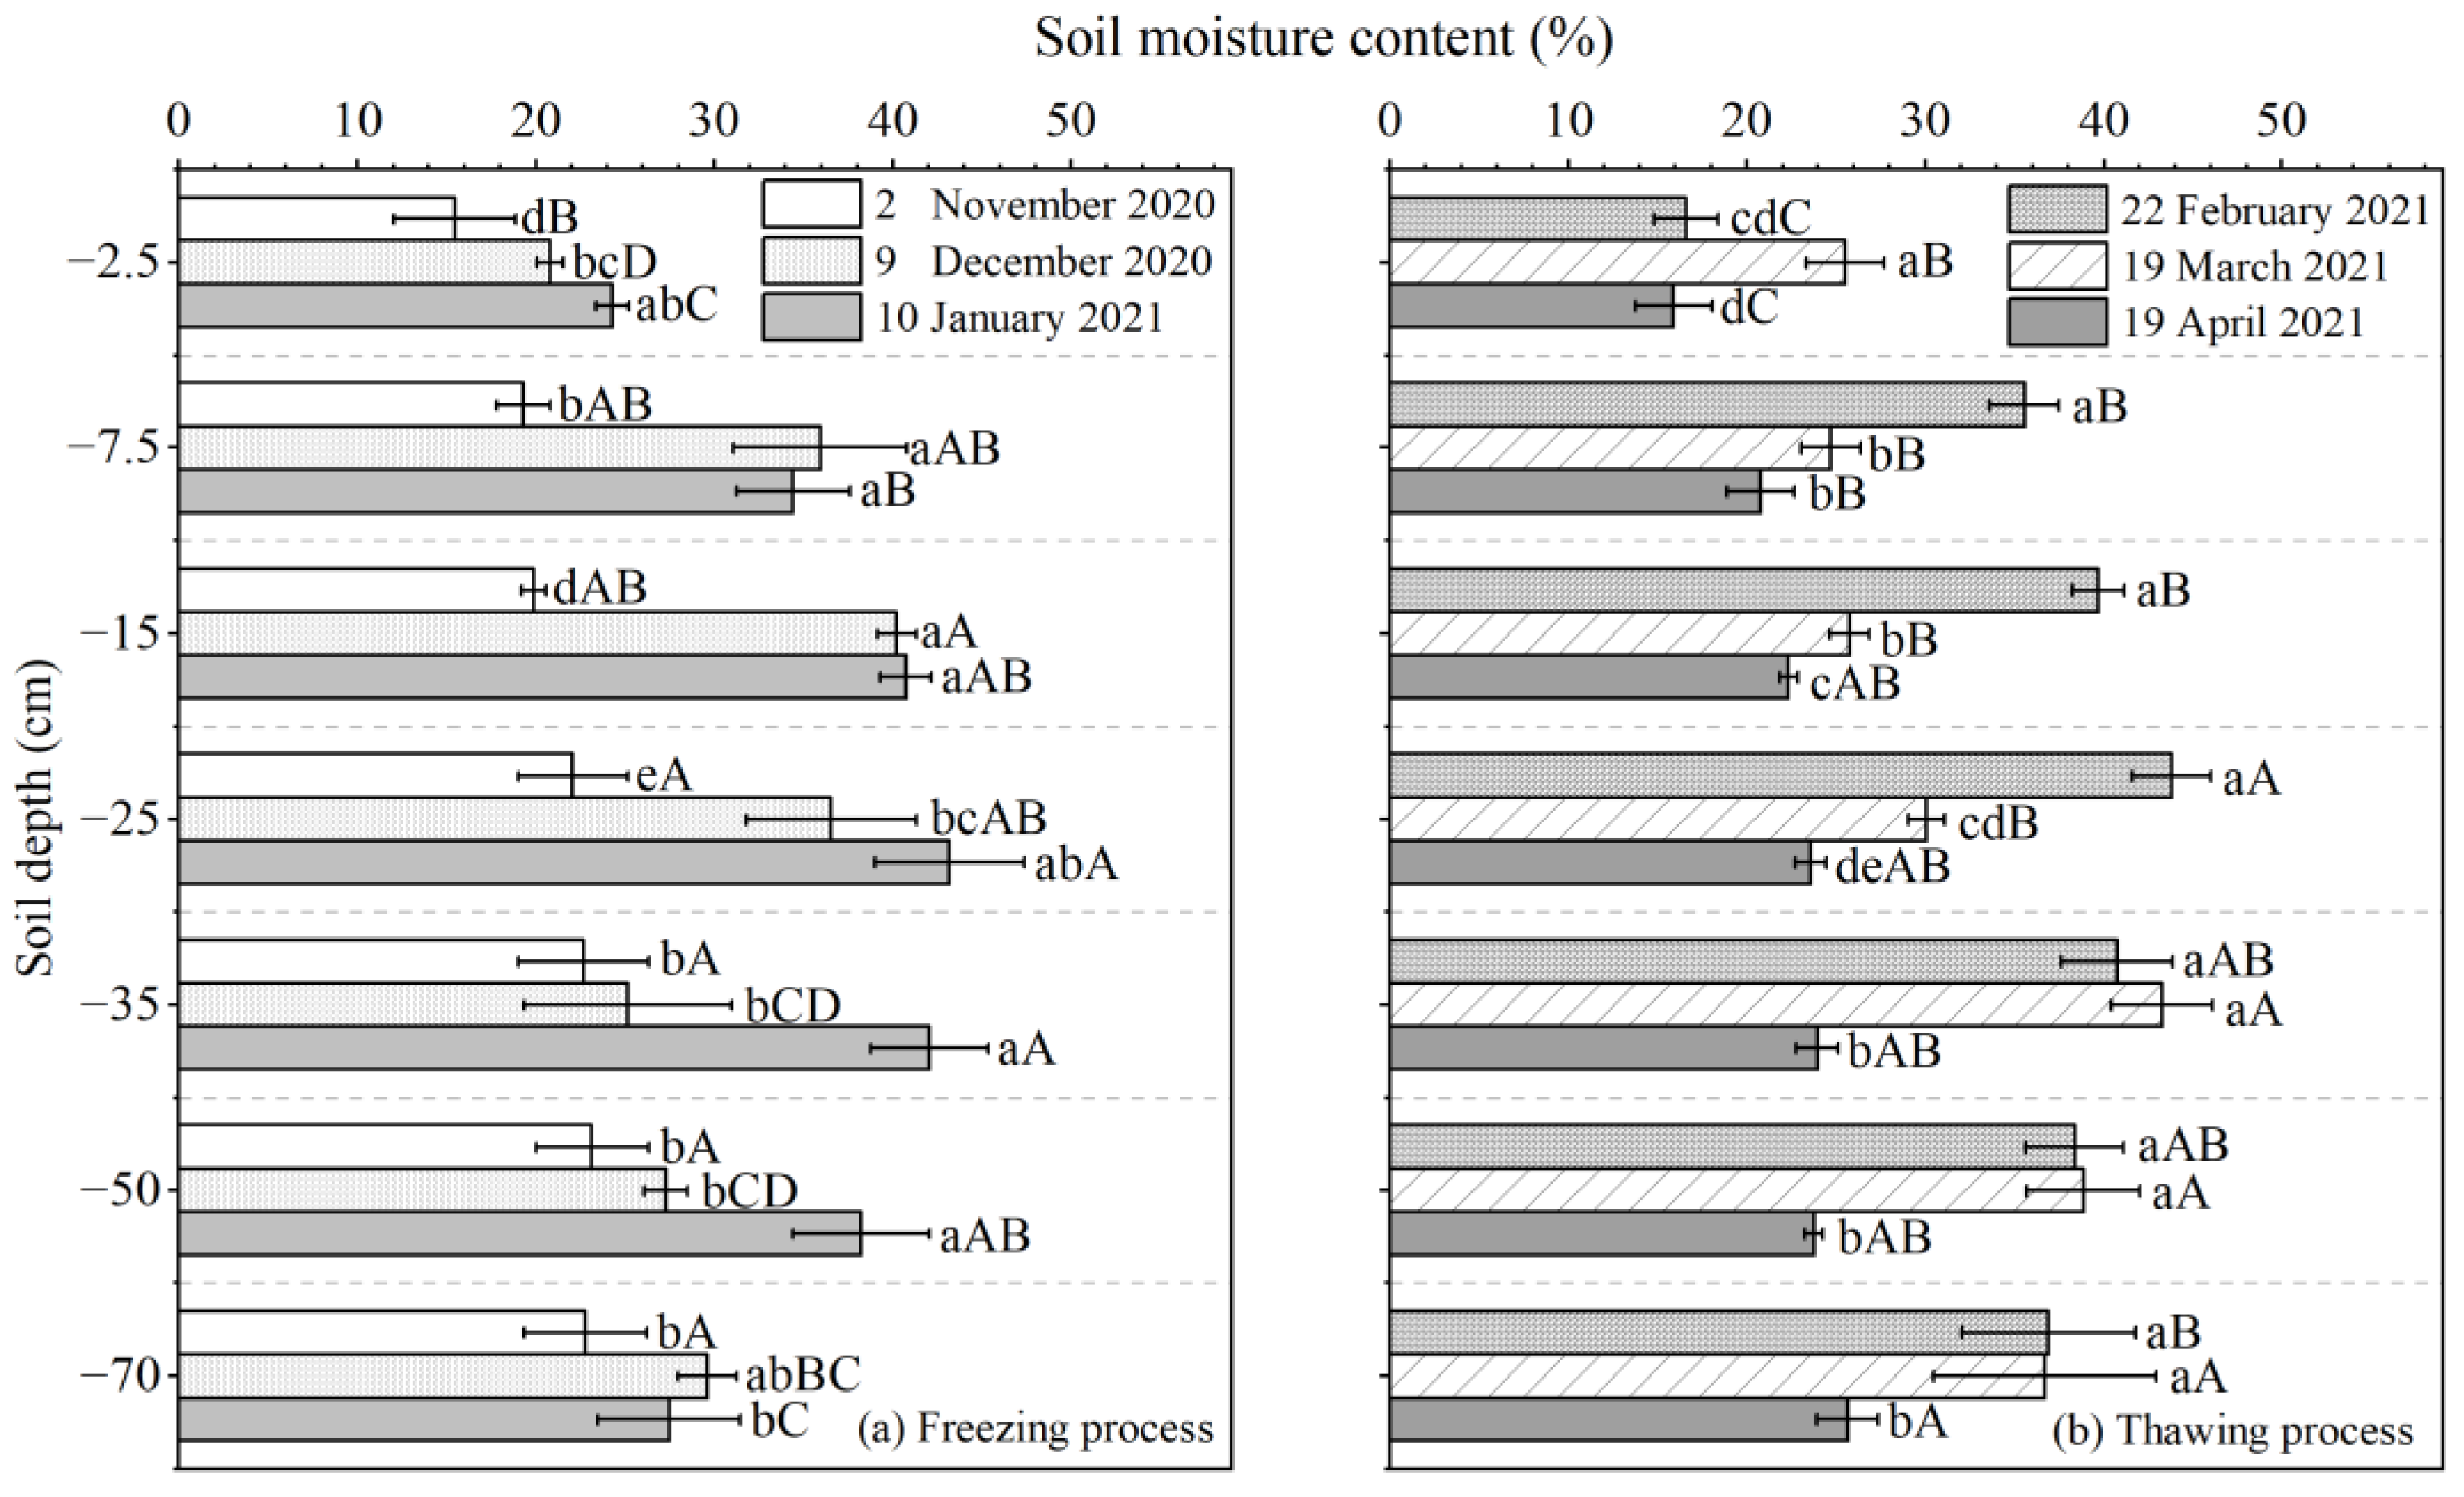
3.1. Changes in Temperature and SMC during the FT Process

The meteorological conditions during the test period are shown in Figure 2a. During the experimental period, the only rainfall was a 1.11 mm rainfall event that occurred in November. Figure 2b shows the temperature change of the soil profile. This paper determined that the soil was frozen when the soil temperature stabilized below 0 °C. According to the air temperature and soil freezing state, six sampling dates were set on 2 November 2020, 9 December 2020, 10 January 2021, 22 February 2021, 19 March 2021, and 19 April 2021 (T1–T6, respectively), and the FT process was divided into five periods. During the initial freezing period (T1–T2), soil froze during the night and thawed during the day, and the frozen soil depth was 30 cm at the end of this period. During the stable freezing period (T2–T3), soil was stably frozen (Tmax < 0 °C), the minimum air temperature reached −21.53 °C, and the maximum freezing depth reached 75 cm. During the early unstable thawing period (T3–T4), Tmax > 0 °C, Tmin < 0 °C; however, there was no obvious thawing layer on the soil surface, because Tave < 0 °C. During the late unstable thawing period (T4–T5), Tave > 0 °C, and the topsoil was gradually thawed. Up to T5, the thawed depth was 31 cm. From T5–T6, a stable thawing period was observed (Tmin > 0 °C most of the time). By T6, the soil had completely thawed. Taking T4 as the dividing point, in the T1–T4 stage, the temperature gradient was positive and the soil temperature gradually increased with the increase of depth; in the T4–T6 stage, the temperature gradient was negative, and the soil temperature gradually decreased with the increase of depth.
The distribution of SMC at the depth of 0–80 cm is shown in Figure 3. The SMC gradually increased from 15.46% to 23.15% with the increase of soil depth before freezing (T1), and the average SMC was 21.74%. During the FT process, the soil moisture accumulated during the freezing process and decreased during the thawing process. For example, the SMC of the frozen soil layers (0–30 cm) at T2 increased by 77.29% compared with the initial value (T1) (p < 0.05), while the SMC of the unfrozen soil layers (30–80 cm) had no significant differences between T1 and T2 (p > 0.05); at T3, the SMC of the newly frozen soil layers (30–80 cm) increased by 24.86% compared with T2 (p < 0.05) while the SMC of old frozen soil layers (0–30 cm) had no significant differences between T2 and T3 (p > 0.05). This finding indicated that during the freezing process, water mainly accumulated in the newly frozen layer. During the T4–T5 period, the SMC of the thawed layer (0–30 cm) decreased by 33.20% (p < 0.05), and the unthawed layer (30–80 cm) was relatively stable; during the T5–T6 period, the SMC showed a downward trend, and the soil moisture declines of the surface (0–5 cm) and deep (30–80 cm) layers were more than 30% (p < 0.05). After the entire FT process (T6), the soil moisture, which was 23.38% on average and gradually increased from 15.91% to 25.64% with the increase of soil depth, did not change significantly compared with that at T1 (SMCave = 23.15%)

3.2. Changes in SSC and Ion Content during the FT Process

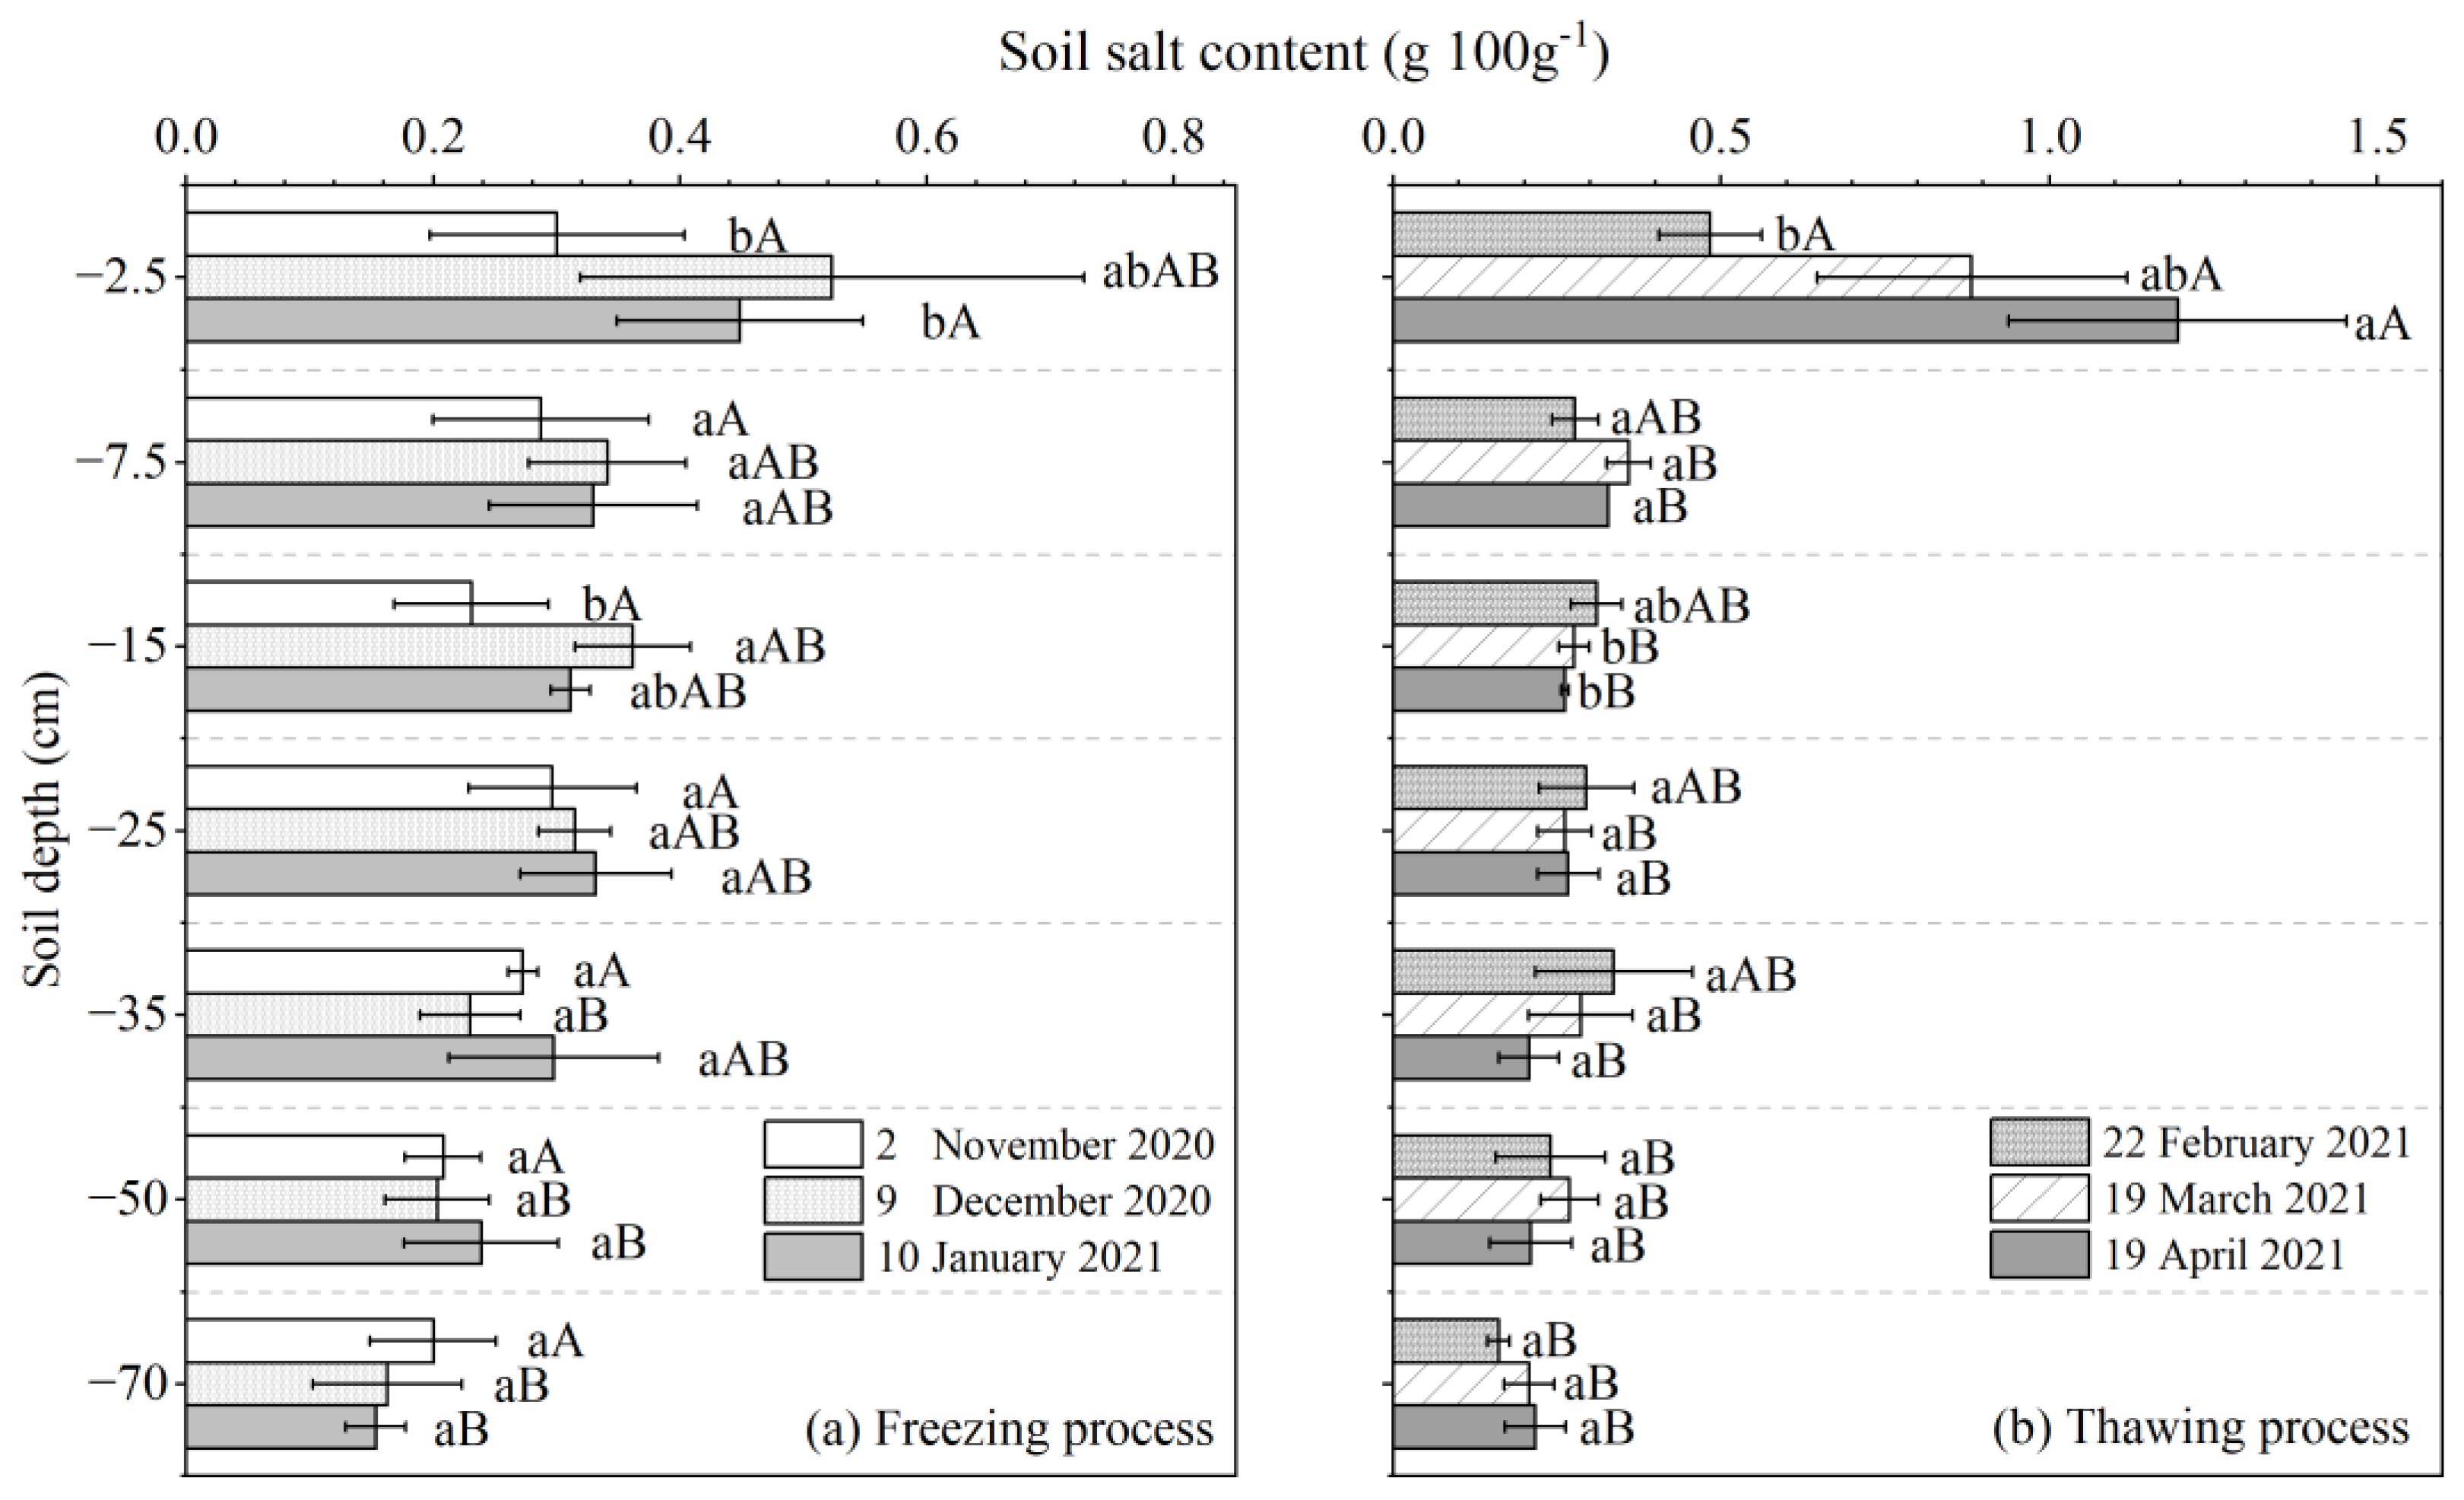
3.2.1. Change in SSC during the FT Process

The profiles of SSC at the depth of 0–80 cm are shown in Figure 4. Before freezing, the SSC of the surface layer (0–5 cm) was 0.300 g 100 g−1, and the average SSC of the section (0–80 cm) was 0.239 g 100 g−1, which was categorized as mild saline soil. The SSC value in different soil layers had no significant differences. During the freezing period, the most obvious changes in soil salt appeared in the 10–20 cm soil layer during T1–T2 (p < 0.05). During the thawing periods, the average SSC values of 0–5 cm significantly increased by 147.25% during T4–T6 (p < 0.05). After the entire FT process, although the average SSC of 0–80 cm was 0.268 g 100 g−1, which was categorized as slightly saline soil, the SSC of the topsoil (0–5 cm) reached 1.145 g 100 g−1, with an increase of 298.61% over the initial situation, which was categorized as salinized soil. Regarding the vertical distribution, the SSC of the topsoil (0–5 cm) was 4.48 times that of the 5–80 cm soil and decreased with the soil depth.

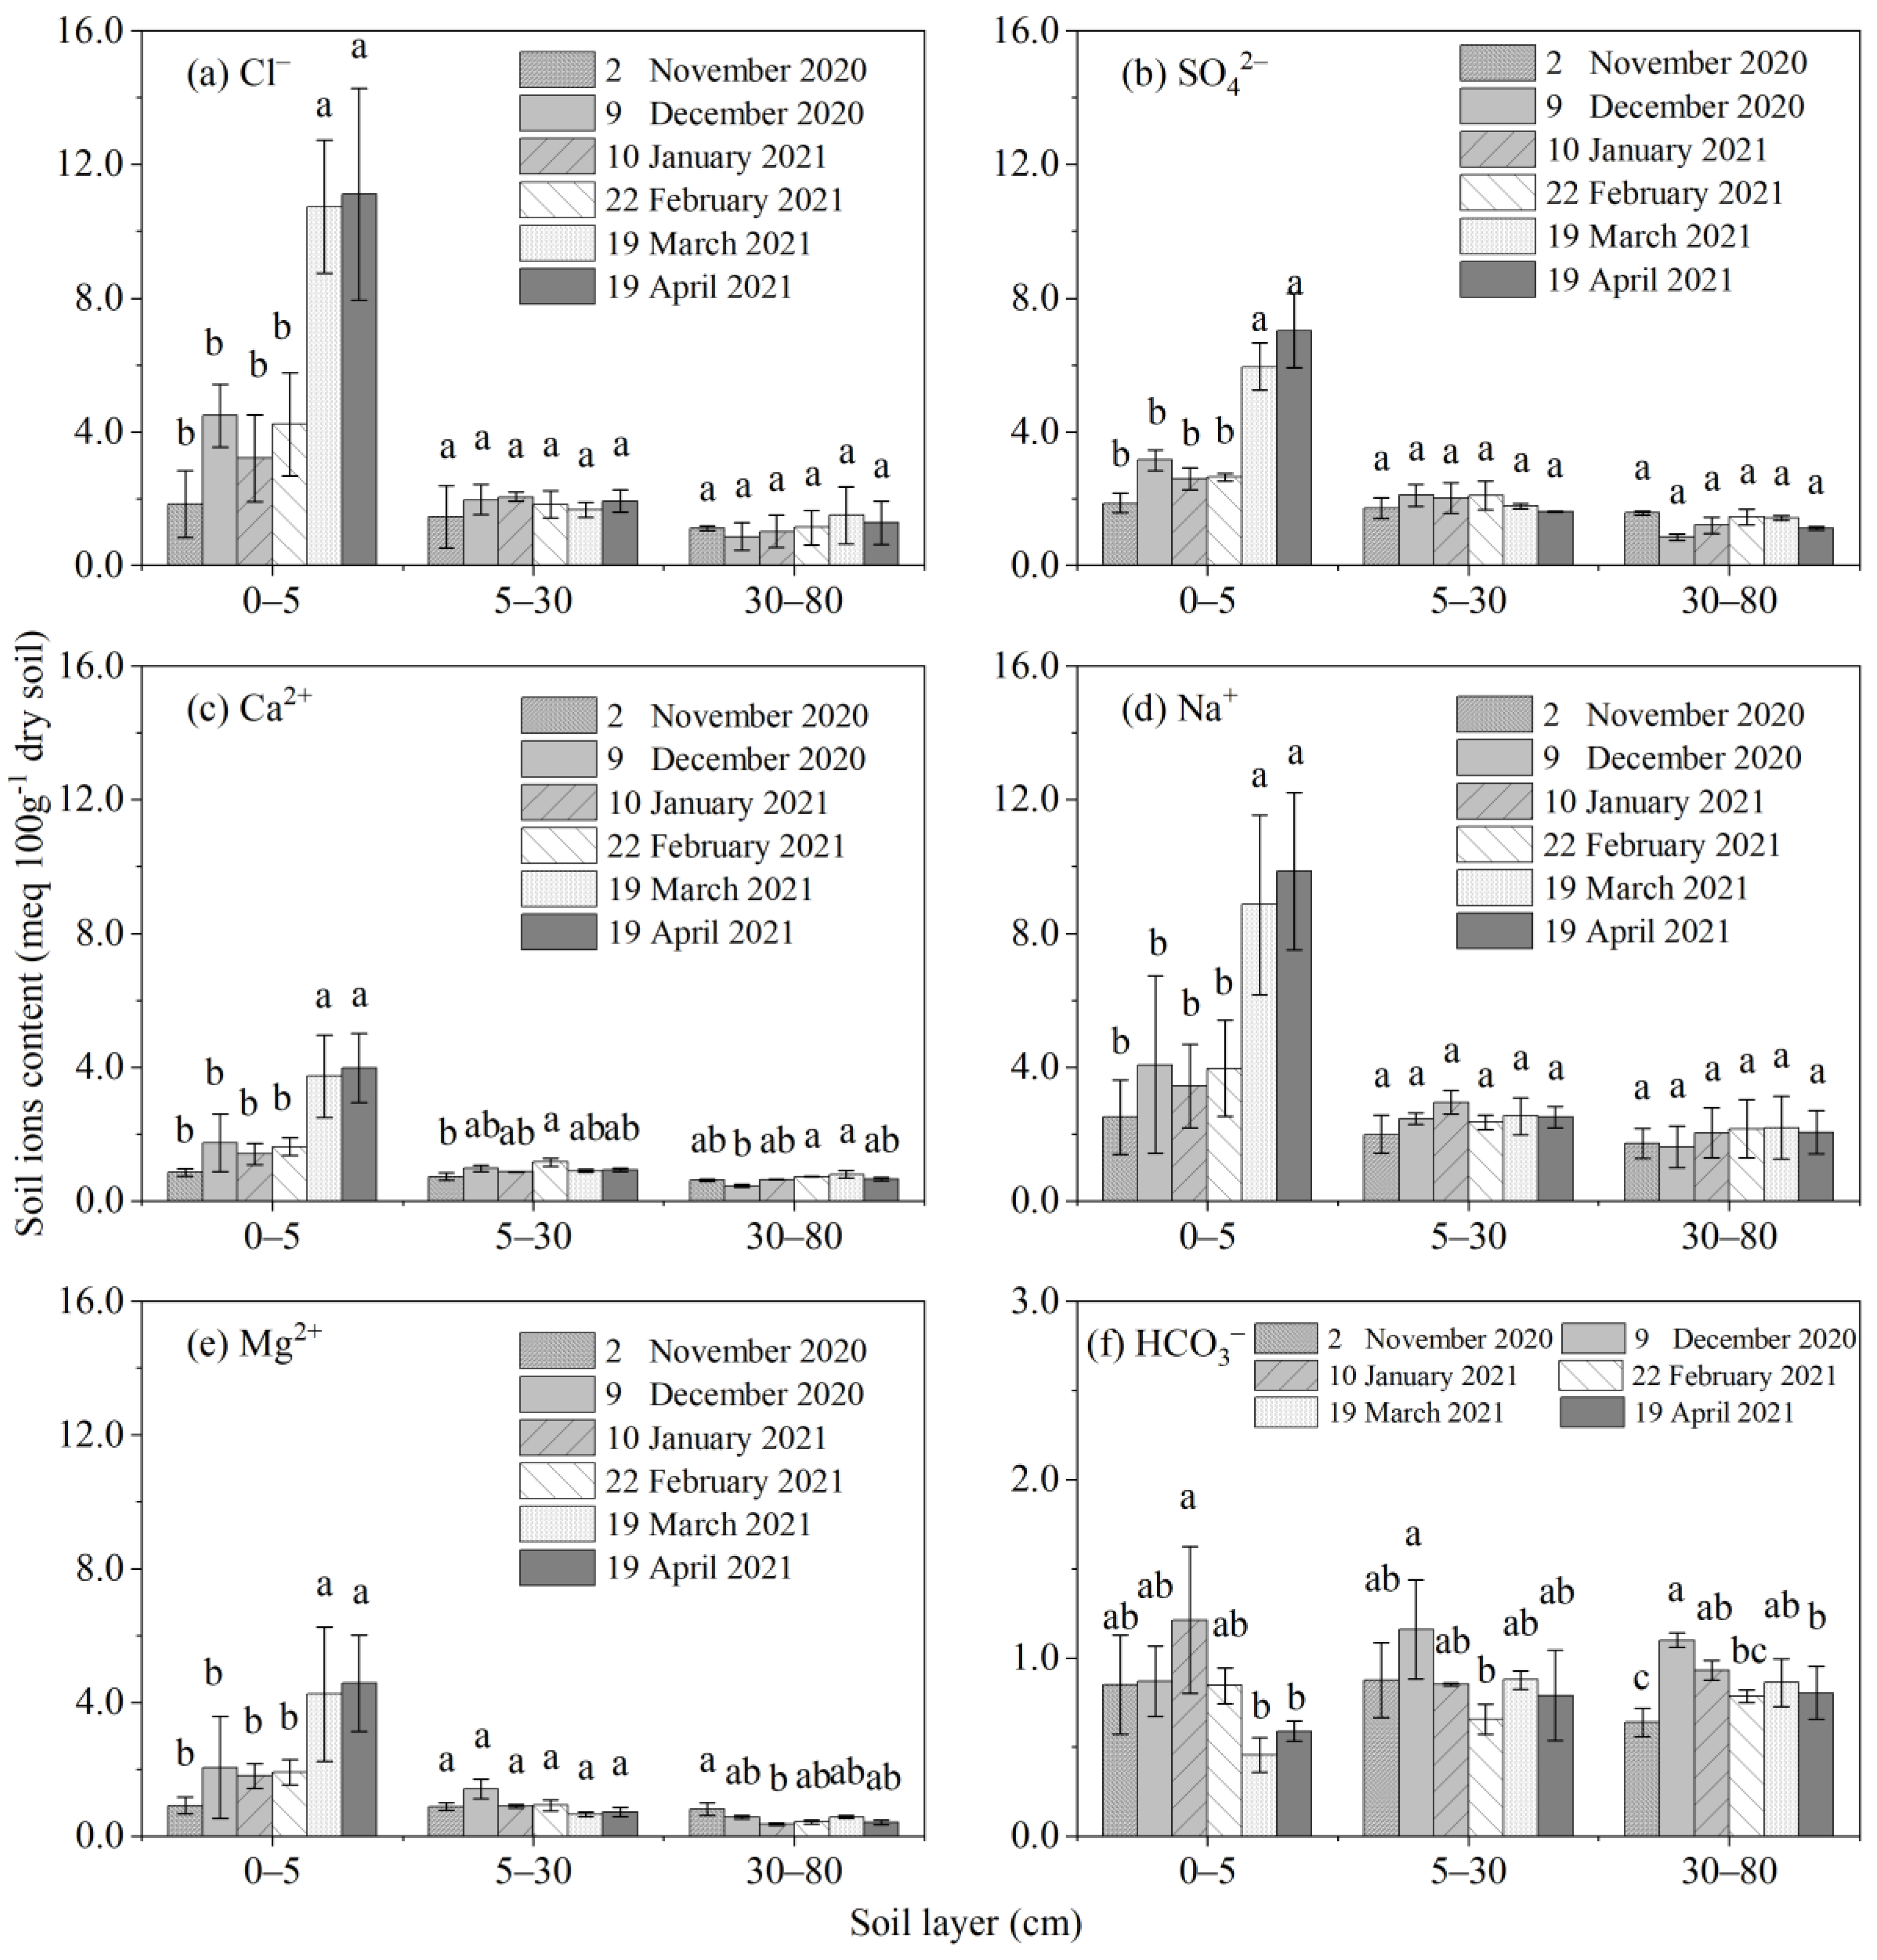
3.2.2. Changes in Salt Ion Content during the FT Process

The changes in the soil ion contents in different soil layers during the FT process are shown in Figure 5. The variation trends of five major soluble ions (Cl, Na+, SO42−, Mg2+, and Ca2+) in different soil layers were similar (Figure 5a–e), with only differences in change values. During the freezing period, these five ions moved upward and accumulated in the frozen layer (0–30 cm) and decreased in the unfrozen layer (30–80 cm) in the early freezing period (T1–T2). These five ions then migrated downward, which caused their concentrations to decrease in the 0–5 cm soil layer and increase in the newly frozen layer (30–80 cm) during the stable freezing period (T2–T3). But the variations of these ions during the freezing period were not significant (p > 0.05). During the thawing period (T3–T6), the contents of Cl, Na+, SO42−, Mg2+, and Ca2+ in the 0–5 cm soil layer continued to increase, especially in the T4–T5 period, during which these ions increased by 148.37%, 136.07%, 113.91%, 110.99%, and 94.44%, respectively, showing explosive increases (p < 0.05). After the FT process (T6), the contents of Cl, Mg2+, Ca2+, Na+, and SO42− in the 0–5 cm soil layer increased by 563.41%, 396.52%, 342.97%, 321.39%, and 276.74%, respectively, compared to the initial value (T1). In the 5–80 cm soil layer, the concentrations of these five soluble ions did not change significantly.
The changes of HCO3 content in different soil layers are shown in Figure 5f. At the early stage of freezing, the HCO3 concentration significantly increased by 71.92% in the 30–80 cm unfrozen layer, where other ions remained stable. During stages T2–T3, HCO3 increased by 39.92% in the 0–5 cm soil layer, and decreased by 15.37% in the 30–80 cm soil layer, but the variations were not significant (p > 0.05). During thawing period (T3–T6), HCO3 significantly decreased by 51.43% in the 0–5 cm soil layer (p < 0.05) where other ions significantly increased. After freezing and thawing, the HCO3 content in the 0–5 cm soil layer decreased by 30.64% compared with the initial content.
As a result, the FT process greatly altered the distribution pattern of different ions (Figure 6). Before freezing, the spatial variation coefficients of each ion were between 0.16–0.27, indicating that the ion distribution was relatively uniform between different soil layers. However, the spatial variation coefficients of most ions (except for HCO3) increased to 0.89–1.31 following the FT process, which was mostly induced by the obvious increase of ions in the 0–5 cm soil layer.

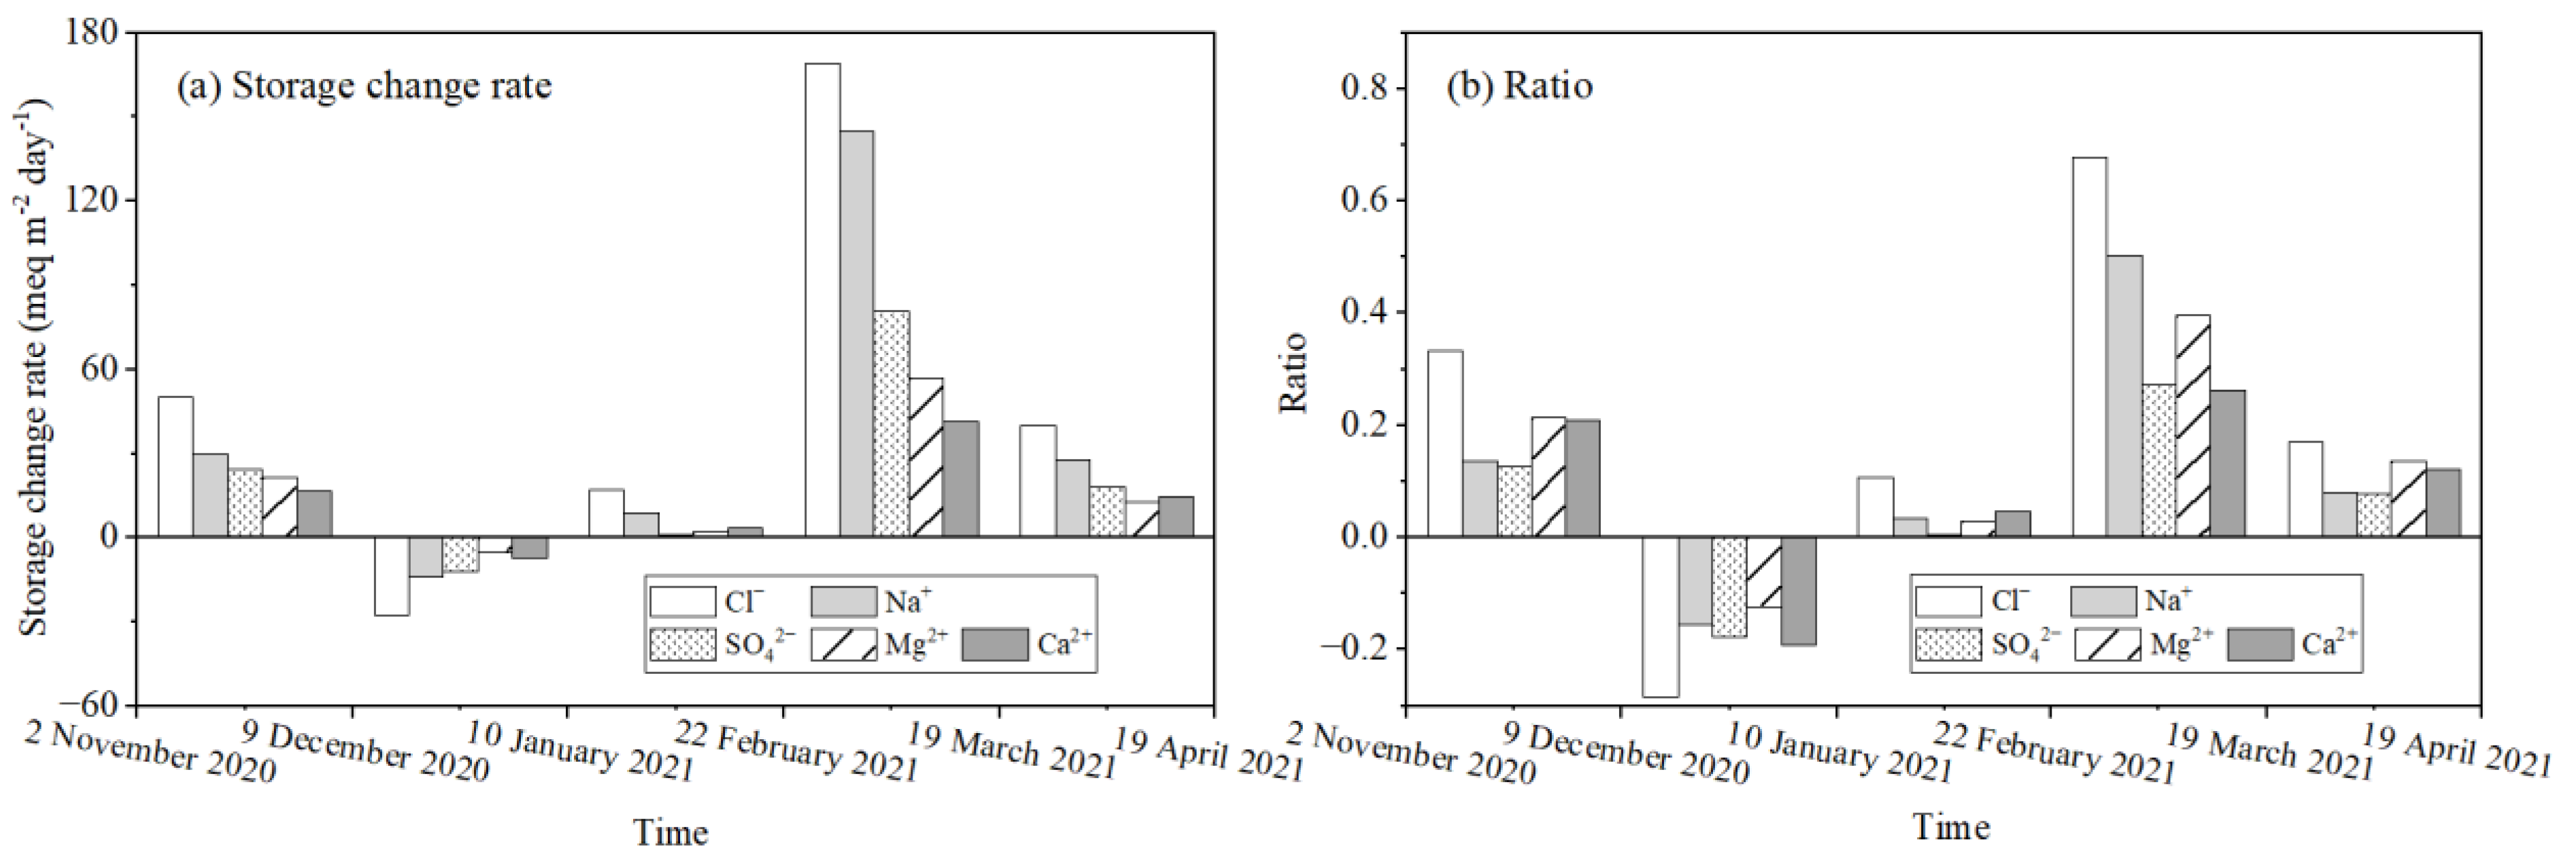
3.2.3. Migration Inconsistencies in Soil Salt Ions during the FT Process

The storage change rates of five ions (in addition to HCO3) at the 0–5 cm soil layer during different periods are shown in Figure 7a. In the whole FT period, Cl and Na+ were the ions with the largest storage change rate, followed by SO42−, Mg2+, and Ca2+.
However, the storage change rates of ions were induced by the combined effect of ion mobility and ion content in different soil layers. Therefore, the ratio of the ion increases (II) in the 0–5 cm soil layer to the ion storage (IS) in the 5–80 cm soil layer during the previous stage (II(0–5)/IS(5–80)) was used as an index to evaluate the ion migration ability when the ions moved upward (T1–T2, T3–T4, T4–T5, and T5–T6). The index was changed to the ratio of the reduction (ID) of the ion storage in the 0–5 cm soil layer to the ion storage in the previous stage in the 0–5 cm layer (II(0–5)/IS(0–5)) when the ion storage in the 0–5 cm soil layer decreased T2–T3. Ions with larger ratio had stronger migration ability. The migration abilities of different ions (IR(0–5)/IR(5–80 or 0–5)) are shown in Figure 7b, and rank in order as Cl > Mg2+/Ca2+/Na+ and SO42−. Cl was always the ions with the strongest migration ability, while SO42− with weakest migration ability (expect P2–P3). The order of cations varied in different periods; for example, the order of cations was Mg2+ > Ca2+ > Na+ in the T1–T2 and T5–T6 periods, and Na+ > Mg2+ > Ca2+ in the T4–T5 period.

3.3. Change in Soil Salinization during the FT Process

The proportions of soil cations and anions are shown in Table 2. Initially, the order of cation ions in each layer of soil was Na+ > Mg2+ > Ca2+ > K+, accounting for 50.32–56.89%, 20.69–29.68%, 17.27–20.75%, and 1.85–5.85% of the total amount of cations, respectively. The order of anions in the soil was SO42− > Cl > HCO3, accounting for 40.77–48.02%, 29.86–40.42%, and 15.85–25.37% of the total anions, respectively. After the soil freezing process, the proportions of Cl and Mg2+ in 0–5 cm soil layer were increased to 45.79% and 26.35%, respectively, while the proportions of SO42− and Na+ were decreased to 36.91% and 50.41%, respectively. After the soil FT process, the order of anions in each soil layer changed to Cl > SO42− > HCO3. With the increase of depth, the proportion of HCO3 gradually increased from 3.14% to 31.89%, while the proportion of Cl gradually decreased from 63.52% to 36.66%, and the proportion of SO42− was relatively stabilized between 31% and 40%. The FT process also changed the composition of cations in soil. As the depth increased, the proportion of Na+ increased from 54.71% to 66.36%, the proportion of Mg2+ decreased from 23.71% to 12.14%, and the proportion of Ca2+ stabilized between 20% and 25%.

3.4. Changes in Soil Alkalization Parameters during the FT Process

The changes in the soil SAR and pH values during the FT process are shown in Table 3.
Before soil freezing, the SARs of different soil layers varied from 2.62 to 3.76, with an average of 3.00. During the freezing process, SAR values significantly increased in the frozen soil layer (20–40 cm) (p < 0.05). At the stable freezing stage (T3), SAR values in the 20–30 cm soil layer reached 4.89, or increase of 48.34% relative to T1. During the thawing process (T4–T6), the SAR values of the 0–5 cm soil layer increased by 69.42% (p < 0.05), but slightly decreased in the 10–80 cm soil layer (p > 0.05). At the end of the thawing process (T6), the SAR values of the 0–5 cm soil layer were 6.52, or increases of 71.73% relative to the initial values before freezing (p < 0.05).
Initially, the soil pH increased from 6.98 to 7.42 with the increase of soil depth, and the average pH was 7.29. During the initial freezing period, the soil pH value significantly increased in all soil layers (p < 0.05), reaching 7.71 in the frozen soil layers and 8.02 in the unfrozen layers on average. During the thawing period, the soil pH value increased slowly, but the differences were not significant (p > 0.05). At the end of FT process, the soil pH in different layers ranged from 8.27 to 8.58, and the average pH value was 8.48. FT process significantly increased the soil pH in all soil layers.

4. Discussion

4.1. Chemical Mechanisms of the Differences in Salt ion Migration during the FT Process

During the FT process, various ions were continuously redistributed along the vertical soil profile. This redistribution not only changed the amount of ions in different soil layers, but also altered the distribution patterns of ions. For example, most ions decreased with the soil depth after the FT process (except for HCO3) (Figure 6), while ion distribution was relatively uniform before the FT process (Figure 6, Table 2). This was because the temperature gradient during the freezing process and the strong evaporation during the thawing process caused the soil water to carry a large number of ions, resulting in their migration to the surface layer. The ions then decreased in the subsoil and accumulated in the topsoil (0–5 cm).
During different FT periods, the changes in the contents of Cl, Mg2+, Ca2+, Na+, and SO42− were similar, but the change ratios were distinctly different (Figure 7). For example, the five ions accumulated in the order of Cl > Mg2+ > Ca2+ > Na+ > SO42− during the initial freezing period (T1–T2); Cl > Na+ > Mg2+ > Ca2+ > SO42− during the late unstable thawing period (T4–T5); and Cl > Mg2+ > Ca2+ > Na+ > SO42− during the stable freezing period (T5–T6) (Figure 7). The FT process mainly affected the migration order of Na+, which was related to the formation of Na2SO4·10H2O. The reasons were that the soluble salt were mainly existed as Na2SO4 and NaCl in the soil, because the proportion of Na+, Mg2+, Ca2+ to cations were about 50–67% and 21–29, 17–20%, and the proportion of SO42−, Cl, HCO3 to anions were 40.77–48.02%, 29.86–40.42%, and 15.85–25.37%, respectively (Table 2). During the freezing period, the decrease of soil temperature led to the formation of ice crystals and reduced the soil liquid water content. Ions were separated out of the frozen water and enriched in the remaining unfrozen water, increasing the ion concentration of the solution. The solubility of Na2SO4 was much lower than chloride, so more Na2SO4·10H2O was formed and then crystallized and precipitated out of the soil solution (Table 4). Besides, the solubility of Na2SO4 decreased rapidly with decreasing temperature, while the solubility of other salt such as CaSO4 varies little with temperature [33,50]. These effects further decreased the Na+ and SO42− ions in the soil solution that could migrate with soil water (Table 4). During the initial thawing period (T4–T5), the soil temperature rose above 0 °C and the increased liquid water from melting ice crystals led to the dissolution of the precipitation of Na2SO4·10H2O in the thawed soil layer (Table 4). Under these conditions, the mobility of Na+ was strongly improved because it had a lower affinity with soil colloids due to the smaller ionic radius and a lower positive charge compared with Ca2+ and Mg2+ [27]. This finding was similar to the findings of Guo and Liu et al. [51], who suggested that the mobilization order of cations was Na+ > Mg2+ > Ca2+ in saline ice during the soil melting process. However, as the thawing process progressed further, the mobility of Na+ was relatively decreased, which was related to the cation exchange processes. As shown in Table 5, the CEC of soil accounted for more than 53.18% of the total soluble cation, so. the exchange capacity of Na+ would be enhanced due to the significant accumulation of Na+ [28], which converted partially soluble Na+ into exchangeable Na and increased the soluble Ca2+ and Mg2+ contents. Therefore, the change of Na+ content was not only determined by the migration of free Na+, but was also strongly affected by several chemical reactions, such as precipitation–dissolution, cation adsorption, and cation exchange. Soil temperature, which controlled the occurrence and intensity of these chemical processes, was the controlling factor of the Na+ migration order during the soil FT process.
Cl and SO42− were the ions with the largest and smallest migration order, respectively, during the entire FT process (Figure 7). According to the correlation analysis, the change of Cl content was strongly positively correlated with soil moisture, indicating that the movement of Cl was mainly affected by soil water and less affected by other chemical reactions. For example, Cl migrated more freely compared with cations because Cl was repelled by soil colloids owing to its negative charge [52]. Compared with SO42− in frozen soil, the main chlorides, such as NaCl, MgCl2, and CaCl2, did not crystallize and precipitate as their solubility did not change significantly with decreasing temperature [33]. Compared with SO42− in thawed soil, Cl did not participate in the precipitation–dissolution of CaSO4, and it was subject to greater electrostatic repulsion force due to soil colloids because of the smaller half valence shell of the hydrated ions [53].
The change of HCO3 content differed from the patterns exhibited by Cl, Mg2+, Ca2+, Na+, and SO42−. For example, the content of HCO3 decreased when other ions accumulated in the 0–5 cm soil layer during the T1–T2 and T4–T5 periods, and the content of HCO3 increased when other ion contents reduced in the 30–80 cm soil layer during T1–T2 and in the 0–5 cm soil layer during T2–T3. According to the correlation analysis (Figure 8), the concentration of HCO3 was negatively correlated with Ca2+ (p < 0.05), followed by SO42−, while had no significant correlation with soil moisture and other ions. This phenomenon may be partly attributed to the precipitation–dissolution of CaCO3 [27].

4.2. Effects of Ion Migration Differences on Soil Salt Composition

The redistribution process of ions induced by the FT process greatly adjusted the ion composition distribution patterns, which is a more effective indicator to measure the impact of salinity on crop growth than the soil total salt according to the theory of single ion toxicity [54,55]. After the FT process, in the 0–80 cm soil layer, as soil depth increased, the proportions of Cl and Mg2+ gradually decreased, the proportions of Na+ and HCO3 gradually increased, and the proportions of SO42− and Ca2+ remained relatively stable (Table 2), inducing the main salinization type to shift from sulfate-chloride to soda-sulfate-chloride (Table 2). The differences in distribution patterns of different ions were determined by the migration abilities of the ions. Ions with stronger mobility tended to be distributed in the upper soil layer, the ions with moderate mobility tended to be evenly distributed along the soil profile, and the ions with low mobility tended to accumulate in the subsoil layer.
In the 0–5 cm soil layer, where the salt content was of great significance to the germination and emergence of crops, the total salt and ions were at their highest concentrations after the FT process, and the proportion of Cl increased from 40.42% to 60.52%, resulting in the type of soil salinization shifting from chloride-sulfate to sulfate-chloride (Table 2). Thus, after the FT process, the topsoil was not only harmed by a high degree of salinization, but was also exposed to the toxicity of excess Cl, which could hinder the absorption of soil nutrients by crops and result in stunted growth [56,57]. The reason for this outcome was discussed above; with the exception of a slight decreasing trend in T2–T3, the contents of SO42− and Cl continued to accumulate at the slowest and fastest rates, respectively, leading to the gradual domination of Cl in terms of total anions. However, the dominant soil cation was always Na+ in topsoil, indicating that the FT process had a greater effect on soil anion composition than soil cation composition in this layer.
In this study, the freezing period lasted approximately 92 days (Figure 2), during which the proportion of Na+ in the topsoil (0–5 cm) gradually decreased from 55.85% to 50.41% (Table 2), as the cations accumulated in the order of Mg2+ > Ca2+ > Na+ (Figure 7). The thawing period lasted approximately 61 days (Figure 2), during which the proportion of Na+ gradually increased from 50.41% to 54.71% (Table 2) because the migration order shifted to Na+ > Mg2+ > Ca2+ (Figure 7). Thus, the freezing period tended to decrease the proportion of Na+ in the topsoil, while the thawing period tended to increase the proportion of Na+. These contrasting effects offset each other and maintained the stability of the Na+ proportion and cation composition in the present study. Previous studies have shown that the soil freezing period is growing shorter and the soil thawing period has been advancing in northern China owing to the gradual increase of winter temperature under climate change [58,59,60]. As discussed above, the migration ability of Na+ was inhibited during the freezing process and recovered during the thawing process. Thus, it can be predicted that, under the influence of climate change, more Na+ will migrate to the topsoil and the proportion of Na+ in the total topsoil cations will increase after the FT process. Because Na+ and Cl are the most harmful ions for crop growth and soil structure [61], northern China faces the risk of ion imbalance during sowing in spring.

4.3. Effects of Ion Migration Differences on Soil Alkalization Parameters

Soil SAR and pH values are important indicators that can be used to judge the soil alkalization degree [62,63]. In this study, the soil FT process induced increases of the soil SAR and pH values, particularly in the 0–5 cm soil layer (Table 3), which changed from having no alkalization risk to slightly alkaline and close to the critical value that is harmful to crops. According to previous research, the change of the soil alkalization index was strongly related to the change of ions [64]. As SAR was calculated from Na+, Ca2+ and Mg2+ as shown in Formula (1), it was significant positively correlated with Na+ (p < 0.01) and negatively correlated with Ca2+ and Mg2+ (p > 0.05) during the FT process (Figure 9). The positive relationship between SAR and Cl and SO42− were the results of their synchronized migration of Na+. Therefore, Na+ was the key ion influenced the change of soil alkalization level [42].
Increasing pH was mainly caused by the hydrolysis of alkaline carbonate and exchangeable Na+ [63]. During the freezing period, pH had a strong positive correlation with HCO3, while the positive correlation with Na+ was lower (Figure 9), indicating that the change of pH was determined by HCO3 rather than Na+, as some Na+ was precipitated out of the soil solution in the form of Na2SO4·10H2O crystallization induced by low temperature (Table 4). During the thawing period, the correlation coefficient between pH and HCO3 decreased to 0.61 (p < 0.01), and that between pH and Na+ increased to 0.39 (p < 0.05), indicating that the change of pH was affected by both HCO3 and Na+. For example, in the thawed soil layer, the complete dissolution of Na2SO4·10H2O induced by the rising soil temperature increased the free Na+ in soil solution, resulting in an increase of the content of exchangeable Na [28], which in turn increased the soil pH. However, as discussed in 4.1, the HCO3 content was negatively correlated with Na+. Thus, the explosive accumulation of Na+ was accompanied by a decrease in the HCO3 content, which tended to decrease the soil pH value. These two different effects caused the soil pH to shift in opposite directions and finally led to a stable pH in the thawed soil layer.

5. Conclusions

Based on a field observation conducted from November 2020 to April 2021, the ions transport characteristics during the freeze–thaw (FT) process were investigated, and their effects on the evolution of soil salinization chemical properties were evaluated.
(1)
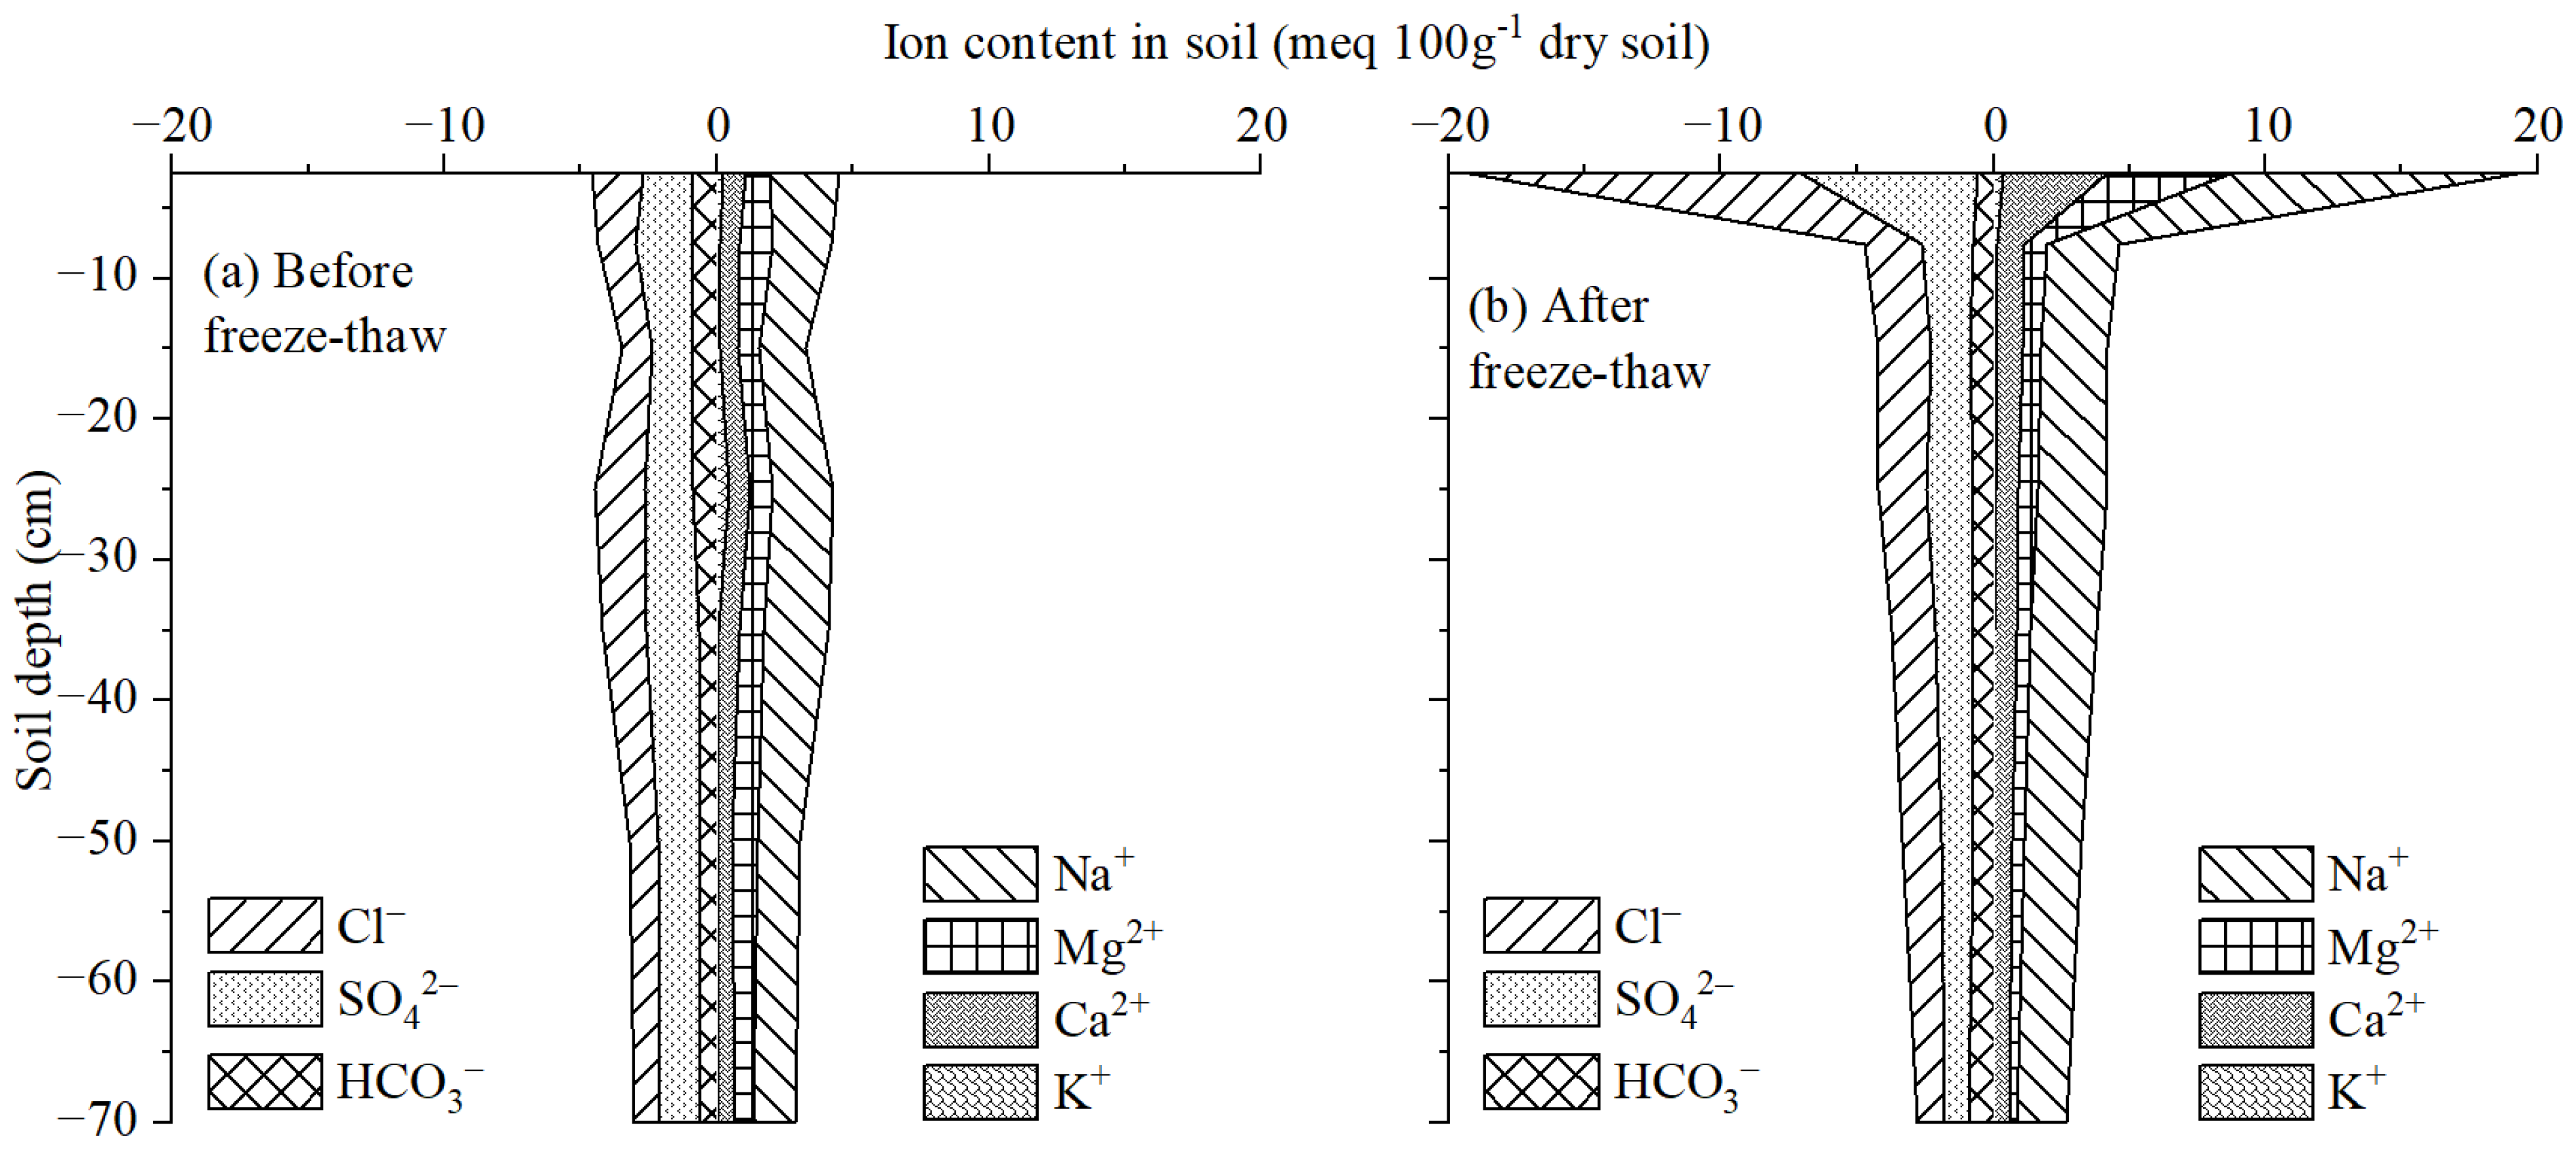
During the FT process, the dynamics of ions showed that Cl, Mg2+, Ca2+, Na+, and SO42− accumulated in the frozen soil during the freezing period, and gathered in the topsoil (0–5 cm) during the thawing period, while the change of HCO3 content was mostly opposite to the changes in these ions.
(2)
Cl and SO42− exhibited the strongest and weakest migration ability, respectively. The migration ability of cations was in the order of Mg2+ > Ca2+ > Na+ during the freezing period and Na+ > Mg2+ > Ca2+ during the thawing period because the mobility of Na+ was restrained by the negative soil temperature due to the formation and precipitation of Na2SO4·10H2O.
(3)
As the result of the ions migration inconsistencies, the main salt anions changed from sulfate to chloride. The soil alkalization degree of 0–5 cm soil increased from no alkalization risk to slightly alkaline mainly due to the accumulation of Na+. The topsoil in saline areas was endangered by high salinization, excess Cl toxicity, and a potential alkalization threat after the FT process.

Author Contributions

Y.L.: conceptualization, investigation, methodology, and writing—original draft. J.W.: methodology, resources, writing—review & editing, and funding acquisition. H.Z.: investigation. C.L.: investigation. J.M.: investigation. R.Z.: investigation. J.L.: investigation. Q.Z.: methodology, investigation, writing—review & editing, and funding acquisition. All authors have read and agreed to the published version of the manuscript.

Funding

This work was jointly supported by the National Natural Science Foundation of China (Nos. 51790532 and 52109063), the Fundamental Research Funds for the Central Universities (No. 2042021kf0052), and the National Key Research and Development Program of China (No. 2021YFD1900804).

Data Availability Statement

The datasets generated during and/or analysed during the current study are not publicly available due to the confidential nature of the data but are available from the corresponding author on reasonable request.

Conflicts of Interest

The authors declare no conflict of interest.

References

  1. Wu, M.; Huang, J.; Wu, J.; Tan, X.; Jansson, P.E. Experimental study on evaporation from seasonally frozen soils under various water, solute and groundwater conditions in Inner Mongolia, China. J. Hydrol. 2016, 535, 46–53. [Google Scholar] [CrossRef]
  2. Ma, D.; He, Z.; Wang, L.; Zhao, Q.; Chen, L.; Lin, P.; Zhao, P. Soil water and salt migration in oasis farmland during crop growing season. J. Soils Sediments 2023, 23, 355–367. [Google Scholar] [CrossRef]
  3. Han, M.; Wang, Q.; Han, Y.; Fu, H.; Shen, J.; Liu, Y. Description of different cracking processes affecting dispersive saline soil slopes subjected to the effects of frost and consequences for the stability of low slopes. B Eng. Geol. Environ. 2022, 81, 75. [Google Scholar] [CrossRef]
  4. Shahbaz, M.; Ashraf, M. Improving Salinity Tolerance in Cereals. Crit. Rev. Plant Sci. 2013, 32, 237–249. [Google Scholar] [CrossRef]
  5. Zhaoyong, Z.; Abuduwaili, J.; Yimit, H. The occurrence, sources and spatial characteristics of soil salt and assessment of soil salinization risk in Yanqi Basin, Northwest China. PLoS ONE 2014, 9, e106079. [Google Scholar] [CrossRef] [PubMed]
  6. Wang, Z.; Tan, W.; Yang, D.; Zhang, K.; Zhao, L.; Xie, Z.; Xu, T.; Zhao, Y.; Wang, X.; Pan, X.; et al. Mitigation of soil salinization and alkalization by bacterium-induced inhibition of evaporation and salt crystallization. Sci. Total Environ. 2021, 755, 142511. [Google Scholar] [CrossRef]
  7. Wu, M.; Wu, J.; Tan, X.; Huang, J.; Jansson, P.E.; Zhang, W. Simulation of dynamical interactions between soil freezing/thawing and salinization for improving water management in cold/arid agricultural region. Geoderma 2019, 338, 325–342. [Google Scholar] [CrossRef]
  8. Hou, R.; Li, T.; Fu, Q.; Liu, D.; Li, M.; Zhou, Z.; Li, L.; Yan, J. Characteristics of water–heat variation and the transfer relationship in sandy loam under different conditions. Geoderma 2019, 340, 259–268. [Google Scholar] [CrossRef]
  9. Kokelj, S.V.; Burn, C.R. Ground ice and soluble cations in near-surface permafrost, Inuvik, Northwest Territories, Canada. Permafr. Periglac. Process. 2003, 14, 275–289. [Google Scholar] [CrossRef]
  10. Ferguson, H.; Brown, P.L.; Dickey, D.D. Water movement and loss under frozen soil conditions. Soil Sci. Soc. Am. J. 1964, 28, 700–703. [Google Scholar] [CrossRef]
  11. Liu, J.; Yang, P.; Yang, Z. Water and salt migration mechanisms of saturated chloride clay during freeze-thaw in an open system. Cold Reg. Sci. Technol. 2021, 186, 103277. [Google Scholar] [CrossRef]
  12. Hou, R.; Li, T.; Fu, Q.; Liu, D.; Li, M.; Zhou, Z.; Yan, J.; Zhang, S. Research on the distribution of soil water, heat, salt and their response mechanisms under freezing conditions. Soil Till. Res. 2020, 196, 104486. [Google Scholar] [CrossRef]
  13. Wan, X.; Gong, F.; Qu, M.; Qiu, E.; Zhong, C. Experimental Study of the Salt Transfer in a Cold Sodium Sulfate Soil. KSCE J. Civ. Eng. 2019, 23, 1573–1585. [Google Scholar] [CrossRef]
  14. Zhang, D.; Wang, S. Mechanism of FT action in the process of soil salinization in northeast China. Environ. Geol. 2001, 41, 96–100. [Google Scholar] [CrossRef]
  15. Bing, H.; He, P.; Zhang, Y. Cyclic freeze–thaw as a mechanism for water and salt migration in soil. Environ. Earth Sci. 2015, 74, 675–681. [Google Scholar] [CrossRef] [Green Version]
  16. Fu, Q.; Hou, R.; Li, T.; Wang, M.; Yan, J. The functions of soil water and heat transfer to the environment and associated response mechanisms under different snow cover conditions. Geoderma 2018, 325, 9–17. [Google Scholar] [CrossRef]
  17. Vrbka, L.; Jungwirth, P. Brine Rejection from Freezing Salt Solutions: A Molecular Dynamics Study. Phys. Rev. Lett. 2005, 95, 148501. [Google Scholar] [CrossRef] [Green Version]
  18. Wu, D.; Zhou, X.; Jiang, X. Water and Salt Migration with Phase Change in Saline Soil during Freezing and Thawing Processes. GroundWater 2018, 56, 742–752. [Google Scholar] [CrossRef]
  19. Nagare, R.M.; Schincariol, R.A.; Quinton, W.L.; Hayashi, M. Effects of freezing on soil temperature, freezing front propagation and moisture redistribution in peat: Laboratory investigations. Hydrol. Earth Syst. Sc. 2012, 16, 501–515. [Google Scholar] [CrossRef] [Green Version]
  20. Wang, L.; Seki, K.; Miyazaki, T.; Ishihama, Y. The causes of soil alkalinization in the Songnen Plain of Northeast China. Paddy Water Environ. 2009, 7, 259–270. [Google Scholar] [CrossRef]
  21. Chuvilin, E.M. Migration of ions of chemical elements in freezing and frozen soils. Polar. Rec. 1999, 35, 59–66. [Google Scholar] [CrossRef]
  22. Wang, M.; Zhu, Y.; Zhao, T.; Cui, L.; Mao, W.; Ye, M.; Wu, J.; Yang, J. Chemical characteristics of salt migration in frozen soils during the freezing-thawing period. J. Hydrol. 2021, 606, 127403. [Google Scholar] [CrossRef]
  23. Zhao, X.; Xia, J.; Chen, W.; Chen, Y.; Fang, Y.; Qu, F. Transport characteristics of salt ions in soil columns planted with Tamarix chinensis under different groundwater levels. PLoS ONE 2019, 14, e0215138. [Google Scholar] [CrossRef] [PubMed] [Green Version]
  24. Kong, X.; Jiang, X.; Xue, S.; Huang, L.; Hartley, W.; Wu, C.; Li, X. Migration and distribution of saline ions in bauxite residue during water leaching. Trans. Nonferrous Met. Soc. China 2018, 28, 534–541. [Google Scholar] [CrossRef]
  25. Van Eynde, E.; Dondeyne, S.; Isabirye, M.; Deckers, J.; Poesen, J. Impact of landslides on soil characteristics: Implications for estimating their age. CATENA 2017, 157, 173–179. [Google Scholar] [CrossRef]
  26. Semenkov, I.N.; Konyushkova, M.V. Geochemical partition of chemical elements in Kastanozems and Solonetz in a local catchment within a semiarid landscape of SW Russia. CATENA 2022, 210, 105869. [Google Scholar] [CrossRef]
  27. Zhang, T.; Zhan, X.; He, J.; Feng, H.; Kang, Y. Salt characteristics and soluble cations redistribution in an impermeable calcareous saline-sodic soil reclaimed with an improved drip irrigation. Agric. Water Manag. 2018, 197, 91–99. [Google Scholar] [CrossRef]
  28. Jiao, H.; Sheng, Y.; Zhao, C.; Li, B. Modeling of multiple ions coupling transport for salinized soil in oasis based on COMSOL. Trans. Chin. Soc. Agric. Eng. 2018, 34, 100–107. (In Chinese) [Google Scholar] [CrossRef]
  29. Qadir, M.; Steffens, D.; Yan, F.; Schubert, S. Sodium removal from a calcareous saline–sodic soil through leaching and plant uptake during phytoremediation. Land Degrad. Dev. 2003, 14, 301–307. [Google Scholar] [CrossRef]
  30. Clarke, C.E.; Vermooten, M.; Watson, A.; Hattingh, M.; Miller, J.A.; Francis, M.L. Downward migration of salts in termite-affected soils: Implications for groundwater salinization. Geoderma 2022, 413, 115747. [Google Scholar] [CrossRef]
  31. Chen, L.; Li, C.; Feng, Q.; Wei, Y.; Zhao, Y.; Zhu, M.; Deo, R. Direct and indirect impacts of ionic components of saline water on irrigated soil chemical and microbial processes. CATENA 2019, 172, 581–589. [Google Scholar] [CrossRef]
  32. Zong, R.; Han, Y.; Tan, M.; Zou, R.; Wang, Z. Migration characteristics of soil salinity in saline-sodic cotton field with different reclamation time in non-irrigation season. Agric. Water Manag. 2022, 263, 107440. [Google Scholar] [CrossRef]
  33. Xu, X.; Wang, J.; Zhang, L. Permafrost Physics; Science Press: Beijing, China, 2001. [Google Scholar]
  34. Bai, R.; Lai, Y.; Zhang, M.; Yu, F. Theory and application of a novel soil freezing characteristic curve. Appl. Therm. Eng. 2018, 129, 1106–1114. [Google Scholar] [CrossRef]
  35. Hu, G.; Zhao, L.; Zhu, X.; Wu, X.; Wu, T.; Li, R.; Xie, C.; Hao, J. Review of algorithms and parameterizations to determine unfrozen water content in frozen soil. Geoderma 2020, 368, 114277. [Google Scholar] [CrossRef]
  36. Cary, J.W.; Mayland, H.F. Salt and water movement in unsaturated frozen soil. Soil Sci. Soc. Am. J. 1972, 36, 549–555. [Google Scholar] [CrossRef]
  37. Irakoze, W.; Prodjinoto, H.; Nijimbere, S.; Bizimana, J.B.; Bigirimana, J.; Rufyikiri, G.; Lutts, S. NaCl- and Na2SO4-Induced Salinity Differentially Affect Clay Soil Chemical Properties and Yield Components of Two Rice Cultivars (Oryza sativa L.) in Burundi. Agronomy 2021, 11, 571. [Google Scholar] [CrossRef]
  38. Zhang, Z.; Feng, S.; Luo, J.; Hao, B.; Diao, F.; Li, X.; Jia, B.; Wang, L.; Bao, Z.; Guo, W. Evaluation of Microbial Assemblages in Various Saline-Alkaline Soils Driven by Soluble Salt Ion Components. J. Agric. Food Chem. 2021, 69, 3390–3400. [Google Scholar] [CrossRef]
  39. Luo, J.; Yang, F.; Wang, Y.; Ya, Y.; Deng, W.; Zhang, X.; Liu, Z. Mechanism of soil sodification at the local scale in Songnen Plain, northeast China, as affected by shallow groundwater table. Arid. Land Res. Manag. 2011, 25, 234–256. [Google Scholar] [CrossRef]
  40. Qin, Y.; Bai, Y.; Chen, G.; Liang, Y.; Li, X.; Wen, B.; Lu, X.; Li, Z. The effects of soil freeze–thaw processes on water and salt migrations in the western Songnen Plain, China. Sci. Rep. 2021, 11, 3888. [Google Scholar] [CrossRef]
  41. Chen, Y.; Xia, J.; Zhao, X.; Zhuge, Y. Soil moisture ecological characteristics of typical shrub and grass vegetation on Shell Island in the Yellow River Delta, China. Geoderma 2019, 348, 45–53. [Google Scholar] [CrossRef]
  42. Guo, K.; Liu, X. Reclamation effect of freezing saline water irrigation on heavy saline-alkali soil in the Hetao Irrigation District of North China. CATENA 2021, 204, 105420. [Google Scholar] [CrossRef]
  43. Litskas, V.D.; Aschonitis, V.G.; Lekakis, E.H. Antonopoulos VZ Effects of land use and irrigation practices on Ca, Mg, K, Na loads in rice-based agricultural systems. Agric. Water Manag. 2014, 132, 30–36. [Google Scholar] [CrossRef]
  44. USDA. 1938. Available online: http://www.nrcs.usda.gov (accessed on 12 November 2022).
  45. Cui, X.; Han, W.; Zhang, H.; Cui, J.; Ma, W.; Zhang, L.; Li, G. Estimating soil salinity under sunflower cover in the Hetao Irrigation District based on unmanned aerial vehicle remote sensing. Land Degrad. Dev. 2022, 34, 84–97. [Google Scholar] [CrossRef]
  46. Wang, D.; Chen, H.; Wang, Z.; Ma, Y. Inversion of soil salinity according to different salinization grades using multi-source remote sensing. Geocarto Int. 2020, 1, 1274–1293. [Google Scholar] [CrossRef]
  47. Yin, X.; Feng, Q.; Li, Y.; Liu, W.; Zhu, M.; Xu, G.; Zheng, X.; Sindikubwabo, C. Induced soil degradation risks and plant responses by salinity and sodicity in intensive irrigated agro-ecosystems of seasonally-frozen arid regions. J. Hydrol. 2021, 603, 127036. [Google Scholar] [CrossRef]
  48. Xu, J.; Lan, W.; Ren, C.; Zhou, X.; Wang, S.; Yuan, J. Modeling of coupled transfer of water, heat and solute in saline loess considering sodium sulfate crystallization. Cold Reg. Sci. Technol. 2021, 189, 103335. [Google Scholar] [CrossRef]
  49. Wu, M.; Tan, X.; Huang, J.; Wu, J.; Jansson, P.E. Solute and water effects on soil freezing characteristics based on laboratory experiments. Cold Reg. Sci. Technol. 2015, 115, 22–29. [Google Scholar] [CrossRef]
  50. Shen, L.; Sippola, H.; Li, X.; Lindberg, D.; Taskinen, P. Thermodynamic Modeling of Calcium Sulfate Hydrates in the CaSO4-H2O System from 273.15 to 473.15 K with Extension to 548.15 K. J. Chem. Eng. Data 2019, 64, 2697–2709. [Google Scholar] [CrossRef] [Green Version]
  51. Guo, K.; Liu, X. Dynamics of meltwater quality and quantity during saline ice melting and its effects on the infiltration and desalinization of coastal saline soils. Agric. Water Manag. 2014, 139, 1–6. [Google Scholar] [CrossRef]
  52. Bond, W.J.; Phillips, I.R. Ion transport during unsteady water flow in an unsaturated clay soil. Soil Sci. Soc. Am. J. 1990, 54, 636–645. [Google Scholar] [CrossRef]
  53. Gong, Y.; Tian, R.; Li, H. Coupling effects of surface charges, adsorbed counterions and particle-size distribution on soil water infiltration and transport. Eur. J. Soil Sci. 2018, 69, 1008–1017. [Google Scholar] [CrossRef]
  54. Peng, Y.; Zhu, Y.; Mao, Y.; Wang, S.; Su, W.; Tang, Z. Alkali grass resists salt stress through high [K+] and an endodermis barrier to Na+. J. Exp. Bot. 2004, 55, 939–949. [Google Scholar] [CrossRef] [PubMed] [Green Version]
  55. Rawat, L.; Singh, Y.; Shukla, N.; Kumar, J. Alleviation of the adverse effects of salinity stress in wheat (Triticum aestivum L.) by seed biopriming with salinity tolerant isolates of Trichoderma harzianum. Plant Soil 2011, 347, 387–400. [Google Scholar] [CrossRef]
  56. Lao, C.; Chen, J.; Zhang, Z.; Chen, Y.; Ma, Y.; Chen, H.; Gu, X.; Ning, J.; Jin, J.; Li, X. Predicting the contents of soil salt and major water-soluble ions with fractional-order derivative spectral indices and variable selection. Comput. Electron. Agric. 2021, 182, 106031. [Google Scholar] [CrossRef]
  57. Tavakkoli, E.; Fatehi, F.; Coventry, S.; Rengasamy, P.; McDonald, G.K. Additive effects of Na+ and Cl- ions on barley growth under salinity stress. J. Exp. Bot. 2011, 62, 2189–2203. [Google Scholar] [CrossRef] [Green Version]
  58. Bosson, E.; Selroos, J.O.; Stigsson, M.; Gustafsson, L.G.; Destouni, G. Exchange and pathways of deep and shallow groundwater in different climate and permafrost conditions using the Forsmark site, Sweden, as an example catchment. Hydrogeol. J. 2013, 21, 225–237. [Google Scholar] [CrossRef]
  59. Wan, H.; Bian, J.; Zhang, H.; Li, Y. Assessment of future climate change impacts on water-heat-salt migration in unsaturated frozen soil using CoupModel. Front. Environ. Sci. Eng. 2021, 15, 1–17. [Google Scholar] [CrossRef]
  60. Wang, Y.; Bian, J.; Zhao, Y.; Tang, J.; Jia, Z. Assessment of future climate change impacts on nonpoint source pollution in snowmelt period for a cold area using SWAT. Sci. Rep. 2018, 8, 2402. [Google Scholar] [CrossRef] [Green Version]
  61. Wang, C.; Guo, J.; Zhang, W.; Jiang, Y.; Fang, F.; He, W.; Jia, B.; Dang, C. Drying-rewetting changes soil phosphorus status and enzymatically hydrolysable organic phosphorus fractions in the water-level fluctuation zone of Three Gorges reservoir. CATENA 2021, 204, 105416. [Google Scholar] [CrossRef]
  62. Asensio, E.; Ferreira, V.J.; Gil, G.; García-Armingol, T.; López-Sabirón, A.M.; Ferreira, G. Accumulation of De-Icing Salt and Leaching in Spanish Soils Surrounding Roadways. Int. J. Environ. Res. Pubulic Health 2017, 14, 1498. [Google Scholar] [CrossRef] [Green Version]
  63. Laurenson, S.; Smith, E.; Bolan, N.S.; McCarthy, M. Effect of K+ on Na-Ca exchange and the SAR-ESP relationship. Soil Res. 2011, 49, 538–546. [Google Scholar] [CrossRef]
  64. Fu, J.; Xiao, Y.; Wang, Y.; Liu, Z.; Yang, K. Saline–alkaline stress in growing maize seedlings is alleviated by Trichoderma asperellum through regulation of the soil environment. Sci. Rep. 2021, 11, 11152. [Google Scholar] [CrossRef] [PubMed]
Figure 1. Locations of sampling sites in the study area: (a) China; (b) Hetao irrigation District; (c) Yonglian Experiment station; (d) Test field division.
Agronomy 13 00660 g001
Figure 2. Variations in precipitation and air temperature (a), and soil temperature (b) during the freeze–thaw process.
Agronomy 13 00660 g002
Figure 3. Changes in soil moisture content (SMC) during the freeze–thaw process. Note: Different lowercase letters indicate significant differences between different times (p < 0.05). Different capital letters indicate significant differences between different soil layer (p < 0.05). The horizontal line represents the S.D. of the average.
Agronomy 13 00660 g003
Figure 4. Changes in soil salt content (SSC) during the freeze–thaw process. Note: Different lowercase letters indicate significant differences between different times (p < 0.05). Different capital letters indicate significant differences between different soil layer (p < 0.05). The horizontal line represents the S.D. of the average.
Agronomy 13 00660 g004
Figure 5. Changes in the soil soluble ion concentrations during the freeze–thaw process: (a) Cl; (b) SO42–; (c) Ca2+; (d) Na+; (e) Mg2+; (f) HCO3. Note: Different lowercase letters indicate significant differences between different times (p < 0.05). The vertical line represents the S.D. of the average.
Agronomy 13 00660 g005
Figure 6. Profile distribution of soil soluble ion concentrations before (a) and after (b) the freeze–thaw process.
Agronomy 13 00660 g006
Figure 7. Migration characteristics of soluble ions during the freeze–thaw process: (a) Storage change rate; (b) Ratio.
Agronomy 13 00660 g007
Figure 8. Correlation coefficient matrix of soil soluble ions and soil properties. SMC, soil moisture content. Red denotes a positive correlation and blue denotes a negative correlation. **, p < 0.01; *, p < 0.05.
Agronomy 13 00660 g008
Figure 9. Correlation coefficient matrix of soil soluble ions and soil pH, SAR. Red denotes a positive correlation and blue denotes a negative correlation. **, p < 0.01; *, p < 0.05.
Agronomy 13 00660 g009
Table 1. Soil basic physicochemical properties before the experiment.
ParametersSoil Layer (cm)
0–55–1010–2020–3030–4040–6060–80
Soil salt content (g 100 g−1)0.29 ± 0.050.28 ± 0.060.23 ± 0.050.28 ± 0.040.27 ± 0.020.21 ± 0.030.20 ± 0.04
Electric conductivity (µS·cm−1)681 ± 110479 ± 96406 ± 53505 ± 98662 ± 84495 ± 97541 ± 110
Soil moisture Content (%)16.78 ± 2.1417.98 ± 0.5319.41 ± 0.9420.21 ± 1.8220.27 ± 1.3819.72 ± 2.5119.39 ± 2.17
Na+ (meq 100 g−1)2.00 ± 0.401.69 ± 0.291.37 ± 0.111.75 ± 0.261.86 ± 0.111.26 ± 0.221.25 ± 0.21
Ca2+(meq 100 g−1)1.06 ± 0.240.90 ± 0.120.85 ± 0.050.98 ± 0.101.00 ± 0.100.66 ± 0.040.74 ± 0.03
Mg2+(meq 100 g−1)1.14 ± 0.501.50 ± 0.190.92 ± 0.121.04 ± 0.221.08 ± 0.261.12 ± 0.060.82 ± 0.04
SO42– (meq 100 g−1)2.00 ± 0.312.24 ± 0.311.56 ± 0.281.90 ± 0.112.04 ± 0.081.64 ± 0.141.52 ± 0.12
Cl (meq 100 g−1)1.84 ± 0.181.40 ± 0.301.12 ± 0.181.82 ± 0.031.60 ± 0.211.07 ± 0.220.90 ± 0.24
HCO3 (meq 100 g−1)0.85 ± 0.130.87 ± 0.120.88 ± 0.230.87 ± 0.160.67 ± 0.070.59 ± 0.070.67 ± 0.13
Soil bulk density (g cm−3)1.42 ± 0.061.40 ± 0.031.41 ± 0.071.38 ± 0.051.35 ± 0.031.42 ± 0.091.45 ± 0.05
CEC (meq 100 g−1)7.22 ± 0.327.35 ± 0.227.63 ± 0.37
Sand (%) 29.02 ± 0.1127.29 ± 1.6028.00 ± 0.00
Silt (%) 66.57 ± 0.2768.04 ± 2.1267.24 ± 0.24
Clay (%) 4.41 ± 0.384.67 ± 0.524.76 ± 0.24
Soil textureSilt loamSilt loamSilt loam-–-–-–-–
Note: Data are expressed as mean ± S.D. – indicated that the index was not texted.
Table 2. Soil anion and cation composition.
TimeSoil
Layer (cm)
Proportion of Anion Equivalent Concentration (%)Proportion of Cation Equivalent Concentration (%)
HCO3SO42−ClCa2+Mg2+K+Na+
T10–518.63 40.95 40.42 19.06 20.54 4.55 55.85
5–1019.94 48.02 32.04 17.34 28.96 3.38 50.32
10–2025.37 42.30 32.34 19.86 23.13 4.31 52.69
20–3019.50 40.77 39.74 19.50 20.69 5.85 53.96
30–4015.95 45.75 38.30 19.78 21.47 1.85 56.89
40–6018.45 47.99 33.57 17.27 29.68 1.92 51.14
60–8022.45 47.69 29.86 20.75 23.05 2.24 53.96
T30–517.29 36.91 45.79 20.53 26.35 2.71 50.41
5–1018.16 43.11 38.73 20.30 21.09 3.47 55.15
10–2018.55 39.01 42.44 17.75 19.04 2.75 60.46
20–3015.65 41.61 42.74 17.23 16.56 2.54 63.67
30–4017.82 41.31 40.87 17.88 14.57 2.33 65.21
40–6024.92 40.06 35.02 19.46 11.68 1.86 67.00
60–8049.27 31.83 18.90 25.74 7.59 1.40 65.27
T60–53.06 33.42 63.52 19.62 23.71 1.965 54.71
5–1016.23 39.20 44.56 21.43 18.27 3.154 57.15
10–2020.63 33.21 46.17 23.39 15.70 2.930 57.98
20–3016.99 40.43 42.58 20.21 17.66 1.896 60.24
30–4019.58 37.23 43.20 21.52 13.64 1.312 63.53
40–6022.62 35.75 41.63 20.45 13.29 1.003 65.25
60–8031.89 31.45 36.66 20.81 12.14 0.685 66.36
Note: T1 represents the first sampling, soil was not frozen; T3 represents the third sampling, frozen soil depth reached the maximum; T6 represents the sixth sampling, soil was thawed at 0–80 cm.
Table 3. Soil SAR and pH values during the freeze–thaw process.
Soil
Layer
(cm)
T1T2T3T4T5T6
SAR0–53.76 ± 0.57 bA4.19 ± 0.71 bA3.85 ± 1.1 bAB4.21 ± 1.54 bAB6.27 ± 1.39 aA6.51 ± 1.47 aA
5–103.03 ± 0.61 aA3.47 ± 0.34 aAB3.80 ± 1.42 aAB3.04 ± 0.73 aC4.16 ± 1.43 aB3.91 ± 1.08 aB
10–202.90 ± 0.93 aA3.03 ± 0.93 aB4.30 ± 0.81 aAB3.23 ± 0.39 aBC4.12 ± 1.43 aB3.78 ± 0.79 aB
20–303.43 ± 1.28 bA3.21 ± 0.33 bAB4.89 ± 0.89 aA3.40 ± 0.66 abBC4.01 ± 1.4 abB4.01 ± 0.96 abB
30–403.58 ± 1.38 bA3.57 ± 0.46 bAB4.82 ± 0.57 aA4.30 ± 0.47 abAB4.36 ± 1.94 abB4.18 ± 0.48 abB
40–602.62 ± 0.69 cA3.41 ± 0.58 bcAB4.44 ± 0.61 abAB4.69 ± 0.88 aA3.73 ± 1.81 abcB4.06 ± 0.78 abB
60–802.77 ± 1.18 aA2.84 ± 0.60 aB3.21 ± 0.53 aB3.23 ± 0.61 aBC3.49 ± 1.9 aB3.79 ± 0.73 aB
pH0–56.98 ± 0.23 cA7.48 ± 0.28 bC8.07 ± 0.45 aA7.95 ± 0.04 aB8.04 ± 0.07 aB8.27 ± 0.06 aA
5–107.04 ± 0.32 cA7.61 ± 0.32 bBC8.12 ± 0.25 aA8.01 ± 0.12 abB8.29 ± 0.25 aAB8.44 ± 0.06 aA
10–207.17 ± 0.17 dA7.72 ± 0.32 cABC8.11 ± 0.10 bA8.00 ± 0.27 bcB8.30 ± 0.18 abAB8.54 ± 0.15 aA
20–307.42 ± 0.42 cA7.85 ± 0.14 bABC8.01 ± 0.22 bA7.93 ± 0.20 bB8.27 ± 0.11 abAB8.58 ± 0.18 aA
30–407.36 ± 0.33 cA7.93 ± 0.15 aB8.00 ± 0.24 bA7.95 ± 0.26 bB 8.31 ± 0.03 aAB8.55 ± 0.20 aA
40–607.30 ± 0.15 cA8.01 ± 0.17 bAB8.07 ± 0.28 abA8.19 ± 0.18 abAB8.49 ± 0.27 aA8.51 ± 0.34 aA
60–807.39 ± 0.16 cA8.06 ± 0.08 bA8.12 ± 0.23 bA8.44 ± 0.33 abA8.59 ± 0.25 aA8.39 ± 0.26 aB
Note: Data are expressed as mean ± S.D; Different lowercase letters indicate significant differences between different times (p < 0.05). Different capital letters indicate significant differences between different soil layer (p < 0.05).
Table 4. Soil precipitation of Na2SO4·10H2O (mmol/100 g) during the freeze–thaw process.
Soil Layer (cm)T1T2T3T4T5T6
0–5-1.3120.824---
5–10-0.1480.327---
10–20-0.348----
20–30--0.195---
30–40------
40–60------
60–80------
Note: Stage T1–T3 represent the freezing process; and stages T4–T6 represent the thawing process.
Table 5. Percentage of CEC in total soluble cations in 0–5 cm soil layer during the freeze–thaw process.
T1T2T3T4T5T6
CEC (meq 100 g−1)7.128.448.658.939.269.79
Total soluble cations
(meq 100 g−1)
4.277.856.637.4916.8418.41
Percentage of CEC to total soluble cations (%)166.5794.72130.38119.2855.0053.18
Note: Stages T1–T3 represent the freezing process; and stages T4–T6 represent the thawing process. CEC, cation exchange capacity; total soluble cations, sum of Na+, K+, Ca2+, Mg2+.
Disclaimer/Publisher’s Note: The statements, opinions and data contained in all publications are solely those of the individual author(s) and contributor(s) and not of MDPI and/or the editor(s). MDPI and/or the editor(s) disclaim responsibility for any injury to people or property resulting from any ideas, methods, instructions or products referred to in the content.

