Article

Exogenous Application of Indol-3-Acetic Acid and Salicylic Acid Improves Tolerance to Salt Stress in Olive Plantlets (Olea europaea L. Cultivar Picual) in Growth Chamber Environments

by
María del Pilar Cordovilla
1,2,*,
Carolina Aparicio
1,
Manuel Melendo
1 and
Milagros Bueno
1
1
Plant Physiology Laboratory, Department Animal Biology, Plant Biology and Ecology, Faculty of Experimental Science, University of Jaén, Paraje Las Lagunillas, E-23071 Jaén, Spain
2
Center for Advances Studies in Olive Grove and Olive Oils, Faculty of Experimental Science, University of Jaén, Paraje Las Lagunillas, E-23071 Jaén, Spain
*
Author to whom correspondence should be addressed.
Agronomy 2023, 13(3), 647; https://doi.org/10.3390/agronomy13030647
Submission received: 20 January 2023 / Revised: 14 February 2023 / Accepted: 21 February 2023 / Published: 23 February 2023
(This article belongs to the Collection Crop Physiology and Stress)

Abstract

:
Salinity is one the most recurrent abiotic stresses worldwide and severely affects crop productivity in arid and semiarid environments. This research analyzed several plant growth regulators that could mitigate the effects of salinity on olive plants (Olea europaea L. cultivar Picual). Mist-rooted cuttings were grown in a growth chamber and pretreated with gibberellic acid (GA3), indole-3-acetic acid (IAA), salicylic acid (SA), and Kinetin by foliar spraying twice a week for three weeks. At the end of the pretreatment, the plants were exposed to 100 mM and 200 mM sodium chloride (NaCl) for six weeks. The results showed that plants pretreated with the plant growth regulators significantly increased their biomass under saline conditions. In addition, IAA and SA restricted the transport of sodium (Na+) ions from roots to leaves and improved the leaf potassium (K+)/Na+ ratio. IAA and SA favored proline, fructose, and mannitol accumulation in leaves at 100 mM and 200 mM NaCl, as did glucose at 200 mM NaCl. Salicylic acid and IAA increased pigments (chlorophylls and carotenoids) and polyamines accumulation under saline conditions. The findings of this study suggest that pretreatments with IAA and SA may be a highly effective way of increasing salt tolerance in olive plantlets.

1. Introduction

Soil salinity is caused by a high concentration of soluble salts that retain water in the soil and accentuate the problem of desertification. Salt affects the availability of carbon and nitrogen in the soil, and also has a bearing on various microbial processes and activities, and impacts agricultural productivity and environmental sustainability [1]. Soil salinity influences plant growth and development as a consequence of the osmotic effect, ionic toxicity, and the nutritional imbalance caused by salt in plant tissue [2,3]. In addition to natural and anthropogenic causes, climate change is leading to greater desertification and soil salinization, and increasingly less land is now devoted to agricultural production [4,5]. Currently, salinized land occupies a total of 932.2 Mha worldwide, which in Europe is mainly concentrated in the Mediterranean area [6,7]. Salinization decreases the production of food and fodder. Thus, in the twenty-first century, the development of technologies for increasing agricultural production has become a research priority aimed at providing food for the approximately 9 billion people expected to populate our planet by 2050 [5,8]. Innovative technologies, such as gene-editing, genome database information, and transgenesis [9,10,11], in addition to seed priming and foliar spraying (techniques that enhance germination and growth development by activating various physiological and biochemical processes) with compounds, such as plant growth regulators (PGRs) [12,13,14,15,16], could all help improve abiotic stress tolerance in both herbaceous and perennial crops.
In recent years, research aimed at improving saline tolerance in different cultivars via the foliar application of PGRs has increased [16,17,18]. One of the most widely used among such compounds is salicylic acid (SA) [19], and both field and laboratory works have shown that this PGR mitigates the detrimental effects of salinity by stimulating the physiological and metabolic mechanisms that improve chlorophyll content, stomatal conductance, and leaf relative water content (LRWC), thereby protecting membrane integrity in both leaves and roots [20,21]. This growth regulator also protects against oxidative damage and increases antioxidant activity and accumulations of osmolytes that could help protect photosynthetic mechanism under saline conditions [22,23]. The foliar application of gibberellins (GA3) has also been explored in numerous trials as a way of increasing productivity under saline conditions. The application of GA3 in Vigna mungo increased most measured ecophysiological and biochemical parameters and restored them to the normal values they would have had without salt [24]. Remarkable results for GA3 have also been found for tomato and cucumber cultivation and have improved seedling quality [25]. In maize under salt stress, GA3 application reduces oxidative stress by increasing antioxidant enzyme activity, antioxidant gene expression, and K+ concentration [26]. Gibberellic acid has also been applied to woody plants where it can play an important role in reducing the negative effects of salt, probably by improving carbon assimilation and increasing the leaf chlorophyll index [27].
Less information, however, is available on the efficacy of foliar application of auxins and cytokinins to improve salt stress tolerance in agricultural crops. These phytohormones not only stimulate plant growth in general, but also improve abiotic stress tolerance [28]. Recently, it has been shown that in faba beans (Vicia faba) under salt stress IAA enhances the accumulation of osmolytes (soluble sugars and proteins), regulates ionic homeostasis, and improves antioxidant activity, as well as increases the number of nodules for better biological nitrogen fixation [29]. Elsewhere, kinetin (a synthetic cytokinin) has been used in combination with other phytohormones. Together, IAA and Kinetin have been found to enhance essential inorganic nutrients and maintain membrane permeability in maize (Zea mays) plants under field conditions [30]. Kinetin also enhanced the photosynthetic and antioxidant responses in Nigella sativa that help counteract the effects of salt stress [31]. Finally, in recent years, a study of sweet sorghum has shown that the application of GA3, SA, and Kinetin can lead to a significant increase in photosynthetic and transpiration rates, as well as stomatal conductance [32].
In terms of endogenous plant regulators, polyamines (PAs) (putrescine (Put), spermidine (Spd), and spermine (Spm)) and ethylene are two PGRs, whose levels can increase under abiotic stress, and which can control ion homeostasis and regulate the antioxidant system. In addition, PAs can interact with other metabolic pathways by establishing hormonal crosstalk [33,34].
Little information is yet available on whether or not the foliar application of PGRs increases salt stress tolerance in woody plants. We investigated the olive tree (Olea europaea L. family Oleraceae), one of the most widespread crops in the Mediterranean areas [35], and, specifically, the Picual cultivar, one of many existing olive cultivars and widespread in the Iberian Peninsula [36]. Its fruits are appreciated for the quality of their oil, which is widely consumed in the Mediterranean diet due to the unsaturated fatty acids it contains and its antioxidant properties that have beneficial effects on health [37,38,39]. The Mediterranean region is characterized by its rather dry climate, especially during the summer season when drought and the use of low-quality irrigation water increase the salinity of agricultural soils [40,41]. The use of ecological strategies to achieve more salinity-tolerant cultivars in light of current climate change will improve crop yields and quality.
Tolerance to salinity can be achieved by stimulating (i) plant water content to increase cell elongation and plant growth, (ii) ion exclusion mechanisms in roots, (iii) decreased Na+ and Cl- transport to aerial parts, (iv) the accumulation of compatible solutes (osmolytes) for better osmotic adjustment and of pigments for better photosynthetic efficiency, and (v) an increase in endogenous stress-related PGRs (PAs and ethylene) [27,42,43,44]. The aim of this study was to determine which pre-treatments with PGRs (GA3, IAA, SA and Kinetin) are most effective in improving the above-mentioned parameters and increasing the resistance of the Olea europaea cultivar Picual to NaCl.

2. Materials and Methods

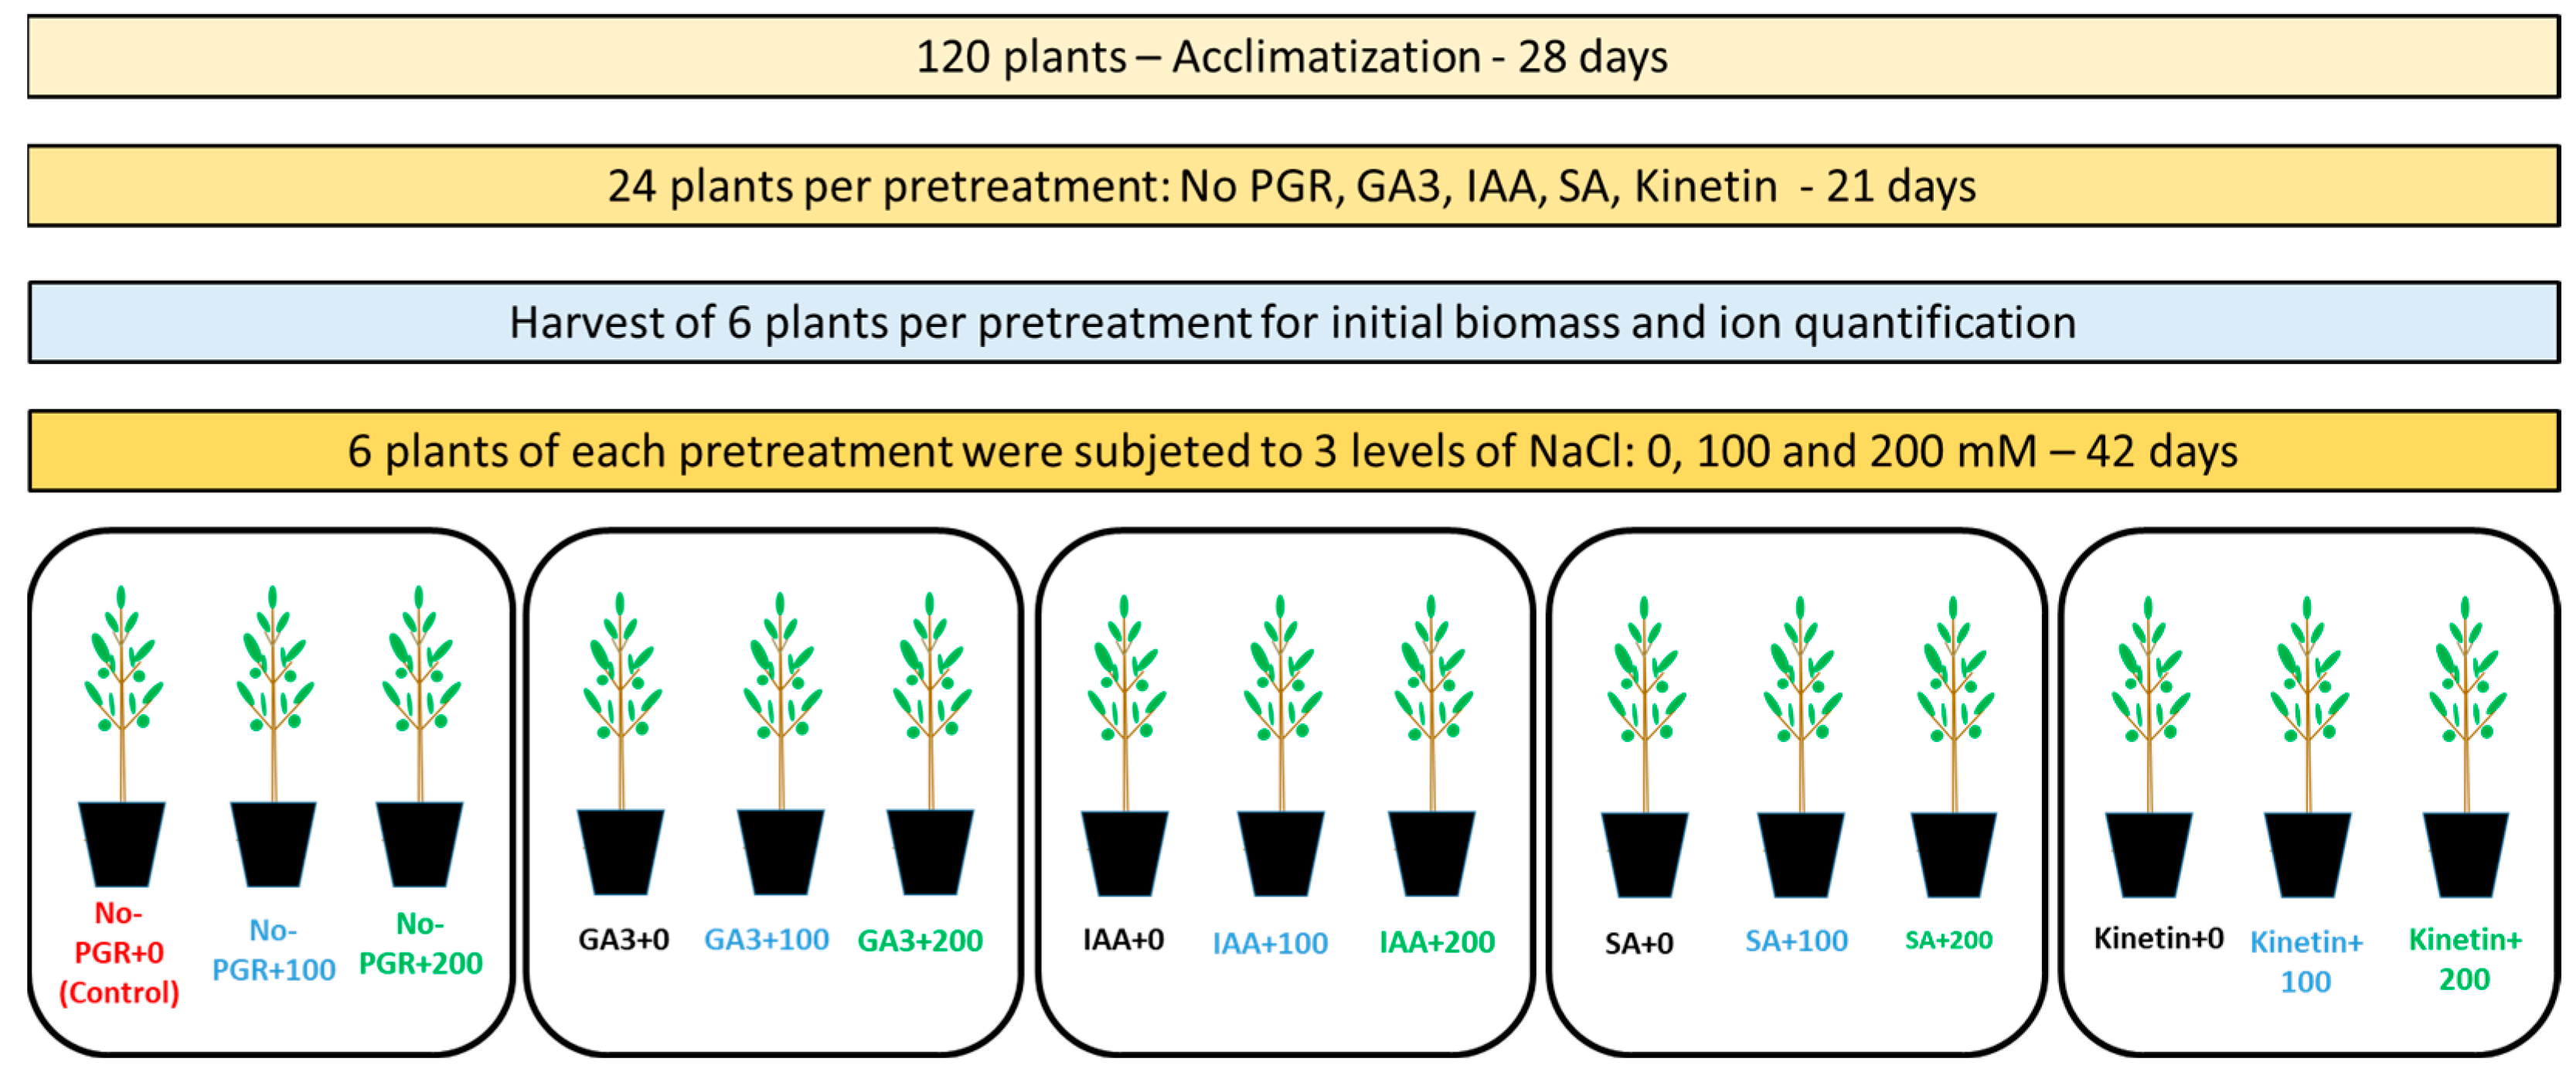
2.1. Plant Material and Growth Conditions

One hundred and twenty uniform mist-rooted olive Picual cuttings (12-cm shoot length; three-months-old) (Viveros Jarico SL, Almería, Spain; GPS location: 37°17′6.36″ N, 1°52′8.759″ W) were transplanted to 1-L plastic pots containing a sand-perlite mixture (1:3, v/v) and placed in a growth chamber under the following conditions: a 16–8 h light-dark cycle, 25–20 °C day-night temperature, relative humidity 55–75%, and photosynthetic photon flux density (PPFD) (400–700 nm) of 500 µmol m–2 s–1 (Sylvania Cool White and Osram Dulux Superstar lamps; Osram Sylvania Inc., Danvers, MA, USA). Plants were irrigated three times per week with 100 mL of half-strength Hoagland’s solution [45]. After four weeks acclimation, plants were randomly separated into five groups (24 plants per group) to be pretreated with the plant growth regulators (PGRs):
-
Group 1: each plant was sprayed with 25 mL of distilled water (no PGR pretreatment).
-
Group 2: each plant was sprayed with 25 mL of gibberellic acid (GA3) (1 µM).
-
Group 3: each plant was sprayed with 25 mL of indol-3-acetic acid (IAA) (1 µM).
-
Group 4: each plant was sprayed with 25 mL of salicylic acid (SA) (0.5 mM).
-
Group 5: each plant was sprayed with 25 mL of Kinetin (1 µM).
The PGR concentrations used were based on previous experiments and information given in the literature [19,41,46,47,48,49]. Kinetin was dissolved in 0.5 N hydrochloric acid, IAA in 1N sodium hydroxide, and salicylic acid in 97% sulphuric acid, and then diluted to the final concentration by adding distilled water. GA3 was dissolved in distilled water.
These pretreatments were performed twice a week over a period of three weeks. Six randomly chosen plants per group were harvested to assess the initial biomass and ion quantification, the data from which were used to calculate the net translocation. Subsequently, the remaining plants were divided into three groups of six plants, to which three concentrations of NaCl were applied (0, 100, and 200 mM) [27]. NaCl was added to the nutrient solution incrementally over an eight-day period to avoid osmotic shock to the plants (25 mM NaCl day−1). Plants were harvested six weeks after the start of the saline treatment. Six replicates of one plant were harvested per pretreatment with PGRs and NaCl concentration. A schematic representation of the experiment is given in Figure 1.
The dry weight of roots, stems, and leaves, Na+ and K+ levels, Na+/K+ ratio, and the net translocation rates of these ions to the leaves of olive plantlets were analyzed. We also evaluated the leaf relative water content, photosynthetic pigments, proline, alcohol-soluble sugars, sugar alcohols, starch, free polyamines, and ethylene in leaves given that the highest metabolite concentrations were found in this organ.

2.2. Determination of Growth Parameters and Leaf Relative Water Content

When harvested, plants were gently removed from the substrate, washed with distilled water and dried between two layers of filter paper. The fresh material was used to measure ethylene production in all treatments. Roots, stems, and leaves from both control and PGR-treated plants (with salt and without salt) were dried at 70 °C for 72 h in a forced-air oven and the dry weight (DW) of the different organs was determined. The leaf relative water content (LRWC) was calculated using the following formula:
LRWC (%) = (FW − DW)/(TW − FW) × 100
where FW is the fresh weight, DW the dry weight, and TW the fresh weight at full turgor, measured after the immersion of the leaf petioles in demineralized water for 48 h in the dark at 4 °C [50].

2.3. Ion Quantification and Net Translocation

The Na+ and K+ concentrations in leaves and roots were measured with an emission-absorption spectrophotometer (Perkin Elmer AAnalyst 800, Shelton, CT, USA) after the tissue had been dry-ashed for 24 h at 450 °C and suspended in 37% hydrochloric acid (HCl). The net translocation rate from roots to leaves (Js) was calculated using the following equations:
Js = (MS2 − MS1)/(T2 − T1) × (ln(W2 − W1))/(W2/W1))
where Js is expressed as mmol kg−1 root DW day−1, MS1 and MS2 are the nutrient concentration in shoots, T2-T1 the experimental period (42 days), and W2 − W1 the difference between the root dry weight (Kg) at the end of the experimental period (W2) and prior to the salt treatments (W1) [51].

2.4. Determination of Photosynthetic Pigments

Leaf tissue from the middle of the main leaf axis was ground in 80% acetone [52] for chlorophyll and carotenoid determination [53]. Results were expressed as mg−1 DW.

2.5. Determination of Proline

Leaf tissue was homogenized with 3% sulfosalicylic acid and centrifuged at 1000× g for 5 min, and the supernatant was used for the quantification of the proline [54]. The endogenous Pro concentration was determined at 520 nm in a VARIAN spectrophotometer (Cary 4000 UV-VIS, Santa Clara, CA, USA). A standard curve with proline was used for the final calculations with quantities of between 0.5 and 20 µg. Results were expressed as µg g−1 DW.

2.6. Determination of Alcohol-Soluble Sugars and Sugar Alcohols

To measure the alcohol-soluble sugars (sucrose, glucose, and fructose) and sugar alcohols (mannitol and inositol), the method used by Bartolozzi et al. [55] was followed with some modifications. Plant material (300 mg) was homogenized with 50% ethanol (1:10, w/v) containing β-phenyl-glucopyranoside (1:40, w/v) as an internal standard (5 mg g−1 tissue). The homogenate was centrifuged at 1000× g and 4 °C for 5 min. The supernatant was removed and diluted to a volume of 22.5 mL with 50% ethanol. An aliquot (1.5 mL) of the sample was dried in an air stream and treated with 0.4 mL of pyridine, 0.2 mL of hexamethyldisilazane, and 0.1 mL of trimethylchlorosilane (TMCS), and then heated at 60 °C. After 2 h, 0.3 mL of sample was injected into a HP 5890 (series II) gas chromatograph fitted with a flame ionization detector and 30 m x 0.25 mm capillary fused-silica column HP-5MS (Crosslinked 5% PME Siloxane). Injector and detector temperatures were 280 and 320 °C, respectively. Flow rates of He, H2, and air were 2, 30, and 250 mL min−1, respectively. To calculate the alcohol-soluble sugar and sugar alcohol concentrations, sucrose, glucose, fructose, mannitol, and inositol were dissolved in 1.5 mL of 50% ethanol with an imidazole buffer 0.1 M pH 7, dried in an air stream, and treated using the same procedure, with quantities of between 10 and 500 µg. Results were expressed as mg g−1 DW.

2.7. Determination of Starch

To determine the starch content, plant material was homogenized three times with 95% ethanol (1:10, w/v) and centrifuged at 1000× g and 4 °C for 10 min. [56]. Then, the solid fraction obtained was used for starch analysis [57]. Samples (20 mg) were heated with 2 mL of 0.1 N sodium hydroxide (NaOH) in a 50 °C water bath for 30 min with intermittent mixing. After neutralizing with 2.5 mL of 0.1 N acetic acid, 0.5 mL of a digestive enzyme mixture containing 1000 U of α-amylase (from Bacillus licheniformis, Sigma A-4551) and 5 U of amyloglucosidase (from Aspergillus niger, Sigma A-7420) in 0.05 M sodium acetate buffer (pH 5.1) was added. The combined solution was incubated for 24 h in a water bath at 50 °C. To calculate the amount of glucose hydrolysate, the digest was centrifuged at 2500 rpm for 10 min. Two mL of peroxidase-glucose oxidase/o-dianisidine reagent (PGO enzymes; Sigma P-7119) in 100 mL of distilled water mixed with 1.6 mL of o-dianisidine solution (50 mg of o-dianisidine dihydrochloride (Sigma D-3252) in 20 mL of distilled water) was added to 0.2 mL of the supernatant and left in darkness at room temperature for 45 min. The absorbance was read at 525 nm after adding 0.4 mL of 75% sulfuric acid (H2SO4). The amount of glucose was calculated against a glucose standard prepared in the sodium acetate buffer solution, with quantities of between 10 and 150 µg. Results were expressed as mg g−1 DW.

2.8. Determination of Free Polyamines

The method used by Bueno et al. [58] was followed with minor modifications for the determination of the free polyamines (Put, Spd, and Spm). Fresh material (100 mg) was homogenized with 0.2 M perchloric acid (1:4, w/v) containing 1.6-diamino-hexane (1:1, w/v) as an internal standard (100 μg g−1 tissue). The homogenate was centrifuged at 27,000× g and 4 °C for 10 min and 0.1 mL aliquots of the supernatant were saturated with sodium carbonate and dansylated with dansyl chloride (10 mg mL−1 in acetone). The mixture was incubated at 60 °C for 1 h before the solution of L-proline (100 mg mL−1) was added. After 30 min, the dansylated polyamines were extracted with toluene (HPLC grade). The toluene extract was dried under nitrogen and the residue was dissolved in acetonitrile (HPLC grade) and filtered through Millipore (Darmstadt, Germany) HV-4 filters for immediate analysis. An aliquot (0.02 mL) of the sample was injected into a reversed-phase Spheri-5 C18 ODS (8 µm, 4.6 × 220 mm) column. A Shimadzu (Kyoto, Japan) LC-10A HPLC equipped with a fluorescence spectrophotometer (the excitation and emission wavelengths were 252 nm and 500 nm, respectively) was used to quantify the dansyl derivatives [47,48,58,59,60]. The same procedure was applied with standards. Results were expressed as µmol g−1 DW.

2.9. Determination of Ethylene Production

For the ethylene measurements, the method of Bueno et al. [59] was followed with minor modifications. Fresh leaves were transferred to 5-mL flasks containing 50 μL distilled water. The flasks were sealed with silicone-rubber stoppers and incubated for 1 h in darkness at 30 °C. Later, 1 mL gas samples were removed from the flasks and injected into a HP 5890 (series II) Hewlett Packard (Palo Alta, CA, USA) gas chromatograph fitted with a flame ionization detector and a 2 m × 4 mm stainless-steel column packed with 50–80 mesh Poropack-R. The oven temperature was 100 °C, and the N2, H2, and the synthetic airflow rates were 50, 86, and 400 mL min−1, respectively. Ethylene identification was based on the retention time compared to a C2H4 standard (purity, 99.9%). Results were expressed as nmol g−1 FW h−1.

2.10. Statistical Analysis

To check for normality, all data were subjected to a Shapiro–Wilk test. Data sets with p values below the threshold of 0.05 were transformed (lg) before statistical analysis. Data were subjected to a two-way analysis of variance (effects of pretreatments with growth regulators and treatments with NaCl as fixed factors with the interaction factor). Significant differences were evaluated post-hoc using the LSD test (p < 0.05). All parameters studied with and without PGRs in the absence or presence of salt were compared using Pearson’s correlation coefficients. All calculations, including statistical analysis, were computed using Statgraphics Centurion v. 19 (University of Jaén).

3. Results

For all parameters studied, the statistical analysis showed the significant effect of the interaction between the growth regulator pretreatment and NaCl treatment (p < 0.05).

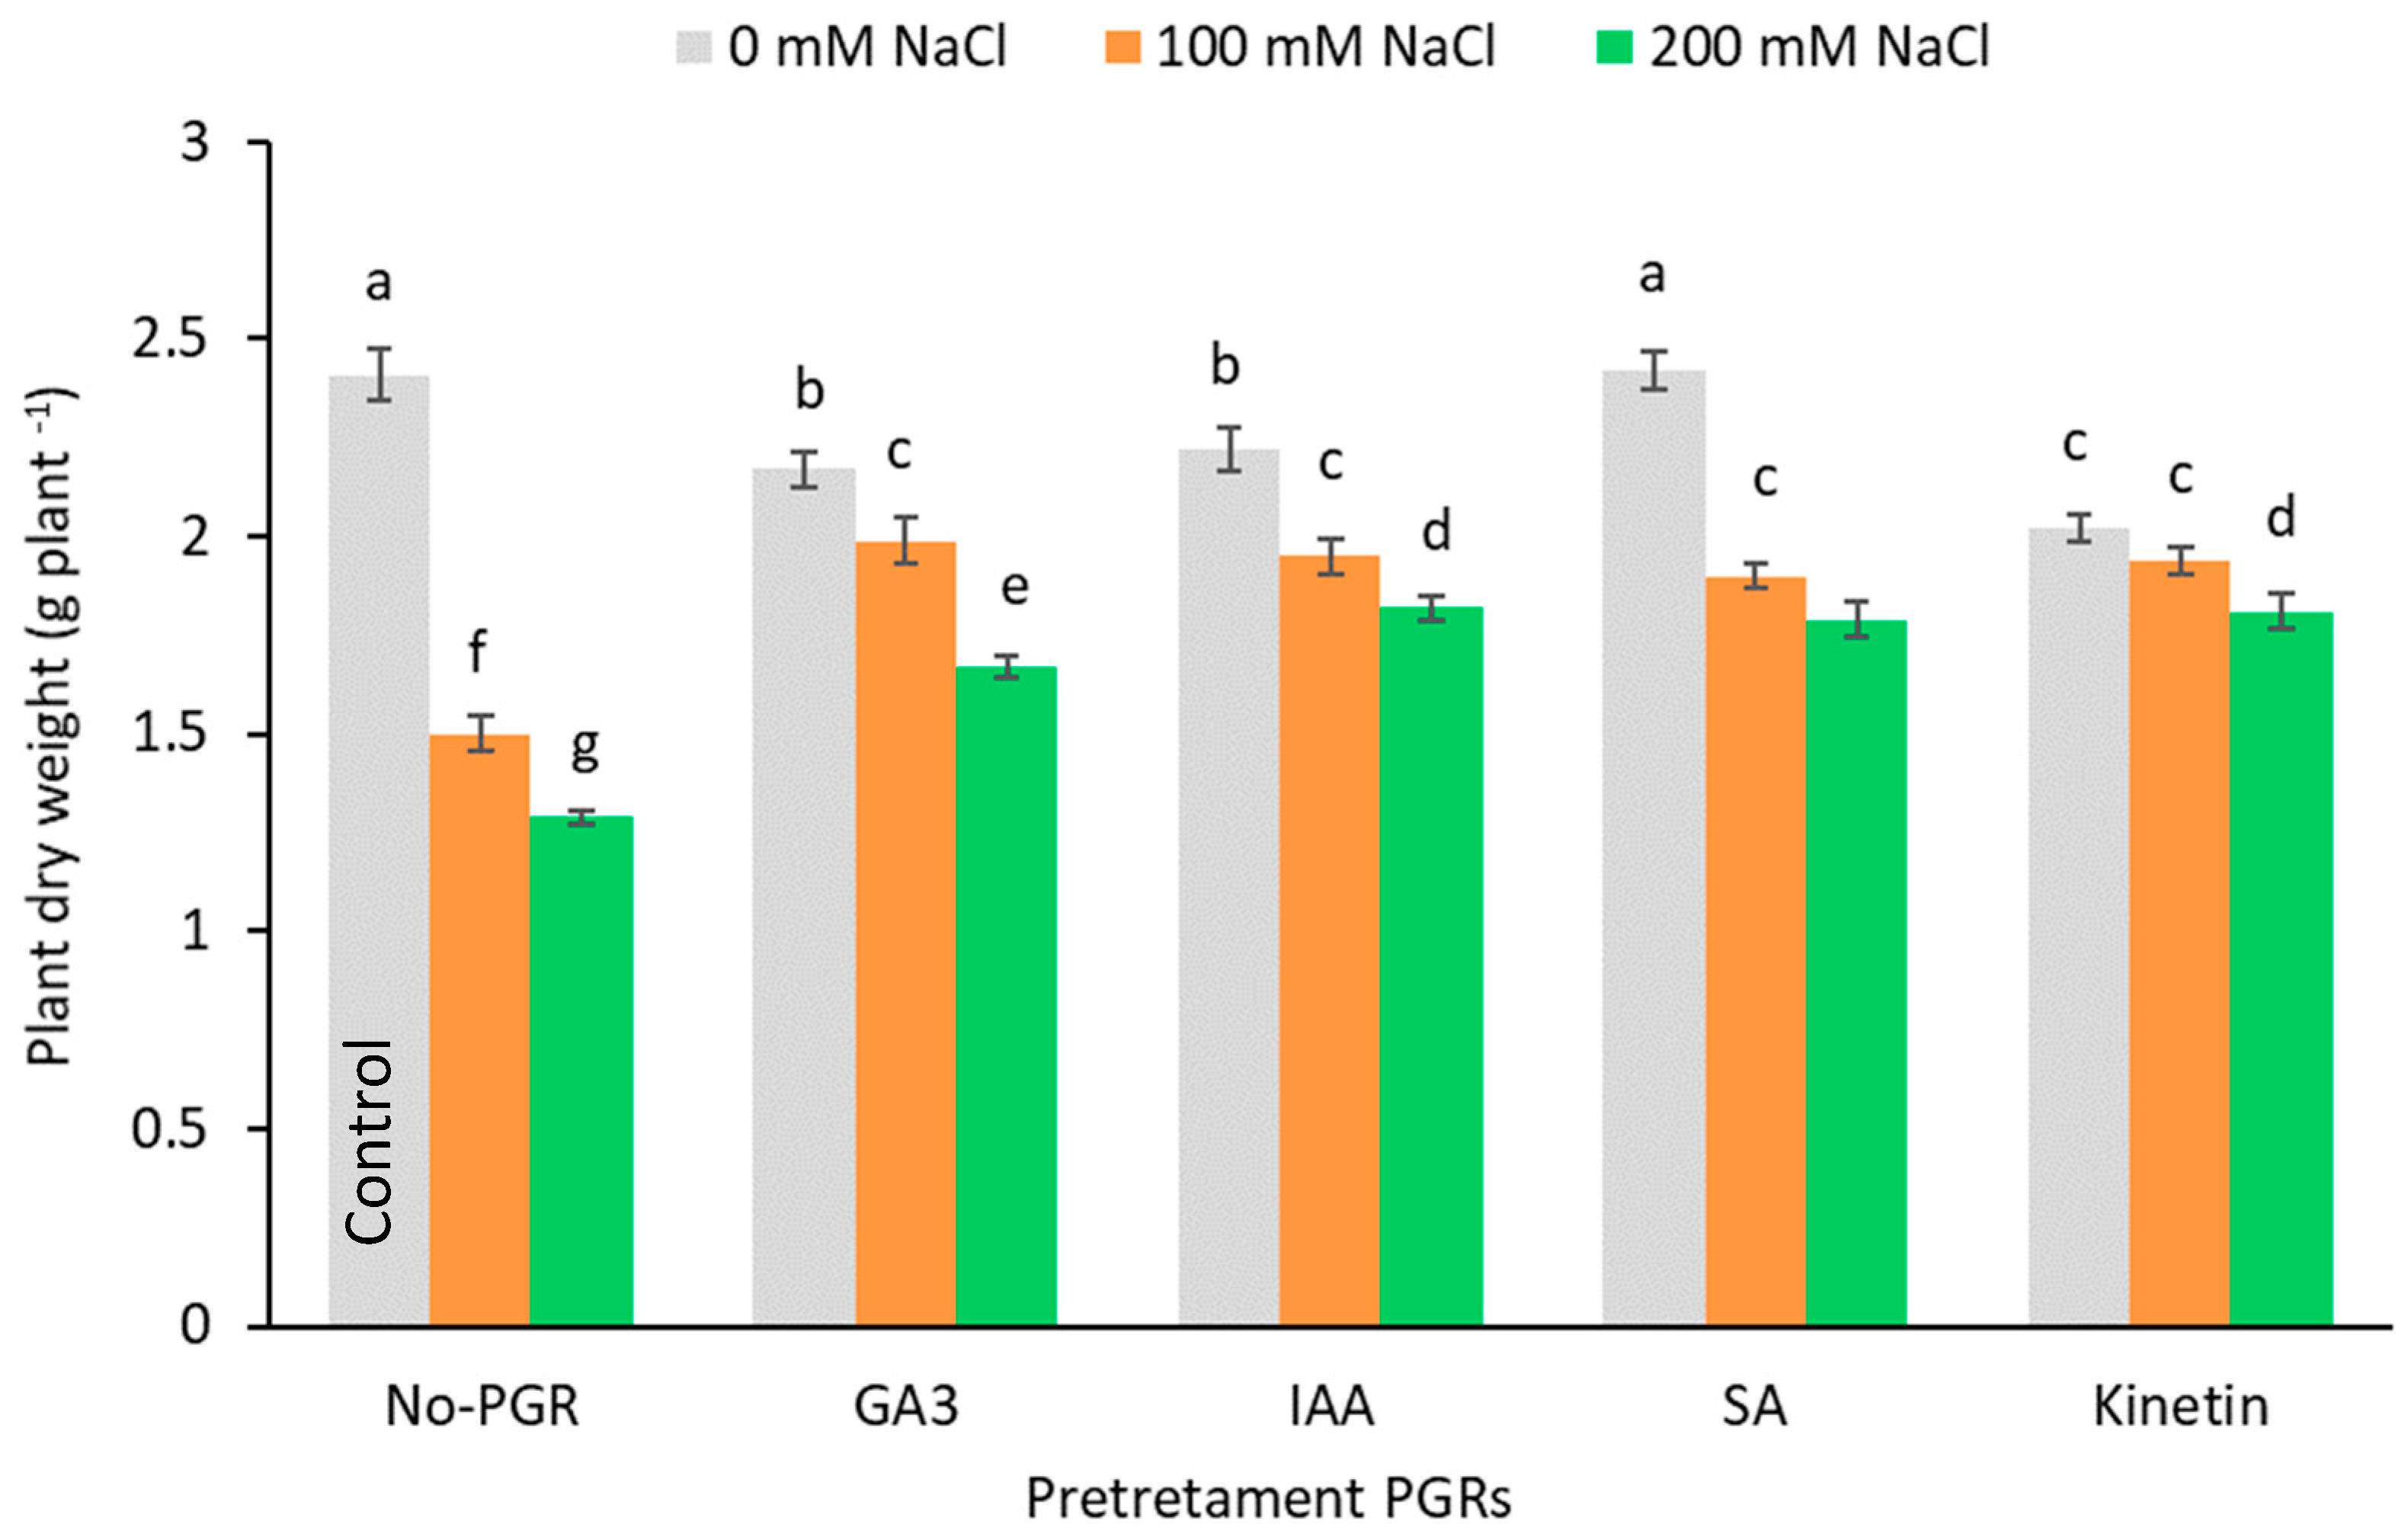
3.1. Effects of the Application of Plant Growth Regulators (PGRs) on Biomass

Data for whole plants dry weight show that under non-saline conditions, the PGRs did not stimulate plant growth any more than the control plants (0 mM NaCl and no-PGR) (Figure 2). In the salt-stressed plants, dry weights (DW) were significantly lower than in the plants grown under normal conditions (control). The fall in growth increased in a dose-dependent fashion and maximum growth inhibition was observed for the most severe salt-stressed olive plants (200 mM NaCl). The greatest reductions in DW were observed in plants not pretreated with PGR: at 200 mM NaCl the whole plant DW fell by 46.47% (Figure 2), root DW was inhibited by 53.57%, stem DW by 52.56% and leaf DW by 43.10% (Table 1). At 100 mM NaCl, reductions for root DW, stem DW and leaf DW were 42.86%, 44.87% and 35.34%, respectively. At 100 mM NaCl no significant differences were noted between the pretreatments, and mean inhibitions were only 19.29% (Figure 2). At 200 mM NaCl, the whole plant DW declined more in GA3-pre-treated plants (30.70%) than in the other pretreatments (average inhibition 25.04%; p < 0.05). The highest values for leaf dry weight at 100 mM were in GA3 plants (1.07 g plant−1), while in the other pretreatments no significant differences were detected (average inhibition of 18.39%) (Table 1). At 200 mM, leaf dry weight was inhibited by 20.90% in pretreated plants (p < 0.05). Salinity inhibited stem growth least in plants pretreated with IAA (14.10 and 16.67% for 100 and 200 mM NaCl, respectively), while in root dry weight the least inhibition was detected in plants pretreated with SA and Kinetin (average inhibition of 20.53 and 25.00% for 100 and 200 mM NaCl, respectively). Salinity significantly reduced (p < 0.05) the leaf water content (LRWC) in a concentration-dependent fashion (Table 1). Plants pretreated with Kinetin and IAA had greater LRWC values than no-PGR plants at both levels of NaCl (100 and 200 mM NaCl).

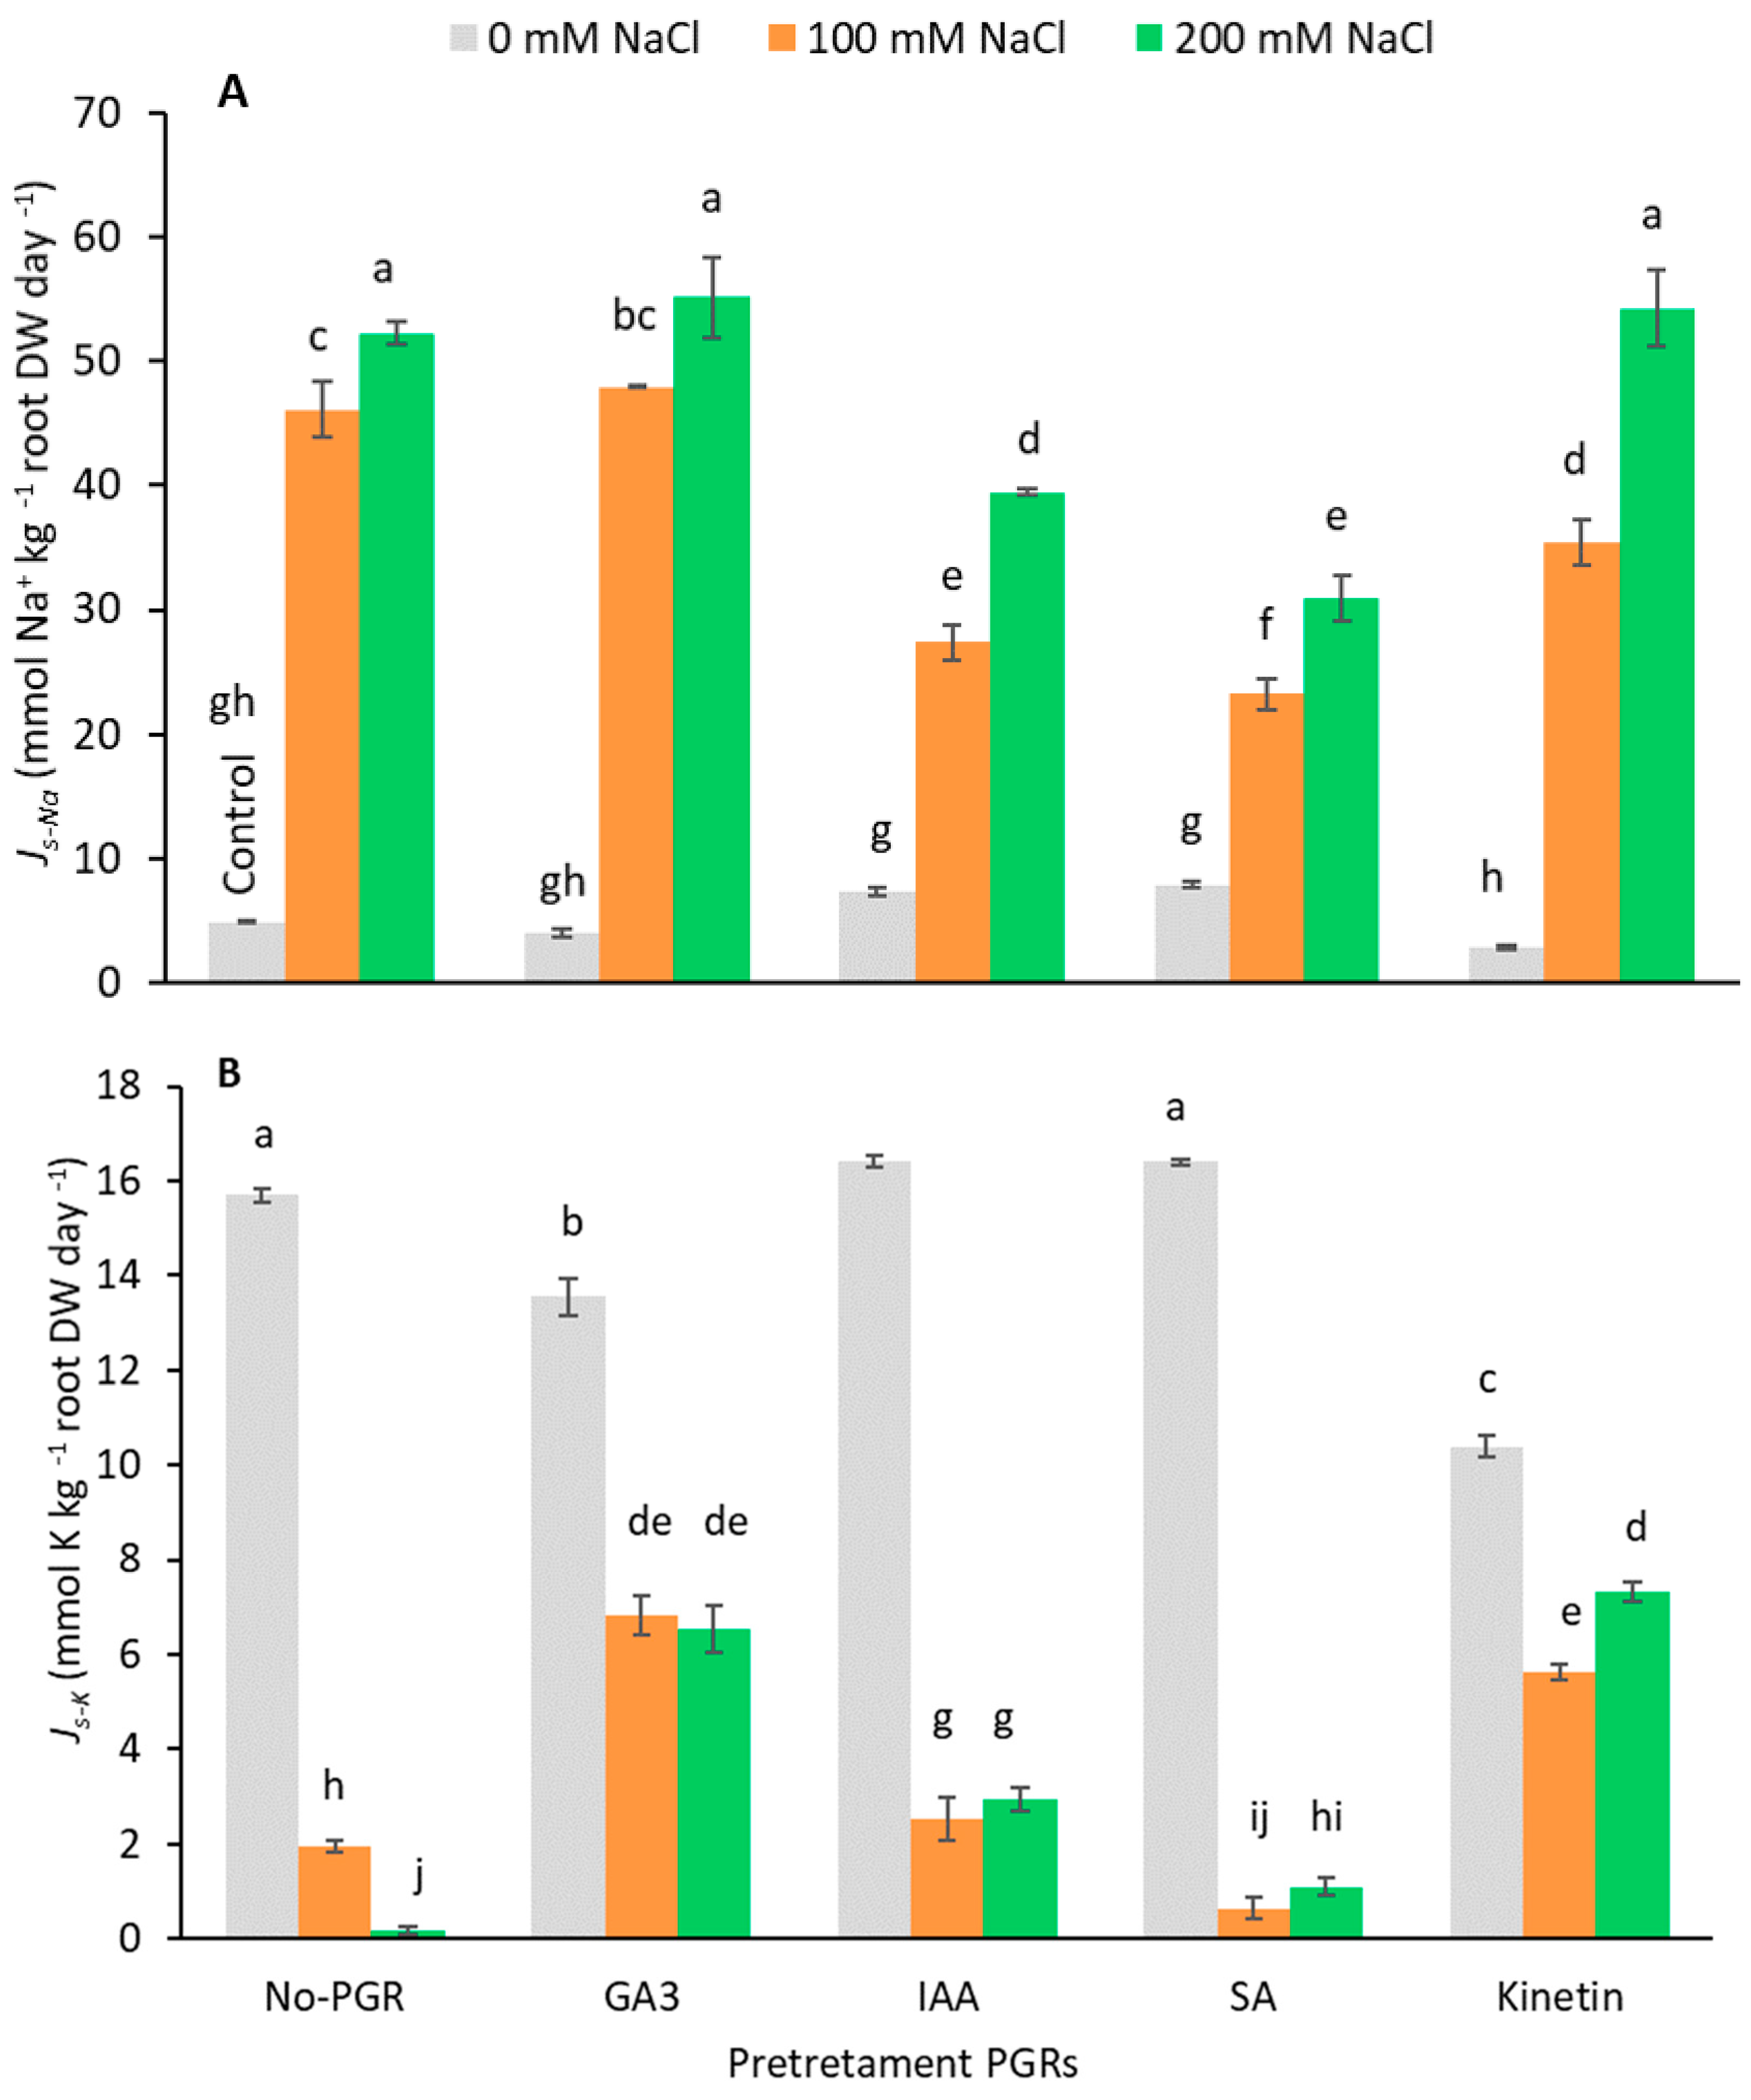
3.2. Effects of the Application of Plant Growth Regulators (PGRs) on Tissue Mineral Concentration

Ion (Na+ and K+) concentration was determined in the roots and leaves from plants under different treatments (Table 2 and Table 3). Pretreatments did not significantly affect leaf Na+ concentration without salt. Under saline conditions, however, the Na+ concentration increased in both pretreated and non-pretreated PGR plants, being more noticeable in roots than in leaves. Nevertheless, PGRs with salt accumulated less Na+ in leaves and roots than non-pretreated plants. Pretreatments with IAA and SA gave the lowest Na+ concentrations at both NaCl levels (IAA+200 mM = 472.06 and SA+200 mM = 414.96 mmol kg−1 DW), whereas with these pretreatments Na+ accumulation occurred in roots. Furthermore, at 200 mM NaCl, plants pretreated with SA had the lowest net rates of Na+ translocation (Js-Na; Figure 3A) from roots to leaves (30.94 mmol Na+ kg−1 root DW day−1), followed by plants pretreated with IAA (39.48 mmol Na+ kg−1 root DW day−1). Therefore, compared to plants with no-PGR+200 mM NaCl and those pretreated with SA and IAA, Js-Na was reduced by 40.76% and 24.41%, respectively. However, in plants with GA3+200 mM, Kinetin+200 mM, and no-PGR+200 mM, no differences were noted for Js-Na. At 100 mM NaCl, the SA pretreatment had the lowest Js-Na (27.39 mmol Na+ kg−1 root DW day−1), followed by the IAA (23.26 mmol Na+ kg−1 root DW day−1) and Kinetin pretreatments (35.39 mmol Na+ kg−1 root DW day−1). This led to a drop in Js-Na of 49.53% with SA pretreatment, 40.57% with IAA, and 23.26% with Kinetin compared to no-PGR+100 mM NaCl plants. Therefore, Na+ transport from roots to leaves was determined by the pretreatment and by the level of added salt. In light of these results, the treatments can be divided into three groups. The first is composed of plants pretreated with GA3 whose Js-Na was similar to that of the no-PGR plants. The second group includes Kinetin-pretreated plants that had less Na+ translocation at 100 mM NaCl than no-PGR plants, but greater translocation than plants pretreated with IAA and SA. The final group includes the pretreatments with IAA and SA that had the lowest values for Js-Na at both NaCl concentrations.
In plants grown with no NaCl, the K+ concentration of leaves had the lowest values in plants pretreated with Kinetin, in which the highest K+/Na+ ratios were detected. In general, salinity significantly decreased (p < 0.05) the K+ concentration of both roots and leaves (Table 2 and Table 3). In leaves, plants pretreated with IAA had the smallest fall in K+ concentration at both NaCl levels (18.79 and 7.46% at 100 and 200 mM NaCl, respectively) compared to the control plants. Interestingly, in the SA pretreatment the K+ concentration of plants grown at 200 mM NaCl only decreased by 18.37% compared to control plants. In addition, in the IAA and SA pretreatments, plants had greater K+/Na+ leaf ratios at both salt levels (100 and 200 mM NaCl). By contrast, in GA3, Kinetin, and no-PGR plants, at 200 mM NaCl, no significant differences (p < 0.05) in leaf K+ concentration were detected, whereas at 100 mM NaCl GA3 plants had the lowest K+ concentration (224.25 mmol kg−1 DW). Under salt stress, the net rates of K+ translocation (Js-K) from roots to leaves were higher in plants pretreated with GA3 and Kinetin (Figure 3B). In roots at 100 and 200 mM NaCl, the smallest drop in K+ concentration was detected in plants pretreated with IAA (53.58 and 62.18%, respectively), in which K+/Na+ values were highest (Table 3).

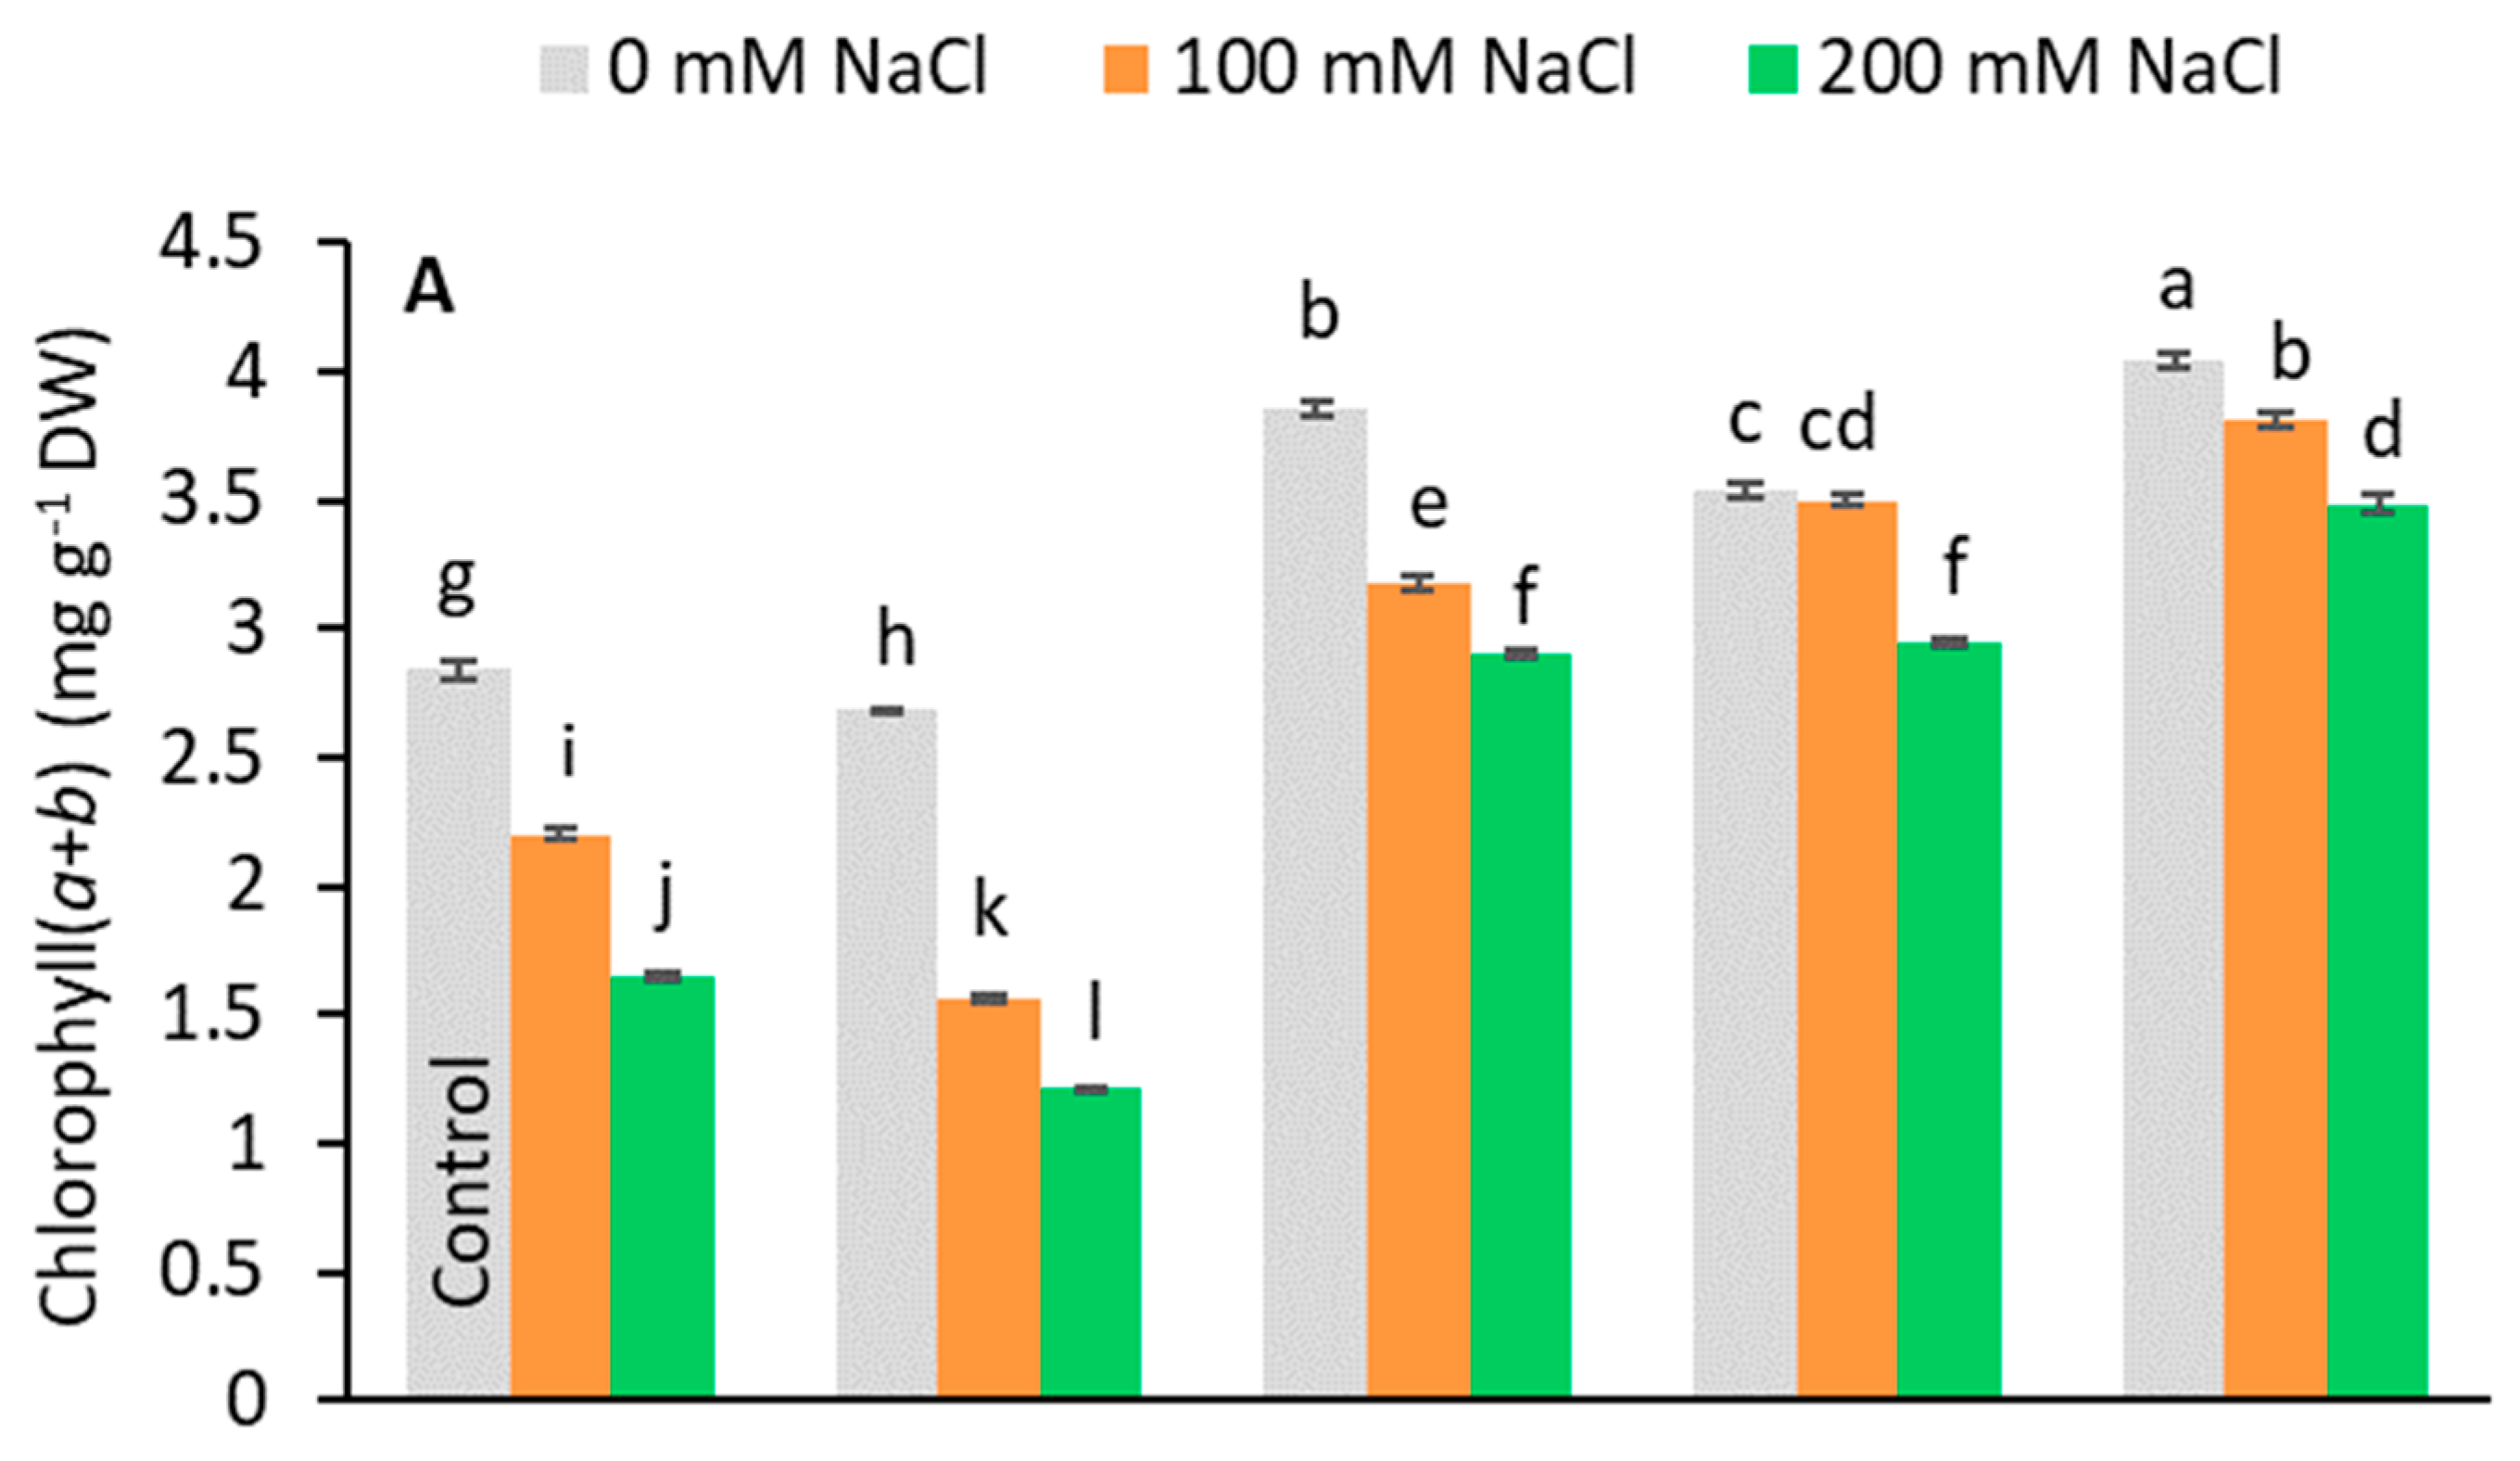
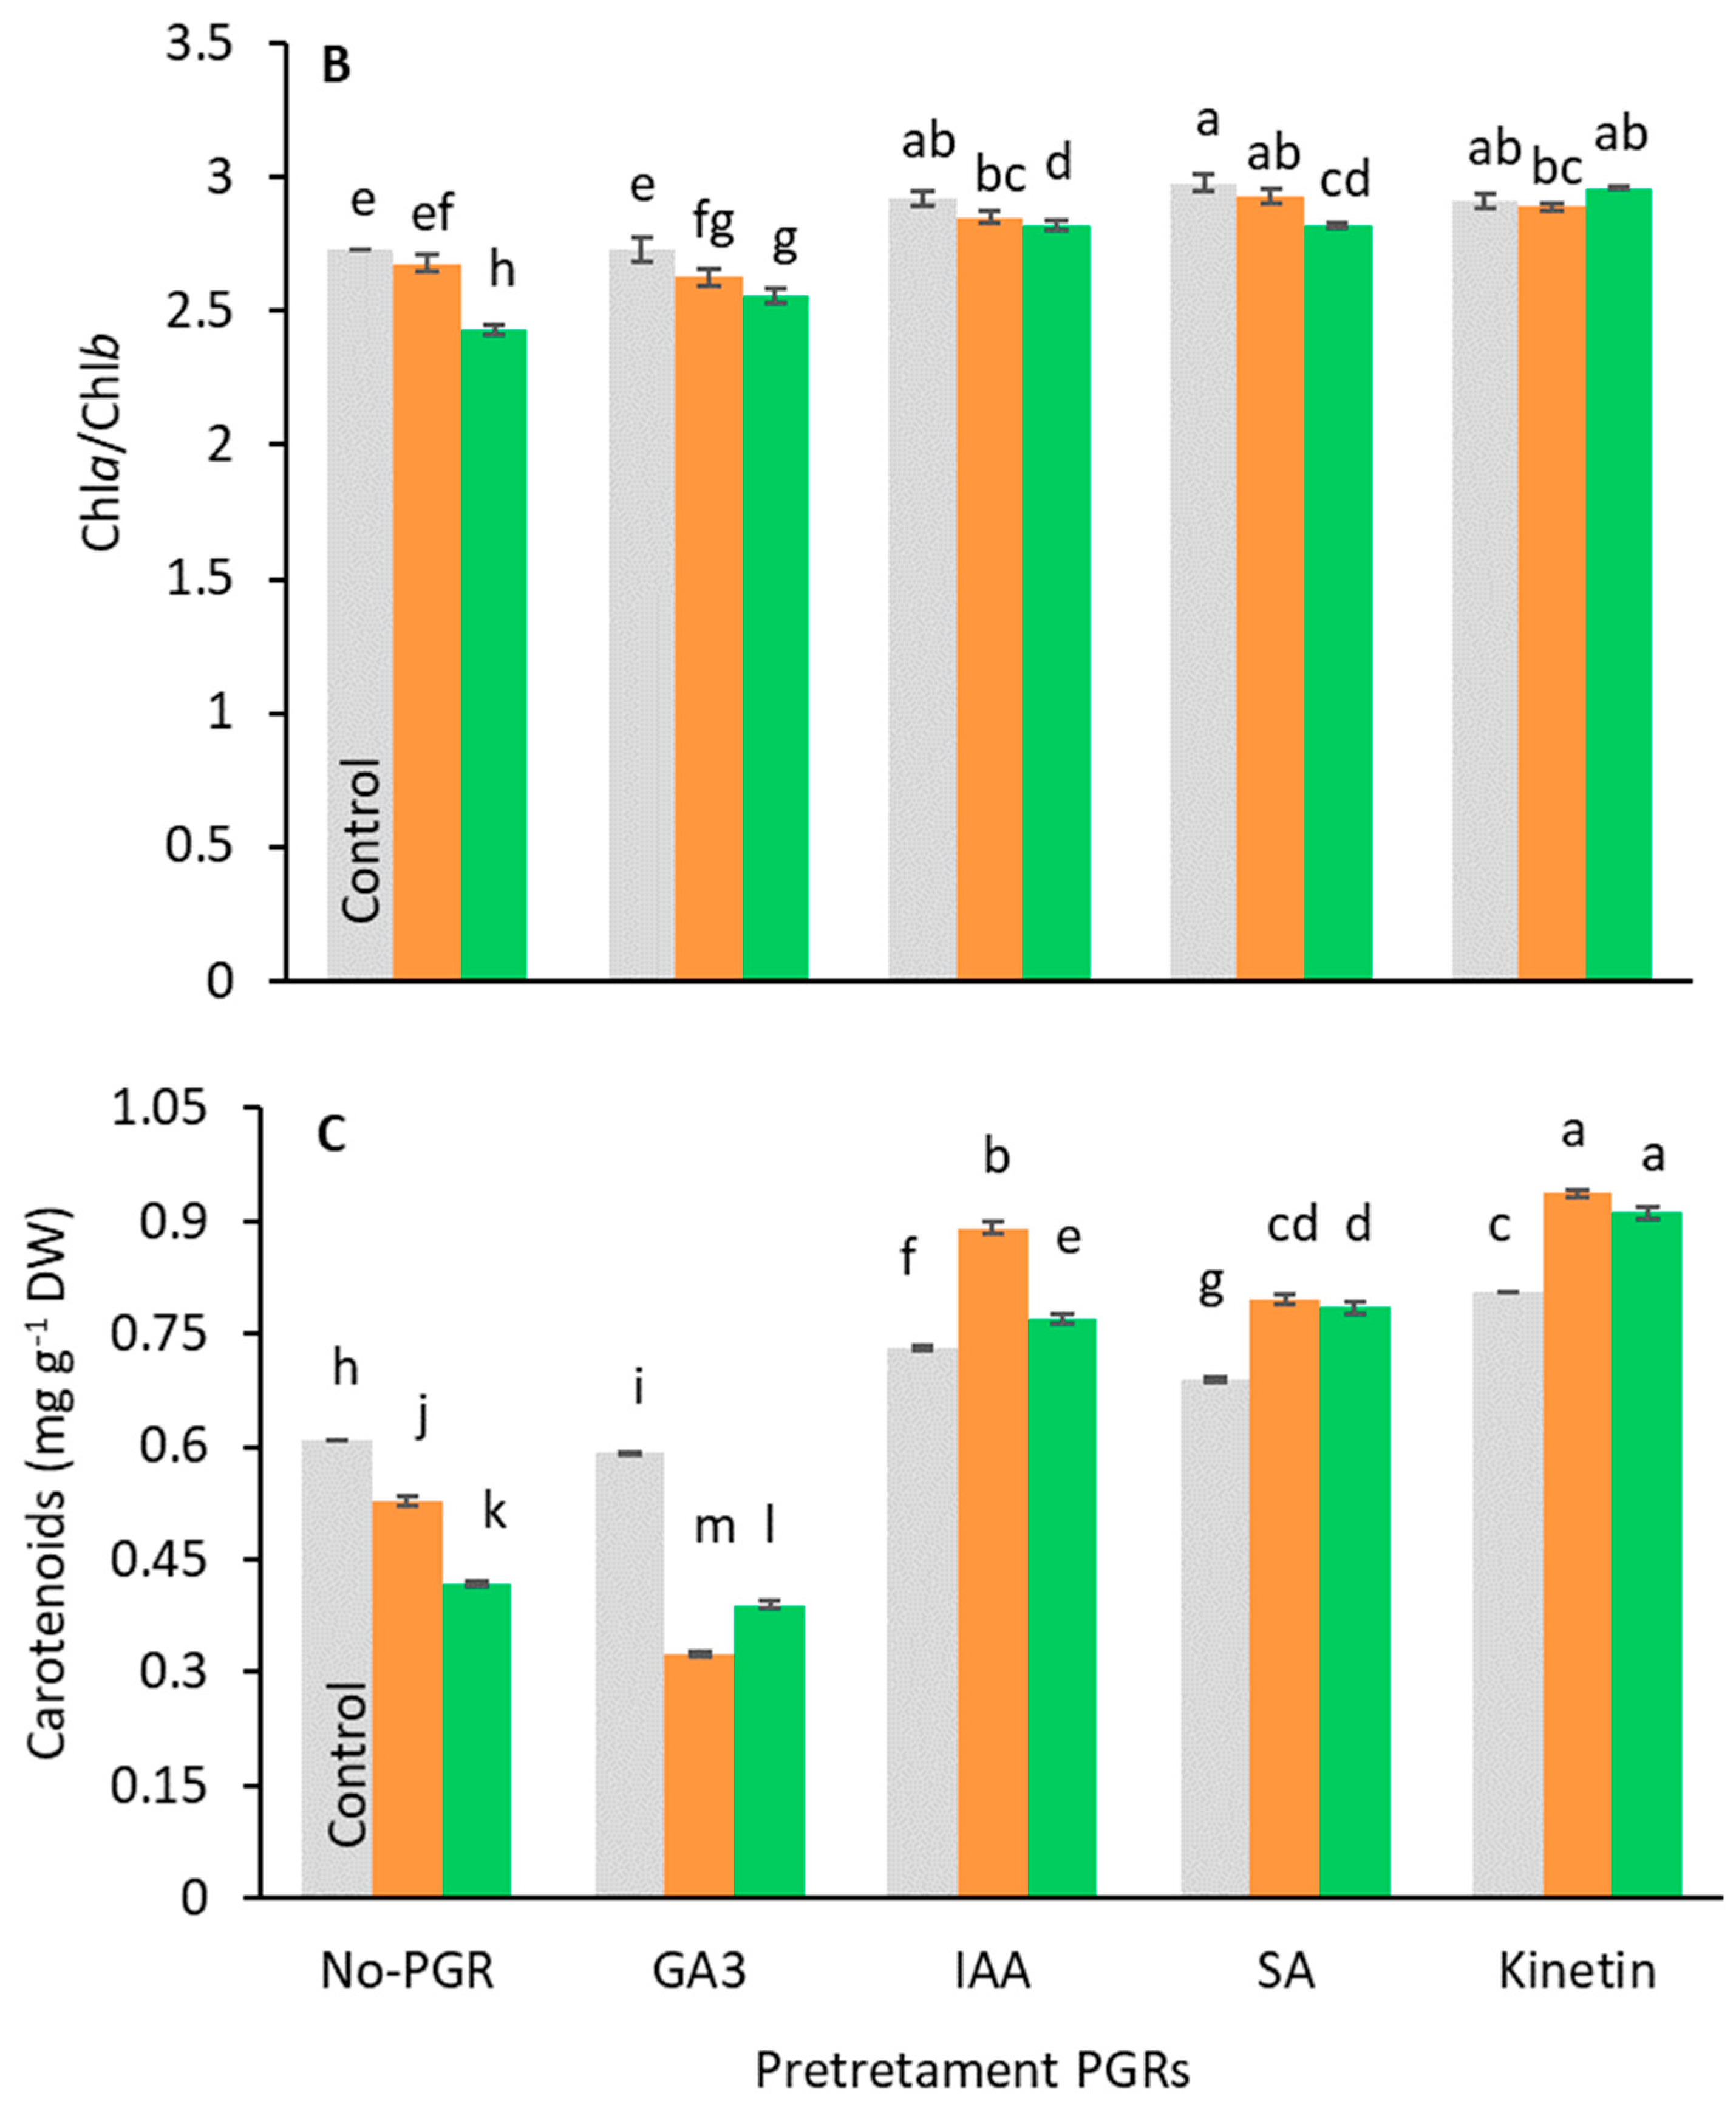
3.3. Effects of the Application Plant Growth Regulators (PGRs) on the Chlorophyll Content

Pigment analysis showed that the pretreatments caused different responses to stress (Figure 4). Under salt-stress, Chl(a+b) and carotenoid content decreased compared to the control in no-PGR plants and in plants pretreated with GA3 (Figure 4A,C). Conversely, in plants pretreated with IAA, SA, and Kinetin, the levels of these pigments were higher than in control plants at all tested salt levels, the highest value being found in plants pretreated with Kinetin. In general, the chlorophyll content decreased relative to salt levels. In no-PGR plants, the chlorophyll content decreased by 22.53% at 100 mM and by 41.90% at 200 mM NaCl compared to the control (Figure 4A). However, plants with Kinetin+200 mM NaCl had a chlorophyll content that was 110.91% higher than no-PGR+200 mM plants, whereas in plants with IAA+200 mM and SA+200 mM the chlorophyll content was 76.97% higher than in no-PGR plants+200 mM NaCl. At 100 mM NaCl, compared to no-PGR+100 mM NaCl plants, the increases in chlorophyll content were 73.18%, 59.09%, and 44.41% in plants pretreated with Kinetin, SA, and IAA, respectively. Compared to the control, in no-PGR plants, the carotenoid content decreased by 13.47% and 31.37% at 100 mM and 200 mM NaCl, respectively (Figure 4C). In plants pretreated with IAA, SA, and Kinetin, the carotenoid content was higher than in no-PGR plants. At 200 mM, the increases compared to no-PGR+200 mM were 117.94%, 87.80% and 83.97% for plants pretreated with IAA, SA and IAA, respectively. The Chla/Chlb ratio (Figure 4B) in no-PGR plants decreased at 200 mM NaCl compared to the control. Therefore, Chla was found to be more sensitive to salinity than Chlb. In plants pretreated with IAA, SA, and Kinetin, the Chla/Chlb ratio was higher than in the control plants for all salt levels, whereas in the pretreatment with GA3 it was lower at both 100 and 200 mM NaCl. However, with GA3+200 mM, the Chla/Chlb ratio was 5.35% higher than in no-PGR plants+200 mM NaCl.

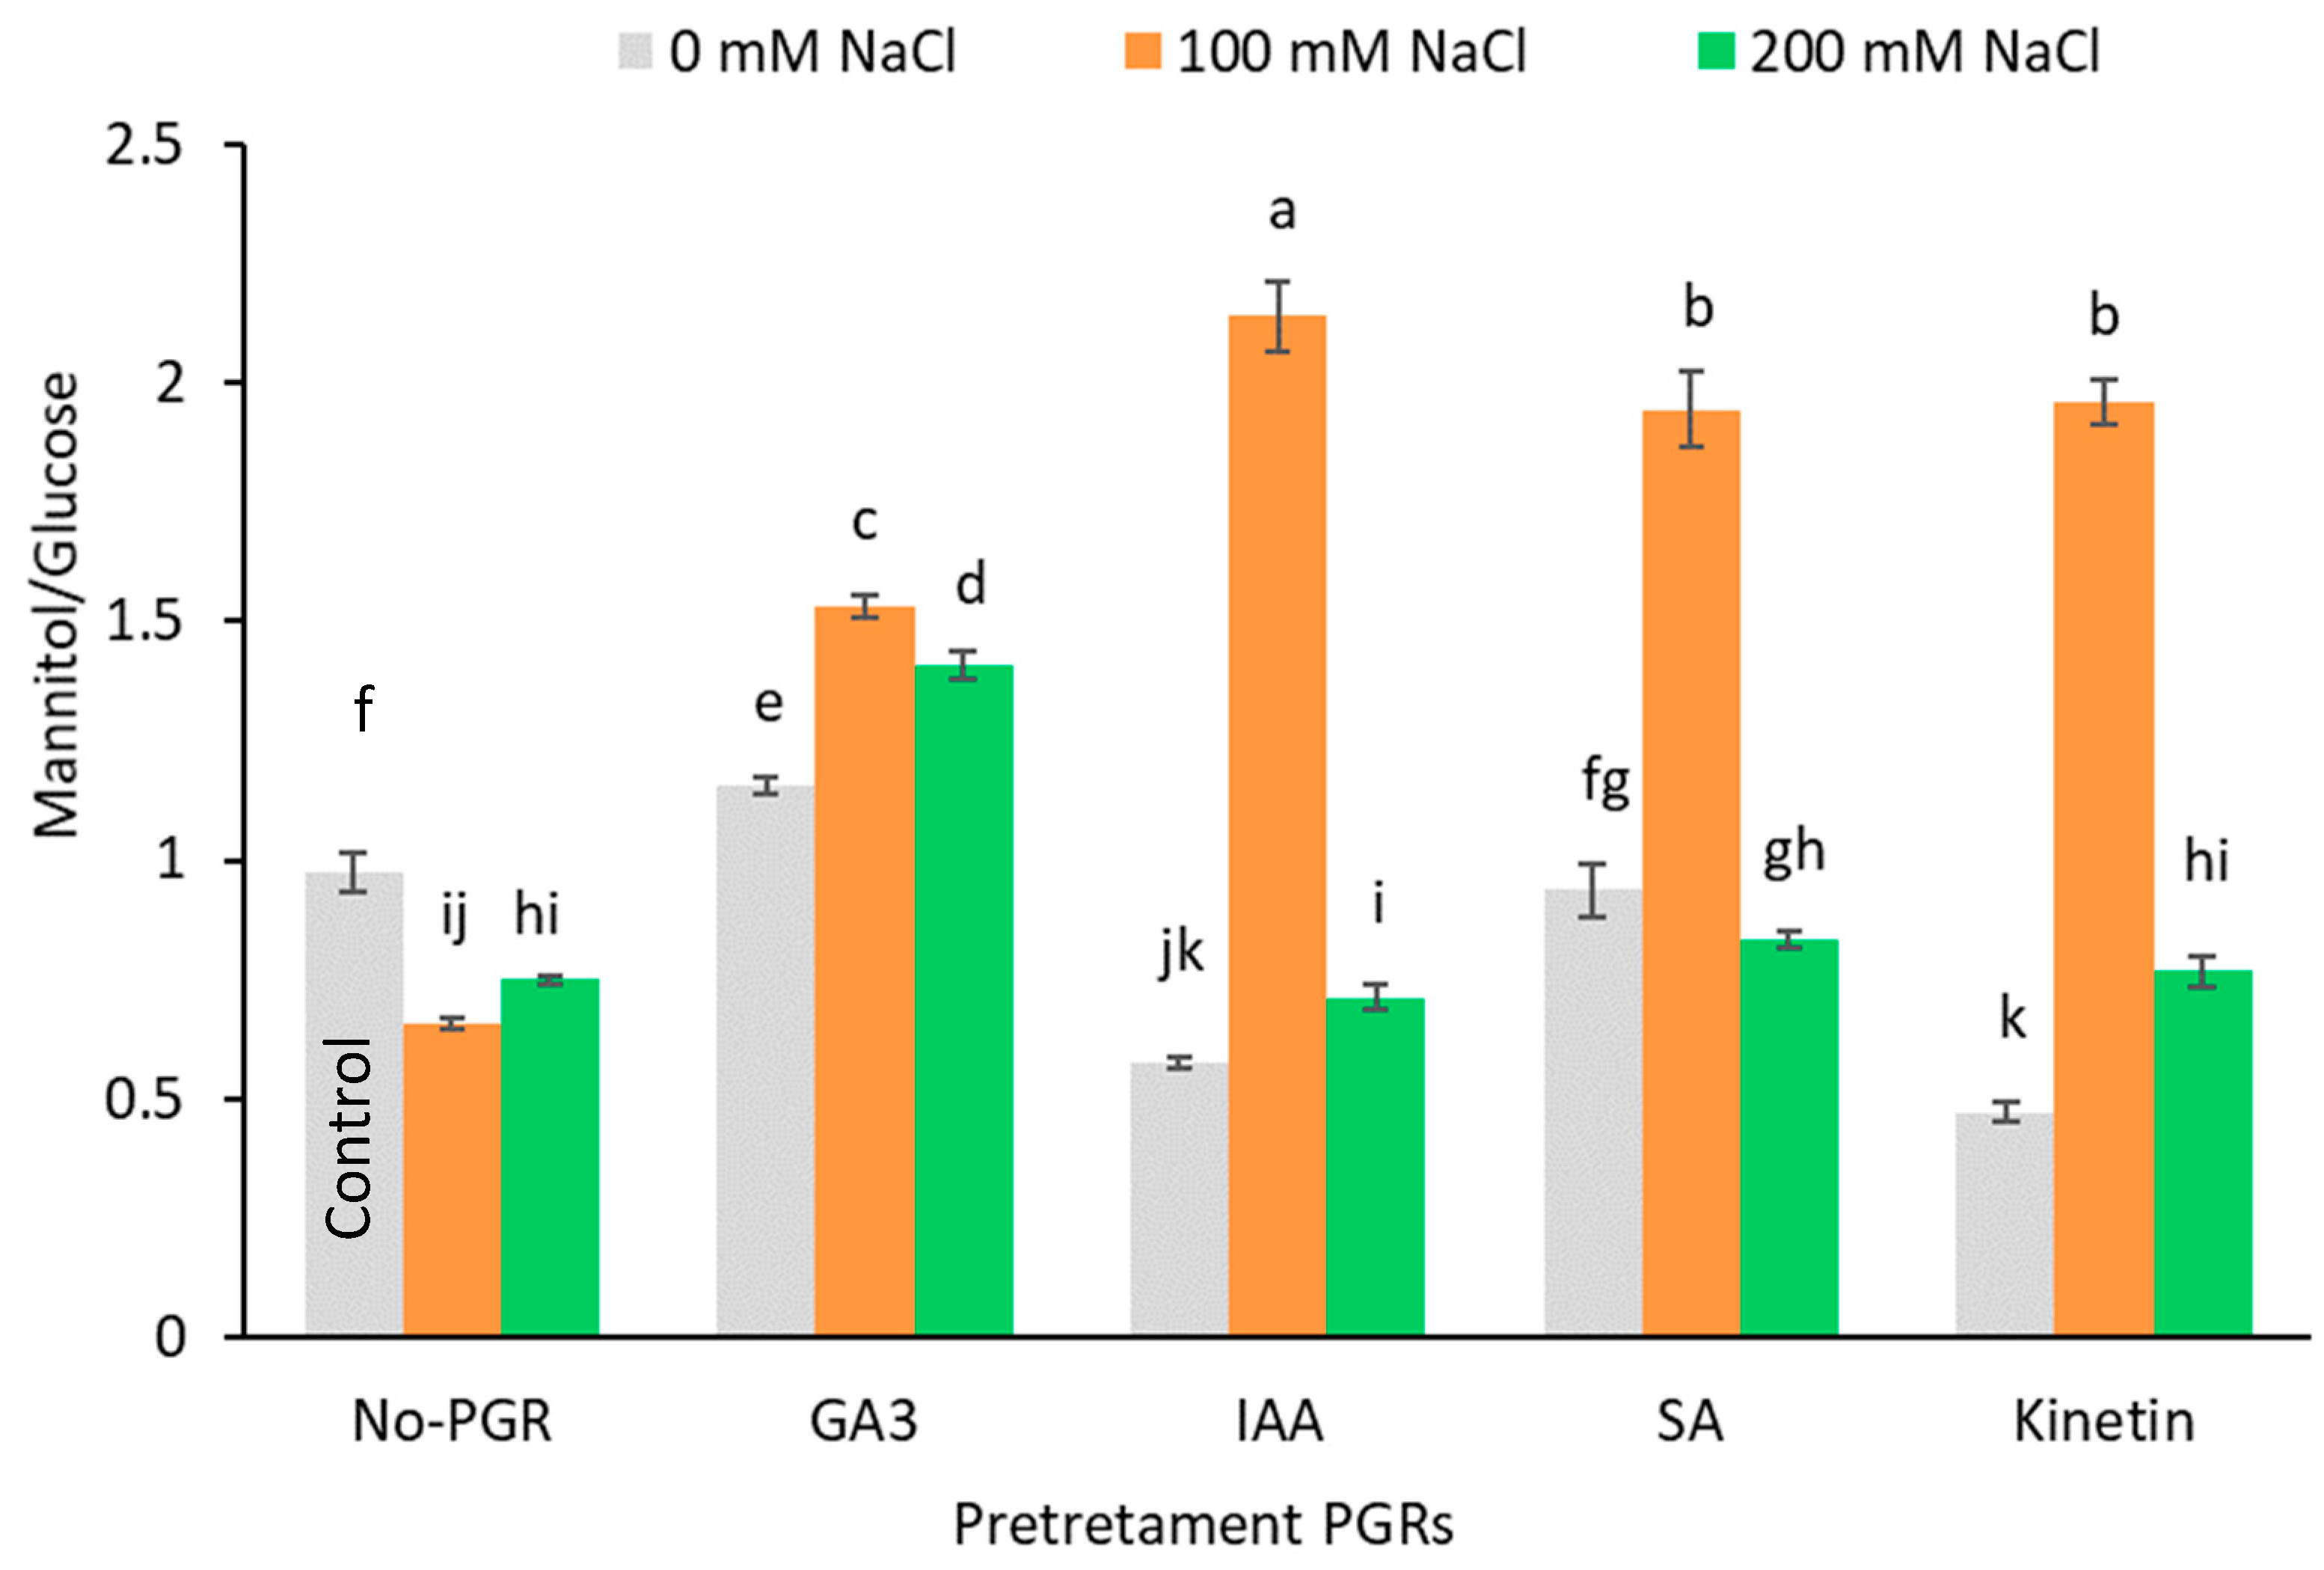
3.4. Effects of the Application of Plant Growth Regulators (PGRs) on Leaf Organic Solutes and Starch

The pretreatments significantly affected (p < 0.05) proline, fructose, glucose, inositol, mannitol, sucrose, and starch contents (Table 4 and Table 5). At 100 mM NaCl, the leaf proline concentration of plants increased significantly compared to the control in plants not pretreated with PGR (12.28%) and plants pretreated with IAA (21.18%), SA (19.26%) and Kinetin (19.32%) (Table 4). According to the LSD test, no differences were observed between the proline levels attained in no-PGR plants and in plants pretreated with IAA, SA, and Kinetin (p < 0.05). At 200 mM NaCl, only plants pretreated with IAA and SA accumulated proline (15.65% on average), while in GA3 plants proline concentration decreased at both 100 and 200 mM NaCl (15.66% on average). However, in plants with no NaCl, the highest proline values were observed in plants with GA3 (GA3+0 mM NaCl).
The leaves of plants grown without salt and pretreated with IAA had the highest levels of fructose, inositol, and sucrose but the lowest starch levels (Table 4 and Table 5). By contrast, plants pretreated with SA had the highest starch levels and the lowest sucrose, mannitol, inositol, and glucose levels. Under salt stress, no-PGR plants accumulated glucose at both salt levels and mannitol at 100 mM NaCl. Plants pretreated with GA3 only accumulated mannitol (100 and 200 mM NaCl), whereas plants pretreated with IAA, SA, and Kinetin accumulated fructose (100 and 200 mM NaCl), mannitol (100 and 200 mM NaCl), and glucose (only 200 mM NaCl). Plants pretreated with IAA had the highest increases compared to the control in fructose at 100 mM (40.76%) and 200 mM NaCl (59.91%), glucose at 200 mM (117.01%), and mannitol at 200 mM (58.70%).
In no-PGR and salt-stressed (100 and 200 mM NaCl) plants, glucose accumulation was favored over mannitol accumulation, as revealed by the significant decrease in the mannitol/glucose ratio compared to the control (27.71% on average) (Figure 5). Conversely, in plants pretreated with GA3, IAA, SA, and Kinetin grown at 100 mM NaCl, the mannitol/glucose ratio rose, with the greatest increase being observed in plants pretreated with IAA (119.51%), followed by plants pretreated with SA, Kinetin (100%), and GA3 (57.24%). However, glucose accumulation at 200 mM NaCl led to a fall in the mannitol/glucose ratio in plants pretreated with IAA, SA, and Kinetin. Compared to the control, the starch concentration (Table 4) only increased in plants grown at 100 mM NaCl and pretreated with GA3 (22.31 mg g−1 DW) and Kinetin (30.44 mg g−1 DW).

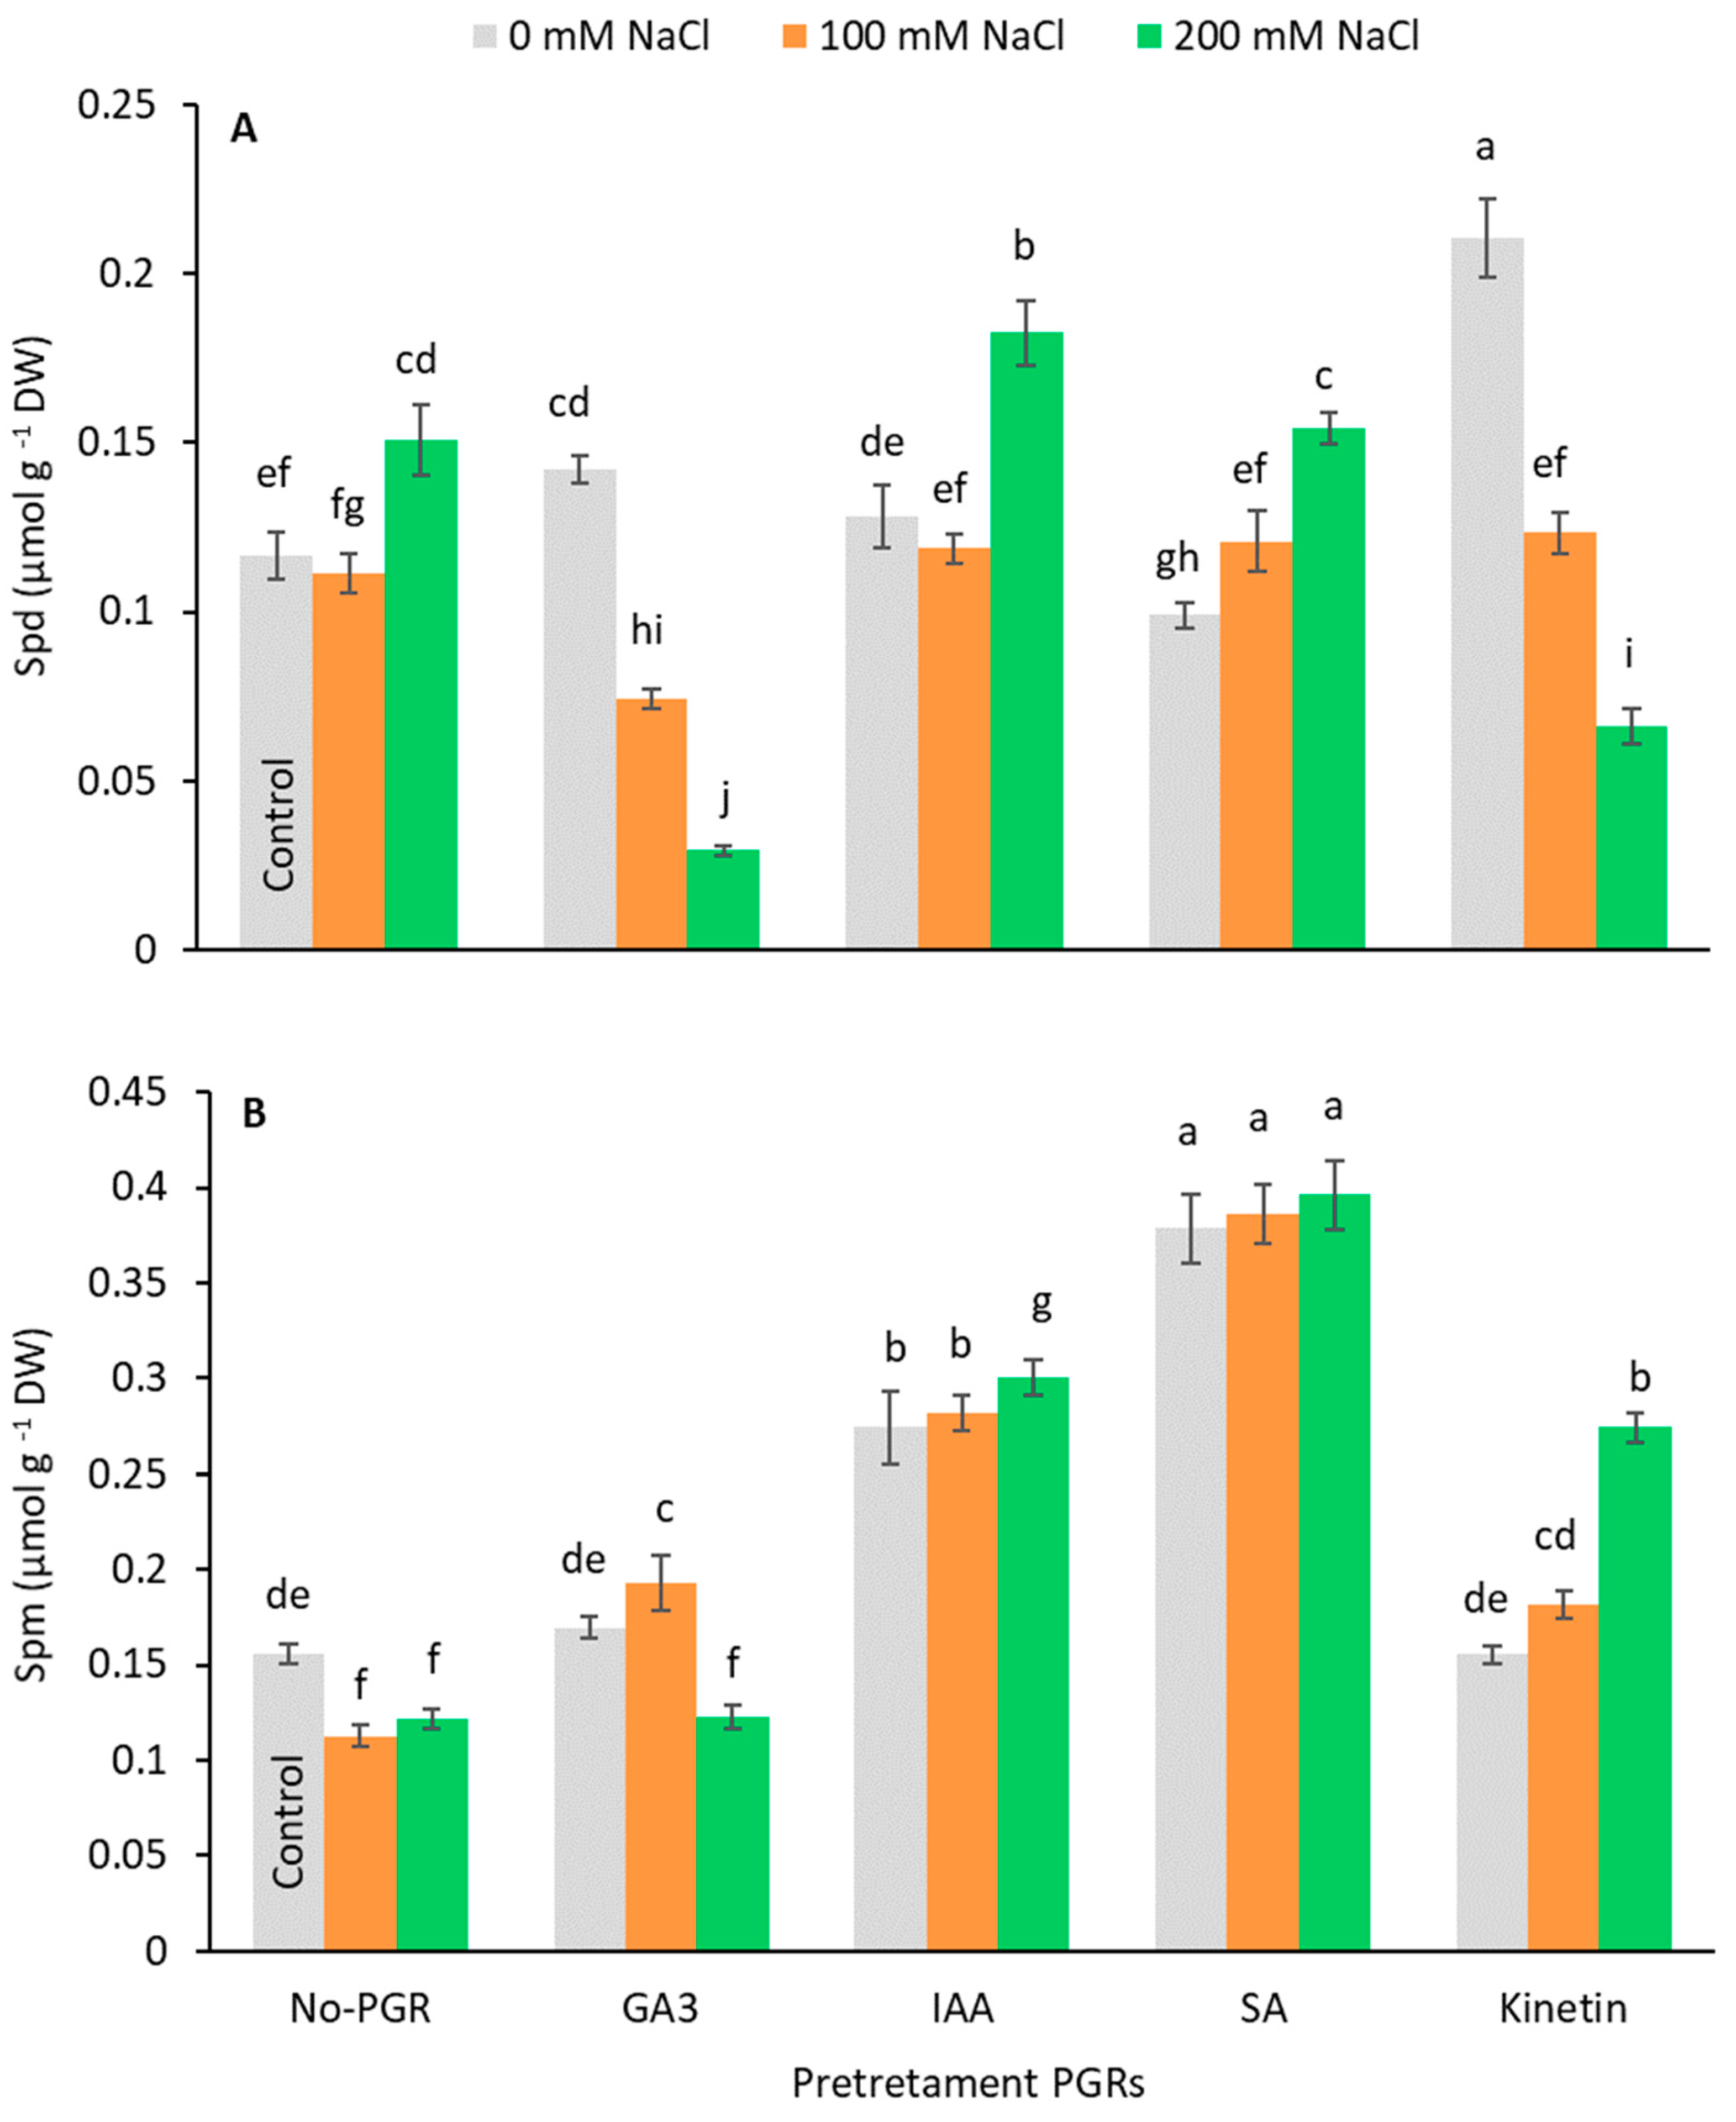
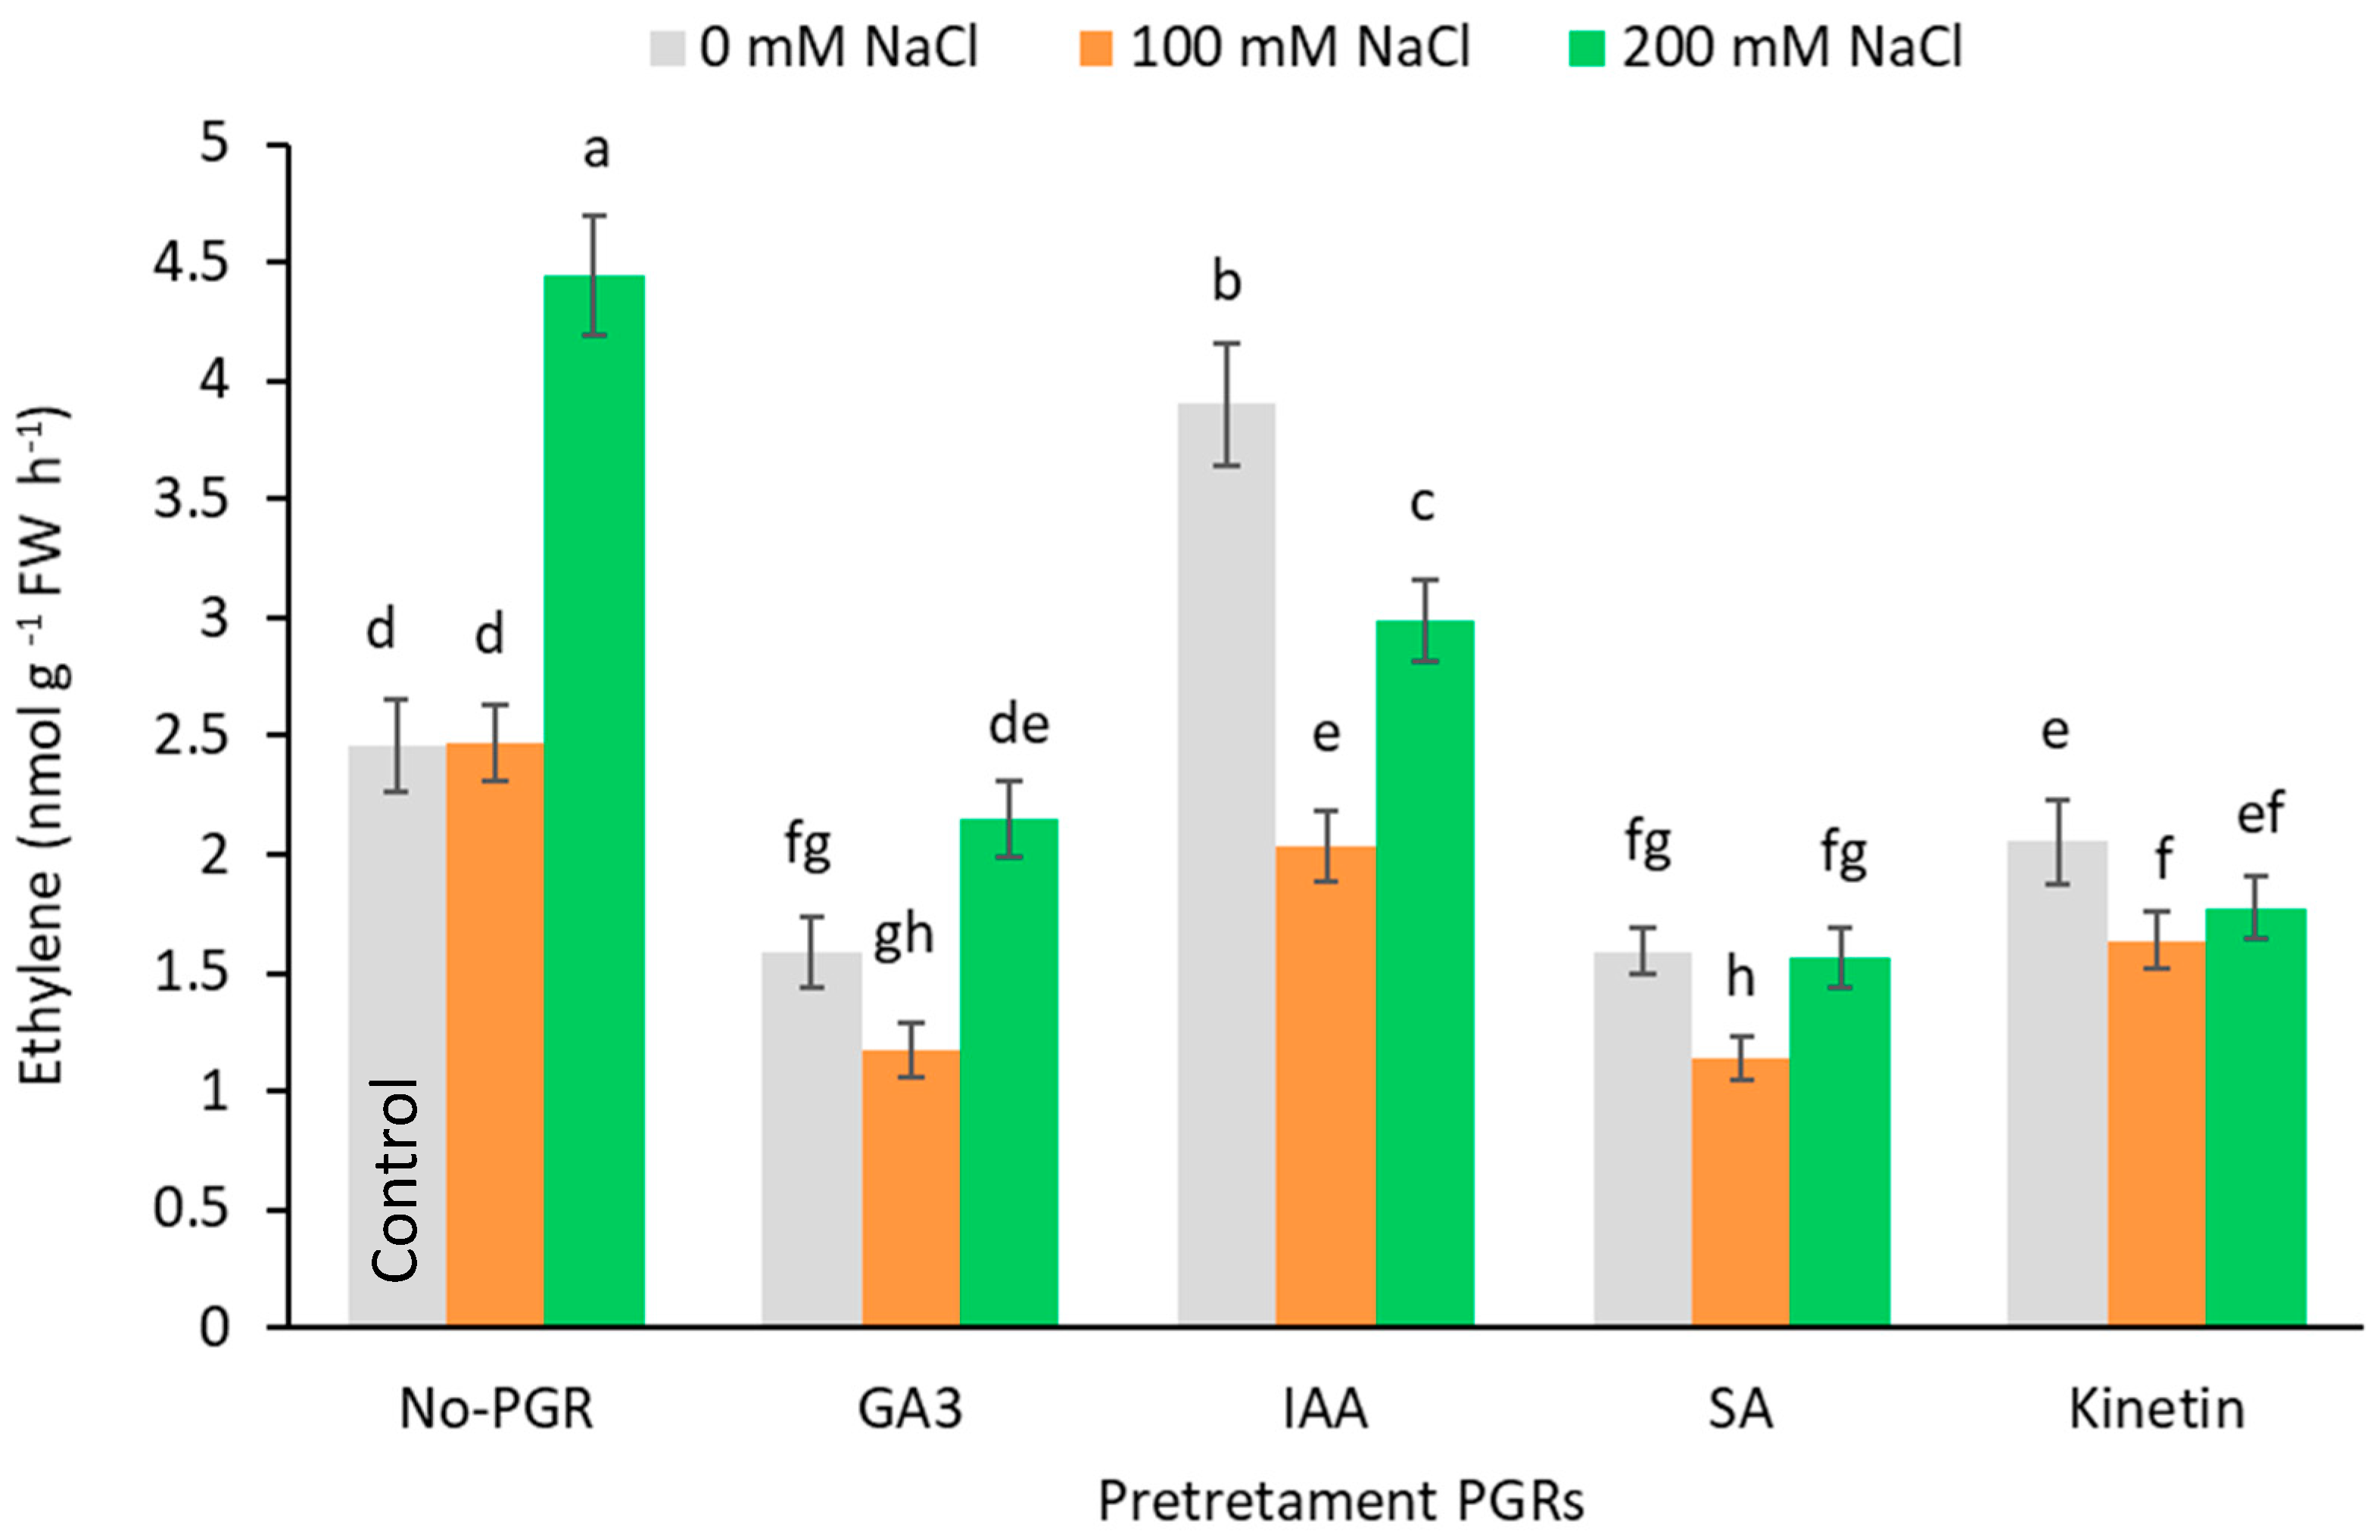
3.5. Effects of the Application of Plant Growth Regulators (PGRs) on Free Polyamine Content and Ethylene production

The endogenous Put, Spd, and Spm content were analyzed. Putrescine was not detected in any plant. In plants grown with no NaCl, the Spd content increased in those pretreated with GA3 (19.87%) and Kinetin (79.80%) (Figure 6A). Under saline stress, the Spd content only increased compared to the control at 200 mM NaCl in no-PGR plants (29.03%) and plants pretreated with IAA (56.18%) and SA (31.95%). By contrast, in plants pretreated with GA3 and Kinetin, the Spd content dropped as salinity increased. The Spm content (Figure 6B) increased with GA3+100 mM (23.79%), IAA+0 mM (75.81%), IAA+100 mM (80.91%), IAA+200 mM (56.18%), SA+0 mM (142.69%), SA+100 mM (147.56%), SA+200 mM (154.16%), and Kinetin+200 mM (75.83%), with the highest values being observed in plants pretreated with SA, in which no differences were detected between the three levels of salts assessed.
Compared to the control, ethylene production (Figure 7) fell in all pretreatments at 100 mM NaCl but increased at 200 mM in IAA-pretreated plants and reached its highest levels (4.44 nmol g−1 FW h−1) in no-PGR plants.

3.6. Multivariable Analysis

The most striking results include the significant negative correlation found between whole plant dry weight and leaf Na+ (−0.8690), root Na+ (−0.8455), Js-Na (−0.7999), and mannitol (−0.5269) and, by contrast, the positive correlation found between plant dry weight and Js-K (0.8350), leaf K+ (0.7212), root K+ (0.7182), root K+/Na+ (0.7052), leaf K+/Na+ (0.6949), sucrose (0.5544), and chlorophyll a/b (0.5468) (Table 6). Additionally, carotenoids (0.8425) and Spm (0.6689) correlated with chlorophyll a/b, while mannitol was highly correlated with root K+ (−0.8320), leaf K+/Na+ (−0.8294), root Na+ (0.8182), root K+/Na+ (−0.8107), Js-Na (0.7788), leaf Na+ (0.7630), and Js-K (−0.7032).

4. Discussion

Salinity, recognized as one of the most pressing problems affecting the growth and development of plants, can have an important impact on the quantity and quality of yields [41,61,62]. Along with genetic selection, salt tolerance in olive trees can also be improved by using physiological tools [42,63] since numerous species improve both their growth rates and abiotic stress tolerance after the application of PGRs [59,61,63,64,65,66]. PGRs have been reported to alleviate the adverse effects of salt stress on physiological and biochemical characteristics of plants and on crop yields [49,67,68]. However, few studies have ever examined the responses of olive plants pretreated with PGRs to salinity.
Our results show that in olive plants of the Picual cultivar not pretreated with PGRs biomass decreased as salinity levels increased, which could be due to lower K+ and greater Na+ concentrations (accumulation of toxic ions) in leaves shown by the high correlations detected between these variables. This observation agrees with the results of other authors who have reported that moderate (100 mM NaCl) and severe (200 mM NaCl) salt stresses are related to a decrease in growth rate in certain olive cultivars [42,69,70,71,72]. According to Munns and Tester [73], one of the first responses of plants to salinity is a reduction in leaf growth, which limits the accumulation of toxic ions in leaves and lessens water loss. Salinity at 200 mM NaCl decreased whole plant DW in the Picual plants by 48%. Other authors report whole plant DW reductions of 54% in the cultivar Oueslati [42] and 74% in the cultivar Koronoiki [69,74] state that salinity (200 mM NaCl) severely decreased plant DW in the cultivars Casta Cabra (55.61%), Cornicabra (57.19%), Frantoio (47.06%), Ocal (35.42) and Picudo (46.08%). Nonetheless, pretreatment with PGRs (GA3, IAA, SA, and Kinetin) helped minimize the adverse effects of salinity on growth. Similar findings were found for other olive cultivars and plant species, in which GA3 application significantly promoted plant growth under salt stress [27,75,76]. According to Yang et al. [77], the effect of plant growth regulators on plants’ responses to salinity depends on the species involved. We observed that the application of SA mitigated the inhibition caused by NaCl in the dry weight of olive plants of the cultivar Picual, a similar effect having been found by Methenni et al. [42] for the cultivar Oueslati. However, Aliniaeifard et al. [46] reported for the cultivar Zard that SA did not have any positive effects on growth. Therefore, the effects of SA on the growth of olive plants grown under salt stress is cultivar-dependent. Moreover, it has been shown that exogenous IAA treatments increase plant growth under saline conditions in several commercial crops [78,79], just as we found for the Picual cultivar. Moreover, according to the data obtained in this study, the status of the leaf relative water content (LRWC) in the Picual cultivar was greater than in other Mediterranean cultivars tested for moderate and severe saline stress [71,80].
The olive tree is regarded as a moderately saline-tolerant plant [81], even though the response of plants to saline stress is a cultivar-dependent characteristic [70,75,82]. Mechanisms of salinity tolerance can be classified into three categories: osmotic tolerance, ion exclusion and tissue tolerance [83]. According to Charzoulakis [84], salt tolerance in olive cultivars is associated with the effectiveness of the mechanisms of ion exclusion and the retention of saline ions in roots. In the case of ion exclusion, Na+ is transported to roots, thereby reducing the accumulation of toxic concentrations of Na+ in leaves [83]. Our data indicate that the Picual cultivar not pretreated with PGRs is not able to limit Na+ translocation to actively growing tissues, unlike the other most salinity-tolerant olive cultivars [42,70,75]. However, the Picual cultivar pretreated with IAA and SA were characterized by high accumulations of Na+ in roots and an inhibition of the translocation of this element to leaves. Therefore, of all the pretreatments, those with IAA and SA most favored the ion exclusion mechanism and consequently the salinity tolerance in the Picual cultivar. Similar findings have been reported for the Oueslati cultivar pretreated with SA [42].
Other studies have shown that salinity tolerance is positively associated with a high K+/Na+ ratio [70,80,85]. In fact, plant growth was positively correlated to the K+/Na+ ratio in leaves and roots. It has been shown that under salinity stress, a lower K+/Na+ ratio is provoked by competition between these two ions for binding sites on roots. The entry of the sodium ion into the cytosol through non-selective channels leads to a depolarization of the cell membrane, resulting in K+ leakage and its decrease in cells [19]. Under saline conditions, the K+/Na+ ratio in leaves improved in the Picual cultivar pretreated with IAA and SA. A higher K+/Na+ ratio ensures greater K+ uptake but restricts Na+ ions, which enhances biochemical processes under salinity. Methenni et al. [42] have reported similar results for the cultivar Oueslati pretreated with SA. Additionally, analogous findings have been obtained in other crops after the application of IAA and SA [30,78,86]. Therefore, pretreatment with IAA and SA mitigated salt-induced damage by reducing Na+ accumulation and K+ loss, leading to an improvement in the K+/Na+ ratio in the leaves of the Picual olive cultivar. However, in the pretreatments with GA3 and Kinetin, the improvement in the rate of K+ transport to leaves was not sufficient to compensate for the rate of Na+ transport.
Under saline conditions, the chl(a+b) and carotenoid content of leaves decreased compared to control plants in both non-pretreated and GA3-pretreated plants; on the other hand, in plants pretreated with IAA, SA and Kinetin pigment content was higher than in non-pretreated plants (including under saline conditions). Thus, the carotenoid content was not affected by saline stress. The decrease in photosynthetic pigments provoked by salinity has also been reported for other olive cultivars and tree species [70,82,87]. The reduction in chlorophyll content could be associated with oxidative stress and an increase in reactive oxygen species (ROS) [72]. Similarly, it has been reported that salt stress stimulates the accumulation of ROS, which harms plant tissues as a result of the oxidization of compounds, such as proteins, lipids, carbohydrates, pigments, and nucleic acids [88,89]. Plants can enhance their tolerance to salt stress by regulating the ROS scavenging [90]. Chla/Chlb ratio showed similar values for the IAA, SA and Kinetin pretreatments under both saline and non-saline conditions. The positive effect of IAA and SA pretreatments on the chlorophyll content under salt-stress is consistent with other studies [91,92,93]. According to Jabeen and Ahmad [94], SA strengthens the antioxidant system and so minimizes the deleterious effects of stress. Bashir et al. [95] suggest that, under stress conditions, carotenoid accumulation in olive trees could be related to metabolic changes occurring during stress adaptation without being directly involved in stress-tolerance mechanisms. In studies of plants under salt stress, Kinetin was able to alleviate oxidative stress by directly or indirectly scavenging more ROS [91,96].
Higher plants can improve their tolerance to salt stress by homeostasis cellular regulation. Organic osmolytes that accumulate in stressful situations include proline, sugars, and sugar alcohols, which are used to regulate osmotic adjustment, maintain turgor, and scavenge ROS [90,97,98,99], as well as protecting physiological processes against harmful inorganic compounds [100,101]. Proline accumulation is the first response to osmotic stress in plants. This osmolyte has a high hydration capacity, stabilizes subcellular structures, buffers the redox potential, protects the photosynthetic machinery, and, as an antioxidant, acts as a molecular signal that allows for changes in gene expression [95,102,103,104]. Our data indicate that the Picual cultivar can accumulate proline at 100 mM NaCl, an observation that agrees with previous studies of other olive cultivars and plants [71,81,105,106,107]. In addition, studies of the salt-tolerant cultivar Chemlali have reported accumulations of proline at 200 mM NaCl [105,107], as occurred in the Picual cultivar pretreated with IAA and SA. Ayaz et al. [70] also detected proline accumulation at 200 mM NaCl in the cultivars Gemlik, Ayvalik and Kilis. Proline accumulation may be linked to protein hydrolysis, a greater expression of enzymes of synthesis, a decrease in degradative enzymes, and less use of this osmolyte due to the use of other osmolytes, such as mannitol and glucose, at higher concentrations [97,108,109].
Glucose, mannitol, fructose, sucrose, starch, and inositol (in decreasing order of abundance) are just five of the sugars present in olive leaves [80]. Mannitol accumulated in the leaves of non-pretreated plants of the cultivar Picual in response to stress at 100 mM NaCl, a finding that confirms previous observations in other olive cultivars [27,71,80,110]. In Picual plants pretreated with PGRs, mannitol accumulated after the addition of both 100 and 200 mM NaCl. Mannitol levels were also higher in plants pretreated with IAA, SA and Kinetin than in non-pretreated plants. These results are confirmed by the correlation obtained between mannitol and Na+ concentrations. It appears that in the Picual cultivar glucose and mannitol synthesis are activated under stress, with mannitol being the most important osmolyte at 100 mM. This osmolyte could help maintain the osmotic balance between cytoplasm and vacuole and contributes to the scavenging of oxygen radicals produced by stress [79]. Moreover, glucose and fructose increased with greater salinity, as has been previously described for other olive cultivars and other plant species subjected to different abiotic stresses [80,111].
Polyamines (PAs) are polycationic compounds with low molecular weights that are present in different cellular compartments. In higher plants, the most common PAs are putrescine (Put), spermidine (Spd) and spermine (Spm) [2,3,4,112]. These compounds control ion homeostasis, protect photosynthetic pigments, and regulate antioxidant systems and the compounds that stimulate plant abiotic stress tolerance [33,113]. On the other hand, ethylene is a stress hormone and salinity may promote ethylene production and so modulate the activity of the enzymes that regulate the synthesis of this phytohormone [114]. Moreover, Spd and Spm biosynthesis is linked to ethylene production via a common precursor S-adenosylmethionine (SAM) [115,116]. At high NaCl levels (200 mM NaCl), the non-pretreated and IAA-pretreated plants produced more Spd and ethylene than the control plants. In addition, SA-pretreated plants also accumulated Spd at high salt levels, while Kinetin-pretreated plants only accumulated Spm. Therefore, at high NaCl levels (200 mM), Spd would seem to be a good indicator of stress in no-PGR plants and in plants pretreated with IAA and SA, while Spm could be a good indicator of stress in plants pretreated with Kinetin. Several authors have suggested that Spd levels may be a good indicator of salt tolerance [113,117]. Our results agree with this statement, since in our experiment the plants pretreated with IAA and SA had the highest Spd and Spm levels, respectively, at high salinity, which could be related to their ability to decrease salt-induced damage, prevent K+ loss, reduce Na+ accumulation, and ultimately improve the K+/Na+ ratio, thereby strengthening the antioxidant systems and protecting the photosynthetic pigments in the Picual cultivar leaves. In other plant species, it has been demonstrated that Spd and Spm can improve growth and reduce salinity-provoked oxidative damage by enhancing antioxidant systems [118,119]. High levels of Spd and Spm perform similar actions in the leaves of the Picual olive cultivar.

5. Conclusions

Our results show that the pretreatments of Picual olive cultivar plants with IAA and SA were the most effective of all the studied pretreatments and could significantly improve biomass production under saline conditions. In addition, IAA and SA favored the Na+ exclusion mechanism by reducing Na+ transport from roots to leaves and improved the K+/Na+ ratio. Soluble sugars increased significantly under salinity, indicating that these two organic osmolytes may play an important role in osmotic adjustment under stress. Specifically, IAA and SA enhanced the accumulation of proline, fructose, and mannitol at 100 and 200 mM NaCl and glucose at 200 mM. The Kinetin pretreatment also favored tissue tolerance through the accumulation of fructose, mannitol (100 and 200 mM), and glucose (200 mM). The IAA and SA pretreatments promoted the accumulation of Spd and Spm, respectively, which could be related to an increase in the antioxidant system, the stabilization of membranes, and greater pigment protection. These results indicate that pretreatments with IAA and SA can alleviate the adverse effects of salt stress in Olea europaea Picual cultivar plantlets.

Author Contributions

Conceptualization, M.d.P.C. and M.B.; methodology, M.d.P.C., C.A. and M.B.; software, M.M.; validation, M.d.P.C., C.A., M.M. and M.B.; formal analysis, C.A.; investigation, C.A.; resources, M.d.P.C.; data curation, M.d.P.C. and C.A.; writing—original draft preparation, M.d.P.C. and M.B.; writing—review and editing, M.d.P.C. and M.B.; visualization, M.M.; supervision, M.d.P.C.; project administration, M.d.P.C.; funding acquisition, M.d.P.C. All authors have read and agreed to the published version of the manuscript.

Funding

This research was supported by the R&D project of Viveros Jarico S.L. funding by the IDEA agency of the Junta de Andalucía, grant number 805 (University of Jaén) Improvement of salinity tolerance in olive by pretreatment with growth regulators.

Data Availability Statement

The data presented in this study are available from the corresponding author, María del Pilar Cordovilla, upon request.

Acknowledgments

We wish to thank the Central Research Support Services of the University of Jaén for their invaluable help in the growing of plants and quantification of metabolites. We thank Michael Lockwood for his collaboration in the translation of present paper.

Conflicts of Interest

The authors declare no conflict of interest.

References

  1. Haj-Amor, Z.; Araya, T.; Kim, D.G.; Bouri, S.; Lee, J.; Ghiloufi, W.; Yang, Y.; Kang, H.; Jhariya, M.K.; Banerjee, A.; et al. Soil salinity and its associated effects on soil microorganism, greenhouse gas emissions, crop yield, biodiversity and desertification: A review. Sci. Total Environ. 2022, 843, 156946. [Google Scholar] [CrossRef]
  2. Acosta-Motos, J.R.; Ortuño, M.F.; Bernal-Vicente, A.; Díaz-Vivancos, P.; Sánchez-Blanco, M.J.; Hernández, J.A. Plant responses to salt stress: Adaptative mechanisms. Agronomy 2017, 7, 18. [Google Scholar] [CrossRef] [Green Version]
  3. Gupta, B.; Huang, B. Mechanism of salinity tolerance in plants: Physiological, biochemical, and molecular characterization. Int. J. Genom. 2014, 2014, 701596. [Google Scholar] [CrossRef] [PubMed] [Green Version]
  4. Hassani, A.; Azapagic, A.; Shokri, N. Global predictions of primary soil salinization under changing climate in the 21st century. Nat. Commun. 2021, 12, 6663. [Google Scholar] [CrossRef] [PubMed]
  5. Leisner, C.P. Review: Climate change impacts on food security-focus on perennial cropping systems and nutritional value. Plant Sci. 2020, 293, 110412. [Google Scholar] [CrossRef]
  6. Cuevas, J.; Daliakopoulos, I.N.; Moral, F.; Hueso, J.J.; Tsanis, I.K. A Review of Soil-Improving Cropping Systems for Soil Salinization. Agronomy 2019, 9, 295. [Google Scholar] [CrossRef] [Green Version]
  7. Daliakopoulos, I.N.; Tsanis, I.K.; Koutroulis, A.; Kourgialas, N.N.; Varouchakis, A.E.; Karatzas, G.P.; Ritsema, C.J. The threat of soil salinity: A European scale review. Sci. Total Environ. 2016, 573, 727–739. [Google Scholar] [CrossRef]
  8. Feeding the World, Eradicating Hunger. In Proceedings of the World Summit on Food Security, Rome, Italy, 16–18 November 2019. (WSFS 2009/INF/2).
  9. Khan, M.Z.; Zaidi, S.S.A.; Amin, I.; Mansoor, S. A CRISPR way for fast-forward crop domestication. Trends Plant Sci. 2019, 24, 293–296. [Google Scholar] [CrossRef]
  10. Huang, Y.; Cao, H.; Yang, L.; Chen, C.; Shabala, L.; Xiong, M.; Niu, M.; Liu, J.; Zheng, Z.; Zhou, L.; et al. Tissue-specific respiratory burst oxidase homolog-dependent H2O2 signaling to the plasma membrane H+-ATPase confers potassium uptake and salinity tolerance in Cucurbitaceae. J. Exp. Bot. 2019, 70, 5879–5893. [Google Scholar] [CrossRef]
  11. Shailani, A.; Joshi, R.; Singla-Pareek, S.L.; Pareek, A. Stacking for future: Pyramiding genes to improve drought and salinity tolerance in rice. Physiol. Plant. 2021, 172, 1352–1362. [Google Scholar] [CrossRef]
  12. Chen, G.; Zheng, D.; Feng, N.; Zhou, H.; Mu, D.; Liu, L.; Zhao, L.; Shen, X.; Rao, G.; Li, T. Effects of exogenous salicylic acid and abscisic acid on growth, photosynthesis and antioxidant system of rice. Chil. J. Agric. Res. 2022, 82, 21–32. [Google Scholar] [CrossRef]
  13. Johnson, R.; Puthur, J.T. Seed priming as a cost effective technique for developing plants with cross tolerance to salinity stress. Plant Physiol. Biochem. 2021, 162, 247–257. [Google Scholar] [CrossRef] [PubMed]
  14. Pacholczak, A.; Zajączkowska, M.; Nowakowska, K. The effect of brassinosteroids on rootting of stem cuttings in two barberry (Berberis thunbergii L.) cultivars. Agronomy 2021, 11, 699. [Google Scholar] [CrossRef]
  15. Rhaman, M.S.; Imran, S.; Rauf, F.; Khatun, M.; Baskin, C.C.; Murata, Y.; Hasanuzzaman, M. Seed priming with phytohormones: An effective approach for the mitigation of abiotic stress. Plants 2021, 10, 37. [Google Scholar] [CrossRef]
  16. Tahir, M.T.; Anjum, M.A.; Saqib, M.; Khalid, M.F.; Hussain, S. Seed priming and foliar application of plant growth regulators affect the growth and yield of okra under calcareous soils. Acta Sci. Pol. Hortorum Cultus 2019, 18, 25–33. [Google Scholar] [CrossRef]
  17. Ashfaq, M.; Khan, S. Role of phytohormones in improving the yield of oilseed crops. In Oils Seed Crops: Yield and Adaptation Under Environmental Stress, 1st ed.; Ahmad, P., Ed.; John Wiley & Sons Ltd.: Hoboken, NJ, USA, 2017; Volume 9, pp. 165–183. [Google Scholar] [CrossRef]
  18. Zheng, L.; Ma, H.; Jiao, Q.; Ma, C.; Wang, P. Phytohormones: Important participators in plant salt tolerance. Int. J. Agric. Biol. 2020, 24, 319–332. [Google Scholar] [CrossRef]
  19. Jayakannan, M.; Bose, J.; Babourina, O.; Rengel, Z.; Shabala, S. Salicylic acid in plant salinity stress signalling and tolerance. Plant Growth Regul. 2015, 76, 25–40. [Google Scholar] [CrossRef]
  20. Farhangi-Abriz, S.; Alaee, T.; Tavasolee, A. Salicylic acid but not jasmonic acid improved canola root response to salinity stress. Rhizosphere 2019, 9, 69–71. [Google Scholar] [CrossRef]
  21. Khoshbakht, D.; Asgharei, M.R. Influence of foliar-applied salicylic acid on growth, gas-exchange characteristics, and chlorophyll fluorescence in citrus under saline conditions. Photosynthetica 2015, 53, 410–418. [Google Scholar] [CrossRef]
  22. Khan, M.S.; Akther, T.; Ali, D.M.; Hemalatha, S. An investigation of the role of salicylic acid alleviates the saline stress in rice crop (Oryza sativa (L.)). Biocatal. Agric. Biotechnol. 2019, 18, 101027. [Google Scholar] [CrossRef]
  23. Bukhat, S.; Manzoor, H.; Athar, H.R.; Zafar, Z.U.; Azeem, F.; Rasul, S. Salicylic acid induced photosynthetic adaptability of Raphanus sativus to salt stress is associated with antioxidant capacity. J. Plant Growth Regul. 2020, 39, 809–822. [Google Scholar] [CrossRef]
  24. Dheeba, B.; Selvakumar, S.; Kannan, M.; Kannan, K. Effect of gibberellic acid on black gram (Vigna mungo) irrigated with different levels of saline water. Res. J. Pharm. Biol. Chem. Sci. 2015, 6, 709–720, WOS:000413622200121. [Google Scholar]
  25. Miceli, A.; Vetrano, F.; Moncada, A. Effects of foliar application of gibberellic acid on the salt tolerance of tomato and sweet pepper transplants. Horticulturae 2020, 6, 93. [Google Scholar] [CrossRef]
  26. Shahzad, K.; Hussain, S.; Arfan, M.; Hussain, S.; Waraich, E.A.; Zamir, S.; Saddique, M.; Rauf, A.; Kamal, K.Y.; Hano, C.; et al. Exogenously applied gibberellic acid enhances growth and salinity stress tolerance of maize through modulating the morpho-physiological, biochemical and molecular attributes. Biomolecules 2021, 11, 1005. [Google Scholar] [CrossRef] [PubMed]
  27. Moula, I.; Boussadia, O.; Koubouris, G.; Ben Hassine, M.; Boussetta, W.; Van Labeke, M.C.; Braham, M. Ecophysiological and biochemical aspects of olive tree (Olea europaea L.) in response to salt stress and gibberellic acid-induced alleviation. S. Afr. J. Bot. 2020, 132, 38–44. [Google Scholar] [CrossRef]
  28. Szepesi, A. Halotropism: Phytohormonal aspects and potential applications. Front. Plant Sci. 2020, 11, 571025. [Google Scholar] [CrossRef] [PubMed]
  29. Abdel-Latef, A.A.H.; Tahjib-Ul-Arif, M.; Rhaman, M.S. Exogenous auxin-mediated salt stress alleviation in faba bean (Vicia faba L.). Agronomy 2021, 11, 547. [Google Scholar] [CrossRef]
  30. Kaya, C.; Tuna, A.L.; Okant, A.M. Effect of foliar applied kinetin and indole acetic acid on maize plants grown under saline conditions. Turk. J. Agric. Forests. 2010, 34, 529–538. [Google Scholar] [CrossRef]
  31. Shah, S.H. Kinetin improves photosynthetic and antioxidant responses of Nigella sativa to counteract salt stress. Russ. J. Plant Physiol. 2011, 58, 454–459. [Google Scholar] [CrossRef]
  32. Nimir, N.E.A.; Zhou, G.; Guo, W.; Ma, B.; Lu, S.; Wang, Y. Effect of foliar application of GA3, kinetin, and salicylic acid on ions content, membrane permeability, and photosynthesis under salt stress of sweet sorghum [Sorghum bicolor (L.) Moench.]. Can. J. Plant Sci. 2017, 97, 525–535. [Google Scholar] [CrossRef]
  33. Alcázar, R.; Bueno, M.; Tiburcio, A.F. Polyamines: Small amines with large effects on plant abiotic stress tolerance. Cells 2020, 9, 2373. [Google Scholar] [CrossRef] [PubMed]
  34. Zapata, P.J.; Serrano, M.; García-Legaz, M.F.; Pretel, M.T.; Botella, M.A. Short term effect of salt shock on ethylene and polyamines depends on plant salt sensitivity. Front. Plant Sci. 2017, 8, 855. [Google Scholar] [CrossRef] [PubMed] [Green Version]
  35. Therios, I. Olives: Crop Production Science in Horticulture 18; CABI Publishing: Wallingford, UK, 2009. [Google Scholar] [CrossRef]
  36. Aguilera, F.; Valenzuela, L.R. Time trends in the viability of pollen grains in the “Picual” olive (Olea europaea L.) cultivar. Palynology 2013, 37, 28–34. [Google Scholar] [CrossRef]
  37. Coppa, C.; Goncalves, B.; Lee, S.; Nunes, V.; Goncalves, C.; Rodrigues, C.; Oliveira, C. Extraction of oleuropein from olive leaves and applicability in foods. Qual. Assur. Saf. Crop. Foods 2020, 12, 50–62. [Google Scholar] [CrossRef]
  38. IOC. International Olive Council. Available online: http://www.internationaloliveoil.org (accessed on 28 December 2022).
  39. Rufino-Palomares, E.E.; Pérez-Jimenez, A.; García-Salguero, L.; Mokhtari, K.; Reyes-Zurita, F.J.; Peragón-Sanchez, J.; Lupiáñez, J.A. Nutraceutical role of polyphenols and triterpenes present in the extracts of fruits and leaves of Olea europaea as antioxidants, anti-infectives and anticancer agents on healthy growth. Molecules 2022, 27, 2341. [Google Scholar] [CrossRef] [PubMed]
  40. Brito, C.; Dinis, L.T.; Moutinho-Pereira, J.; Correia, C.M. Drought stress effects and olive tree acclimation under a changing climate. Plants 2019, 8, 232. [Google Scholar] [CrossRef] [PubMed] [Green Version]
  41. Trabelsi, L.; Gargouri, K.; Ayadi, M.; Mbadra, C.; Ben Nasr, M.; Ben Mbarek, H.; Ghrab, M.; Ben Ahemd, G.; Kammoun, Y.; Loukil, E.; et al. Impact of drought and salinity on olive potential yield, oil and fruit qualities (cv. Chemlali) in an arid climate. Agric. Water Manag. 2022, 269, 107726. [Google Scholar] [CrossRef]
  42. Methenni, K.; Ben Abdallah, M.; Nouairi, I.; Smaoui, A.; Ben Ammar, W.; Zarrouk, M.; Ben Youssef, N. Salicylic acid and calcium pretreatments alleviate the toxic effect of salinity in the Oueslati olive variety. Sci. Hort. 2018, 233, 349–358. [Google Scholar] [CrossRef]
  43. Perica, S.; Goreta, S.; Selak, G.V. Growth, biomass allocation and leaf ion concentration of seven olive (Olea europaea L.) cultivars under increased salinity. Sci. Hortic. 2008, 117, 123–129. [Google Scholar] [CrossRef]
  44. Soda, N.; Ephrath, J.E.; Dag, A.; Beiersdorf, I.; Presnov, E.; Yermiyahu, U.; Ben-Gal, A. Root growth dynamics of olive (Olea europaea L.) affected by irrigation induced salinity. Plant Soil 2017, 411, 305–318. [Google Scholar] [CrossRef]
  45. Hoagland, D.R.; Arnon, D.L. The water culture methods for growing plants without soil. Calif. Agric. Exp. Stn. Bull. 1950, 374, 1–39. Available online: hdl.handle.net/2027/uc2.ark:/13960/t51g1sb8j (accessed on 20 February 2023).
  46. Aliniaeifard, S.; Hajilou, J.; Tabatabaei, S.J. Photosynthetic and growth responses of olive to proline and salicylic acid under salinity condition. Not. Bot. Horti. Agrobo. 2016, 44, 579–585. [Google Scholar] [CrossRef] [Green Version]
  47. Bueno, M.; Cordovilla, M.P. Spermidine pretreatments mitigate the effects of saline stress by improving growth and saline excretion in Frankenia pulverulenta. Agronomy 2021, 11, 1515. [Google Scholar] [CrossRef]
  48. Bueno, M.; Cordovilla, M.P. Plant growth regulators application enhance tolerance to salinity and benefit the halophyte Plantago coronopus in saline agriculture. Plants 2021, 10, 1872. [Google Scholar] [CrossRef]
  49. Tounekti, T.; Hernández, I.; Müller, M.; Khemira, H.; Munné-Bosch, S. Kinetin applications alleviate salt stress and improve the antioxidant composition of leaf extracts in Salvia officinalis. Plant Physiol. Biochem. 2011, 49, 1165–1176. [Google Scholar] [CrossRef]
  50. Bacelar, E.A.; Santos, D.L.; Moutinho-Pereira, J.M.; GonÇalves, B.C.; Ferreira, H.F.; Correia, C.M. Inmediate responses and adaptative strategies of three olive cultivars under contrasting water availability regimes: Changes on structure and chemical composition of foliage and oxidative damage. Plant Sci. 2006, 170, 596–605. [Google Scholar] [CrossRef]
  51. Tattini, M.; Traversi, M.L. On the mechanism of salt tolerance in olive (Olea europea L.) under low- or high-Ca2+ supply. Environ. Exp. Bot. 2009, 65, 72–81. [Google Scholar] [CrossRef]
  52. Arnon, D.T. Copper enzyme in isolated chloroplasts polyphenoloxidase in Beta vulgaris. Plant Physiol. 1949, 24, 1–15. [Google Scholar] [CrossRef] [Green Version]
  53. Wellburn, A.R. The spectral determination of chlorophylls a and b, as well as total carotenoids, using various solvents with spectrophotometers of different resolution. J. Plant Physiol. 1994, 144, 307–313. [Google Scholar] [CrossRef]
  54. Bates, L.S. Rapid determination of free proline water stress studies. Plant Soil 1973, 39, 205–207. [Google Scholar] [CrossRef]
  55. Bartolozzi, F.; Bertazza, G.; Bassi, D.; Cristoferi, G. Simultaneous determination of soluble sugars and organic acids as their trimethylsilyl derivatives in apricot fruits by gas-liquid chromatography. J. Chromatogr. 1997, 758, 99–107. [Google Scholar] [CrossRef]
  56. Irigoyen, J.J.; Emerich, D.W.; Sánchez-Díaz, M. Water stress induced changes in concentrations of proline and total soluble sugars in nodulated alfalfa (Medicago sativa) plants. Physiol. Plant. 1992, 84, 55–60. [Google Scholar] [CrossRef]
  57. Chow, P.S.; Landhäusser, S.M. A method for routine measurements of total sugar and starch content in woody plant tissues. Tree Physiol. 2004, 24, 1129–1136. [Google Scholar] [CrossRef]
  58. Bueno, M.; Lendínez, M.L.; Calero, J.; Cordovilla, M.P. Salinity responses of three halophytes from inland saltmarshes of Jaén (southern Spain). Flora 2020, 266, 151589. [Google Scholar] [CrossRef]
  59. Bueno, M.; Lendínez, M.L.; Aparicio, C.; Cordovilla, M.P. Effect of salinity on polyamines and ethylene in Atriplex prostrata and Plantago coronopus. Biol. Plant. 2015, 59, 596–600. [Google Scholar] [CrossRef]
  60. Smith, M.A.; Davies, P.J. Separation and quantitation of polyamines in plant tissue by high performance liquid chromatography of their dansyl derivates. Plant Physiol. 1985, 78, 89–91. [Google Scholar] [CrossRef] [PubMed] [Green Version]
  61. Bader, B.; Aissaoui, F.; Kmicha, I.; Ben Salem, A.; Chehab, H.; Gargouri, K.; Boujnah, D.; Chaieb, M. Effects of salinity stress water desalination, olive tree (Olea europaea L. cvs ‘Picholine’, ‘Meski’ and ‘Ascolana’) growth and ion accumulation. Desalination 2015, 364, 46–52. [Google Scholar] [CrossRef]
  62. Zörb, L.C.; Geilfus, C.M.; Dietz, K.J. Salinity and crop yield. Plant Biol. 2019, 21, 31–38. [Google Scholar] [CrossRef]
  63. Jie, S.; Baoshan, W. Using euhalophytes to understand salt tolerance and to develop saline agricultura: Suaeda salsa as a promising model. Rev. Ann. Bot. 2015, 115, 541–553. [Google Scholar] [CrossRef] [Green Version]
  64. Amir, R.; Munir, F.; Khan, M.; Iqbal, T. Use of plant hormones for the improvement of plant growth and production under salt stress. In Sal Stress, Microbes, and Plant Interactions: Causes and Solution; Akhtar, M.S., Ed.; Springer Nature: Singapore, 2019; pp. 59–90. ISBN 978-981-13-8800-2. [Google Scholar] [CrossRef]
  65. Chunxin, Y.; Fan, Z.; Ruonan, W.; Zhaojin, R.; Weiming, T.; Linjiang, J.; Shunyan, C.; Zouli, X.; Yitao, X.; Yuyi, Z.; et al. B2, an abscisic acid mimic, improves salinity tolerance in winter wheat seedlings via improving activity of antioxidant enzymes. Front. Plant Sci. 2022, 13, 916287. [Google Scholar] [CrossRef]
  66. Islam, M.S.; Hasan, M.K.; Islam, B.; Renu, N.A.; Hakim, M.A.; Islam, M.R.; Chowdhyry, M.K.; Ueda, A.; Saneoka, M.A.; Raza, M.A.; et al. Responses of wáter and pigments status, dry matter partitioning, seed production, and traits of yield and quality to foliar application of GA3 in mugnbean (Vigna radiata L.). Front. Agron. 2021, 2, 596850. [Google Scholar] [CrossRef]
  67. Quamruzzaman, M.; Manik, S.M.N.; Shabala, S.; Zhou, M. Improving performance of salt-grown crops by exogenous application of plant growth regulators. Biomolecules 2021, 11, 788. [Google Scholar] [CrossRef]
  68. Zahid, G.; Iftikhar, S.; Shimira, F.; Ahmad, H.M.; Kaçar, Y.A. An overview and recent progress of plant growth regulators (PGRs) in the mitigation of abiotic stresses in frutis: A review. Sci. Hortic. 2023, 309, 111621. [Google Scholar] [CrossRef]
  69. Aparicio, C.; Urrestarazu, M.; Cordovilla, M.P. Comparative physiological analysis of salinity effects in six olive genotypes. HortScience 2014, 49, 901–904. [Google Scholar] [CrossRef] [Green Version]
  70. Ayaz, M.; Varol, N.; Yolcu, S.; Pelvan, A.; Kaya, Ü.; Aydoğdu, E.; Bor, M.; Özdemir, F.; Türkan, I. Three (Turkish) olive cultivars display contrasting salt stress-coping mechanisms under high salinity. Trees 2021, 35, 1283–1298. [Google Scholar] [CrossRef]
  71. Regni, L.; Del Pino, A.M.; Mousavi, S.; Palmerini, C.A.; Baldoni, L.; Mariotti, R.; Mairech, H.; Gardi, T.; D’Amato, R.; Proietti, P. Behavior of four olive cultivars during salt stress. Front. Plant. Sci. 2019, 10, 1–9. [Google Scholar] [CrossRef]
  72. Zahedi, S.M.; Hosseini, M.S.; Hoveizeh, N.F.; Gholami, R.; Abdelrahman, M.; Phan Tran, L.S. Exogenous melatonin mitigates salinity-induced damage in olive seedling by modulating ion homeostasis, antioxidant defense, and phytohormone balance. Physiol. Plant. 2021, 173, 1682–1694. [Google Scholar] [CrossRef]
  73. Munns, R.; Tester, M. Mechanisms of salinity tolerance. Ann. Rev. Plant Biol. 2008, 25, 651–681. [Google Scholar] [CrossRef] [Green Version]
  74. Kchaou, H.; Larbi, A.; Chaieb, M.; Sagardoy, R.; Msallem, M.; Morales, F. Genotypic differentiation in the stomatal response to salinity and contrasting photosynthetic and photoprotection responses in five olive (Olea europaea L.) cultivars. Sci. Hort. 2013, 160, 129–138. [Google Scholar] [CrossRef]
  75. Awais, G.W.; Amina, M.; Khurram, Z.; Basharat, A.; Muzammil, J.M.; Waseem, K.R.; Imran, K.; Muhammad, A.; Anam, N. Exogenously applied GA3 promotes plant growth in onion by reducing oxidative stress under saline conditions. J. Agric. Sci. 2021, 27, 122–128. [Google Scholar]
  76. Liu, Y.G.; Ye, N.H.; Liu, R.; Chen, M.; Zhang, J. H2O2 mediates the regulation of ABA catabolism and GA biosynthesis in Arabidopsis seed dormancy and germination. J. Exp. Bot. 2010, 61, 2979–2990. [Google Scholar] [CrossRef] [PubMed] [Green Version]
  77. Yang, Y.; Yanli, L.; Zhenwei, Y.; Xiangbo, D. The role of cytokinins in plant under salt stress. J. Plant Growth Regul. 2022, 41, 2279–2291. [Google Scholar] [CrossRef]
  78. Husen, A.; Iqbal, M.; Aref, I.M. IAA-induced alteration in growth and photosynthesis of pea (Pisum sativum L.) plants grown under salt stress. J. Environ. Biol. 2016, 37, 421–429, WOS:000377747700014. [Google Scholar]
  79. Ribba, T.; Garrido-Vargas, F.; O’Brien, J.A. Auxin-mediated responses under salt stress: From development regulation to biotecnological applications. J. Exp. Bot. 2020, 13, 3843–3853. [Google Scholar] [CrossRef]
  80. Skodra, C.; Michailidis, M.; Dasenaki, M.; Ganopoulos, I.; Thomaidis, N.S.; Tanou, G.; Molassiotis, A. Uraveling salt-responsive tissue-specific metabolic pathways in olive tree. Physiol. Plant. 2021, 173, 1643–1656. [Google Scholar] [CrossRef]
  81. Demiral, M.A.; Uygun, D.A.; Uygun, M.; Kasirğa, E.; Karagözler, A.A. Biochemical response of Olea europea cv. Gemlik to short-term salt stress. Turk. J. Biol. 2011, 35, 433–442. [Google Scholar] [CrossRef]
  82. Vita, F.; Sabbatini, L.; Sillo, F.; Ghignone, S.; Vergine, M.; Nissim, W.G.; Fortunato, S.; Salzano, A.M.; Scaloni, A.; Luvisi, A.; et al. Salt stress in olive tree shapes resident endophytic microbiota. Front. Plant. Sci. 2022, 13, 992395. [Google Scholar] [CrossRef]
  83. Roy, S.J.; Negrão, S.; Tester, M. Salt resistant crop plants. Curr. Opin. Biotechnol. 2014, 26, 115–124. [Google Scholar] [CrossRef]
  84. Chartzoulakis, K. Salinity and olive: Growth, salt tolerance, photosynthesis and yield. Agric. Water Manag. 2005, 78, 108–121. [Google Scholar] [CrossRef]
  85. Ashraf, M.; Aasiya, K. Relationship between ion accumulation and growth in two spring wheat lines differing in salt-tolerance at different growth statges. J. Agron. Crop Sci. 1997, 178, 39–51. [Google Scholar] [CrossRef]
  86. Dehnavi, A.R.; Zahedi, M.; Ludwiczak, A.; Piernik, A. Foliar application of salicylic acid improves salt tolerance of sorghum (Sorghum bicolor (L.) Moench). Plants 2022, 11, 368. [Google Scholar] [CrossRef]
  87. Yang, F.; Xiao, X.; Zhang, S.; Korpelainen, H.; Li, C. Salt stress responses in Populus cathayana Rehder. Plant Sci. 2009, 176, 669–677. [Google Scholar] [CrossRef]
  88. Hasegawa, P.M.; Bressan, R.A.; Zhu, J.K.; Bohnert, H.J. Plant cellular and molecular responses to highsalinity. Annu. Rev. Plant. Biol. 2000, 51, 463–499. [Google Scholar] [CrossRef] [PubMed] [Green Version]
  89. Anjum, N.A.; Aref, I.M.; Duarte, A.C.; Pereira, E.; Ahmad, I.; Iqbal, M. Glutathione and proline cam coordinately make plants withstand the joint attack of metal (loid) and salinity stresses. Front. Plant Sci. 2014, 5, 662. [Google Scholar] [CrossRef] [PubMed] [Green Version]
  90. Hao, S.; Wang, Y.; Yan, Y.; Liu, Y.; Wang, J.; Chen, S. A review on plant responses to salt stress and their mechanisms of salt resistance. Horticulturae 2021, 7, 132. [Google Scholar] [CrossRef]
  91. Li, Z.G.; Duan, X.Q.; Min, X.; Zhou, Z.H. Methylglyoxal as a novel signal molecule, induces the salt tolerance of wheat by regulating the glyoxalase system, the antioxidant system, and osmolytes. Protoplasma 2017, 254, 1995–2006. [Google Scholar] [CrossRef] [PubMed]
  92. Mohamed, R.; Abdelbaset, A.K.; Abd-Elkader, D. Salicylic acid effects on growth, yield, and fruit quality of strawberry cultivars. J. Med. Act. Plants 2018, 6, 1–11. Available online: https://scholarworks.umass.edu/jmap/vol6/iss2/2 (accessed on 20 February 2023).
  93. Roshdy, A.E.-D.; Alebidi, A.; Almutairi, K.; Al-Obeed, R.; Elsabagh, A. The effect of saliylic acid on the performances of salt stressed strawberry plants, enzymes activity, and salt tolerance index. Agronomy 2021, 11, 775. [Google Scholar] [CrossRef]
  94. Jabeen, N.; Ahmad, R. Foliar spray with potassium nitrate and salicylic acid for improving growth, yield and nutrients uptake by olive trees under salinity stress conditions. Not. Bot. Horti. Agrobo. 2011, 39, 172–178. [Google Scholar] [CrossRef] [Green Version]
  95. Bashir, C.; Silvestri, C.; Coppa, E.; Brunori, E.; Cristofori, V.; Rugini, E.; Ahmad, T.; Hafiz, I.A.; Abbasi, N.A.; Nawaz Shah, M.K.; et al. Response of olive shoots to salinity stress suggests the involvement of sulfur metabolism. Plants 2021, 10, 350. [Google Scholar] [CrossRef]
  96. Khalid, A.; Aftab, F. Effect of exogenous application of IAA and GA3 on growth, protein content, and antioxidant enzymes of Solanum tubersoum L. grown in vitro under salt stress. Vitr. Cell. Dev. Biol. Plant 2020, 56, 377–389. [Google Scholar] [CrossRef]
  97. Kaur, G.; Asthir, B. Proline: A key player in plant abiotic stress tolerance. Biol. Plant. 2015, 59, 609–619. [Google Scholar] [CrossRef]
  98. Slama, I.; Abdelly, C.; Bouchereau, A.; Flowers, T.; Savoure, A. Diversity, distribution and roles of osmoprotective compounds accumulated in halophytes under abiotic stress. Ann. Bot. 2015, 115, 433–447. [Google Scholar] [CrossRef] [PubMed] [Green Version]
  99. Sing, P.; Choudhary, K.K.; Chaudhary, N.; Gupta, S.; Sahu, M.; Tejaswini, B.; Sarkar, S. Salt stress resilience in plants mediated through osmolyte accumulation and its crosstalk mechanism with phytohormones. Front. Plant Sci. 2022, 13, 1006617. [Google Scholar] [CrossRef]
  100. Shomer, I.; Frenkel, H.; Polinger, C. The existence of a diffuse electric doublé layer at cellulose fbrill surfaces and its role in the swelling mechanism of parenchyma plant cell walls. Carbohydr. Polym. 1991, 16, 199–210. [Google Scholar] [CrossRef]
  101. Rady, M.M.; Taha, R.S.; Semida, W.M.; Alharby, H.F. Modulation of salt stress effects on Vicia faba L. plantas grown on reclaimed-saline soil by salicylic acid application. Rom. Agric. Res. 2017, 34, 175–185, DII 2067-5720 RAR 2017-3. [Google Scholar]
  102. Ashraf, U.; Hussain, S.; Anjum, S.A.; Abbas, F.; Tanveer, M.; Noor, M.A.; Tang, X. Alterations in growth, oxidative damage, and metal uptake of five aromatic rice cultivars under lead toxicity. Plant Physiol. Biochem. 2017, 115, 461–471. [Google Scholar] [CrossRef]
  103. Mansour, M.M.F.; Ali, E.F. Evaluation of proline functions in saline conditions. Phytochemistry 2017, 140, 52–68. [Google Scholar] [CrossRef]
  104. Per, T.S.; Fatma, M.; Asgher, M.; Asgher, M.; Javied, S.; Khan, N.A. Salicylic acid and nutrients interplay in abiotic stress tolerance. In Salicylic Acid: A Multifaceted Hormone; Springer: Singapore, 2017; pp. 221–237. [Google Scholar] [CrossRef]
  105. Ben Ahmed, C.; Magdich, S.; Ben Rouina, B.; Sensoy, S.; Boukhris, M.; Ben Abdullah, F. Exogenous proline effects on water relations and asyaskions contents in leaves and roots of young olive. Amino Acids 2011, 40, 565–573. [Google Scholar] [CrossRef]
  106. Nguyen, H.T.T.; Das Bhowmik, S.; Long, H.; Cheng, Y.; Mundree, S.; Hoang, L.T.M. Rapid accumulation of proline enhances salinity tolerance in australian wild rice Oryza australiensis Domin. Plants 2021, 10, 2044. [Google Scholar] [CrossRef]
  107. Poury, n.; Seifi, E.; Alizadeh, M. Effects of salinity and proline on growth and physiological characteristics of tree olive cultivars. Gesunde Pflanz. 2022, 74, 1–12. [Google Scholar] [CrossRef]
  108. Lin, C.C.; Hsu, Y.T.; Kao, C.H. The effect of NaCl on proline accumulation in rice leaves. Plant Growth Regul. 2002, 36, 275–285, WOS:000177049600013. [Google Scholar] [CrossRef]
  109. Grzesiak, M.; Fileck, M.; Barbasz, A.; Kreczmer, B.; Hartikainen, H. Relationships between polyamines, ethylene, osmoprotectans and antioxidant enzymes activities in wheat seedlings after short-term PEG- and NaCl-induced stresses. Plant Growth Regul. 2013, 69, 177–189. [Google Scholar] [CrossRef] [Green Version]
  110. Conde, C.; Delrot, S.; Gero’s, H. Physiological, biochemical and molecular changes occurring during olive development and ripening. J. Plant Physiol. 2008, 165, 1545–1562. [Google Scholar] [CrossRef]
  111. Kumari, A.; Parida, A.K. Metabolomics and network analysis reveal the potential metabolites and biological pathways involved in salinity tolerance of hte halophyte Salvadora persica. Environ. Exp. Bot. 2018, 148, 85–99. [Google Scholar] [CrossRef]
  112. Bano, C.; Amis, N.; Singh, N.B. Role of polyamines in plants abiotic stress tolerance: Advances and future prospects. In Plant Life Under Changing Environment; Tripathi, D.K., Sing, V.P., Chauhan, D.K., Prasad, S.M., Dubey, N.K., Ramawat, N., Eds.; Academic Press: Cambridge, MA, USA, 2020; pp. 481–496. [Google Scholar]
  113. Bueno, M.; Cordovilla, M.P. Polyamines in halophytes. Front. Plant Sci. 2019, 10, 439. [Google Scholar] [CrossRef] [Green Version]
  114. Zhang, M.; Smith, J.A.C.; Harberd, N.P.; Jiang, C. The regulatory roles of ethylene and reactive oxygen species (ROS) in plant salt stress responses. Plant Mol. Biol. 2016, 91, 651–659. [Google Scholar] [CrossRef]
  115. Liu, J.H.; Wang, W.; Wu, H.; Gong, X.; Moriguchi, T. Polyamines function in stress tolerance: From synthesis to regulation. Front. Plant Sci. 2015, 6, 827. [Google Scholar] [CrossRef] [Green Version]
  116. Majumdar, R.; Barchi, B.; Turlapati, S.A.; Gagne, M.; Minocha, R.; Long, S.; Minocha, S.C. Glutamate, ornithine, arginine, proline, and polyamine metabolic interactions: The pathway is regulated at the post-transcriptional level. Front. Plant Sci. 2016, 7, 78. [Google Scholar] [CrossRef] [Green Version]
  117. Li, Y.; He, J. Advance in metabolism and response to stress of polyamines in plant. Acta Agric. Boreali Sinica 2012, 27, 240–245. [Google Scholar] [CrossRef]
  118. Parvin, S.; Lee, O.R.; Sathiyaraj, G.; Khorolragchaa, A.; Kim, Y.J.; Yang, D.C. Spermidine alleviates the growth of saline-stressed ginseng seedlings through antioxidative defense system. Gene 2014, 537, 70–78. [Google Scholar] [CrossRef] [PubMed]
  119. Jain, V.; Vart, S.; Verma, E.; Malhotra, S.P. Spermine reduces salinity-induced oxidative damage by enhancing antioxidative system and decreasing lipid peroxidation in rice seedlings. J. Plant Biochem. Bioecnol. 2015, 24, 316–323. [Google Scholar] [CrossRef]
Figure 1. Schematization of the experiment. Non-pretreated plants with no NaCl (No-PGR; control); non-pretreated plants with 100 mM NaCl (No-PGR+100); non-pretreated plants with 200 mM NaCl (No-PGR+200); pretreated with gibberelic acid and no NaCl (GA3+0); pretreated with gibberelic acid and with 100 mM NaCl (GA3+100); pretreated with gibberelic acid and with 200 mM NaCl (GA3+200); pretreated with indol-3-acetic acid and no NaCl (IAA+0); pretreated with indol-3-acetic acid and with 100 mM NaCl (IAA+100); pretreated with indol-3-acetic acid and with 200 mM NaCl (IAA+200); pretreated with salicylic acid and no NaCl (SA+0); pretreated with salicylic acid and with 100 mM NaCl (SA+100); pretreated with salicylic acid and with 200 mM NaCl (SA+200); pretreated with Kinetin and no NaCl (Kinetin+0); pretreated with Kinetin and with 100 mM NaCl (Kinetin+100); pretreated with Kinetin and with 200 mM NaCl (Kinetin+200).
Agronomy 13 00647 g001
Figure 2. Effect of salt stress on plant dry weight of Olea europaea plants pretreated with plant growth regulators (PGRs). Data are expressed as mean ± SE (n = 6). Means followed by the same letter are not significantly different according to the LSD test (p < 0.05).
Agronomy 13 00647 g002
Figure 3. Effect of salt stress on net translocation rates of Na+ (A) and K+ (B) from root to leaves of Olea europaea plants pretreated with plant growth regulators (PGRs). Data are expressed as mean ± SE (n = 4). Means followed by the same letter are not significantly different according to the LSD test (p < 0.05).
Agronomy 13 00647 g003
Figure 4. Effect of salt stress on chlorophyll total (A), ratio Chlorophyll a/Chlorophyll b (B), and carotenoids (C) in leaf tissue of Olea europaea plants pretreated with plant growth regulators (PGRs). Data are expressed as mean ± SE (n = 4). Means followed by the same letter are not significantly different according to the LSD test (p < 0.05).
Agronomy 13 00647 g004aAgronomy 13 00647 g004b
Figure 5. Effect of salt stress on ratio Manitol/Glucose in leaf of Olea europaea plants pretreated with plant growth regulators (PGRs). Data are expressed as mean ± SE (n = 4). Means followed by the same letter are not significantly different according to the LSD test (p < 0.05).
Agronomy 13 00647 g005
Figure 6. Effect of salt stress on Spd (A) and Spm (B) contents in leaf of Olea europaea plants pretreated with plant growth regulators (PGRs). Data are expressed as mean ± SE (n = 4). Means followed by the same letter are not significantly different according to the LSD test (p < 0.05).
Agronomy 13 00647 g006
Figure 7. Effect of salt stress on ethylene production by leaf of Olea europaea plants pretreated with plant growth regulators (PGRs). Data are expressed as mean ± SE (n = 6). Means followed by the same letter are not significantly different according to the LSD test (p < 0.05).
Agronomy 13 00647 g007
Table 1. Effect of salt stress on root dry weight, stem dry weight, leaf dry weight, and leaf relative water content (LRWC) of Olea europaea plants pretreated with plant growth regulators (PGRs). Data are expressed as mean ± SE (n = 6).
PGRs without NaClRoot Dry Weight
(g plant−1)
Stem Dry Weight
(g plant−1)
Leaf Dry Weight
(g plant−1)
LRWC
(%)
Control: 0 mM NaCl (no-PGR)0.56 ± 0.023 a0.78 ± 0.026 a1.16 ± 0.030 ab93.37 ± 0.351 a
GA3 + 0 mM0.43 ± 0.013 cd0.66 ± 0.025 b1.08 ± 0.048 bc83.21 ± 0.525 e
IAA + 0 mM0.36 ± 0.012 e0.55 ± 0.019 cd1.05 ± 0.042 c93.26 ± 0.350 a
SA + 0 mM0.57 ± 0.021 a0.68 ± 0.031 b1.17 ± 0.033 a85.46 ± 0.453 cd
Kinetin + 0 mM0.50 ± 0.014 b0.51 ± 0.008 c1.00 ± 0.024 cd88.76 ± 0.701 b
PGRs with 100 mM NaClRoot dry weight
(g plant−1)
Stem dry weight
(g plant−1)
Leaf dry weight
(g plant−1)
LRWC
(%)
100 mM (no-PGR)0.32 ± 0.007 ef0.43 ± 0.015 d0.75 ± 0.030 f82.30 ± 0.276 ef
GA3 + 100 mM0.40 ± 0.014 d0.52 ± 0.022 c1.07 ± 0.041 c82.13 ± 0.471 ef
IAA + 100 mM0.34 ± 0.013 ef0.67 ± 0.030 b0.93 ± 0.033 de86.30 ± 0.653 c
SA + 100 mM0.43 ± 0.015 cd0.43 ± 0.015 d0.96 ± 0.037 de82.49 ± 0.611 ef
Kinetin + 100 mM0.46 ± 0.011 c0.52 ± 0.022 c0.95 ± 0.029 de84.60 ± 0.456 d
PGRs with 200 mM NaClRoot dry weight
(g plant−1)
Stem dry weight
(g plant−1)
Leaf dry weight
(g plant−1)
LRWC
(%)
200 mM (no-PGR)0.26 ± 0.008 g0.37 ± 0.015 e0.66 ± 0.016 g77.84 ± 0.471 h
GA3 + 200 mM0.26 ± 0.010 g0.51 ± 0.021 c0.89 ± 0.019 e78.75 ± 0.565 h
IAA + 200 mM0.26 ± 0.010 g0.65 ± 0.023 b0.90 ± 0.036 e81.41 ± 0.210 fg
SA + 200 mM0.36 ± 0.011 e0.49 ± 0.021 c0.94 ± 0.040 de77.80 ± 0.524 h
Kinetin + 200 mM0.34 ± 0.012 e0.52 ± 0.010 c0.94 ± 0.020 de 79.25 ± 0.436 g
Means followed by the same letter within the same column are not significantly different according to the LSD test (p < 0.05).
Table 2. Effect of salt stress on Na+ and K+ concentrations, and K+/Na+ ratio in leaf of Olea europaea plants pretreated with plant growth regulators (PGRs). Data are expressed as mean ± SE (n=4).
PGRs without NaClLeaf
Na+
(mmol kg−1 DW)
K+
(mmol kg−1 DW)
K+/Na+ Ratio
Control: 0 mM NaCl (no-PGR) 66.96 ± 0.50 gh 357.38 ± 1.56 a 4.900 ± 0.023 c
GA3 + 0 mM53.37 ± 3.86 gh299.03 ± 4.31 c 5.603 ± 0.081 b
IAA + 0 mM76.31± 2.34 gh305.12 ± 1.08 c 3.999 ± 0.014 d
SA + 0 mM98.01± 0.17 g331.81 ± 0.71 b 3.386 ± 0.007 e
Kinetin + 0 mM47.25± 2.84 h289.14 ± 2.86 d 6.120 ± 0.061 a
PGRs with 100 mM NaClNa+
(mmol kg−1 DW)
K+
(mmol kg−1 DW)
K+/Na+ ratio
100 mM NaCl (no-PGR)610.13 ± 28.70 b 247.15 ± 1.51 fg 0.405 ± 0.002 ij
GA3 + 100 mM490.22 ± 1.11 d224.25 ± 4.19 h 0.457 ± 0.009 i
IAA + 100 mM347.57 ± 17.26 f265.86 ± 5.42 e 0.765 ± 0.015 f
SA + 100 mM334.68 ± 16.64 f264.06 ± 3.04 e 0.789 ± 0.009 f
Kinetin + 100 mM457.37 ± 23.00 de246.81 ± 2.17 g 0.540 ± 0.005 h
PGRs with 200 mM NaClNa+
(mmol kg−1 DW)
K+
(mmol kg−1 DW)
K+/Na+ ratio
200 mM NaCl (no-PGR)693.93± 12.25 a252.23 ± 3.42 fg 0.364 ± 0.005 j
GA3 + 200 mM552.14± 31.25 c251.55 ± 4.84 fg 0.456 ± 0.009 i
IAA + 200 mM472.06 ± 2.18 d302.96 ± 2.83 c 0.642 ± 0.006 g
SA + 200 mM414.96 ± 23.37 e267.24 ± 2.47 e 0.644 ± 0.006 g
Kinetin + 200 mM593.00 ± 32.77 bc256.08 ± 2.34 f 0.432 ± 0.004 ij
Means followed by the same letter within the same column are not significantly different according to the LSD test (p < 0.05).
Table 3. Effect of salt stress on Na+ and K+ concentrations, and K+/Na+ ratio in root of Olea europaea plants pretreated with plant growth regulators (PGRs). Data are expressed as mean ± SE (n=4).
PGRs without NaClRoot
Na+
(mmol kg−1 DW)
K+
(mmol kg−1 DW)
K+/Na+ Ratio
Control: 0 mM NaCl (no-PGR) 122.62 ± 0.71 k856.44 ± 2.96 a6.984 ± 0.024 b
GA3 + 0 mM159.88 ± 0.69 j603.58 ± 1.90 e3.775 ± 0.012 e
IAA + 0 mM120.54 ± 0.91 k835.34 ± 0.73 b6.930 ± 0.006 c
SA + 0 mM159.13 ± 0.48 j686.18 ± 0.59 d4.312 ± 0.004 d
Kinetin + 0 mM 97.28 ± 0.17 l750.89 ± 1.15 c7.719 ± 0.012 a
PGRs with 100 mM NaClNa+
(mmol kg−1 DW)
K+
(mmol kg−1 DW)
K+/Na+ ratio
100 mM NaCl (no-PGR)1790.29 ± 8.15 b367.19 ± 1.21 g 0.205 ± 0.002 g
GA3 + 100 mM1187.19 ± 2.55 h309.95 ± 1.24 i0.261 ± 0.001 f
IAA + 100 mM1594.39 ± 1.21 e397.57 ± 2.90 f0.249 ± 0.001 f
SA + 100 mM1232.79 ± 6.06 g210.26 ± 1.63 l0.177 ± 0.001 h
Kinetin + 100 mM1144.83 ± 0.37 i170.35 ± 2.27 m0.149 ± 0.002 i
PGRs with 200 mM NaClNa+
(mmol kg−1 DW)
K+
(mmol kg−1 DW)
K+/Na+ ratio
200 mM NaCl (no-PGR)1899.94 ± 1.51 a267.02 ± 3.64 j0.141 ± 0.002 i
GA3 + 200 mM1392.42 ± 2.43 f124.27 ± 1.17 n0.089 ± 0.001 j
IAA + 200 mM1778.69 ± 3.61 c323.92 ± 4.27 h0.182 ± 0.002 h
SA + 200 mM1658.42 ± 2.57 d243.37 ± 2.99 k0.147 ± 0.002 i
Kinetin + 200 mM1592.74 ± 3.21 e162.79 ± 2.37 m0.102 ± 0.001 j
Means followed by the same letter within the same column are not significantly different according to the LSD test (p < 0.05).
Table 4. Effect of salt stress on proline, sucrose, and starch concentrations in leaf Olea europaea plants pretreated with plant growth regulators (PGRs). Data are expressed as mean ± SE (n = 4).
PGRs without NaClProline
(µg g−1 DW)
Sucrose
(mg g−1 DW)
Starch
(mg g−1 DW)
Control: 0 mM NaCl (no PGR) 167.60 ± 4.64 c 13.40 ± 0.09 ab16.11 ± 0.63 cd
GA3 + 0 mM183.63 ± 4.24 ab12.41 ± 0.12 d16.47 ± 0.14 cd
IAA + 0 mM137.29 ± 3.05 d13.47 ± 0.26 ab 2.42 ± 0.51 f
SA + 0 mM159.26 ± 2.57 c11.72 ± 0.19 e21.68 ± 1.92 b
Kinetin + 0 mM163.32 ± 1.76 c13.77 ± 0.14 a 15.71 ± 0.59 d
PGRs with 100 mM NaClProline
(µg g−1 DW)
Sucrose
(mg g−1 DW)
Starch
(mg g−1 DW)
100 mM NaCl (no PGR)188.19 ± 2.51 ab 13.66 ± 0.24 ab16.28 ± 0.78 cd
GA3 + 100 mM133.90 ± 0.55 d 13.46 ± 0.07 ab22.31 ± 0.78 b
IAA + 100 mM203.10 ± 3.17 a 11.17 ± 0.20 e 2.89 ± 0.35 f
SA + 100 mM199.94 ± 4.20 a 11.60 ± 0.25 e15.63 ± 0.62 d
Kinetin + 100 mM199.98 ± 4.11 a 12.81 ± 0.27 cd30.44 ± 0.57 a
PGRs with 200 mM NaClProline
(µg g−1 DW)
Sucrose
(mg g−1 DW)
Starch
(mg g−1 DW)
200 mM NaCl (no PGR)171.02 ± 1.62 c6.90 ± 0.16 h 5.79 ± 0.11 e
GA3 + 200 mM158.25 ± 2.84 d9.18 ± 0.22 f 1.05 ± 0.05 f
IAA + 200 mM197.19 ± 1.89 a8.36 ± 0.14 g 6.31 ± 0.26 e
SA + 200 mM190.51 ± 3.62 ab8.13 ± 0.16 g17.97 ± 0.19 c
Kinetin + 200 mM167.85 ± 3.24 c6.79 ± 0.32 h 2.72 ± 0.63 f
Means followed by the same letter within the same column are not significantly different according to the LSD test (p < 0.05).
Table 5. Effect of salt stress on fructose, glucose, inositol, and mannitol concentrations in leaf Olea europaea plants pretreated with plant growth regulators (PGRs). Data are expressed as mean ± SE (n = 4).
PGRs without NaClFructose
(mg g−1 DW)
Glucose
(mg g−1 DW)
Inositol
(mg g−1 DW)
Mannitol
(mg g−1 DW)
Control: 0 mM NaCl (no PGR) 14.99 ± 0.19 e 23.10 ± 0.35 e1.59 ± 0.046 a22.52 ± 1.41 d
GA3 + 0 mM21.36 ± 0.12 b14.96 ± 0.91 g0.86 ± 0.054 d17.32 ± 1.23 e
IAA + 0 mM22.46 ± 0.44 b30.77 ± 0.73 d1.66 ± 0.052 a17.79 ± 0.34 e
SA + 0 mM19.36 ± 0.37 c15.60 ± 0.90 g0.76 ± 0.034 e14.61 ± 0.87 f
Kinetin + 0 mM17.49 ± 0.22 d37.12 ± 1.21 c1.25 ± 0.036 b17.54 ± 0.76 e
PGRs with 100 mM NaClFructose
(mg g−1 DW)
Glucose
(mg g−1 DW)
Inositol
(mg g−1 DW)
Mannitol
(mg g−1 DW)
100 mM NaCl (no PGR)14.60 ± 0.10 e 45.24 ± 2.80 b0.90 ± 0.013 d29.79 ± 0.57 c
GA3 + 100 mM14.90 ± 0.13 e19.34 ± 0.82 f0.87 ± 0.031 d29.64 ± 1.62 c
IAA + 100 mM21.10 ± 0.06 b14.99 ± 1.48 g1.01 ± 0.060 c33.07 ± 1.11 b
SA + 100 mM17.49 ± 0.38 d15.58 ± 0.60 g0.77 ± 0.041 e30.30 ± 1.21 c
Kinetin + 100 mM21.49 ± 0.06 b17.32 ± 0.87 fg0.62 ± 0.025 g33.94 ± 0.83 b
PGRs with 200 mM NaClFructose
(mg g−1 DW)
Glucose
(mg g−1 DW)
Inositol
(mg g−1 DW)
Mannitol
(mg g−1 DW)
200 mM NaCl (no PGR)13.95 ± 0.18 ef31.85 ± 0.27 d0.50 ± 0.020 h23.92 ± 0.27 d
GA3 + 200 mM13.04 ± 0.12 f23.92 ± 0.90 e0.69 ± 0.015 f33.71 ± 1.66 b
IAA + 200 mM23.97 ± 0.42 a50.13 ± 0.77 a0.40 ± 0.021 h35.74 ± 1.21 a
SA + 200 mM16.84 ± 0.15 d36.57 ± 1.55 c0.64 ± 0.040 g30.53 ± 0.37 c
Kinetin + 200 mM16.45 ± 0.35 d46.77 ± 2.10 b0.48 ± 0.019 h37.95 ± 1.12 a
Means followed by the same letter within the same column are not significantly different according to the LSD test (p < 0.05).
Table 6. Simple correlation coefficient (Pearson method) among all parameters studied in saline and non-saline conditions in Olea europea (p ≤ 0.05 *; p ≤ 0.01 **). Abbreviations: PDW (plant dry weight); RDW (root dry weight); SDW (stem dry weight); LDW (leaf dry weight); LRWC (leaf relative water content); Js-Na (net translocation of Na+); Js-K (net translocation of K+); Chl (chlorophyll a+b); Chla/b (chlorophyll a/b); Car (carotenoids); Spd (spermidine); Spm (spermine).
PDWRDWSDWLDWLRWCLeaf Na+Leaf K+
PDW1
RDW0.8092 **1
SDW0.7951 **0.48401
LDW0.9264 **0.6428 **0.6175 *1
LRWC0.7559 **0.6077 *0.5570 *0.7245 **1
Leaf Na+−0.8690 **−0.7438 **−0.6246 *−0.8158 **−0.7737 **1
Leaf K+0.7212 **0.5228 *0.7212 **0.6091 *0.6070 *−0.7841 **1
Leaf K+/Na+0.6949 **0.6545 **0.50450.6365 *0.6998 **−0.9093 **0.7239 **
Root Na+−0.8455 **−0.7809 **−0.5252 *−0.8300 **−0.7650 **0.9304 **−0.6926 **
Root K+0.7182 **0.6002 *0.5595 *0.6955 **0.8494 **−0.8569 **0.7818 **
Root K+/Na+0.7052 **0.6388 *0.45740.8339 **0.8339 **−0.9199 **0.7354 **
Js-Na−0.7999 **−0.7435 **−0.5577 *−0.7174 **−0.7563 **0.9764 **−0.7861 **
Js-K0.8350 **0.6437 **0.6306*0.8501 **0.7150 **−0.7894 **0.7049 **
Chl0.50390.5230 *0.24660.46620.5401 *−0.5616 *0.4609
Chla/b0.5468 *0.48730.30650.5326 *0.4120−0.48900.4066
Car0.24120.23210.19850.16690.2457−0.23620.2293
Proline−0.2345−0.11550.0231−0.4396−0.19770.11830.0663
Fructose0.39040.09370.44100.39280.3379−0.41780.4368
Glucose−0.4568−0.4795−o.2779−0.3839−0.22980.3864−0.0613
Inositol0.6037 *0.46410.36350.6469 **0.8994 **−0.7045 **0.4449
Mannitol−0.5269 *−0.5735 *−0.2495−0.5232 *−0.5349 *0.7630 **0.6334 *
Sucrose0.5544 *0.6131 *0.25360.528 *0.7128 **−0.5960 *0.1919
Starch0.30590.6559 **0.03830.17780.0760−0.2074−0.0301
Spd0.01700.12330.0209−0.06550.2079−0.34180.3508
Spm0.28430.14680.14130.3141−0.0572−0.18820.2791
Ethylene−0.3180−0.4574−0.1582−0.21970.14550.14220.1709
ChlChla/bCarProlineFructoseGlucoseInositol
Chl1
Chla/b0.9175 **1
Car0.8799 **0.8425 **1
Proline0.30090.22260.5777 *1
Fructose0.6258 *0.5921 *0.6137 *0.32941
Glucose0.0028−0.00920.10480.0769−0.07191
Inositol0.28560.1636−0.0188−0.34290.0517−0.21121
Mannitol−0.2284−0.07300.19360.3290−0.10320.3068−0.5718 *
Sucrose0.25440.2032−0.0606−0.24820.1440−0.40650.7127 **
Starch0.19180.17160.04610.01710.0289−0.3616−0.0280
Spd0.44390.18710.35030.36100.44450.277770.1192
Spm0.49410.6689 **0.5334 *0.21860.4168−0.0702−0.1733
Ethylene−0.1539−0.1539−0.2110−0.07080.03520.39270.1839
Leaf K+/Na+Root Na+Root K+Root K+/Na+Js-NaJs-K
Leaf K+/Na+1
Root Na+−0.9093 **1
Root K+0.8818 **−0.8452 **1
Root K+/Na+0.8818 **0.9092 **0.9412 **1
Js-Na−0.8855 **−0.8744 **−0.8506 **−0.8433 **1
Js-K0.7972 **−0.9117 **0.7995 **0.8296 **−0.6905 **1
Chl0.4103−0.44560.38370.4542−0.6140 *0−3224
Chla/b0.2591−0.3640.24920.2956−0.49300.3098
Car0.0640−0.05210.01070.0714−0.2929−0.0220
Proline−0.18960.3479−0.2804−0.3207−0.0250−0.4719
Fructose0.2313−0.24400.24760.1745−0.44190.2214
Glucose−0.19430.4030−0.1204−0.100060.3644−0.2708
Inositol0.6789 **−0.7065 **0.8257 **0.8151 **−0.6784 **0.6328 *
Mannitol−0.8294 **0.8182 **−0.832 **−0.8107 **0.7788 **−0.7032 **
Sucrose0.5347 *−0.6429 **0.6046 *0.5575 *−0.5875 *0.4866
Starch0.1360−0.26800.06560.0606−0.26100.1052
Spd0.4061−0.16140.36270.3522−0.4692−0.0793
Spm−0.14140.0273−0.069−0.1130−0.2154−0.0613
Ethylene0.02990.10150.23410.18900.08960.0033
MannitolSucroseStarchSpdSpmEthylene
Mannitol1
Sucrose−0.48361
Starch−0.20350.50821
Spd−0.33850.09330.14951
Spm0.0688−0.23880.03660.09321
Ethylene−0.1032−0.2325−0.5471 *0.2777−0.32621
Disclaimer/Publisher’s Note: The statements, opinions and data contained in all publications are solely those of the individual author(s) and contributor(s) and not of MDPI and/or the editor(s). MDPI and/or the editor(s) disclaim responsibility for any injury to people or property resulting from any ideas, methods, instructions or products referred to in the content.

