Article

The Effect of Water Stress on the Glucosinolate Content and Profile: A Comparative Study on Roots and Leaves of Brassica oleracea L. Crops

by
Hajer Ben Ammar
1,2,†,
Donata Arena
1,†,
Simone Treccarichi
1,
Maria Concetta Di Bella
1,
Sonia Marghali
2,*,
Nadia Ficcadenti
3,
Roberto Lo Scalzo
4 and
Ferdinando Branca
1
1
Department of Agriculture, Food and Environment (Di3A), University of Catania, Via Valdisavoia 5, 95123 Catania, Italy
2
Laboratory of Molecular Genetics Immunology and Biotechnology (LR99ES12), Faculty of Sciences of Tunis, University of Tunis El Manar, Tunis 2092, Tunisia
3
Research Centre for Vegetable and Ornamental Crops, CREA, Via Salaria 1, 63077 Monsampolo del Tronto, Italy
4
Research Centre for Engineering and Agro-Food Processing, CREA-IT, Via G. Venezian, 26, 20133 Milano, Italy
*
Author to whom correspondence should be addressed.
These authors contributed equally to this work.
Agronomy 2023, 13(2), 579; https://doi.org/10.3390/agronomy13020579
Submission received: 31 December 2022 / Revised: 24 January 2023 / Accepted: 15 February 2023 / Published: 17 February 2023

Abstract

:
Drought is one of the major challenges of global crop production, and its severity is increasing because of climate change. This abiotic stress is an important target for Brassica species, which are generally grown in arid and semi-arid climates. This study was conducted to investigate the effects of water deficit on a set of accessions belonging to the Brassica core collection of the EU H2020 BRESOV project, represented by Brassica oleracea L. crops and Brassica oleracea complex species (n = 9). In particular, the variation in the amount and profile of the glucosinolates (GLSs) compounds was analyzed on the root and the leaf tissues. The plant morphometric traits and GLSs amount and profile were detected for the plants grown in cold greenhouse in Catania (Sicily) during the autumn–winter season for ten weeks. The results showed a wide qualitative and quantitative variation among the Brassica accessions. The GLSs profile varied qualitatively and quantitively among both genotypes and portions of the plants (hypogenous-root and epigeous-leaf). Plants grown under drought stress, for the last two weeks of the growing cycle under consideration, showed a higher amount of GLS in their leaves (190.1 ± 8.9 µmol. g−1 d.w.) compared to their roots (17.3 ± 1.9 µmol. g−1 d.w.). Under water stress conditions, the highest increase in the glucosinolate amount was detected in broccoli (the accession BR1) with 85.4% and in cauliflower (the accession CV1) with 72.8% in the roots and leaves, respectively. Positive correlations were found between the major leaf and root GLSs identified. The selection of chemotypes allows for an important time reduction during the breeding programs after crossing accessions with the specific profiles of glucosinolates.

1. Introduction

Owing to world population growth and the rise of food security risk, global concerns for endangered water and land resources are increasing. The availability of water is one of the most common environmental factors that has a great impact on plant growth and on vegetable crop productivity [1]. Therefore, it is critical to understand how crops respond to water stress and what steps are possible to adopt for improving their drought tolerance [2]. In fact, species can adapt themselves to environmental change through different strategies, varying from extinction to resilience. On the other hand, plants may mitigate ongoing climate change by modifying their morphological and physiological traits [3]. It is important to note that the Mediterranean basin is most sensitive and hence more vulnerable to climate change with longer and warmer summers, more frequent and severe heat waves, altered precipitation patterns, as well as less rainfall [4]. In addition, a complex of botanical species of agricultural and nutritional importance originated in the Mediterranean region due to the mild winter climate and to the fertility of its soils [5]. Sicily, due to its geographic isolation, is an important source of biodiversity for many Brassica oleracea L. crops for the genetic flux among them and for several populations of B. oleracea complex species (n = 9) which represent their wild relatives. In fact, B. oleracea crops are represented in Sicily by several varietal groups that are distinguished by various morphometric, biochemical, and genetic traits [6]. Nevertheless, before starting any plant breeding effort, each breeder must answer the crucial question: what are the detrimental consequences of abiotic stresses (i.e., drought, salinity, and water logging) on the crop that should be resolved?
B. oleracea crops, similar to other agricultural plants, are affected by both abiotic and biotic stressors which stimulate different organs to accumulate higher amounts of primary and secondary metabolites to boost their resistance [7]. Drought stress is an environmental stress that can cause physiological, biochemical, and agronomic damage to plants, such as less turgor, lower crop productivity, and reduced plant height and weight [8]. It can also affect the quality of the crops [9]. In addition, transpiration, the absorption of ions, carbohydrates, nutritional assimilation, and growth promoters are damaged as a result of arid conditions [10]. Water deficiency can produce an increase in reactive oxygen species (ROS) [11] and cause morphological and anatomical changes in the roots and leaves of many plant species [12]. In general, drought conditions can reduce the photosynthetic rate, accelerate the senescence of the leaves, but can also trigger an oxidative burst, accelerate the degradation of photosynthetic pigments, and damage the cell membrane by inducing the expression of antioxidant enzymes [13]. However, water deficiency causes the accumulation of proline, which is considered a compatible solute that protects cellular structures and maintains the pressure of turgor. Several studies have shown how the accumulation of proline increases the resistance of plants against numerous environmental conditions, activating antioxidant enzymes including superoxide dismutase (SOD), catalase (CAT), and peroxidase (POD) [14]. Water deficiency also affects the amount and profile of the metabolites present in the crops. Among the secondary metabolites that are affected by water, glucosinolates (GLSs) have received high attention as a bioactive compound mainly found in B. oleracea crops and in general of the species belonging to the Brassicaceae family, recognized for their distinctive benefits for human nutrition and plant defense.
Glucosinolates (GLSs) are commonly used as chemical markers in chemotaxonomy. Their distribution in B. oleracea crops is known to vary among crops and landraces and are very diversified for different populations of the B. oleracea complex species (n = 9) [15]. Many key roles in different physiological processes have been attributed to GLSs and their breakdown products (mainly isothiocyanates and nitriles), such as auxin signaling [16], flowering time [17], stomatal closure [18], water transport [19], environmental adaptations [20], plant stress alleviation, and growth–defense balance [21]. GLSs can be classified in three different groups depending on the amino acid from which their biosynthesis starts; aliphatic compounds are derived from one of the following amino acids: alanine, valine, leucine, isoleucine, and methionine, the indolic ones derive from tryptophan, and the aromatic ones derive from phenylalanine or tyrosine. The GLSs compounds are synthesized through a specific metabolic pathway that is influenced by different factors. The biosynthesis of glucosinolates involves three phases: chain elongation of selected precursor amino acids, formation of the glucosinolates structure, and secondary modifications of the amino acid side chain [22]. In the first step, for glucoraphanin (GRA), for example, aliphatic glucosinolates derived from methionine, the ELONG gene, regulates the elongation of the methionine chain. The pathway of methionine is regulated by the MYB28 transcription factor. CYP79F1, CYP83A1, and UGT74B1 genes regulate the formation of desulfo-glucosinolates which are further catalyzed into aliphatic glucosinolates by ST5b [23]. FMOGS-OX1 catalyzes glucoerucin into glucoraphanin, which is converted to gluconapin by AOP2 [24]. The biosynthesis of GLSs in plants has received much attention, and the accumulation and profile of GLSs in plants are largely determined by genetics, but environmental and developmental variables also play an important role [25]. The aliphatic GLSs content is highly heritable and varies among Brassica species and cultivars. Indolic GLSs, on the other hand, are present in great quantities in Brassica vegetables, although their levels are influenced not only by environmental factors but also by growing, harvesting, and processing conditions [26]. Actually, great diversity was detected in both the amount and profile of GLSs for Brassica oleracea L. crops in comparison to B. rapa ones, for which the genetic diversity of the GLSs profile is extremely narrow. Similarly, each crop is distinguishable by the detection of similar major and minor glucosinolates [27]. Sinigrin, glucobrassicin, and glucoiberin have been identified as the major GLSs in kales and cabbages, while in broccoli, common GLSs are aliphatic glucoraphanin, indolic glucobrassicin, and neoglucobrassicin [28]. Roots showed the highest diversity and content of individual GLSs due to the complicated and stressful rhizosphere [29].
The profile and amount of GLSs are affected by abiotic and biotic stress. Stressors such as drought or the salinity concentration affect the GLSs concentration, determining their increase in stressed plants [30]. The irrigation frequency and amount of water and salinity provided to the plants can affect the GLSs concentration in different tissues and organs, as reported by Chorol et al. (2021) [31,32]. High levels of temperature increased the GLSs concentration in the plants throughout the growing cycle, according to Velasco et al. (2007) [33], whereas low temperatures reduced the GLSs content. Moreover, Ciska et al. (2000) [34] confirmed that high temperatures significantly increased the glucosinolate content of various Brassica plants. The aliphatic glucosinolate gluconasturtiin content is influenced by the photoperiod [35]. The amount of gluconasturtiin increased by about 30–40% for the plants cultivated during photoperiodic conditions of long days rather than for plants grown during short days. Plants cultivated at temperatures between 10 and 15 °C increased the amount of gluconasturtiin by about 50% more than plants grown at the same day length at 20–25 °C [36].
The tolerance to water stress observed in the different varieties studied is associated with the content of specialized metabolites that can serve not only as a defense mechanism against environmental stressors but also as a source of nutritional compounds for human health. We hypothesize that the accumulation (quantity) and the profile (type) of the glu-cosinolate depends on the genotype and the organ studied. The aim of this study is to investigate the GLSs variations in the roots and leaves of seventeen accessions of Brassica oleracea landraces (LRs) and a composite cross population (CCP) in relation to water stress practices to identify differences due to genetic and environmental factors (abiotic stress).
The detection of the GLSs concentration and profile in different crops of Brassica oleracea L. and the correlation analysis between the individual GLSs in relation to water stress could highlight the impact of stress factors on GLSs biosynthesis. Moreover, a chemotaxonomy approach based on GLSs composition was developed by calculating the molar percent of the different glucosinolates composition for each accession, further comparing the profile with and without water stress. Thus, comparing genotypes in a specific environment for evaluating and identifying the variation in the plant morphometric and biochemical traits allows for the individuation of the elite breeding lines for further breeding programs.

2. Materials and Methods

2.1. Plant Material and Experimental Design

Brassica oleracea landraces (LRs) and one set of some B. oleracea composite cross populations (CCP, Brassica oleracea L. var. cross), established in the frame of the EU H2020 BRESOV project, are represented by the landraces of cauliflower (Brassica oleracea L. var. botrytis), broccoli (Brassica oleracea L. var. italica), and kale (Brassica oleracea L. var. acephala), and by the CCP F1 and F2 populations. The experimental design adopted was split by plot with two experimental factors: the first was the irrigation regime (IR), while the second was represented by the genotype (GE), and each thesis was replicated three times with ten plants for each elementary plot. The accession list included three accessions of kale (BH1-BH2-BH3), five of broccoli (BR1-BR2-BR3-BR4-BR5), five of cauliflower (CV1-CV2-CV3-CV4-CV5), and four composite cross populations (CCP1-CCP2-CCP3-CCP4) (Supplementary Data Table S1). All the tested accession belonged to the Brassica collection of the Department of Agriculture, Food and Environment (Di3A) of the University of Catania (UNICT). Seeds were sown in cellular trays using organic substrate (Terri Bio, “Agro-Chimica S.p.”, Bolzano, Italy) and placed under cold greenhouse conditions on the experimental farm of the University of Catania (Di3A) (south Italy 37°31′, 37°31′10′′ N 15°04′18′′ E; under natural light) at the beginning of the month of September. After one month, the plantlets were transplanted into 0.3 L pots filled with the same substrate utilized for the sowing. Four weeks after transplanting, we separated all the grown plants into two plots: the irrigated (IRR) as the control and the not irrigated (NIR). The IRR plants were irrigated until they reached the field capacity, whereas the NIR ones were not irrigated. After two weeks of drought stress, the plants were collected for registering the morphometric and biochemical traits. The leaves and roots samples were gently washed and dried and stored at −80 °C for one week before freeze-drying them for biochemical analysis. All the examined traits are listed in Table 1.

2.2. Morphometric Traits

The characterization of the plants was done using the International Descriptors IBPGR (International Board for Plant Genetic Resources) and UPOV (the International Union for the Protection of New Varieties of Plants) morphological descriptors. The plant weight (g) and height (cm), stem diameter (mm), number of leaves (n), root fresh/dry weight (g), and main root length (cm) were registered among the main morphometric traits. The Single Photon Avalanche Diode (SPAD) was utilized for detecting the nutritional status of the plant and the SPAD index was utilized for three fully developed leaves for all the plants of each replicate, using a portable chlorophyll meter SPAD-502 (Minolta Camera Co., Osaka, Japan).

2.3. Glucosinolates Extraction

In the leaves (L) and the roots (R) collected, we detected the GLSs total amount and their profile. The extraction method of the GLSs was based on the International Standard Method ISO 9167-1, 1992 [37], which the European Commission has formally adopted (European Commission, 1990), with several modifications [38]. An amount of 200 mg of the freeze-dried samples was boiled in 5 mL of methanol 70% for 10 min at 70 °C to inactivate myrosinase, thereby preventing the enzymatic hydrolysis of the GLSs. The supernatant was collected after centrifugation at 12.000 rpm for 20 min at 4 °C. A total of 2 mL of the samples was inserted into a 25 × 8 mm inner diameter column filled with 0.5 mL of an aqueous mixture DEAE-Sephadex A-25 resin 50% w/v, previously conditioned with a 0.02 M buffer of acetic acid and pyridine. The glucosinolates were hydrolyzed in the column to obtain their desulfoglucosinolates by adding 75 µL (5 U. ml−1) of sulfatase E.C.3.1.6.1 from Helix pomatia. After overnight incubation, the desulfoglucosinolates were eluted with 1.5 mL of ultrapure H2O and analyzed using high-performance liquid chromatography (HPLC, Agilent 1200 Series System) with a diode array detector.

2.4. High-Performance Liquid Chromatography (HPLC) Analysis

The GLSs content and profile were determined by the HPLC diode array detector technique, separating de-sulpho glucosinolates. Each of the ten intact glucosinolate standards at a 0.2 M concentration were dissolved in 2 mL of Milli-Q water to prepare the mixture of the stock standard solution. The mixture was further diluted to prepare calibration standard solutions of 0.1, 0.2, 0.4, and 1.0 µmoles ml−1, respectively. All standard solutions were stored at 4 °C until use. The desulphoglucosinolate extracts were injected into an HPLC-DAD equipped with a Kinetech C18 (250 × 4.6 mm, particle size 5 µm) column with a mobile phase of ultrapure water (solvent A) and acetonitrile: water 20:80 (v/v) (solvent B), with a flow rate of 1.1 mL min−1 and an injection volume of 20 µL, with a binary gradient: 100%A–0%B for 5 min, increased to 70%A–30%B from 5 to 17 min, and then at 30%A–70%B for 3 min; the entire run lasted for 40 min. All the reagents used in the analysis were of HPLC grade. The chromatograms were recorded at 229 nm; the quantification was based on the calibration curves of the external standards by comparing each compound through the retention time (RT) and UV spectra. The results were expressed in micromoles per gram of the dry weight. The data are presented with the means and standard deviation (SD) of triplicate experiments. The GLSs standards were (in order of elution) SIN: sinigrin; GRA: glucoraphanin; SIB: glucosinalbin; GNA: gluconapin; GAL: glucoalyssin; GER: glucoerucin; GBS: glucobrassicin; GBN: glucobrassicanapin; NGBS: neoglucobrassicin; and GST: gluconasturtiin (Figure S1). All standards were purchased from ChromaDex (Santa Ana, CA, USA).

2.5. Statistical Analysis

Data are presented in terms of the means ± standard deviation (SD) and the statistical analysis significance was calculated in triplicate, two-way ANOVA by CoStat software version 6.4, followed by Tukey’s multiple comparisons test, of which p-values < 0.05 were considered to be statistically significant. Data were transformed using the percentage rank of the analysed matrix. Statistical analysis was performed using the SPSS software version 27. Pearson’s correlation coefficient was used to determine the correlation among the individual glucosinolates. The variation index (VI) describes the variation percentage of the morphometric traits of the NIR plants compared to the IRR ones, using the following formula:
VI = −(100 − (Stress/Control × 100)).
We performed the principal component analysis (PCA) utilizing the relative data of the GLSs detected in order to make evident the contribution of each GLS detected in the percentage in relation to the total amount detected. The PCA was established to discriminate the different B. oleracea varietal groups and the main GLSs associated with them. The percentage calculated was normalized using the angular coefficient (DEGRES(ASIN(RACINE(x/100))). We elaborated the percentage of variation for leaves collected in the NIR plot in relation to those in the IRR plot. ((NIR/IRR) × 100).

3. Results

3.1. Agronomic Trait Analysis

During the growing cycle, the mean temperature registered was 22.4 ± 5.8 °C and the mean solar radiation was 5.9 MJ. m–2 d–1. The morphometric data results highlighted several differences between the conditions under which the plants were tested and the genotypes analyzed (Table 2). The plant weight (PW) showed a significant interaction between the two experimental factors and the values varied from 535.0 g to 112.0 g, for BR3 grown in the IRR main plot and for CV1 in NIR, respectively (Table 2). The genotypes which showed the positive variation index (VI) were CCP4 and CV3, varying from 33.1 to 8.9, and the lowest negative VI was observed for BH3, BH2, CV4, BR5, and BH1, fluctuating from −8.4 to −29.7; all the above-mentioned accessions showed a good resilience as the reduction in the PW was limited for the plants grown in the NIR plot compared to the IRR one (Table 2). Concerning the plant height (PH), we observed a significant interaction IRR × GE, and its value varied from 69.8 cm for BH2 in IRR to 13.7 cm for CV2 in NIR. With regard to the VI for the PH trait, it varied from −6.1 to −27.1, for BR2 and BR4, respectively (Table 2). The stem diameter (SD) exhibited a significant interaction between IRR and GE (IRR × GE) and the value ranged from 5.1 mm for BR1 grown in the normal irrigation system to 1.3 mm for BR1 and CCP4 both in the drought stress condition. The genotypes showed negative VI and the value varied from −20.7 to −29.4 for BH1 and BR5, respectively (Table 2). Regarding the number of leaves (NL), we observed a significant interaction IRR × GE, and its value varied from 15.0 leaves for CV3 in the IRR system to 4.0 leaves for BR2 and CCP2 grown by the NIR one. The VI value for the NL trait fluctuated from 0.0 for CV4, in which variation was not observed in comparison to the plants grown by drought stress application, to −28.6 for BR1 and CCP4 (Table 2).
The SPAD index displayed a significant interaction between the two experimental factors (IRR × GE); it varied from 62.8 to 35.1 for CV5 and BH2 grown by IRR and NIR protocols, respectively (Table 2). The VI value ranged from 0.0 to −28.5 for CCP2 and BH2, respectively (Table 2). Concerning the root weight (RW), the variation observed for IRR was not significant, but we noted a significant interaction between the two experimental factors studied (IRR × GE); the VI varied from 43.9 to 8.0 g for BR3 grown in the IRR plot and CV5 in the NIR system, respectively. The VI observed ranged from −0.7 to −28.2 for BH2 and BR1, respectively (Table 3). Regarding the main root length (MRL), we also observed a significant interaction between IRR and GE and its value varied from 21.0 to 2.8 cm for BH2 and BH3 in the IRR and NIR regime, respectively (Table 3). The VI value exceeded among all the genotypes was −30.0 and the variation among the genotypes was higher than the other traits analyzed (Table 3).

3.2. Comparison between the Total Amount of GLS between Roots and Leaves

The water stress affected the amount and the profile of GLSs in all the studied genotypes. With regard to the GLSs content of the roots, we observed a significant interaction between the two experimental factors (IR x GE) and its value ranged from 38.2 to 2.5 g−1 d.w. for BH2 grown in NIR plots and CCP1 grown in IRR ones (Table 4). The accessions that showed the highest concentration of GLSs in the roots were BR4, CCP3, CV1, and BH1, in decrescent order, respectively, varying from 38.2 to 11.8 g−1 d.w. for BH2 grown in NIR and IRR plots, respectively (Table 4). The total GLSs concentration detected was higher in the leaves than in the roots for all the accessions analyzed. The total GLSs amount was affected significantly by the interaction between IR and GE and its value varied from 578.9 to 35.8 µmol. g−1 d.w. for BR4 grown in the NIR plot and for CV3 grown in the IRR one (Table 4). In general, the accessions BR4, BR5, BR2, CCP3, and CV1 showed the highest GLSs content in the leaves, which varied from 578.9 to 111.8 µmol. g−1 d.w. for BR4 in the NIR plot and for CV1 grown in the IRR one, respectively (Table 4). The genotypes in both IR plots showing the lowest variation in the total GLSs content were BH1, CV2, and BR3, and their GLSs total amount fluctuated from 126.2 to 66.9 µmol. g−1 d.w. for BH1 grown in the NIR plot and CV2 grown in the IRR one, respectively (Table 4).

3.3. Variation in Individual Glucosinolate in Roots

In the GLSs profile in the roots, each compound was affected by the significant interaction between the two experimental factors studied (Tables S1 and S2).

3.3.1. Aliphatic Glucosinolates

The singrin (SIN) content was affected by the interaction IR x GE and it varied from 10.8 to 0.0 for BR4 grown in the NIR plot and for BR2, CCP4, CV1, and CV5 grown in the IRR one, respectively; for CCP3, we did not detect SIN in the NIR plot, and in the IRR plot, we observed 2.1 µmol. g−1 d.w. (Table S1). The highest values were detected in the cultivar Brassica oleracea var. italica BR4. SIN was not detected in CCP3 and CCP4 in both IR plots. The highest variation in the SIN content was observed for BR3, fluctuating between 5.5 and 1.0 µmol. G−1 d.w. grown in NIR and IRR plots, respectively (Table S1).
The glucoraphanin (GRA) ranged from 7.1 to 0.0 µmol. G−1 d.w. for CCP3 grown in the IRR plot and for BR4 and CCP2 grown in the NIR plot, respectively. For BR4, we have also not detected GRA in the NIR plot or in the IRR one (Table S1). For the genotypes BR3, CPP1, and CCP3, the GRA content increased by about 50% in the plants grown in the NIR and the IRR plots. The CCP4 roots increased the content of GRA by about 200%, from 0.3 to 1.0 µmol. g−1 d.w..
The gluconapin (GNA) varied from 1.6 to 0.0. g−1 d.w. for CCP2 grown in the NIR plots and for BR1 grown in the IRR plot, as well as for BH1, BR5, and CCP4 grown in the IRR plot, respectively. The GNA was not detected for BR2 and BR4 in both the IR studied (Table S1).
The glucoerucin (GER) content varied from 7.1 to 0.0 µmol. g−1 d.w. for BR5 grown in the NIR plot and for BR1, BR2, BR3, CCP3, CV2, CV3, CV4, and CV5 in the IRR plot, respectively; for BH3 and CV1, any GER in the roots of the plants grown in both IR plots was not detected (Table S1).
The glucobrassicanapin (GBN) ranged from 12.5 to 0.0 µmol. g−1 d.w. for BR4 grown in the NIR plot and for CV3, CV4, and CV5 in the IRR one, and for CCP2 grown in the NIR plot, respectively (Table S1).
The glucoalyssin (GAL) detected in the roots varied from 15.7 to 0.0 µmol. g−1 d.w. for BR3 grown in the NIR plot and for BR5 and CV1 grown in the IRR one, respectively. We did not detect GAL in the roots of CCP1 and CCP4 grown in the NIR plot (Table S1).

3.3.2. Indolic Glucosinolates

The glucobrassicin (GBS) content varied from 11.7 to 0.0 µmol. g−1 d.w. for CV3 grown in the NIR plot and for BR1 and CCP2 grown in the IRR plot, respectively. We did not detect GBS in BR2 in the plants grown in both IR plots studied, and in CV4 in the NIR plot (Table S2).
The neoglucobrassicin (NGBS) was detected in a lower concentration in all tested ac-cessions and its value fluctuated from 8.6 to 0.0 µmol. g−1 d.w. for CV5 grown in the NIR plot and for BR4, CCP2, CCP3, and CV4 grown in the IRR one. NGBS was not detected in BH1, BH2, BH3, BR1, BR2, and BR3 in the IRR and NIR plots, and in BR5 in plants grown in the NIR plot (Table S2).

3.3.3. Aromatic Glucosinolates

The sinalbin (SIB) content ranged from 13.5 to 0.0 µmol. g−1 d.w. for BR5 and for BR3, CCP1, and CV3 grown in the NIR plot, in decrescent order, respectively. For BR1, BR2, CCP2, CCP4, and CV1 we did not find SIB in the roots of the plants grown in both IR plots (Table S2).
The gluconasturtiin (GST) detected in the roots varied from 27.0 to 0.0 µmol. g−1 d.w. for CV1 grown in the IRR plot, and for BH2, BH3, BR2, CCP3, and CV4 also in the IRR condition, respectively. We did not find GST in CCP4 and CV3 in the NIR plot. The GST was not detected in BH1, CCP1, CCP2, CV2, and CV5 in the roots of the plants grown in IRR or NIR conditions (Table S2)

3.4. Variation of Individual Glucosinolate in Leaves

The GLSs profile detected in the leaves showed a highly significant interaction between the two experimental factors studied (IRR × GE) for all compounds registered (Tables S3–S5).

3.4.1. Aliphatic Glucosinolate

The sinigrin (SIN) ranged from 185.7 to 0.0 µmol. g−1 d.w. for BR4 grown in the NIR plot and for CCP1 and CV3 also in the NIR condition, in decrescent order, respectively (Table S3).
The glucoraphanin (GRA) varied from 36.4 to 0.0 µmol. g−1 d.w. for CV5 in the NIR plot and for BR2, BR4, CCP2, and CV2 grown in the IRR plot. We did not detect GRA in the leaves of BH2, CCP1, and CV4 collected in the NIR plot or for BH3 and CV3 collected in both IRs studied (Table S3).
For all the genotypes analyzed, we detected low amounts of gluconapin (GNA) in comparison to the other glucosinolates analyzed. The GNA ranged from 83.1 to 0.0 µmol. g−1 d.w. for BR3 grown in the NIR plot and for BR4, CCP2, CCP4, CV1, and CV2 grown in the IRR plot, in decrescent order, respectively. The GNA was not registered for CCP3 and CV3 grown in the NIR conditions and for BH1, BR1, BR2, BR5, CCP1, and CV4 grown in both IRs studied (Table S4).
The glucoerucin (GER) content in the leaves varied from 331.8 to 0.0 µmol. g−1 d.w. for BR2, BR3, BR5, CCP1, CCP2, and CV4 grown in the NIR condition, in decrescent order, respectively (Table S4). The GER was not detected for CV2 in plants grown in the IRR plot, whereas BR4 was not registered in either IR studied (Table S4).
The glucobrassicanapin (GBN) content fluctuated from 100.6 to 0.0 µmol. g−1 d.w. for CCP4 in the IRR plot and for BH2, BR3, CCP3, and CV3 in the NIR condition, in decrescent order, respectively (Table S4). The GBN also was not detected for CV1 in the plants grown in the IRR plot and for BR1 grown in both IRs studied (Table S4).
The glucoalyssin (GAL) ranged from 77.8 to 0.0 µmol. g−1 d.w. for CCP1, BR3, BR4, CCP3, and CV3 grown in the NIR condition, respectively. The GAL was not detected for BH1, BR1, and CV1 in both IRs studied (Table S4).

3.4.2. Indolic Glucosinolate

The glucobrassicin (GBS) detected varied from 125.3 to 0.0 µmol. g−1 d.w. for BR4 in the NIR condition and for BR2 and CV2 in the IRR plot (Table S5). The GBS was not detected for BR3, BR5, CCP1, CV1, and CV4 grown in the NIR plot. For BH1, BR1, and CCP4, the GBS was not registered for the leaves of the plants grown in both IRs studied (Table S5).
The neoglucobrassicin (NGBS) varied from 63.6 to 0.0 µmol. g−1 d.w. for CV2 in the NIR plot and for BH1, CCP1, CCP2, and CCP4 grown in the IRR plot, in decrescent order, respectively. The NGBS was not detected for BH2, BR1, BR3, and BR5 in both IRs studied (IRR and NIR). For BH3, BR2, and CCP3, we have not detected the NGBS in the leaves of the plants grown in the NIR plot (Table S5).

3.4.3. Aromatic Glucosinolates

The sinalbin (SIB) ranged from 20.1 to 0.0 µmol. g−1 d.w. for BR4 grown in the NIR plot and for BH1, BR1, CV2, and CV5 grown in the IRR condition, in decrescent order, respectively (Table S5). The SIB was not detected for BR3, CCP1, CCP3, CV3, and CV4 grown in the NIR plot, and BR2 was not found in either IR (Table S5).
The glucosnasturtiin (GST) content varied from 65.0 to 0.0 µmol. g−1 d.w. for CV1, BR1, BR3, and CCP2 grown in the NIR condition. The GST was not detected for BR4, CV2, and CV4 in either of the IRs studied (Table S5).

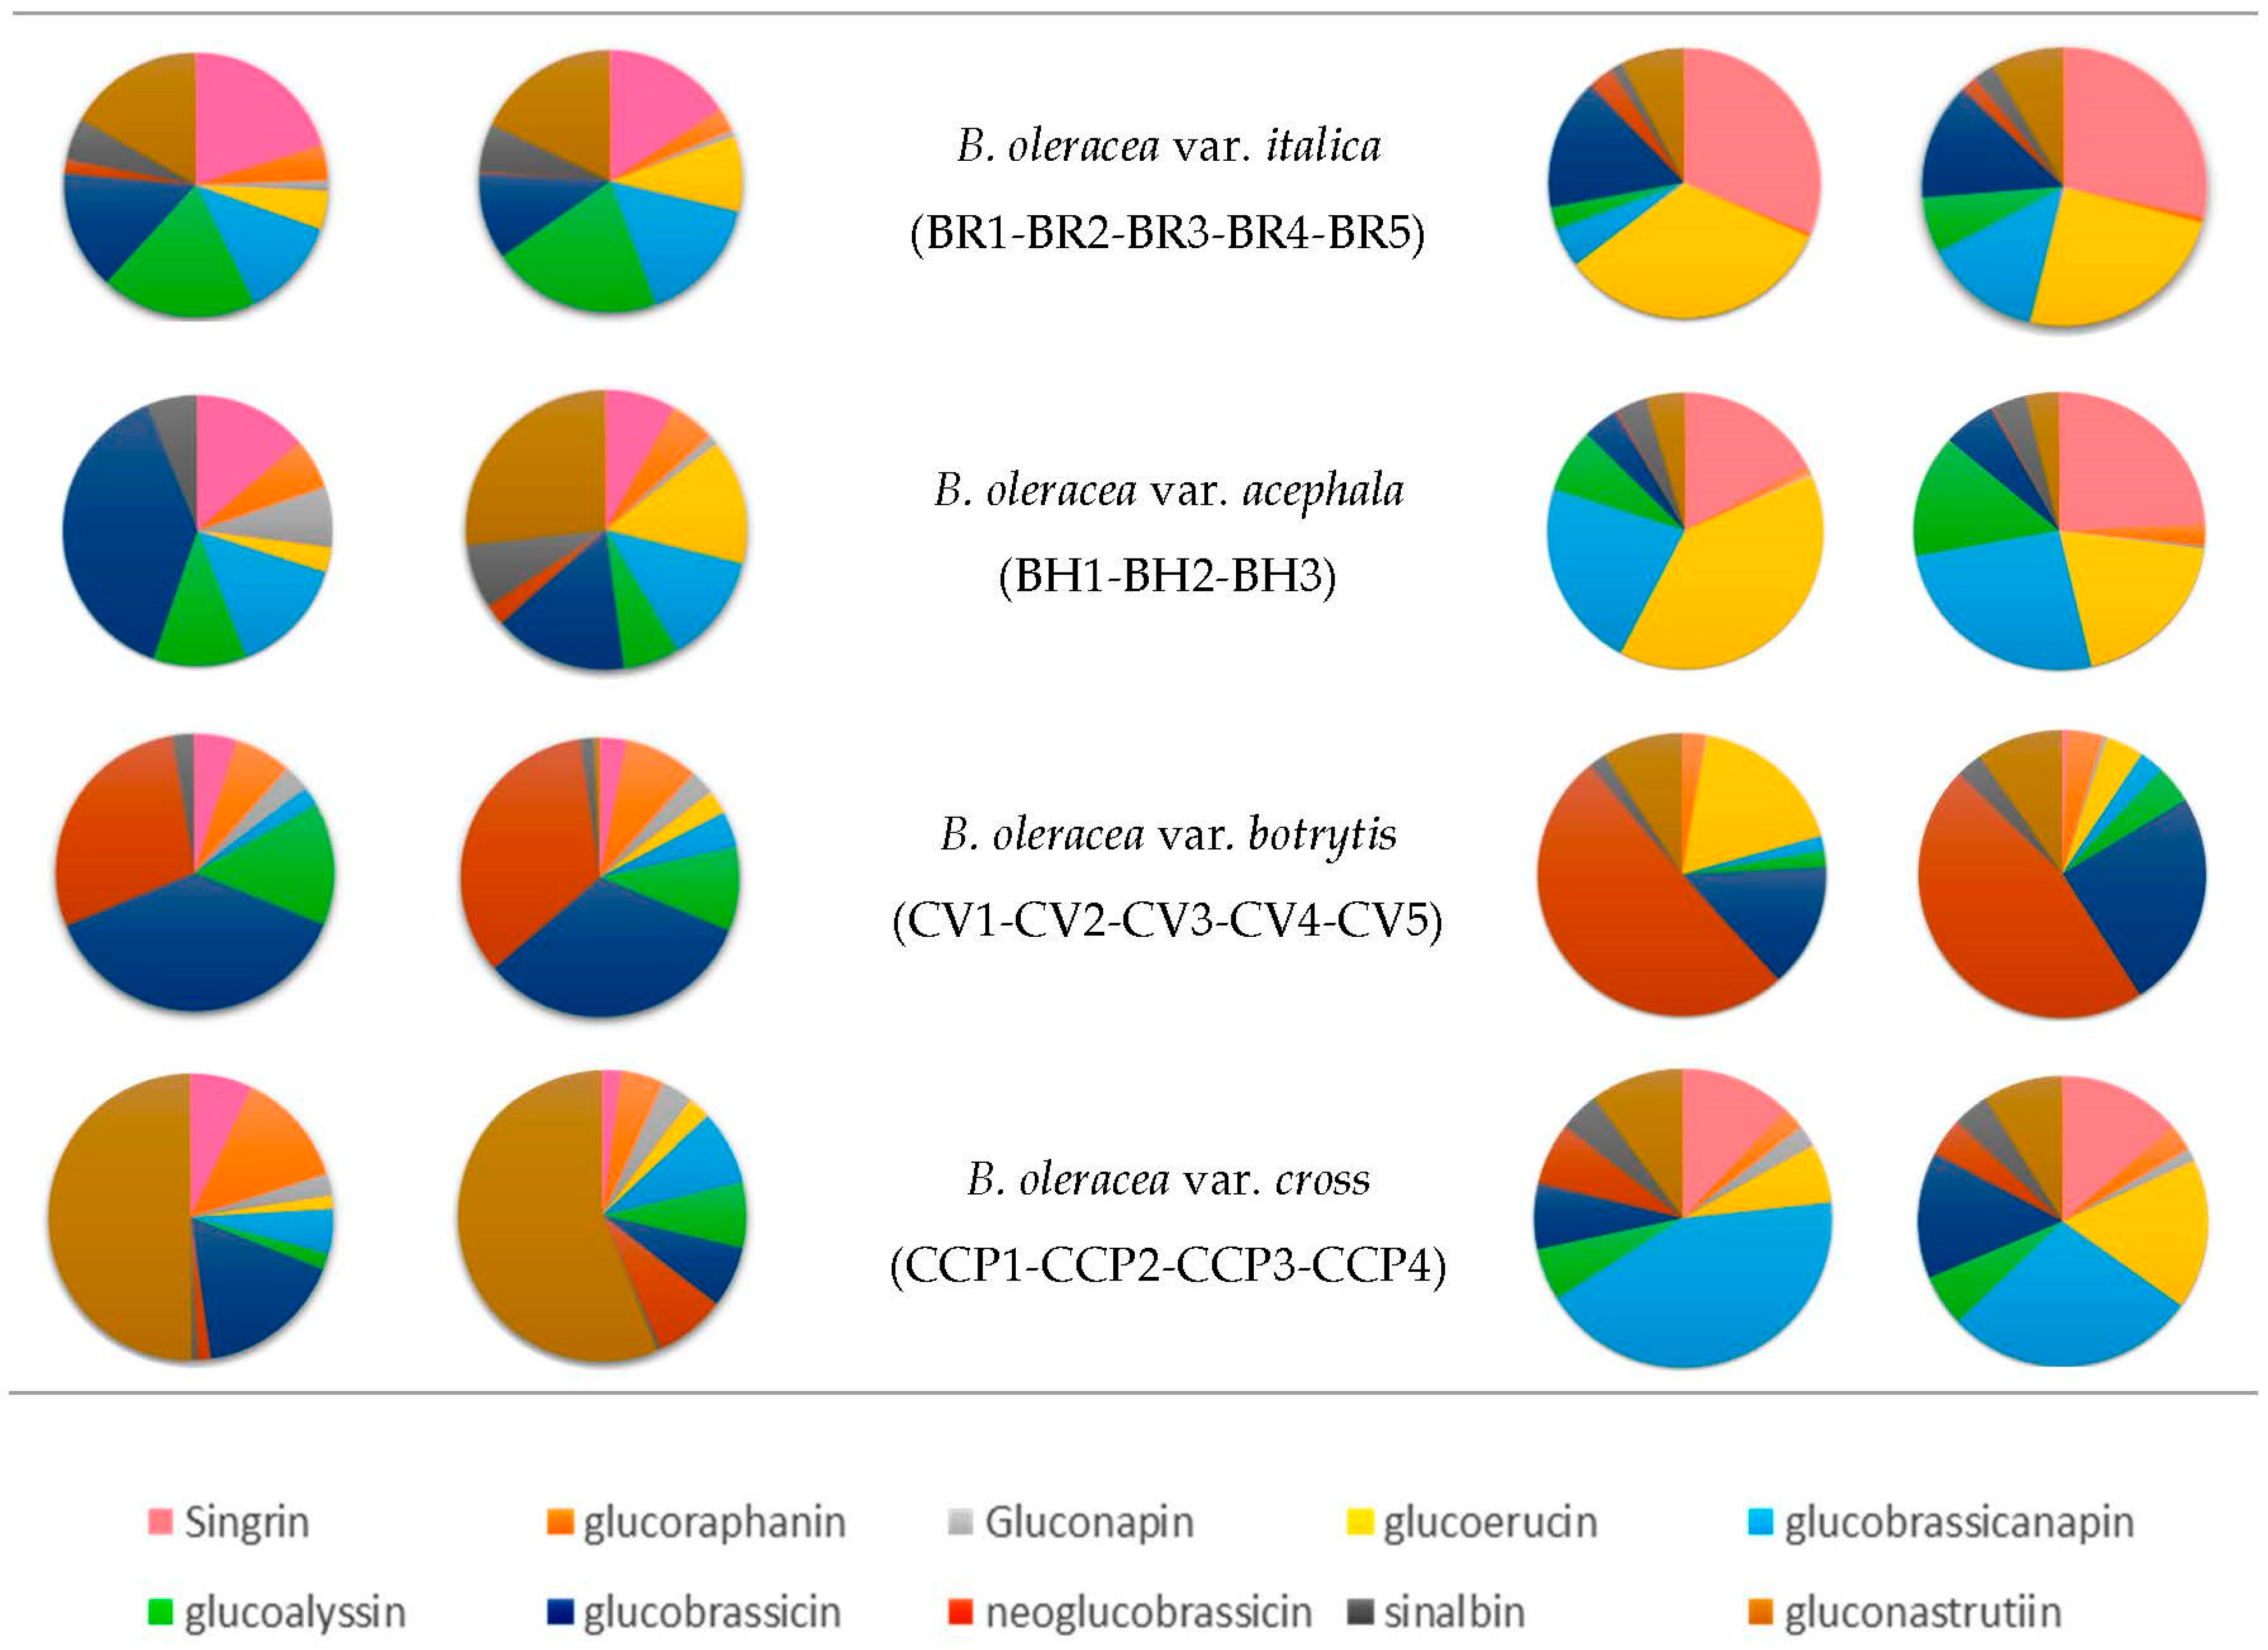
3.5. Chemotaxonomy of the Different Accessions

We noted that the aliphatic GLS were predominant in the roots of broccoli (Brassica oleracea var. italica) and kale (Brassica oleracea var. acephala) with 61.8% and 55.3%, respectively (Figure 1). Under water stress conditions, the percentage of aliphatic GLSs changed: an increase to 65.3% was observed, with a decrease in indolic from 16.3% to 10.9%, and the aromatic glucosinolates increased from 21.9% to 23.8%. While in kale, the aliphatic GLS decreased to 48.0%, an increase in the aromatic glucosinolates from 6.2% to 35.3% was noted, while the indolic GLSs decreased from 38.5% to 17.8%.
The indolic glucosinolate accounted for the major component in cauliflower (Brassica oleracea var. botrytis) with 66.0% of the total amount. Glucobrassicin represents 37.5% of the total glucosinolates; in relation to water stress, a decrease to 32.4% was observed while the neoglucobrassicin increased from 28.7% to 34.0%. In our study, the aliphatic glucosinolates represent 31.0% of the total GLSs in cauliflower, while the aromatic glucosinolates were found in a very low percentage.
The aromatic glucosinolates were predominant in the roots of CCP, Brassica oleracea var. cross with 50.0% in well-watered conditions and increased to 56.0% under water stress, while both aliphatic and indolic GLSs decreased from 31.0% to 28.6% and from 18.2% to 14.7%, respectively.
The aliphatic GLSs were found in a major percentage of the leaves of broccoli (Brassica oleracea var. italica) and kale (Brassica oleracea var. acephala), and, in particular, the glucoerucin and the sinigrin were the predominant glucosinolates with 39.6% and 37.4%, respectively, in broccoli (Brassica oleracea var. italica) and 17.3% and 39.4%, respectively, in kale (Brassica oleracea var. acephala) in well-watered conditions (Figure 1). The percentage of sinigrin under water stress conditions decreased in Broccoli (Brassica oleracea var. italica) (28.5%) and increased in kale (Brassica oleracea var. acephala) (24.2%). The glucoerucin under water stress conditions decreased both in broccoli (Brassica oleracea var. italica) and in kale (Brassica oleracea var. acephala) from 24.7% and 19.4%, respectively. The mean aliphatic GLSs found in Brassica oleracea var. cross was glucobrassicanapin with 42.6% of the total amount.
The indolic glucosinolates were predominant in Brassica oleracea var. botrytis; in particular, the percentage of neoglucobrassicin was 50.6% in normal conditions and 46.3% under water stress conditions. In other crops, the percentage of neoglucobrassicin was very low.
The glucobrassicin was the main indolic component found in Brassica oleracea var. italica, Brassica oleracea var. botrytis, and Brassica oleracea var. cross. The amount of glucobrassicin increased under water stress conditions from 14.1% to 24.5% in Brassica oleracea var. botrytis and Brassica oleracea var. cross, while in Brassica oleracea var. italica, the indolic GLSs decreased under drought stress from 18.9% to 13.6%.
The aromatic glucosinolates were found in low percentages in all crops.

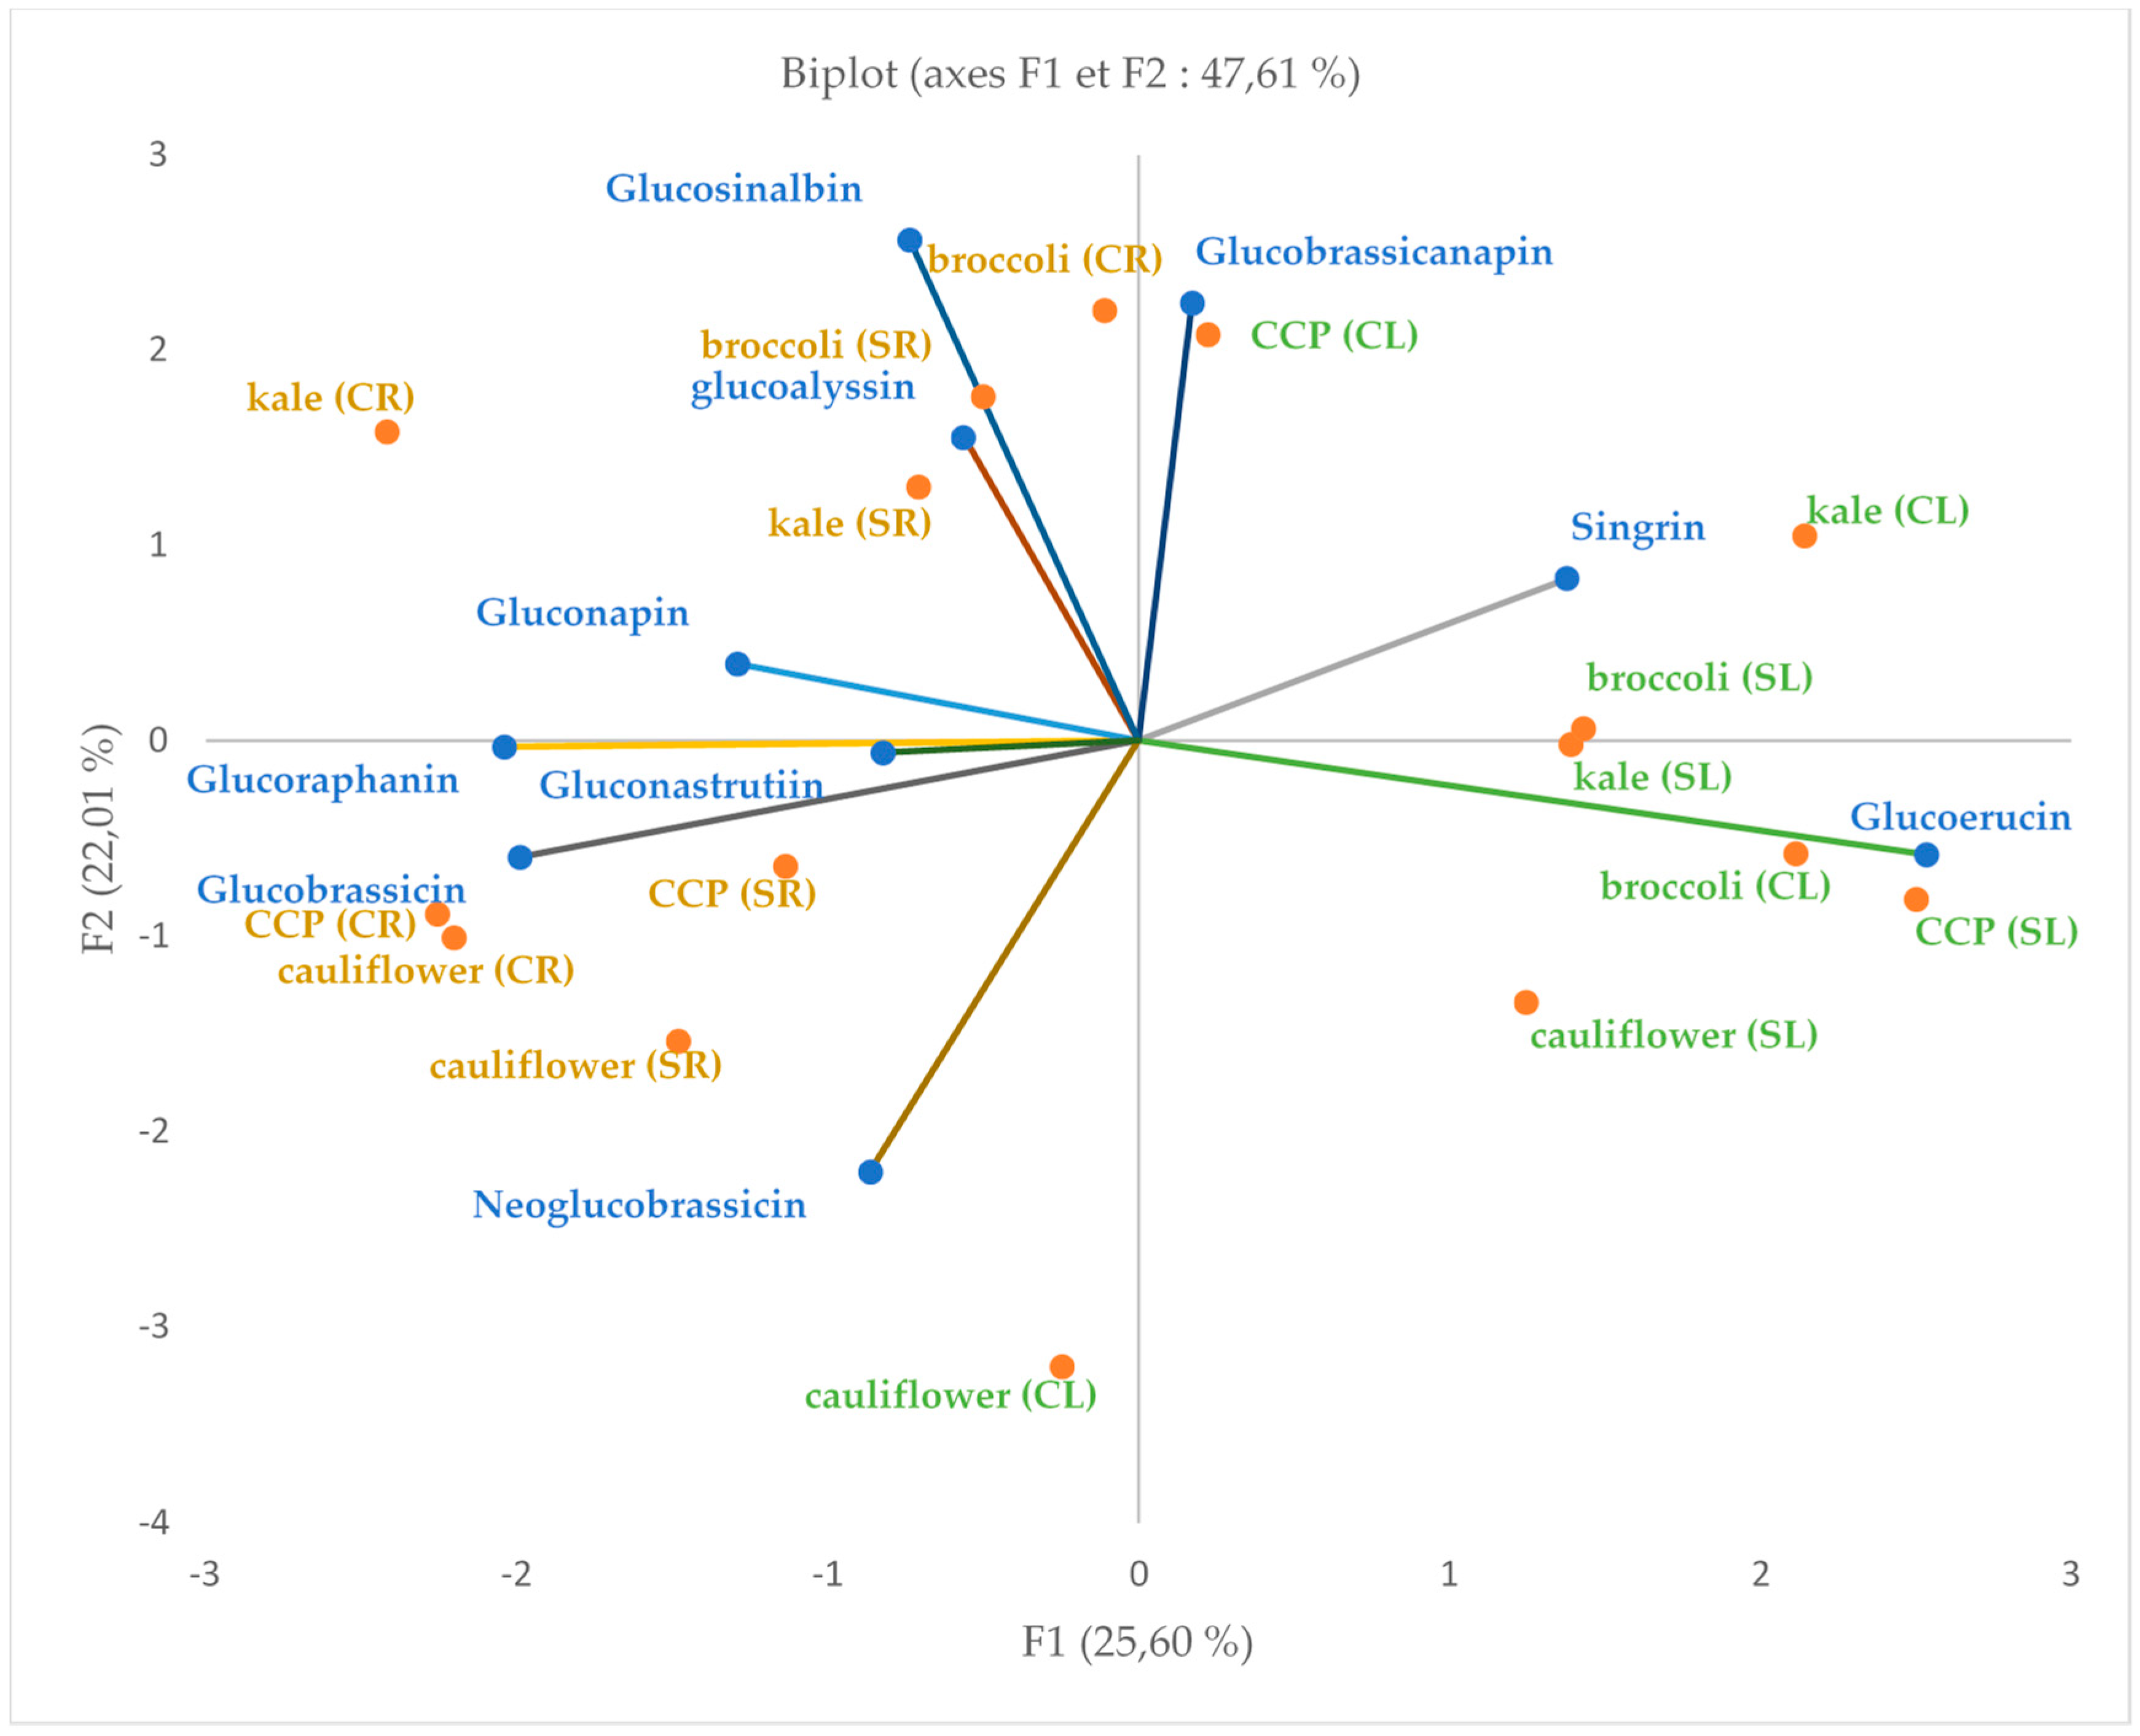
3.6. Principal Component Analysis of Glucosinolate Profile in Leaves and Roots

We investigated the potential value of glucosinolate profiles as reference markers for the chemotaxonomic classification and distribution of the four varieties of Brassica oleracea (kale, broccoli, cauliflower, and composite cross population) analyzed. Principal component analysis (PCA) of the GLSs data was performed to better visualize the observed differences in the samples based on their differential GLSs profile (Figure 2). PC1 explained 25.6% of the total variation, clearly separating the crops according to the tissues (roots and leaves). The PC2, which explained 22.0% of the total variation, mostly corresponds to the different tissues of the leaves and roots. These differences between tissues and cultivars are due to the differences in specific GLSs, as is clear from the PCA-loading plots visualizing the distribution of the individual GLSs across the various cultivars. In the left cluster, all the control and stressed roots are grouped together and correlated with the majority of the glucosinolates, where we found them to be aliphatic, indolic, and aromatic. In the other part of this biplot, all the leaves are grouped together and correlated with the three aliphatic glucosinolate singrin, glucoerucin, and glucobrassicanapin, which are predominant in this part of the plant; except for the leaves of cauliflower in the control condition, it showed a positive correlation with the indolic glucosinolate neoglucobrassicin.

3.7. Variation of the Glucosinolates Compounds and Profile of the Leaves

The leaves represent the products of kale and sprouting broccoli landraces; as for the latter ones, their products are traditionally represented in the Southern most Italian regions by their small heads and small tender leaves present around the inflorescence, which are collected and utilized for preparing typical dishes. For this reason, we analyzed the data registered to bring to light the variation in the GLSs content and profile in relation to water stress and to individuate the set of genotypes which could increase the nutraceutical value of the products.
The correlation among the different GLSs detected in the leaves of the accessions of B. oleracea crops studied and their morphometric parameters was carried out to show the relation among the GLS profile and the GLS pathways variation in drought conditions (Table 4). The SIN showed a high negative correlation with the indolic glucosinolate NGBS (Table 5), as they had different metabolic pathways, so the biosynthesis of one affects the other. The aromatic glucosinolate SIB was positively correlated with the plant height (IH) and the GER showed a negative correlation with GAL and SIB. In addition, the GER showed a positive correlation with GST, and no other ones were observed with all the plant morphometric parameters detected (Table 5). A strong positive correlation was also observed between GBN and SIB and with the root weight (IRW) (Table 5). The GAL showed no correlation with all the glucosinolates detected, except for a significant positive correlation with the root weight (IRW) (Table 5). The positive correlation observed between GBS and the plant height (IW), and between GBS and the number of leaves (IL), could be of great interest for the health profile of the leaves, and also of the products of kale and broccoli crops (Table 5). No correlation was observed between GBS and the rest of the GLSs detected. Moreover, NGBS showed no relationship with all the GLSs, but a negative correlation with the plant height (IH) and number of leaves (IL) (Table 5). The NGB was correlated positively with the NGBS and root length (IRL), and the SIB was significantly highly positively correlated with the SPAD index. The plant weight (IW) showed a strong positive correlation with the root weight (IRW) and number of leaves (IL) (Table 5). The plant height (IH) showed a high positive correlation with the SPAD index; nevertheless, the root length (IRL) highlights a negative correlation with the number of leaves (IL) (Table 5).

4. Discussion

Plants affected by drought will modify their morphology and biochemical composition for mitigating the water stress conditions present [39]. Drought stress tolerance is a complex trait and according to several studies, plants under abiotic stress can change their phenotypes to adapt themselves to unfavorable growing conditions [40]. The plant response to drought stress can be mitigated by a strong root architecture, and mainly by big and long roots parameterized in our work by the root weight (RW) and root length (MRL). Under water stress conditions, the resilience genotypes can quickly reach deeper layers of the soil and accumulate the plant reserves, increasing their RL and RW. In this study, we found that the morphological traits are affected by water stress (Table 1 and Table 2), and that helped us to determine the genotypes which can much more readily mitigate drought conditions and to study the variation in the antioxidant status of the plant by the GLSs amount and profile. Our results showed a moderate to high decrease in the morphometric traits, with a difference among the accessions. These findings are in accordance with the study by Issarakraisila et al. (2007) [41], in which it was reported that water deficiency significantly reduced the leaf area, fresh area, and dry weight of Chinese kale by more than half. Similarly, Souza et al. (2018) [42] reported lower values for the plant height and leaf number in cauliflower cultivated under water stress at 40% ETc in comparison to higher irrigation levels. Meanwhile, the accession CV3 showed a plant weight higher in water stress conditions than in the control, indicating that the water deficit did not alter the biomass of this resilient accession.
The morphometric variation in the traits caused by drought stress allowed for the individuation of the accessions to be reduced on average by 30% of the data registered, such as BH1, BH2, and BH3 among the kale accessions, BR5 among the broccoli ones, CCP4 among the cross-composite populations, and CV3 and CV4 among the cauliflower accessions which were considered (Table 3). On the whole, this suggests that tolerance to water stress requires different morphological and biochemical characteristics and may reflect different underling stress tolerance mechanisms.
The GLSs amount and profile is influenced by the genotypes, environmental growth conditions, the growing methods, and the plant organs considered. The GLSs amount in plant organs depends on several environmental and developmental factors. The data registered in our study confirm the increment of the total GLSs amount in relation to drought stress, both in the leaves and in the roots analyzed, as reported by several authors [43,44,45]. In this study, ten glucosinolates were detected in the leaves and in the roots of the B. oleracea accessions considered, including six aliphatic, two indoles, and two aromatics GLSs. The set of plants analyzed showed a significant interaction of IR x GE both for the total amount and profile of GLSs (Tables S1–S5). The GLSs content was twice as high for the plants grown in the NIR plot than in the IRR plot (Tables S1–S5). We can say that drought stress increases the metabolism for GLSs biosynthesis and for its accumulation in different organs of the plant; this as a consequence of the plant’s response to drought conditions through the process of osmotic adjustment, as confirmed by Schreiner et al. (2009) [46]. However, in the study by Khan et al. (2010) [47], the waterlogged plants had the highest levels of GLSs, whereas the plants under drought stress had the lowest levels. The genotypes can influence the GLSs patterns, and the accessions of the same varietal group can show significant differences for both the GLSs total amount and profile in relation to the genotype and to the environmental conditions [48,49]. Individual GLSs detected in this study varied between water stress treatments. The variation between the aliphatic and indolyl GLSs concentrations in the well-watered and drought-stressed plants was significant (about two-fold). Therefore, the majority of indolic GLSs, particularly indol-3-yl-methyl glucosinolate (I3M), 4-methoxyindol-3-ylmethyl glucosinolate (4MOI3M), and 1-methoxyindol-3-ylmethyl (1MOI3M), accumulated in plants cultivated in waterlogged circumstances and experienced a considerable reduction in the drought stress treatment; Wiesner et al. (2013) [50]. López-Berenguer et al. (2008) [51] observed a significant increment in the GLSs in broccoli plants in response to salt stress.
The selected accessions showed a limited variation in the morphometric traits in relation to drought stress, evidenced by a high and significant increment in the amount of the indolic glucosinolate GBS (for BH1, BH2, BH3, CCP4, and CV3) and NGBS (for the accessions BR5 and CV4). As GBS is related to NGBS, the conversion between them seems evident [52]. Hornbacher 2022 [53] reported on the importance of glucobrassicin for mitigating water stress, and he suggested the glucobrassicin could represent a source of auxin for Arabidopsis thaliana grown in drought conditions. According to our study, in the kale accessions, the most abundant glucosinolates were sinigrin, glucobrassicanapin, and glucobrassicin (Figure 1). Similarly, Kushad et al. (1999) [54] reported a high sinigrin (10.4 µmol. g−1 d.w.) and a low glucobrassicin amount (1.2 µmol. g−1 d.w.), but only a very small amount of glucoraphanin. However, in the same study, the broccoli accessions showed significant differences in the indole glucosinolates content, and the glucobrassicin appeared to be the most abundant indole glucosinolate for broccoli cvs analyzed, which contradicts our study where the aliphatic glucosinolate are predominant. Based on our chemotypes detected, there is not a specific glucosinolate related to the resistance to water stress, but the accumulation of NGBS may have a link to the resistance to water stress. Thus, the differences in glucosinolates between accessions could mean that the glucosinolates pathway is regulated differently depending on the crop and the expression of the genes involved. The inhibition of one class of glucosinolates resulted in a compensatory increase in another class. Some GLSs showed strongly positive correlations with each other because all these GLSs are carbon aliphatic GLSs and follow quite similar biosynthetic pathways (Table 4). A positive correlation can be based on shared biosynthetic pathways or common regulation factors. A negative correlation, on the other hand, indicates chemical trade-offs, as shown in the correlation analysis [55]. Several authors [30,56] have studied the variation between the GLSs concentration in roots and leaves, indicating the lack of correlation between the above cited organs. According to our results, the total amount was much higher in the leaves compared to the roots.. Regarding the concentration of GLSs in roots, we found that the total amount in the control condition was similar to the values reported by Li et al. (2021) [57]. A significant increase (41.4%) was observed under water stress conditions. According to the recently published work of Huang et al. (2022) [58], the total glucosinolates content of roots showed a decreased trend initially and then increased during development, which reached the maximum in the pod-setting stage. However, the result in the leaves was opposite to that of the roots. In the leaves, the total glucosinolates content increased at first and then decreased in the mustard’ life cycle, which reached the maximum at the bolting stage.
To better visualize the relationship between plant organs and GLSs accumulation, a principal component analysis (PCA) of the GLSs data was performed (Figure 2). The results highlight the characteristics of glucosinolates in different organs, and it was concluded that the aliphatic glucosinolates were predominant in the leaves of Brassica, while the roots were correlated more with indolic and aromatic glucosinolate. Our result may be confirmed by the findings of Huseby et al. (2013) [59], in which the aliphatic and indolic MYB factors have been shown to be regulated differentially in Arabidopsis plants by the light cycling. This result was consistent with the correlation analysis of glucosinolates, providing a new insight into glucosinolate compounds in different organs and genotypes.
Based on the chemotypes detected, there is not a specific glucosinolate related to the resistance to water stress, but there is a wide range of glucosinolate levels and profiles that change depending on the genotype. The capacity to biosynthesize the glucosinolates has been used as a taxonomic indicator to support classification systems based on crop evolution [60].
Different breeding and selection procedures have been successfully performed for the GLSs content for different B. oleracea crops; for example, marrow stem kale was successfully improved by a low content in indole GLSs using a full-sib family selection program [61,62]. On the other hand, a divergent mass selection has been used as a useful tool in plant breeding to generate varietal groups within each of the B. oleracea crops that share the same genetic background but with very variable GLSs amounts and profiles in the different organs of the plant. The perception that the B. oleracea products represent healthy food has increased in recent decades. Greater requests for these products in local and national markets in all EU countries requires additional accurate information on the best cultivars to use as well as the establishment of new cultivars with a high yield, are stress tolerant, and have a high nutritional value.

5. Conclusions

The results obtained showed a great variation in the main plant morphometric traits and the amount and profile of the GLSs in relation to both the drought conditions and the genotypes utilized. For all the variations obtained, we observed a highly significant interaction among the two experimental factors studied, and for that we have identified elite genetic materials to use for the organic breeding of B. oleracea crops. Among the accessions analyzed, we have individuated the kales BH1, BH2, and BH3, broccoli BR5, the cauliflowers CV3 and CV4, and finally the CCPP4. The accessions showed a low variation index for several of the morphometric traits observed. The prevalent presence of high amounts of GLSs in the leaves in comparison to the roots is of great interest for all the B. oleracea crops providing leaves as products, such as kale and sprouting broccoli. The GLSs value increased significantly as a consequence of drought conditions in accordance with the findings of previous studies, highlighting the importance of GLSs to increase the antioxidant status of the plant for controlling water stress. These results could be used to identify different accessions which could be utilized for a future breeding program aimed at creating genetic diversity in the local Brassica germplasm with a high value of a specific glucosinolate. Further research using a genomic and transcriptomic approach targeting some candidate genes is needed to confirm this finding.

Supplementary Materials

The following supporting information can be downloaded at: https://www.mdpi.com/article/10.3390/agronomy13020579/s1, Figure S1: High performance liquid chromatography (HPLC) chromatograms of desulfo-GSLs standards; Table S1. Variation in the aliphatic glucosinolates content (μmol g−1 d.w.) in roots in relation to the two experimental factors studied. Table S2. Variation in the indolic and aromatic glucosinolates content (μmol g−1 d.w.) in roots in relation to the two experimental factors studied. Table S3. Variation in three aliphatic glucosinolates content (μmol g−1 d.w.) in leaves in relation to the two experimental factors studied. Table S4. Variation in other aliphatic glucosinolates content (μmol g−1 d.w.) in leaves in relation to the two experimental factors studied. Table S5. Variation in the indolic and aromatic glucosinolates content (μmol g−1 d.w.) in leaves in relation to the two experimental factors studied.

Author Contributions

Conceptualization: F.B., R.L.S. and S.M.; methodology: F.B., R.L.S. and H.B.A.; software: H.B.A., D.A. and S.T.; validation: F.B., R.L.S., N.F. and S.M.; formal analysis: F.B., R.L.S., D.A. and H.B.A.; investigation: H.B.A., N.F., M.C.D.B., S.T. and D.A.; resources, F.B.; data curation: M.C.D.B., D.A. and H.B.A.; writing—original draft preparation: F.B., D.A. and H.B.A.; writing—review and editing: F.B., R.L.S., H.B.A., S.M. and D.A.; visualization, F.B.; supervision: F.B.; project administration: F.B.; funding acquisition: F.B. All authors have read and agreed to the published version of the manuscript.

Funding

This research was supported by the project BRESOV (Breeding for Resilient. Efficient and Sustainable Organic Vegetable production) funded by EU H2020 Program SFS-07-2017. Grant Agreement n. 774244.

Conflicts of Interest

The authors declare no conflict of interest.

References

  1. Parkash, V.; Singh, S. A review on potential plant-based water stress indicators for vegetable crops. Sustainability 2020, 12, 3945. [Google Scholar] [CrossRef]
  2. Yang, X.; Lu, M.; Wang, Y.; Wang, Y.; Liu, Z.; Chen, S. Response Mechanism of Plants to Drought Stress. Horticulturae 2021, 7, 50. [Google Scholar] [CrossRef]
  3. Bellard, C.; Bertelsmeier, C.; Leadley, P.; Thuiller, W.; Courchamp, F. Impacts of climate change on the future of biodiversity. Ecology 2012, 15, 365–377. [Google Scholar] [CrossRef] [PubMed] [Green Version]
  4. Zittis, G.; Almazroui, M.; Alpert, P.; Ciais, P.; Cramer, W.; Dahdal, Y.; Fnais, M.; Francis, D.; Hadjinicolaou, P.; Howari, F.; et al. Climate change and weather extremes in the Eastern Mediterranean and Middle East. Rev. Geophys. 2022, 60, e2021RG000762. [Google Scholar] [CrossRef]
  5. Ferreira, C.S.S.; Seifollahi-Aghmiuni, S.; Destouni, G.; Ghajarnia, N.; Kalantari, Z. Soil degradation in the European Mediterranean region: Processes, status and consequences. Sci. Total Environ. 2022, 805, 150106. [Google Scholar] [CrossRef]
  6. Branca, F.; Chiarenza, G.L.; Cavallaro, C.; Gu, H.; Zhao, Z.; Tribulato, A. Diversity of Sicilian broccoli (Brassica oleracea var. italica) and cauliflower (Brassica oleracea var. botrytis) landraces and their distinctive bio-morphological, antioxidant, and genetic traits. Genet. Resour. Crop. Evol. 2018, 65, 485–502. [Google Scholar] [CrossRef]
  7. Ben Ammar, H.; Picchi, V.; Arena, D.; Treccarichi, S.; Bianchi, G.; Lo Scalzo, R.; Marghali, S.; Branca, F. Variation of Bio-Morphometric Traits and Antioxidant Compounds of Brassica oleracea L. Accessions in Relation to Drought Stress. Agronomy 2022, 12, 2016. [Google Scholar] [CrossRef]
  8. Ullah, F.; Bano, A.; Nosheen, A. Effects of plant growth regulators on growth and oil quality of canola (Brassica napus L.) under drought stress. Pak. J. Bot. 2012, 44, 1873–1880. [Google Scholar]
  9. HongBo, S.; ZongSuo, L.; MingAn, S. Changes of anti-oxidative enzymes and MDA content under soil water deficits among 10 wheat (Triticum aestivum L.) genotypes at maturation stage. Colloids Surf. B Biointerfaces 2005, 45, 7–13. [Google Scholar] [CrossRef]
  10. Siddiqui, M.H.; Al-Khaishany, M.Y.; Al-Qutami, M.A.; Al-Whaibi, M.H.; Grover, A.; Ali, H.M.; Al-Wahibi, M.S.; Bukhari, N.A. Response of different genotypes of faba bean plant to drought stress. Int. J. Mol. Sci. 2015, 16, 10214–10227. [Google Scholar] [CrossRef] [Green Version]
  11. Yildirim, E.; Ekinci, M.; Turan, M. Impact of biochar in mitigating the negative effect of drought stress on cabbage seedlings. J. Soil Sci. Plant Nutr. 2021, 21, 2297–2309. [Google Scholar] [CrossRef]
  12. Nemeskéri, E.; Helyes, L. Physiological responses of selected vegetable crop species to water stress. Agronomy 2019, 9, 447. [Google Scholar] [CrossRef] [Green Version]
  13. Latif, M.; Akram, N.A.; Ashraf, M. Regulation of some biochemical attributes in drought-stressed cauliflower (Brassica oleracea L.) by seed pre-treatment with ascorbic acid. J. Hortic. Sci. Biotechnol. 2016, 91, 129–137. [Google Scholar] [CrossRef]
  14. La, V.H.; Lee, B.R.; Zhang, Q.; Park, S.H.; Islam, M.; Kim, T.H. Salicylic acid improves drought-stress tolerance by regulating the redox status and proline metabolism in Brassica rapa. Hortic. Environ. Biotechnol. 2019, 60, 31–40. [Google Scholar] [CrossRef]
  15. Miękus, N.; Marszałek, K.; Podlacha, M.; Iqbal, A.; Puchalski, C.; Świergiel, A.H. Health Benefits of Plant-Derived Sulfur Compounds, Glucosinolates, and Organosulfur Compounds. Molecules 2020, 25, 3804. [Google Scholar] [CrossRef]
  16. Vik, D.; Mitarai, N.; Wulff, N.; Halkier, B.A.; Burow, M. Dynamic modeling of indole glucosinolate hydrolysis and its impact on auxin signaling. Front. Plant Sci. 2018, 9, 550. [Google Scholar] [CrossRef] [Green Version]
  17. Jensen, L.M.; Jepsen, H.K.S.; Halkier, B.A.; Kliebenstein, D.J.; Burow, M. Natural variation in cross-talk between glucosinolates and onset of flowering in Arabidopsis. Front. Plant Sci. 2015, 6, 697. [Google Scholar] [CrossRef] [Green Version]
  18. Hossain, M.S.; Ye, W.; Hossain, M.A.; Okuma, E.; Uraji, M.; Nakamura, Y.; Mori, I.; Murata, Y. Glucosinolate degradation products, isothiocyanates, nitriles, and thiocyanates, induce stomatal closure accompanied by peroxidase-mediated reactive oxygen species production in Arabidopsis thaliana. Biosci. Biotechnol. Biochem. 2013, 77, 120928–120983. [Google Scholar] [CrossRef] [Green Version]
  19. Martínez-Ballesta, M.; Moreno-Fernández, D.A.; Castejón, D.; Ochando, C.; Morandini, P.A.; Carvajal, M. The impact of the absence of aliphatic glucosinolates on water transport under salt stress in Arabidopsis thaliana. Front. Plant Sci. 2015, 6, 524. [Google Scholar] [CrossRef] [Green Version]
  20. Martínez-Ballesta, M.d.C.; Muries, B.; Moreno, D.Á.; Dominguez-Perles, R.; García-Viguera, C.; Carvajal, M. Involvement of a glucosinolate (sinigrin) in the regulation of water transport in Brassica oleracea grown under salt stress. Physiol. Plantarum. 2014, 150, 145–160. [Google Scholar] [CrossRef]
  21. Variyar, P.S.; Banerjee, A.; Akkarakaran, J.J.; Suprasanna, P. Role of Glucosinolates in Plant Stress Tolerance. Emerging Technologies and Management of Crop Stress Tolerance. Acad. Press 2014, 1, 271–291. [Google Scholar] [CrossRef]
  22. Augustine, R.; Bisht, N. Biofortification of oilseed Brassica juncea with the anti-cancer compound glucoraphanin by suppressing GSL-ALK gene family. Sci. Rep. 2016, 5, 18005. [Google Scholar] [CrossRef] [PubMed] [Green Version]
  23. Wei, L.; Liu, C.; Zheng, H.; Zheng, L. Melatonin treatment affects the glucoraphanin-sulforaphane system in postharvest fresh-cut broccoli (Brassica oleracea L.). Food Chem. 2020, 307, 125562. [Google Scholar] [CrossRef] [PubMed]
  24. Zang, Y.X.; Kim, H.U.; Kim, J.A.; Lim, M.H.; Jin, M.; Lee, S.C.; Hong, J.K.; Park, B.S. Genome-wide identification of glucosinolate synthesis genes in Brassica rapa. FEBS J. 2009, 276, 3559–3574. [Google Scholar] [CrossRef]
  25. Franzke, A.; Lysak, M.A.; Al-Shehbaz, I.A.; Koch, M.A.; Mummenhoff, K. Cabbage family affairs: The evolutionary history of Brassicaceae. Trends Plant Sci. 2011, 16, 108–116. [Google Scholar] [CrossRef]
  26. Francisco, M.; Joseph, B.; Caligagan, H.; Li, B.; Corwin, J.A.; Lin, C.; Kerwin, R.; Burow, M.; Kliebenstein, D.J. The defense metabolite, allyl glucosinolate, modulates Arabidopsis thaliana biomass dependent upon the endogenous glucosinolate pathway. Front. Plant Sci. 2016, 7, 774. [Google Scholar] [CrossRef] [Green Version]
  27. Chhajed, S.; Mostafa, I.; He, Y.; Abou-Hashem, M.; El-Domiaty, M.; Chen, S. Glucosinolate Biosynthesis and the Glucosinolate–MyrosiGSTe System in Plant Defense. Agronomy 2020, 10, 1786. [Google Scholar] [CrossRef]
  28. Ishida, M.; Hara, M.; Fukino, N.; Kakizaki, T.; Morimitsu, Y. Glucosinolate metabolism, functionality and breeding for the improvement of Brassicaceae vegetables. Breed. Sci. 2014, 64, 48–59. [Google Scholar] [CrossRef] [Green Version]
  29. Gu, Z.; Guo, Q.; Gu, Y. Factors Influencing Glucoraphanin and Sulforaphane Formation in Brassica Plants: A Review. J. Integr. Agric. 2012, 11, 1804–1816. [Google Scholar] [CrossRef]
  30. Van Dam, N.M.; Tytgat, T.O.G.; Kirkegaard, J.A. Root and shoot glucosinolates: A comparison of their diversity, function and interactions in natural and managed ecosystems. Phytochem. Rev. 2009, 8, 171–186. [Google Scholar] [CrossRef] [Green Version]
  31. Rios, J.J.; Agudelo, A.; Moreno, D.A.; Carvajal, M. Growing broccoli under salinity: The influence of cultivar and season on glucosinolates content. Scientia Agricola. 2020, 77. [Google Scholar] [CrossRef] [Green Version]
  32. Chorol, S.; Angchok, D.; Stobdan, T. Irrigation timing as a glucosinolate alteration factor in radish (Raphanus sativus L.) (Gya Labuk and Tsentay Labuk) in the Indian Trans-Himalayan region of Ladakh. J. Food Compos. Anal. 2021, 100, 103904. [Google Scholar] [CrossRef]
  33. Di Gioia, F.; Rosskopf, E.N.; Leonardi, C.; Giuffrida, F. Effects of application timing of saline irrigation water on broccoli production and quality. Agric. Water Manag. 2018, 203, 97–104. [Google Scholar] [CrossRef]
  34. Velasco, P.; Cartea, M.E.; González, C.; Vilar, M.; Ordás, A. Factors Affecting the Glucosinolate Content of Kale (Brassica oleracea acephala Group). J. Agric. Food Chem. 2007, 55, 955–962. [Google Scholar] [CrossRef]
  35. Ciska, E.; Martyniak-Przybyszewska, B.; Kozlowska, H. Content of glucosinolates in cruciferous vegetables grown at the same site for two years under different climatic conditions. J. Agric. Food Chem. 2000, 48, 2862–2867. [Google Scholar] [CrossRef] [PubMed]
  36. Engelen-Eigles, G.; Holden, G.; Cohen, J.D.; Gardner, G. The Effect of Temperature, Photoperiod, and Light Quality on Gluconasturtiin Concentration in Watercress (gluconasturtium officinale R. Br.). J. Agric. Food Chem. 2006, 54, 328–334. [Google Scholar] [CrossRef] [PubMed]
  37. ISO 9167-1:1992; Rapeseed-Determination of Glucosinolates Content-Part 1: Method Using High-Performance Liquid Chromatography. International Standard Organization: Geneva, Switzerland, 1992; Volume 9167, pp. 1–9.
  38. Aires, A.; Carvalho, R. Rapid separation of indole glucosinolates in roots of Chinese cabbage (Brassica rapa Subsp. Pekinensis) by high-performance liquid chromatography with diode array detection. Int. J. Anal. Chem. 2017, 2017, 5125329. [Google Scholar] [CrossRef] [Green Version]
  39. Oguz, M.C.; Aycan, M.; Oguz, E.; Poyraz, I.; Yildiz, M. Drought Stress Tolerance in Plants: Interplay of Molecular, Biochemical and Physiological Responses in Important Development Stages. Physiologia 2022, 2, 180–197. [Google Scholar] [CrossRef]
  40. Seleiman, M.F.; Al-Suhaibani, N.; Ali, N.; Akmal, M.; Alotaibi, M.; Refay, Y.; Dindaroglu, T.; Abdul-Wajid, H.H.; Battaglia, M.L. Drought Stress Impacts on Plants and Different Approaches to Alleviate Its Adverse Effects. Plants 2021, 10, 259. [Google Scholar] [CrossRef]
  41. Issarakraisila, M.; Ma, Q.; Turner, D.W. Photosynthetic and growth responses of juvenile Chinese kale (Brassica oleracea var. alboglabra) and Caisin (Brassica rapa subsp. parachinensis) to waterlogging and water deficit. Sci. Hortic. 2007, 111, 107–113. [Google Scholar] [CrossRef]
  42. Souza, A.P.; da Silva, A.C.; Tanaka, A.A.; de Souza, M.E.; Pizzatto, M.; Felipe, R.T.A.; Martim, C.C.; Ferneda, B.G.; da Silva, S.G. Yield and water use efficiency of cauliflower under irrigation different levels in tropical climate. Afr. J. Agric. Res. 2018, 13, 1621–1632. [Google Scholar]
  43. Rosa, E.A.; Heaney, C.A.M.; Portas, C.A.; Fenwick, G.R. Changes in glucosinolate concentrations in Brassica crops (B. oleracea and B. napus) throughout growing seasons. J. Sci. Food Agr. 1996, 71, 237–244. [Google Scholar] [CrossRef]
  44. Rosa, E.A.S. Daily variation in glucosinolate concentrations in the leaves and roots of cabbage seedlings in two constant temperature regimes. J. Sci. Food Agr. 1997, 73, 364–368. [Google Scholar] [CrossRef]
  45. Rosa, E.A.S.; Heaney, R.K.; Fenwick, G.R.; Portas, C. Glucosinolates in crop plants. Hort. Rev. 1997, 19, 99–215. [Google Scholar]
  46. Schreiner, M.; Beyene, B.; Krumbein, A.; Stutzel, H. Ontogenetic changes of 2-propenyl and 3-indolylmethyl glucosinolates in Brassica carinata leaves as affected by water supply. J. Agric. Food Chem. 2009, 57, 7259–7726. [Google Scholar] [CrossRef]
  47. Khan, M.A.M.; Ulrichs, C.; Mewis, I. Influence of water stress on the glucosinolate profile of Brassica oleracea var. italica and the performance of Brevicoryne brassicae and Myzus persicae. Entomol. Exp. Appl. 2010, 137, 229–236. [Google Scholar] [CrossRef]
  48. Di Bella, M.C.; Toscano, S.; Arena, D.; Moreno, D.A.; Romano, D.; Branca, F. Effects of growing cycle and genotype on the morphometric properties and glucosinolates amount and profile of sprouts, microgreens, and baby leaves of broccoli (Brassica oleracea L. varr. italica Plenck) and Kale (B. oleracea L. var. acephala DC.). Agronomy 2021, 11, 1685. [Google Scholar] [CrossRef]
  49. Cartea, M.E.; Di Bella, M.C.; Velasco, P.; Soengas, P.; Toscano, S.; Branca, F. Evaluation of Italian and Spanish Accessions of Brassica rapa L.: Effect of flowering earliness on fresh yield and biological value. Agronomy 2020, 11, 29. [Google Scholar] [CrossRef]
  50. Wiesner, M.; Hanschen, F.; Schreiner, M.; Glatt, H.; Zrenner, R. Induced Production of 1-Methoxy-indol-3-ylmethyl Glucosinolate by Jasmonic Acid and Methyl Jasmonate in Sprouts and Leaves of Pak Choi (Brassica rapa ssp. chinensis). Int. J. Mol. Sci. 2013, 14, 14996–15016. [Google Scholar] [CrossRef] [Green Version]
  51. López-Berenguer, C.; Martínez-Ballesta, M.C.; García-Viguera, C.; Carvajal, M. Leaf water balance mediated by aquaporins under salt stress and associated glucosinolate synthesis in broccoli. Plant Sci. 2008, 174, 321–328. [Google Scholar] [CrossRef]
  52. Pfalz, M.; Mikkelsen, M.D.; Bednarek, P.; Olsen, C.E.; Halkier, B.A.; Kroymann, J. Metabolic engineering in Nicotiana benthamiana reveals key enzyme functions in Arabidopsis indole glucosinolate modification. Plant Cell 2011, 23, 716–729. [Google Scholar] [CrossRef] [Green Version]
  53. Hornbacher, J.; Horst-Niessen, I.; Herrfurth, C.; Feussner, I.; Papenbrock, J. First experimental evidence suggests use of glucobrassicin as source of auxin in drought-stressed Arabidopsis thaliana. Front. Plant Sci. 2022, 13, 1025969. [Google Scholar] [CrossRef] [PubMed]
  54. Kushad, M.M.; Brown, A.F.; Kurilich, A.C.; Juvik, J.A.; Klein, B.P.; Wallig, M.A.; Jeffery, E.H. Variation of Glucosinolates in Vegetable Crops of Brassica oleracea. J. Agric. Food Chem. 1999, 47, 1541–1548. [Google Scholar] [CrossRef] [PubMed]
  55. Schiestl, F.P. Correlation analyses between volatiles and glucosinolates show no evidence for chemical defense signaling in Brassica rapa. Front. Ecol. Evol. 2014, 2, 1–10. [Google Scholar] [CrossRef] [Green Version]
  56. Malik, M.S.; Riley, M.B.; Norsworthy, J.K.; Bridges, W., Jr. Glucosinolate profile variation of growth stages of wild radish (Raphanus raphanistrum). J. Agric. Food Chem. 2010, 58, 3309–3315. [Google Scholar] [CrossRef] [PubMed]
  57. Li, Z.; Zheng, S.; Liu, Y.; Fang, Z.; Yang, L.; Zhuang, M.; Zhang, Y.; Lv, H.; Wang, Y.; Xu, D. Characterization of glucosinolates in 80 broccoli genotypes and different organs using UHPLC-Triple-TOF-MS method. Food Chem. 2021, 334, 127519–127529. [Google Scholar] [CrossRef] [PubMed]
  58. Huang, X.; Cheng, B.; Wang, Y.; Liu, G.; Hu, L.; Yu, X.; He, H. Effects of Fresh-cut and Storage on Glucosinolates Profile Using Broccoli as A Case Study. Hortic. Plant. J. 2022, in press. [Google Scholar] [CrossRef]
  59. Huseby, S.; Koprivova, A.; Lee, B.R.; Saha, S.; Mithen, R.; Wold, A.B.; Bengtsson, G.B.; Kopriva, S. Diurnal and light regulation of sulphur assimilation and glucosinolate biosynthesis in Arabidopsis. J. Exp. Bot. 2013, 64, 1039–1048. [Google Scholar] [CrossRef] [Green Version]
  60. Blažević, I.; Montaut, S.; Burčul, F.; Olsen, C.E.; Burow, M.; Rollin, P.; Agerbirk, N. Glucosinolate structural diversity, identification, chemical synthesis and metabolism in plants. Phytochemistry 2020, 169, 112100. [Google Scholar] [CrossRef]
  61. Treccarichi, S.; BenAmmar, H.; Amari, M.; Calì, R.; Tribulato, A.; Branca, F. Molecular Markers for Detecting Inflorescence Size of Brassica oleracea L. Crops and B. oleracea Complex Species (n = 9) Useful for Breeding of Broccoli (B. oleracea var. italica) and Cauliflower (B. oleracea var. botrytis). Plants 2023, 12, 407. [Google Scholar] [CrossRef]
  62. Treccarichi, S.; Di Gaetano, C.; Di Stefano, F.; Gasparini, M.; Branca, F. Using Simple Sequence Repeats in 9 Brassica Complex Species to Assess Hypertrophic Curd Induction. Agriculture 2021, 11, 622. [Google Scholar] [CrossRef]
Figure 1. Chemotaxonomy of different glucosinolates found in the tested accessions in relation to water stress, grouping them by varieties (roots and leaves).
Agronomy 13 00579 g001
Figure 2. Two-dimensional principal component analysis (2D-PCA) of glucosinolates profile in leaves and roots. The first two principal component (PC) axes are labelled as PC1 and PC2, with the corresponding proportion of total variance in parentheses. SL: stressed leaves; CL: control leaves; SR: stressed roots; CR: control roots; different colors indicate various collard tissues (leaves in green and roots in brown). Kale (BH1, BH2, BH3); broccoli (BR1, BR2, BR3, BR4, BR5); cauliflower (CV1, CV2, CV3, CV4, CV5); composite cross population (CCP1, CCP2, CCP3, CCP4).
Agronomy 13 00579 g002
Table 1. Morphological and biochemical descriptors and their corresponding units.
CodeDescriptors
PWPlant weight (g)
PHPlant height (cm)
SDStem diameter (mm)
NLNumber of leaves (n)
SPADSPAD (0–99.9)
RWRoot weight (g)
MRLMain root length (cm)
SINSingrin (µmol. g−1 d.w.)
GRAGlucoraphanin (µmol. g−1 d.w.)
GNAGluconapin (µmol. g−1 d.w.)
GERGlucoerucin (µmol. g−1 d.w.)
GBNGlucobrassicanapin (µmol. g−1 d.w.)
GALGlucoalyssin (µmol. g−1 d.w.)
GBSGlucobrassicin (µmol. g−1 d.w.)
NGBSNeoglucobrassicin (µmol. g−1 d.w.)
SIBSinalbin (µmol. g−1 d.w.)
GSTGluconastrutiin (µmol. g−1 d.w.)
GLSTTotal GLSs amount (µmol. g−1 d.w.)
Table 2. Variation in the plant weight (PW), height (PH), stem diameter (SD), number of leaves (NL), leaves SPAD index, and the variation index (VI) in relation to the experimental factors studied.
GenotypePW (g)PH (cm)SD (mm)NL (n)SPAD (0 to 99.9)
IRRNIRVIMeanIRRNIRVIMeanIRRNIRVIMeanIRRNIRVIMeanIRRNIRVIMean
BH 1300.0 ± 2.0211.0 ± 1.0−29.7255.5 ± 1.569.0 ± 1.026.8 ± 0.6−61.247.9 ± 0.82.9 ± 0.02.3 ± 0.1−20.72.6 ± 0.18.0 ± 1.07.0 ± 1.0−12.57.5 ± 1.059.9 ± 0.348.4 ± 3.9−19.254.2 ± 2.1
BH 2165.0 ± 13.0145.5 ± 3.5−11.8155.3 ± 8.369.8 ± 1.830.9 ± 0.7−55.750.4 ± 1.33.8 ± 0.12.5 ± 0.2−34.23.2 ± 0.29.0 ± 1.06.0 ± 1.0−33.37.5 ± 1.049.1 ± 3.835.1 ± 3.4−28.542.1 ± 3.6
BH 3304.5 ± 55.5279.0 ± 31.0−8.4291.8 ± 43.364.0 ± 1.035.6 ± 0.8−44.449.8 ± 0.94.1 ± 0.02.4 ± 0.3−41.53.3 ± 0.28.0 ± 1.08.0 ± 1.00.08.0 ± 1.060.1 ± 0.757.4 ± 2−4.558.8 ± 1.4
BR 1472.5 ± 38.5192.0 ± 50.0−59.4332.3 ± 44.345.5 ± 6.531.1 ± 8.1−31.638.3 ± 7.35.1 ± 0.31.3 ± 0.4−74.53.2 ± 0.47.0 ± 1.05.0 ± 1.0−28.66.0 ± 1.055.1 ± 0.145.7 ± 6.1−17.150.4 ± 3.1
BR 2369.0 ± 19.0199.0 ± 23.0−46.1284.0 ± 21.042.5 ± 3.539.9 ± 1.7−6.141.2 ± 2.64.2 ± 0.62.1 ± 1.1−50.03.2 ± 0.910.0 ± 2.04.0 ± 1.0−60.07.0 ± 1.557.6 ± 254.9 ± 2.3−4.756.3 ± 2.2
BR 3535.0 ± 15.0212.0 ± 46.0−60.4373.5 ± 30.542.5 ± 1.533.6 ± 6.2−20.938.1 ± 3.93.3 ± 0.22.4 ± 0.1−27.32.9 ± 0.212.0 ± 0.08.0 ± 2.0−33.310.0 ± 1.061.4 ± 0.446.4 ± 5−24.453.9 ± 2.7
BR 4508.0 ± 15.0296.0 ± 16.0−41.7402.0 ± 15.549.1 ± 2.135.8 ± 4.4−27.142.5 ± 3.34.7 ± 0.01.7 ± 0.3−63.83.2 ± 0.213.0 ± 2.05.0 ± 1.0−61.59.0 ± 1.556.4 ± 0.539.5 ± 0.6−30.048.0 ± 0.6
BR 5382.0 ± 42.0288.0 ± 76.0−24.6335.0 ± 59.058.3 ± 3.345.8 ± 2.8−21.452.1 ± 3.13.4 ± 0.02.4 ± 0.1−29.42.9 ± 0.19.0 ± 1.07.0 ± 1.0−22.28.0 ± 1.050.6 ± 947.4 ± 0.7−6.349.0 ± 4.9
CCP 1426.0 ± 76.0170.0 ± 60.0−60.1298.0 ± 68.050.8 ± 1.835.5 ± 11.5−30.143.2 ± 6.74.5 ± 0.61.9 ± 0.0−57.83.2 ± 0.38.0 ± 1.05.0 ± 2.0−37.56.5 ± 1.555.4 ± 5.548.2 ± 1.6−13.051.8 ± 3.6
CCP 2452.0 ± 48.0138.0 ± 44.0−69.5295.0 ± 46.048.5 ± 7.524.2 ± 2.2−50.136.4 ± 4.94.9 ± 0.12.8 ± 0.1−42.93.9 ± 0.111.0 ± 0.04.0 ± 0.0−63.67.5 ± 0.054.6 ± 0.954.6 ± 0.90.054.6 ± 0.9
CCP 3300.0 ± 42.0172.0 ± 8.0−42.7236.0 ± 25.036.5 ± 4.020.9 ± 1.5−42.728.7 ± 2.84.8 ± 0.82.7 ± 0.5−43.83.8 ± 0.710.0 ± 0.05.0 ± 1.0−50.07.5 ± 0.562.1 ± 2.351.1 ± 2.7−17.756.6 ± 2.5
CCP 4192.0 ± 32.0255.5 ± 1.533.1223.8 ± 16.837.0 ± 1.034.6 ± 1.2−6.535.8 ± 1.14.2 ± 0.51.3 ± 0.1−69.02.8 ± 0.37.0 ± 1.05.0 ± 1.0−28.66.0 ± 1.047.2 ± 1.646.8 ± 1.6−0.847 ± 1.6
CV 1413.0 ± 83.0112.0 ± 4.0−72.9262.5 ± 43.547.5 ± 8.526.2 ± 4.0−44.836.9 ± 6.33.5 ± 0.41.7 ± 0.1−51.42.6 ± 0.310.0 ± 1.06.0 ± 1.0−40.08.0 ± 1.056.9 ± 6.044.0 ± 0.5−22.750.5 ± 3.3
CV 2289.0 ± 48.0177.0 ± 59.0−38.8233.0 ± 53.526.0 ± 3.013.7 ± 0.7−47.319.9 ± 1.94.0 ± 0.82.2 ± 0.1−45.03.1 ± 0.511.0 ± 3.05.0 ± 1.0−54.58.0 ± 2.057.5 ± 1.944.8 ± 0.2−22.151.2 ± 1.1
CV 3333.0 ± 45.0362.5 ± 17.58.9347.8 ± 31.338.0 ± 6.016.8 ± 5.3−55.827.4 ± 5.74.4 ± 0.41.7 ± 0.1−61.43.1 ± 0.315.0 ± 3.05.0 ± 2.0−66.710.0 ± 2.550.9 ± 3.841.7 ± 2.8−18.146.3 ± 3.3
CV 4401.0 ± 49.0306.5 ± 18.2−23.6353.9 ± 33.644.5 ± 3.527.6 ± 9.6−38.036.1 ± 6.64.5 ± 1.22.4 ± 0.5−46.73.5 ± 0.96.0 ± 0.06.0 ± 2.00.06.0 ± 1.060.8 ± 3.951.7 ± 5.2−15.056.3 ± 4.6
CV 5525.5 ± 99.5231.0 ± 45.0−56.0378.3 ± 72.334.0 ± 2.016.6 ± 1.4−51.225.3 ± 1.74.2 ± 0.52.0 ± 0.4−52.43.1 ± 0.513.0 ± 0.06.0 ± 2.0−53.89.5 ± 1.062.8 ± 5.343.1 ± 4.6−31.453.0 ± 5.0
Mean380.0 ± 102.4214.9 ± 64.5 47.3 ± 12.229.1 ± 8.8 4.1 ± 0.62.1 ± 0.4 9.8 ± 2.55.7 ± 1.2 56.4 ± 4.747.1 ± 5.7
Significancy of the differences by ANOVA Student–Newman–Keuls
IR**********
GE**************
IR × GE***************
*, **, and*** indicate respectively that the effect is not significant or significant at p < 0.05, p < 0.01, and p < 0.001, respectively.
Table 3. Variation in root weight (RW), main root length (MRL), and the variation index (VI) in relation to the experimental factors studied.
GenotypeRW (g)MRL (cm)
IRRNIRVIMeanIRRNIRVIMean
BH 143.6 ± 7.425.1 ± 3.2−42.434.3 ± 5.318.6 ± 1.96.0 ± 0.7−67.712.3 ± 1.3
BH 214.2 ± 2.514.1 ± 4.1−0.714.1 ± 3.321.0 ± 2.25.4 ± 1.1−74.313.2 ± 1.7
BH 325.6 ± 7.115.0 ± 3.0−41.420.3 ± 5.116.6 ± 2.52.8 ± 0.5−83.19.7 ± 1.5
BR 139.0 ± 7.428.0 ± 2.0−28.233.5 ± 4.713.6 ± 3.35.0 ± 0.0−63.29.3 ± 1.7
BR 230.6 ± 3.529.0 ± 1.0−5.229.8 ± 2.311.9 ± 1.27.6 ± 1.8−36.19.8 ± 1.5
BR 343.9 ± 5.515.0 ± 5.0−65.829.5 ± 5.312.6 ± 1.05.8 ± 0.5−54.09.2 ± 0.8
BR 441.7 ± 5.213.5 ± 3.2−67.627.6 ± 4.214.7 ± 1.23.4 ± 0.2−76.99.1 ± 0.7
BR 531.6 ± 4.119.0 ± 1.0−39.925.3 ± 2.617.5 ± 1.65.6 ± 0.4−68.011.6 ± 1.0
CCP 135.0 ± 6.016.0 ± 2.0−54.325.5 ± 4.015.2 ± 1.34.5 ± 0.3−70.49.9 ± 0.8
CCP 237.4 ± 7.916.0 ± 8.0−57.226.7 ± 8.014.5 ± 1.94.3 ± 0.3−70.39.4 ± 1.1
CCP 324.9 ± 3.219.0 ± 1.0−23.722.0 ± 2.110.8 ± 0.76.0 ± 0.4−44.48.4 ± 0.6
CCP 416.5 ± 4.216.0 ± 4.0−3.016.3 ± 4.110.9 ± 0.94.1 ± 1.1−62.47.5 ± 1.0
CV 133.9 ± 6.428.0 ± 8.0−17.431.0 ± 7.214.2 ± 4.05.0 ± 0.3−64.89.6 ± 2.2
CV 224.5 ± 11.013.0 ± 3.0−46.918.8 ± 7.07.6 ± 0.15.1 ± 1.3−32.96.35 ± 0.7
CV 327.9 ± 6.524.0 ± 4.0−14.026.0 ± 5.311.3 ± 1.25.5 ± 0.5−51.38.4 ± 0.9
CV 433.3 ± 7.423.0 ± 13.0−30.928.2 ± 10.213.3 ± 1.05.5 ± 0.3−58.69.4 ± 0.7
CV 543.5 ± 12.48.0 ± 0.0−81.625.8 ± 6.210.1 ± 0.64.3 ± 0.4−57.47.2 ± 0.5
Mean32.2 ± 9.118.9 ± 6.2 13.8 ± 3.45.0 ± 1.1
Significance of the differences by ANOVA Student–Newman–Keuls
IRn.s.*
GE******
IR × GE******
ns, * and *** indicate respectively that the effect is not significant or significant at p < 0.05, and p < 0.001, respectively.
Table 4. Variation in the total amount of GLSs (µmol g−1 d.w.) in the roots and leaves in relation to the two experimental factors studied.
RootsLeaves
GenotypesIRRNIRMeanIRRNIRMean
BH 15.1 ± 1.09.7 ± 0.39.7 ± 3.6122.7 ± 3.0126.0 ± 3.7124.4 ± 2.3
BH 211.8 ± 0.638.2 ± 1.638.2 ± 18.739.1 ± 2.582.5 ± 2.460.8 ± 30.7
BH 33.5 ± 0.25.1 ± 0.25.1 ± 1.148.4 ± 5.076.9 ± 1.762.7 ± 20.2
BR 14.7 ± 0.632.2 ± 1.832.2 ± 19.439.8 ± 2.872.7 ± 3.656.3 ± 23.3
BR 24.2 ± 0.06.2 ± 0.06.2 ± 1.4184.3 ± 14.9264.9 ± 4.2224.6 ± 56.9
BR 38.8 ± 1.610.7 ± 0.110.7 ± 1.381.6 ± 3.298.2 ± 0.089.9 ± 11.7
BR 428.9 ± 5.436.1 ± 6.036.1 ± 1291.4 ± 91578.9 ± 33.5435.2 ± 203.3
BR 59.2 ± 1.920.1 ± 1.920.1 ± 7.7222.2 ± 17.9336.7 ± 51.5279.5 ± 80.9
CCP 12.5 ± 0.12.7 ± 0.22.7 ± 0.145.5 ± 1.066.2 ± 2.655.9 ± 14.7
CCP 24.3 ± 0.16.6 ± 0.66.6 ± 1.6103.9 ± 67.3138.7 ± 16.8121.3 ± 24.6
CCP 319.6 ± 7.523.6 ± 5.323.6 ± 2.8115.3 ± 35.9400.1 ± 10.5257.7 ± 201.4
CCP 45.2 ± 0.78.3 ± 2.18.3 ± 2.248.9 ± 0.099.2 ± 4.674.1 ± 35.6
CV 129.0 ± 0.132.1 ± 3.232.1 ± 2.2111.8 ± 23.7411.6 ± 5.1261.7 ± 211.9
CV 24.9 ± 1.118.2 ± 1.218.2 ± 9.466.9 ± 7.278.6 ± 2.972.8 ± 8.3
CV 36.1 ± 0.916.6 ± 2.316.6 ± 7.435.8 ± 0.088.1 ± 0.062.0 ± 36.9
CV 410.9 ± 0.412.8 ± 1.612.8 ± 1.339.02 ± 2.466.9 ± 7.353.0 ± 19.7
CV 514.8 ± 1.115.3 ± 4.415.3 ± 0.4114.6 ± 0.0245.7 ± 0.0180.2 ± 92.7
Mean10.2 ± 8.48.4 ± 11.4 100.6 ± 72.7190.1 ± 156.0
Significancy of the differences by ANOVA Student–Newman–Keuls
IR****
GE****
IR × GE*****
** and *** indicate that the correlation is significant at p < 0.01 and p < 0.001, respectively.
Table 5. Pearson’s correlation coefficients among the individual and total GLSs (detected in the leaves in NIR) and the index of morphometric traits identified in the studied crops.
Correlations
SINGRAGNAGERGBNGALGBSNGBSSIBGSTIWIHISDIRWIRLILISPAD
SIN10.064−0.012−0.2460.071−0.043−0.043−0.478 **0.342 *−0.225−0.0930.483 **0.208−0.151−0.2710.1500.064
GRA 10.180−0.157−0.052−0.149−0.2440.2390.029−0.210−0.275−0.068−0.044−0.3110.283−0.234−0.152
GNA 1−0.223−0.151−0.112−0.125−0.036−0.089−0.199−0.197−0.066−0.307−0.037−0.062−0.014−0.051
GER 1−0.214−0.459 **−0.202−0.279−0.353 *0.503 **−0.325−0.2400.228−0.187−0.208−0.019−0.200
GBN 10.302−0.253−0.2230.394 *0.1340.2040.128−0.0560.460 **0.088−0.0060.215
GAL 10.083−0.0410.2840.0670.3140.224−0.2890.362 *−0.1010.1320.338
GBS 1−0.1270.335−0.1370.347 *−0.0900.0750.144−0.2580.373 *0.230
NGBS 1−0.165−0.2930.089−0.361 *−0.128−0.1880.431*−0.363 *−0.239
SIB 1−0.2110.3210.2150.1180.336−0.1510.2590.449 **
GST 1−0.252−0.115−0.118−0.103−0.170−0.212−0.122
IW 1−0.1460.1420.415 *−0.1360.373 *0.116
IH 1−0.2970.1460.1620.0160.410 *
ISD 1−0.170−0.0640.330−0.050
IRW 10.1840.1050.312
IRL 1−0.434 *−0.064
IL 10.204
ISPAD 1
* and ** indicate that the correlation is significant at p < 0.05 and p < 0.01, respectively. SIN = sinigrin; GRA = glucoraphanin; GNA = gluconapin; GER = glucoerucin; GBN = glucobrassicanapin; GAL = glucoalyssin; GBS = glucobrassicin; NGBS = neoglucobrassicin; SIB = sinalbin; GST = gluconasturtiin; IW = weight index; IH = height index; ISD = index stem diameter; IRW = root weight index; IRL = root length index; IL = index number of leaves; ISPAD = SPAD index.
Disclaimer/Publisher’s Note: The statements, opinions and data contained in all publications are solely those of the individual author(s) and contributor(s) and not of MDPI and/or the editor(s). MDPI and/or the editor(s) disclaim responsibility for any injury to people or property resulting from any ideas, methods, instructions or products referred to in the content.

