Communication

The Current Distribution of Carex alatauensis in the Qinghai–Tibet Plateau Estimated by MaxEnt

1
Agriculture and Animal Husbandry College, Qinghai University, Xining 810016, China
2
Qinghai Academy of Animal Science and Veterinary Medicine, Xining 810018, China
3
Laboratory for Alpine Grassland Ecology in the Three-River-Source Region, Ministry of Education Key, Xining 810016, China
4
Qinghai Provincial Key Laboratory of Adaptive Management on Alpine Grassland, Xining 810016, China
*
Authors to whom correspondence should be addressed.
Agronomy 2023, 13(2), 564; https://doi.org/10.3390/agronomy13020564
Submission received: 16 December 2022 / Revised: 14 February 2023 / Accepted: 14 February 2023 / Published: 16 February 2023
(This article belongs to the Special Issue Grassland and Pasture Ecological Management and Utilization)

Abstract

:
Modeling the current distribution of and predicting suitable habitats for threatened species support the species conservation and restoration planning process. Therefore, the purpose of this study was to model the actual distribution and predict environmentally suitable habitats for Carex alatauensis S.R.Zhang 2015, a locally threatened native grass species on the Qinghai–Tibet Plateau. To realize this objective, based on the geographical samples within the natural distribution of C. alatauensis, the dominant climatic factors in its potential distribution range were analyzed using the maximum entropy (MaxEnt) model. The results showed that the average values of the area under the receiver operating characteristic curve (AUC) of the training data were 0.833 ± 0.044, which indicated that the accuracy of the MaxEnt model was pretty high for modeling potential distribution regions of C. alatauensis. The combined results from the Jackknife test and the presented contribution of environmental variables revealed that the annual precipitation, the growth season precipitation, and the precipitation of the driest month were the key climatic factors that restricted the distribution of C. alatauensis on the Qinghai–Tibet Plateau. It is predicted that the potential distribution area of C. alatauensis on the Qinghai–Tibet Plateau is 1.96 × 10⁶ km2, and the most suitable area is 3.7 × 10⁵ km2, mainly located in the Qilian Mountains, the Himalayas, and the Qingtanggula Mountains.

1. Introduction

The Qinghai–Tibet Plateau is called the third pole, with an average altitude of more than 4000 m and an area of 2.58 million km2, accounting for 27% of China’s land area [1,2,3]. Due to its unique geographical location and climatic conditions, it is considered a sensitive and vulnerable area for biodiversity [4]. The area of alpine meadows with Carex alatauensis S.R.Zhang 2015 as the dominant species is 480,000 km2, accounting for 31% of the total grassland area of the Qinghai–Tibet Plateau and mainly distributed in the southern and eastern regions [5]. Alpine meadows not only provide production materials for the development of animal husbandry in the Qinghai–Tibet Plateau but also play important ecological service functions such as carbon pools, water conservation, climate regulation, and biodiversity protection [6,7,8,9,10,11].
C. alatauensis is a perennial herbaceous plant of the Carex genus with short rhizomes and subterranean shoots in cold mesophiles [12]. It is one of the dominant species in alpine meadows and is widely distributed in the Qinghai–Tibet Plateau. C. alatauensis has the characteristics of being able to adapt to cold and humid environments and having good palatability, high economic value, and resistance to water and soil erosion. It is a forage grass with excellent ecological and economic value in the Qinghai–Tibet Plateau [13]. Due to overuse and climate change, C. alatauensis meadows degenerate to form a “black beach” whereby irreversible changes take place in the structure and function of the ecosystem and the service and restoration functions of the ecosystem are weakened or even lost [14]. The degradation process of the alpine meadow ecosystem on the Qinghai–Tibet Plateau is quite different from that in the arid region due to its unique cold environment and wet characteristics. The phenotype of the small transpiration surface of C. alatauensis indicates the adaptability of this species to the cold and seasonally dry environment and may also be one of the factors for its wide distribution on the Qinghai–Tibet Plateau. The grass mat layer formed by its rhizome in the soil in alpine meadows is the main place for water conservation and carbon sinks [15,16]. Considering the dominant role of C. alatauensis in the alpine meadow ecosystem and the vulnerability of this species to climate change and human activities, this study is of great significance for the protection and management of the alpine meadow ecosystem. Since the alpine meadow area is also the source of major rivers in Asia [17], a better understanding of alpine vegetation distribution will help curb ecological problems.
The climate is closely related to the growth of plants and affects the geographical distribution of plants. Through the development of geographic information and the sharing of global data resources, the joint application of niche models and geographic information systems can accurately calculate the distribution of species and predict the habitat of species. The maximum entropy model (MaxEnt) is currently the most accurate and widely used model for studying species distribution and suitable habitat areas [18,19,20]. C. alatauensis is the dominant species in alpine meadows on the Qinghai–Tibet Plateau, and the analysis of the distribution of C. alatauensis is of great significance for species protection under climate change [21]. In this study, the MaxEnt model was used to predict the distribution area of C. alatauensis in the Qinghai–Tibet Plateau and to explore the relationship between the geographical distribution and the climate in order to clarify the dominant climatic factors affecting the distribution, and to combine the suitable grades for its potential, the geographical distribution range was visualized to provide theoretical and data support for the rational layout in degraded grassland ecological engineering.

2. Materials and Methods
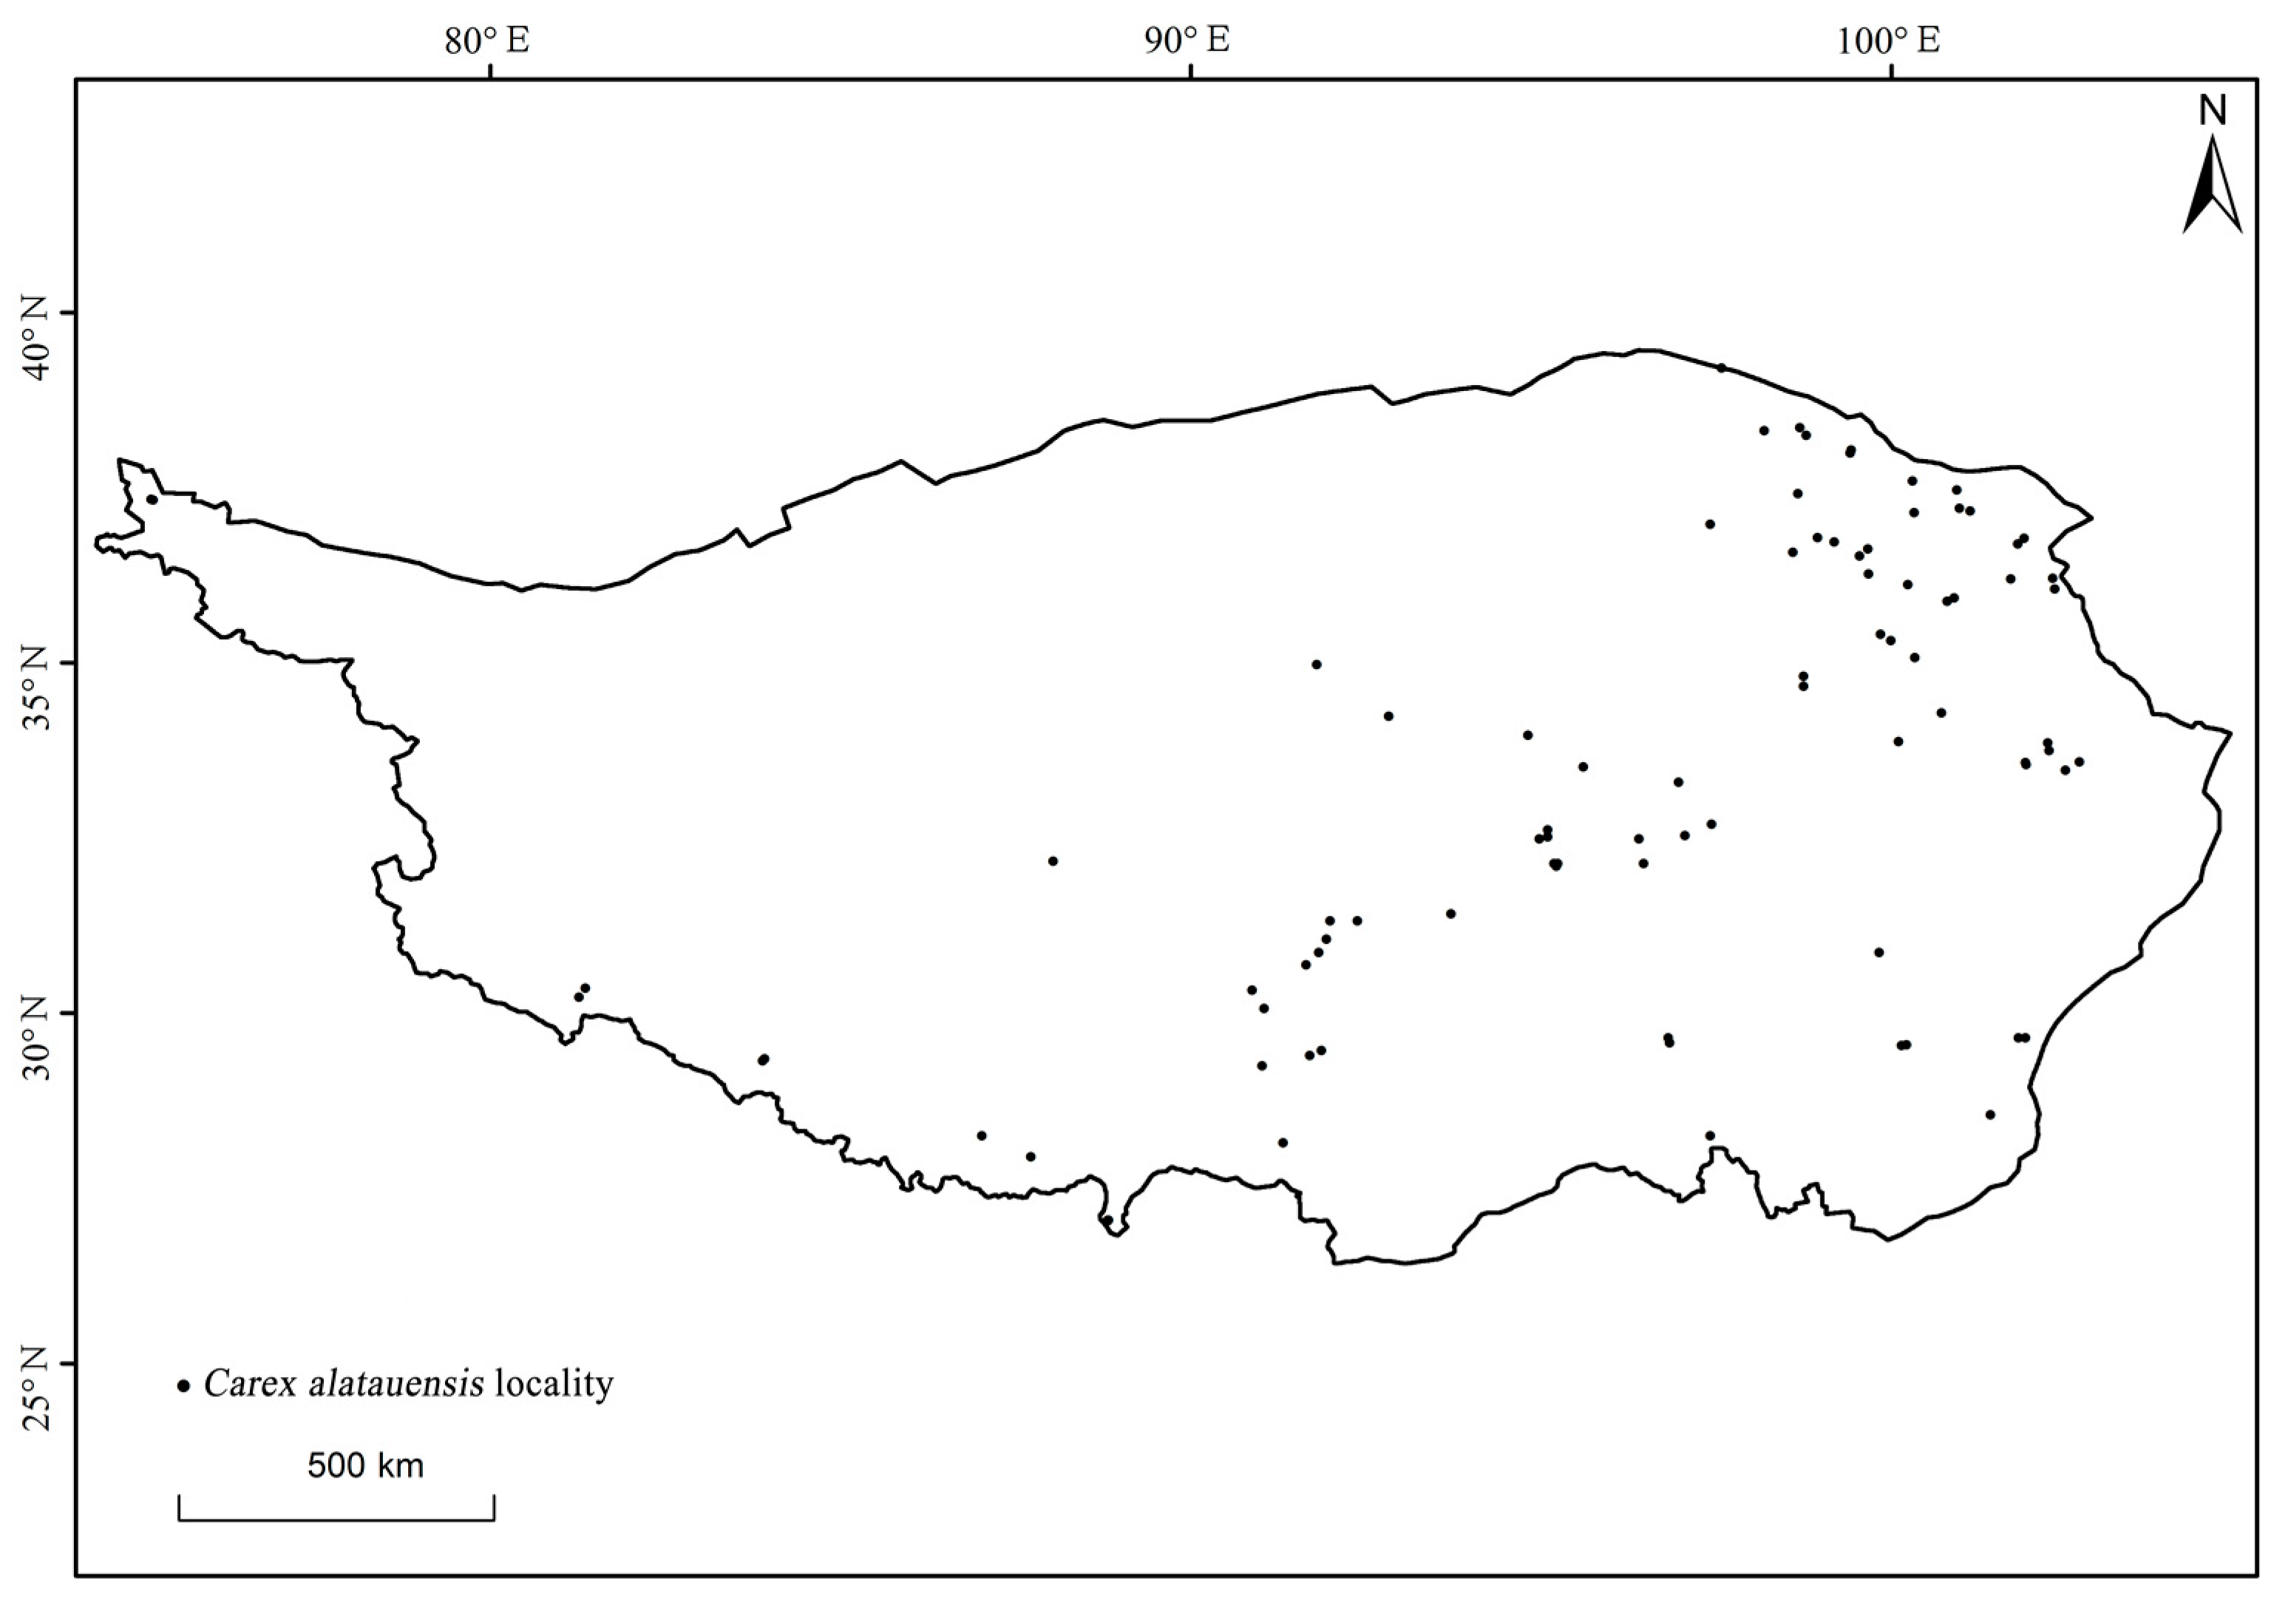
2.1. Study Area

The Qinghai–Tibet Plateau (26°00′-39°47′ N, 73°19′-104°47′ E) is the highest plateau in the world and is known as the “roof of the world”. It is located in the China–Tibet province and parts of Qinghai, Xinjiang, Gansu, Sichuan, and Yunnan and covers an area of approximately 2.58 million km2. Topographically, it can be divided into six parts, including the Qiangtang Plateau, the South Tibet River Basin, the Tsaidam Basin, the Qilian Mountains, the Qinghai Plateau, and the Sichuan–Tibet Alpine Valley. Precipitation and temperature have clear regional distribution patterns. Annual precipitation increases gradually from 50 to 700 mm from the northwest to the southeast, and the annual temperature gradually increases from −15 to 20 °C from the northeast to the southeast [22]. The vegetation types on the Qinghai–Tibet Plateau are alpine meadows, alpine steppe, alpine shrub steppe, and desert grassland [23].

2.2. Carex alatauensis Distribution Data

According to the field investigation of C. alatauensis germplasm resources from 2019 to 2022, the Chinese Virtual Herbarium (https://www.cvh.ac.cn/ accessed on 12 August 2022) and the Global Biodiversity Information Facility database (https://www.gbif.org/ accessed on 12 August 2022), combined with local flora and literature reports, a total of 128 distribution data of C. alatauensis resources were obtained. Uncertain and repeated sampling points were removed, and finally, 90 distribution points that could execute the MaxEnt model program were retained; ArcGIS10.4.1 was used to draw the geographical distribution map of C. alatauensis (Figure 1). The map data come from the National Basic Geographic Information Center (http://www.ngcc.cn/ngcc/ accessed on 10 September 2022).

2.3. Climatic Data

The climate variable data come from the latest climate data layer provided by the WorldClim website (https://www.worldclim.org/ accessed on 20 August 2022). In January 2020, the website released climate data such as rainfall, temperature, solar radiation, and wind speed data from 1970 to 2000 and data on 19 bioclimatic variables (Table 1) [24]. Bioclimatic variables are derived from monthly temperature and rainfall values in order to generate more biologically meaningful variables. These are often used in species distribution modeling and related ecological modeling techniques. All of the climate variable data layers adopt a spatial resolution of 30″ (about 1 km).

2.4. Maximum Entropy Niche-Based Model

Import the existing distribution data of C. alatauensis collected above and the climate layer converted into ASCII format by the ArcGIS10.4.1 software into the MaxEnt3.4.1 software for calculation. During the operation, set the training set to 75%, the test set to 25%, the number of iterations to 10,000, and the repeated training to 10 to perform data simulation. Use the Jackknife module in MaxEnt3.4.1 software to calculate the contribution rate and important replacement value of each climate variable and to test the restriction strength of each climate variable on the geographical distribution. The accuracy of the MaxEnt model is tested by the receiver operating characteristic curve (ROC), represented by the area under the curve (AUC). The AUC value ranges from 0 to 1, and the larger the value, the more accurate the model’s prediction. An AUC value less than 0.5 indicates that it is worse than the random simulation and the model simulation fails. If it is 0.5–0.7, this indicates that the model simulation is poor. If it is 0.7–0.9, this indicates that the model simulation effect is average. If it is greater than 0.9, this indicates that the model simulation accuracy is better, and it can more accurately reflect the potential distribution of the species [25].
Use the ArcGIS10.4.1 software to visualize the simulation results and divide the habitat suitability; according to the simulated moderate size of C. alatauensis, combined with the collected geographical distribution data, use the Jenks’ natural breaks to divide it. There are four grades: the non-suitable region (<0.09), the suitable region (0.09–0.33), the sub-suitable region (0.33–0.62), and the most suitable region (>0.62). Then, use the Reclassify tool to calculate the distribution area corresponding to each grade.

3. Results

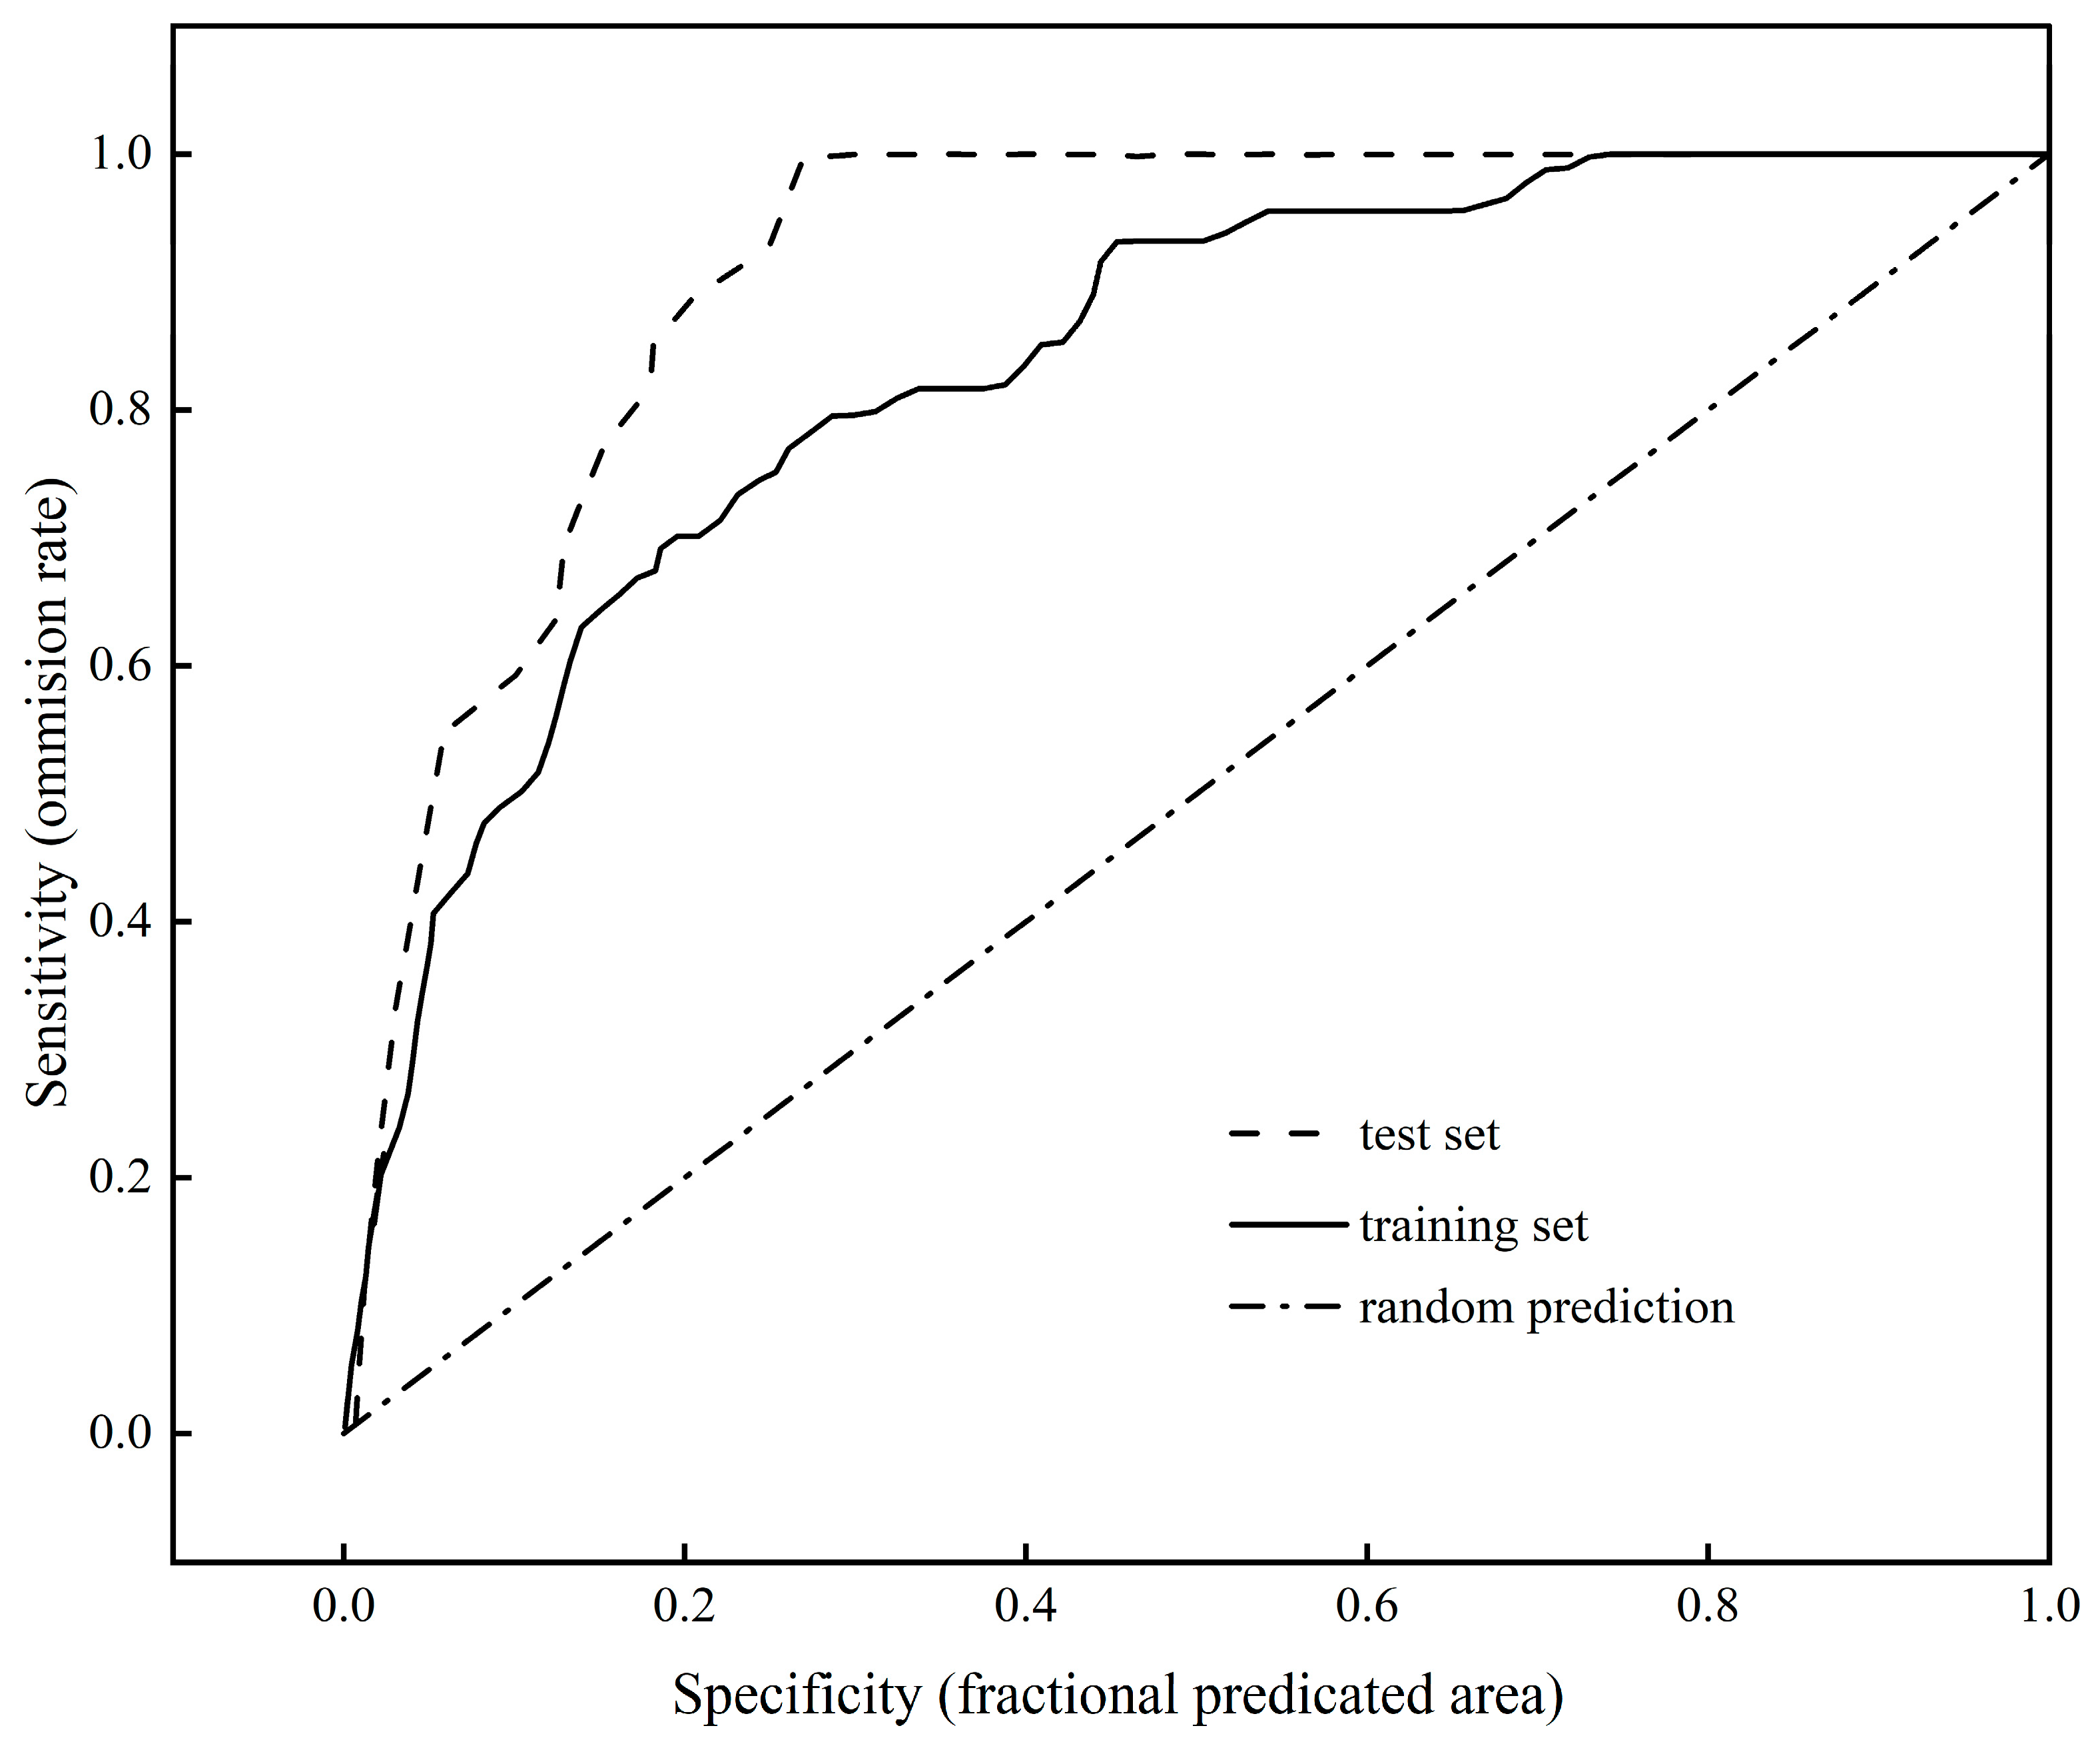
3.1. Accuracy of the Maxent Model

There are 90 geographical distribution coordinate data of C. alatauensis. In the construction of the maximum entropy model, 68 coordinate data were randomly selected as training samples, and the remaining 23 coordinate data were used as test samples. The results show that the AUC value of the model training set is 0.833 ± 0.044, which is greater than 0.8 and significantly greater than the AUC value of the random prediction distribution model (Figure 2). The simulation effect of the model is “good”, with it meeting the model prediction accuracy requirements. This shows that the potential distribution area of C. alatauensis predicted by the maximum entropy model has good accuracy and the prediction results have high credibility.

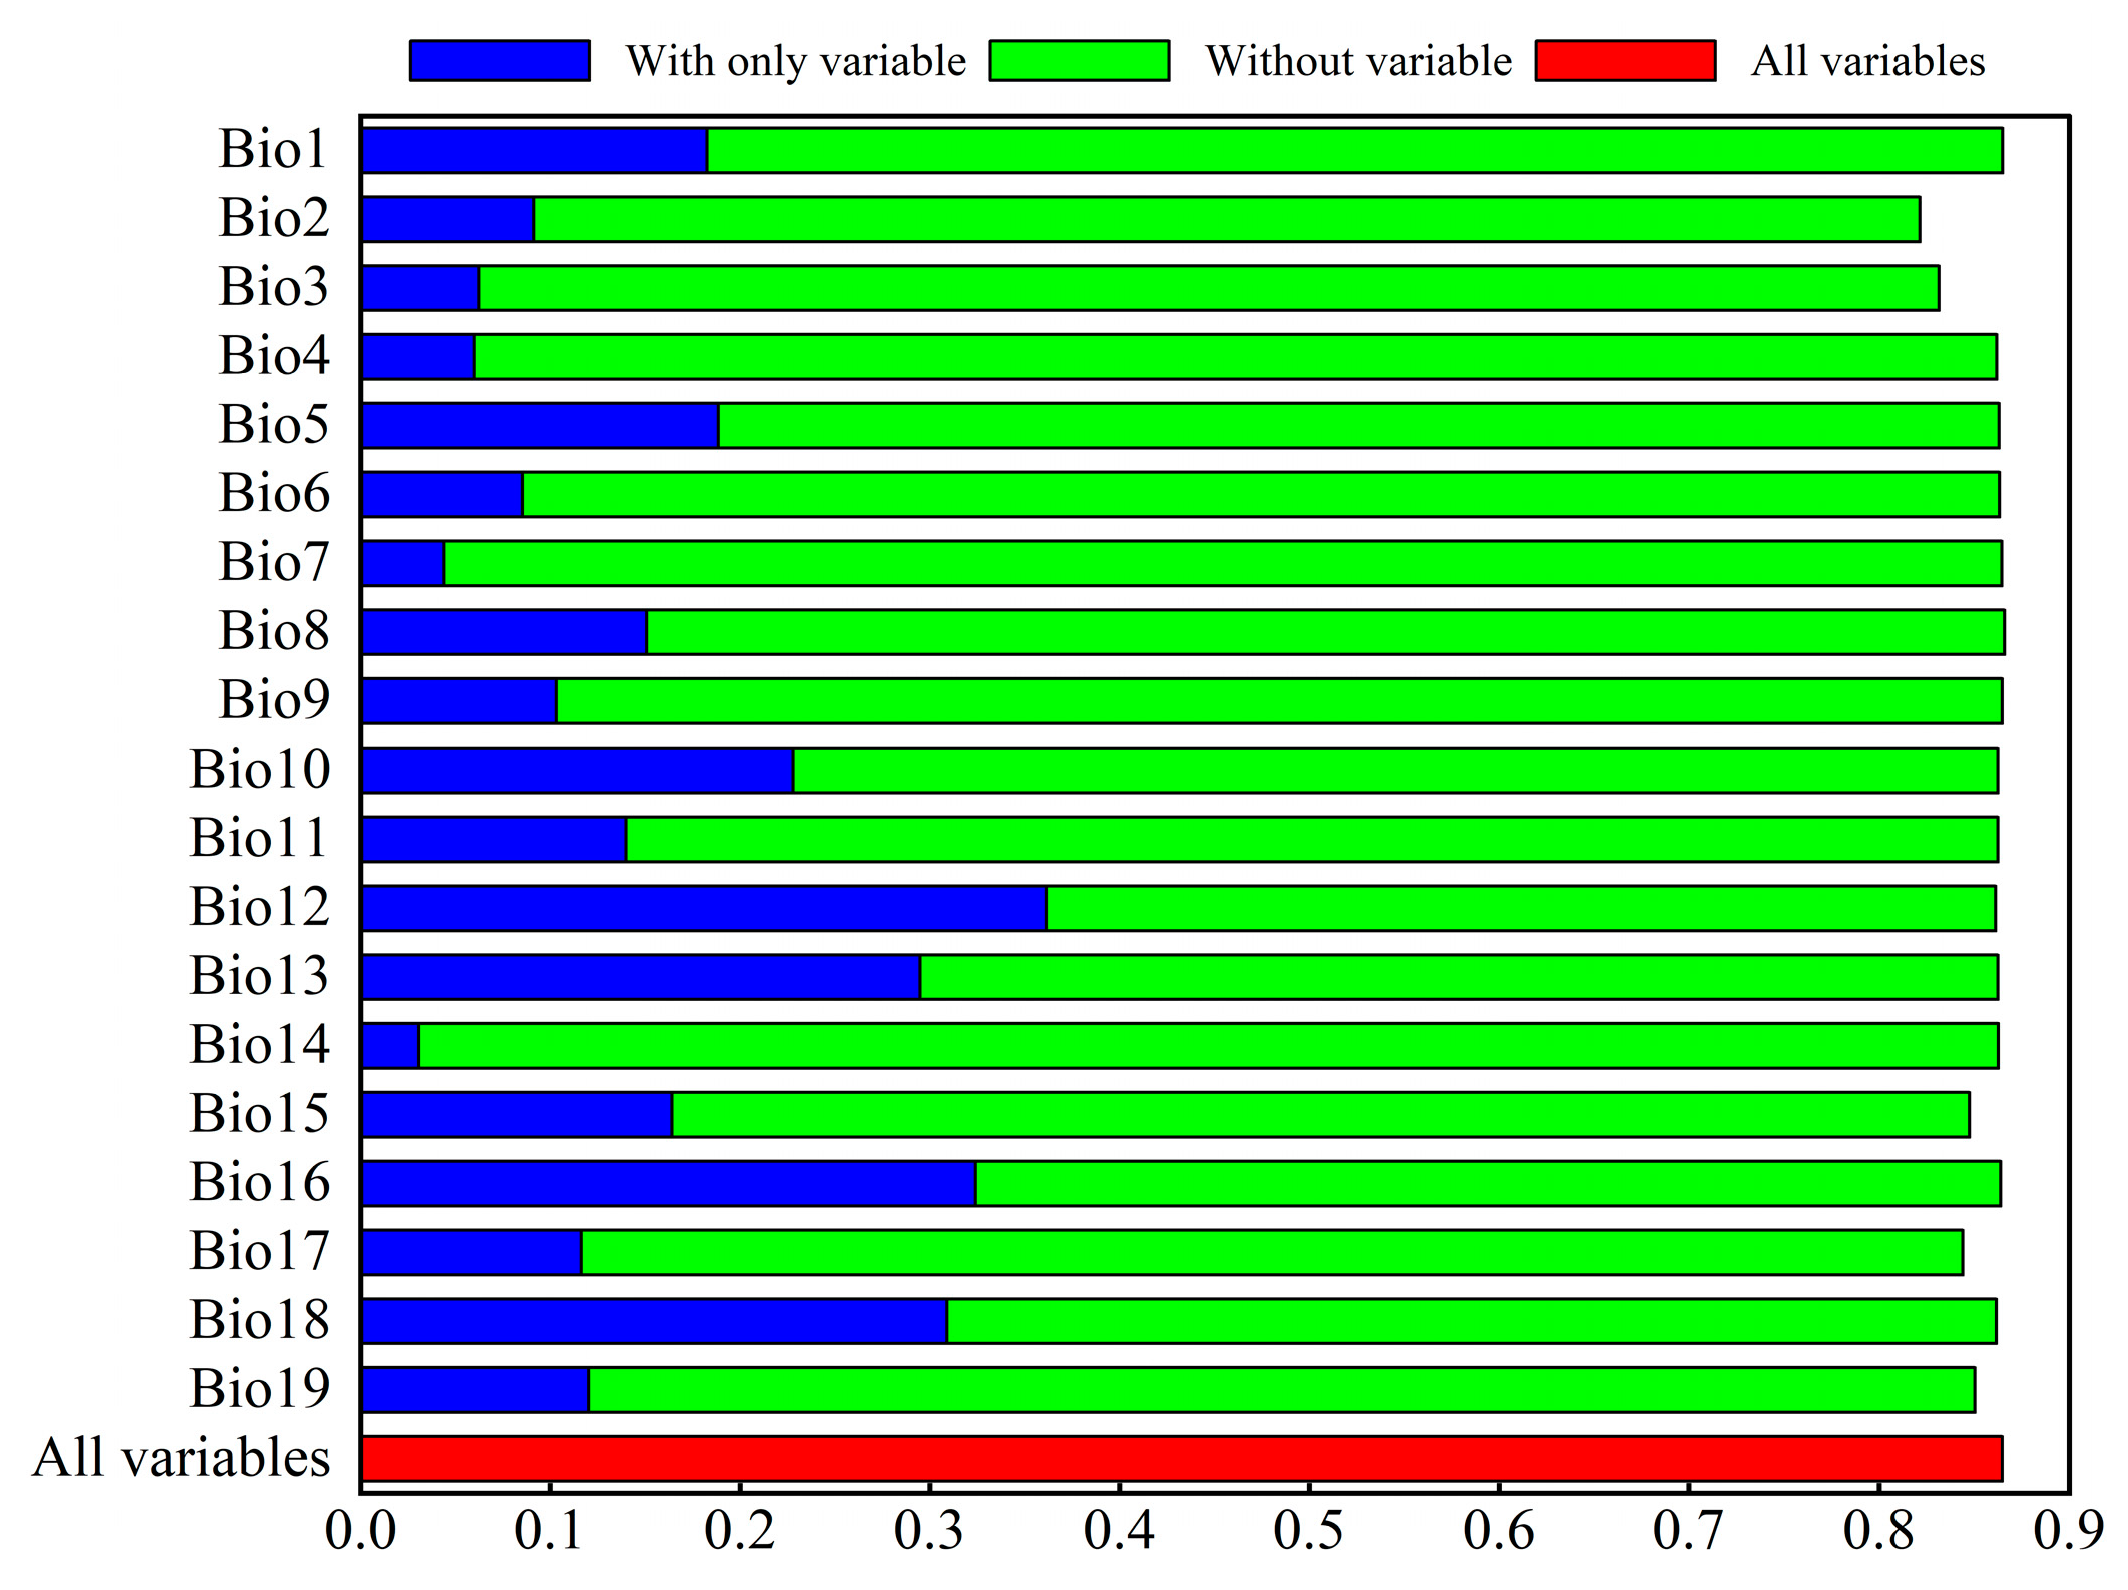
3.2. The Variables’ Contribution to Suitability

The MaxEnt model was run according to 19 environmental variables to evaluate the contribution rate of each climate factor (Table 2). The top five climatic factors with the highest contribution rate are the annual precipitation (Bio12, (42.31 ± 3.41)%), the mean temperature of the warmest quarter (Bio10, (14.63 ± 5.49)%), the mean diurnal range (Bio2, (12.62 ± 1.23)%), the precipitation of the driest month (Bio14, (7.38 ± 0.87)%), and the max temperature of the warmest month (Bio5, (5.17 ± 4.45)%), with a cumulative contribution rate of 82.11%. The Jackknife test scores for different climatic factors were analyzed by the Jackknife module (Figure 3). The results show that the top five climate factors are the annual precipitation (Bio12, 0.361), the precipitation of the wettest quarter (Bio16, 0.324), the precipitation of the warmest quarter (Bio18, 0.309), the precipitation of the wettest month (Bio13, 0.295), and the mean temperature of the warmest quarter (Bio10, 0.228).

3.3. The Variables’ Response to Suitability

The response curves of the fitness degree of C. alatauensis were drawn for the above eight climatic factors. The existence probability of each climatic factor to C. alatauensis showed that with the increase in the climatic factor value, the existence probability showed a trend of first increasing rapidly and then decreasing slowly. In this study, the range of climate factors when the probability of existence is greater than 0.6 was used to represent the climate characteristics of the C. alatauensis distribution area. The climate characteristics of the distribution area of C. alatauensis are as follows: the mean diurnal range (Bio2) is 12.8–15.1 °C, the max temperature of the warmest month (Bio5) is 14.2–20.7 °C, the mean temperature of the warmest quarter (Bio10) is 7.7–14.3 °C, the annual precipitation (Bio12) is 300–651 mm, the precipitation of the wettest month (Bio13) is 69–143 mm, the precipitation of the driest month (Bio14) is 0–5 mm, the precipitation of the wettest quarter (Bio16) is 188–380 mm, and the precipitation of the warmest quarter (Bio18) is 187 mm~391 mm (Figure 4).

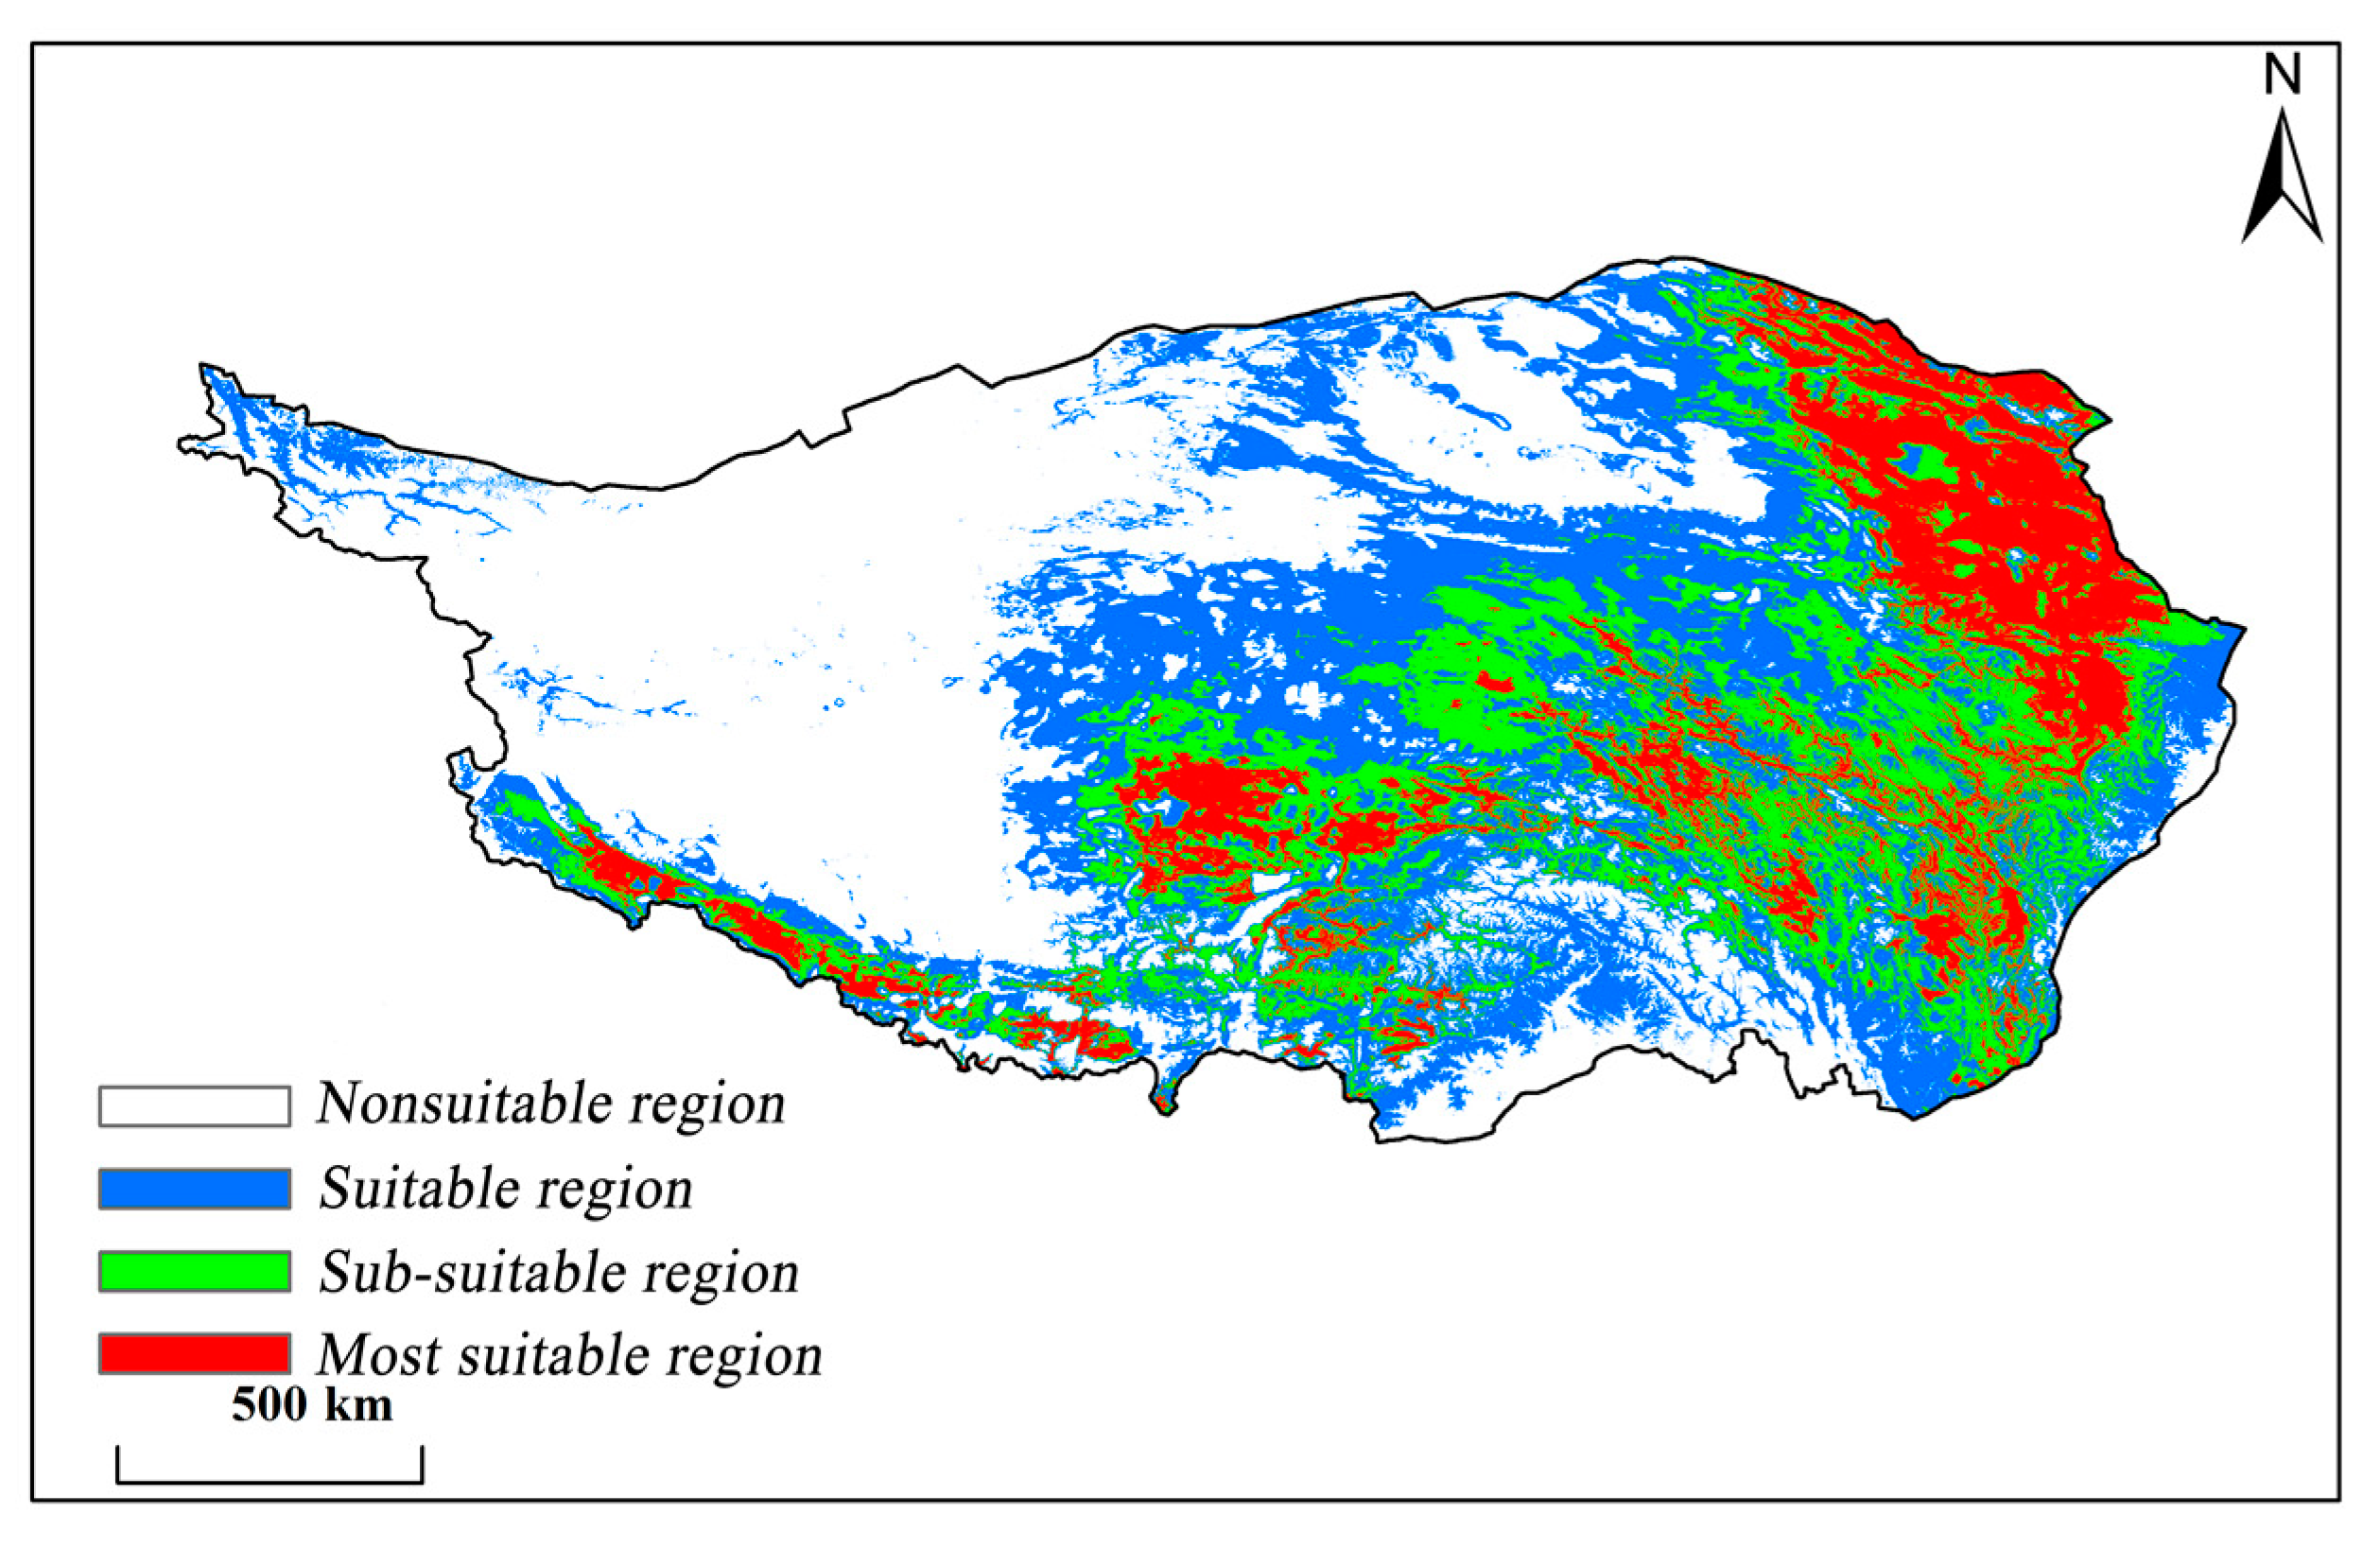
3.4. Potential Distribution of Carex alatauensis

The potential most suitable regions for C. alatauensis are mainly located in the Qilian Mountains, the Himalayas, and the Qingtanggula Mountains on the Qinghai–Tibet Plateau (Figure 5). Based on the MaxEnt model, the most suitable region for C. alatauensis is about 37.41 × 10⁵ km2 (Table 3). Most of the sub-suitable regions are located around the most suitable regions, such as near the Tanggula Mountains and the Nyainqentanglha Mountains. The area of the sub-suitable region is about 62.84 × 10⁵ km2. C. alatauensis has a wide range of suitable regions; except for the Qiangtang Plateau and the Tsaidam Basin, it is distributed in other areas, with an area of about 95.47 × 10⁵ km2.

4. Discussion

Climatic factors are one of the main factors restricting the geographical distribution of plants on a large scale, in which hydrothermal conditions play a leading role [26,27]. In this study, the MaxEnt model was used to simulate the potential distribution area of C. alatauensis on the Qinghai–Tibet Plateau. By integrating the contribution rate of each climate factor and the Jackknife test scores, it was shown that the main climatic factors affecting C. alatauensis are annual precipitation (Bio12), growth season precipitation (Bio16 for the precipitation of the wettest quarter, Bio18 for the precipitation of the warmest quarter, and Bio13 for the precipitation of the wettest month), heat (Bio10 for the mean temperature of the warmest quarter, Bio2 for the mean diurnal range, and Bio5 for the max temperature of the warmest month), and the precipitation of the driest month (Bio14). Annual precipitation, growth season precipitation, and the precipitation of the driest month have a greater impact on its distribution. Moisture conditions are the dominant climatic factors affecting the distribution of C. alatauensis, followed by heat conditions in the growing season [28,29]. Some studies have shown that temperature and moisture are the main limiting factors for the distribution of alpine species [30,31,32]. Other scholars believe that in the Qinghai–Tibet Plateau, temperature has a greater impact on Cyperaceae genus plants than precipitation [33]. However, Cyperaceae genus plants are mainly short and compact cushion plants. This special shape is beneficial for plants to absorb heat and reduce the impact of windy environments on plants, thereby improving their tolerance to alpine regions [34,35]. There are also some studies that show that water is the main limiting factor for the distribution of plateau plants. Song studied the changes in δ13C in the leaves of plants on the Qinghai–Tibet Plateau and found that precipitation is an important factor in regulating the ecosystem changes of the Qinghai–Tibet Plateau from southeast to northwest [36]. Growth season precipitation is also an important climatic factor restricting the growth of juniper (Juniperus pingii var. wilsonii) and birch (Betula utilis) [37,38]. According to the leaf area index satellite images of the National Oceanic and Atmospheric Administration in the United States, Xu found that rainfall is the main climatic factor affecting the interannual variation in the average vegetation cover in the entire Qinghai–Tibet Plateau. Higher temperatures lead to drought and insufficient rainfall in the northern Qinghai–Tibet Plateau; such arid climatic conditions are not conducive to increasing vegetation cover [39].
Among the 19 environmental variables adopted in the model, the mean temperature of the warmest quarter (Bio10) and the annual precipitation (Bio12) were the most important contributors to the habitat suitability distribution of C. alatauensis. For example, in the response curve of the mean temperature of the warmest quarter, C. alatauensis has lower temperature requirements (7.7–14.3 °C) in the warm season. Some studies have shown that C. alatauensis is a plant adapted to alpine meadows and likes a humid and cold environment [12]. Rainfall is one of the most important factors affecting the function and structure of plants and terrestrial ecosystems on the Qinghai–Tibet Plateau [21,40]. An area with an average annual precipitation of 300–651 mm is suitable for the growth of C. alatauensis, and the precipitation of the warmest quarter (Bio18) and the precipitation of the driest month (Bio14) will also affect the habitat suitability distribution.
The results showed that the total area of the potential distribution area was 1.96 × 10⁶ km2, of which the area of most suitable growth for potential distribution reached 3.7 × 10⁵ km2. The suitable distribution area of C. alatauensis simulated in this study is much higher than the total area of known alpine meadows [17,41]. The reasons may be as follows: (1) This study focuses on the distribution from the perspective of the relationship between climatic factors and species distribution, without considering the influence of distribution altitude, slope aspect, soil, land use type, and other factors. (2) The MaxEnt model simulates based on climate similarity and does not take into account other factors that are affected by the actual distribution of species, such as species growth characteristics, dispersal and migration capabilities, natural renewal capabilities, interactions between organisms, etc. [42,43]. (3) C. alatauensis is the dominant species in alpine meadows. Due to overgrazing and climate change, some alpine meadows have been degraded to Ajania stenuifolia, Ligularia virgaurea, Pedicularis kansuensis, etc., and have become black beach areas dominated by poisonous weeds [44]. These possible reasons will result in the predicted potential distribution area being larger than the actual known area. Nevertheless, the potential distribution areas of C. alatauensis obtained from the MaxEnt model all have similar climate characteristics, indicating that C. alatauensis has high adaptability, which can provide a certain basis for ecosystem restoration and the restoration of species selection in the abovementioned areas.

5. Conclusions

Through the analysis of the MaxEnt model, this study shows that water conditions are the dominant climatic factor affecting the distribution of C. alatauensis, followed by the heat conditions in the growing season. The range of dominant climatic factors in the suitable growth area has been clarified, among which the annual precipitation in the suitable growth area was 300–651 mm and the max temperature of the warmest month was 14.2–20.7 ℃. It has been predicted that the potential distribution area of C. alatauensis on the Qinghai–Tibet Plateau is 1.96 × 10⁶ km2 and the most suitable area is 3.7 × 10⁵ km2, mainly located in the Qilian Mountains, the Himalayas, and the Qingtanggula Mountains.

Author Contributions

Conceptualization, Y.X., J.S., K.D., X.W. and Y.M.; data curation, Y.X., X.W., W.W., Y.M. and H.Z.; formal analysis, Y.X., J.S., K.D., W.W., Y.M. and H.Z.; investigation, Y.X., Y.M., H.Z., M.H. and Q.L.; methodology, Y.X., K.D. and X.W.; project administration, J.S.; software, Y.X. and X.W.; supervision, K.D. and X.W.; validation, J.S.; writing—original draft, Y.X.; writing—review and editing, Y.X., X.W. and Y.M. All authors have read and agreed to the published version of the manuscript.

Funding

This research was funded by the Second Comprehensive Scientific Investigation of Qinghai–Tibet Plateau, grant number 2019QZKK1002, and Qinghai Province High-End Innovative Talents Thousand Talents Plan, grant number 2019QHQRJH.

Data Availability Statement

The data that support the findings of this study are available from the corresponding author upon reasonable request.

Acknowledgments

The authors gratefully acknowledge the financial support of the Ministry of Science and Technology, China (2019QZKK1002), to conduct this research.

Conflicts of Interest

The authors declare no conflict of interest.

References

  1. Cheng, G.; Wu, T. Responses of permafrost to climate change and their environmental significance, Qinghai-Tibet Plateau. J. Geophys. Res. Atmos. 2007, 112, F02S03. [Google Scholar] [CrossRef] [Green Version]
  2. Harris, R.B. Rangeland degradation on the Qinghai-Tibetan plateau: A review of the evidence of its magnitude and causes. J. Arid. Environ. 2010, 74, 1–12. [Google Scholar] [CrossRef]
  3. Zhang, Y.; Li, B.; Zhang, D. A discussion on the boundary and area of the Tibetan Plateau in China. Geogr. Res. 2002, 21, 1–8. [Google Scholar] [CrossRef]
  4. Lu, Q.; Wu, S.; Zhao, D. Variations in Alpine Grassland Cover and Its Correlation with Climate Variables on the Qinghai-Tibet Plateau in 1982-2013. Sci. Geogr. Sin. 2017, 37, 292–300. [Google Scholar] [CrossRef]
  5. Liao, G.; Jia, Y. Rangeland Resources of China; China Science and Technology Press: Beijing, China, 1996; pp. 489–492. [Google Scholar]
  6. Raiesi, F.; Riahi, M. The influence of grazing exclosure on soil C stocks and dynamics, and ecological indicators in upland arid and semi-arid rangelands. Ecol. Indic. 2014, 41, 145–154. [Google Scholar] [CrossRef]
  7. Luan, J.; Cui, L.; Xiang, C.; Wu, J.; Song, H.; Ma, Q.; Hu, Z. Different grazing removal exclosures effects on soil C stocks among alpine ecosystems in east Qinghai–Tibet Plateau. Ecol. Eng. 2014, 64, 262–268. [Google Scholar] [CrossRef]
  8. Borer, E.T.; Seabloom, E.W.; Gruner, D.S.; Harpole, W.S.; Hillebrand, H.; Lind, E.M.; Adler, P.B.; Alberti, J.; Anderson, T.M.; Bakker, J.D.; et al. Herbivores and nutrients control grassland plant diversity via light limitation. Nature 2014, 508, 517–520. [Google Scholar] [CrossRef] [Green Version]
  9. Yang, K.; Wu, H.; Qin, J.; Lin, C.; Tang, W.; Chen, Y. Recent climate changes over the Tibetan Plateau and their impacts on energy and water cycle: A review. Glob. Planet. Chang. 2014, 112, 79–91. [Google Scholar] [CrossRef]
  10. Wen, L.; Dong, S.; Li, Y.; Wang, X.; Li, X.; Shi, J.; Dong, Q. The impact of land degradation on the C pools in alpine grasslands of the Qinghai-Tibet Plateau. Plant and Soil 2013, 368, 329–340. [Google Scholar] [CrossRef]
  11. Cui, X.; Graf, H.-F. Recent land cover changes on the Tibetan Plateau: A review. Clim. Chang. 2009, 94, 47–61. [Google Scholar] [CrossRef] [Green Version]
  12. Liang, S.; Dai, L.; Tang, Y.; Li, P. Reipublicae Popularis Sinicae, Tomus 12; Science Press: Beijing, China, 2000; pp. 35–41. [Google Scholar]
  13. Liu, W.; Wang, F.; Yang, X.; Liu, Y.; Feng, B.; Yu, Y.; Zhang, C.; Cao, Q.; Dong, Q. Effects of the Traits of Reproductive and Vegetative Branches of Kobresia humilis under Different Herbivore Assemblage Grazing in Alpine Grassland. Acta Agrestia Sin. 2022, 30, 2231–2238. [Google Scholar] [CrossRef]
  14. Wang, S. Vegetation degradation and protection strategy in the “Three rivers fountainhead”area in the Qinghai province. Acta Prataculturae Sin. 2003, 19, 1–9. [Google Scholar]
  15. Schleuss, P.-M.; Heitkamp, F.; Sun, Y.; Miehe, G.; Xu, X.; Kuzyakov, Y. Nitrogen Uptake in an Alpine Kobresia Pasture on the Tibetan Plateau: Localization by 15N Labeling and Implications for a Vulnerable Ecosystem. Ecosystems 2015, 18, 946–957. [Google Scholar] [CrossRef] [Green Version]
  16. Ingrisch, J.; Biermann, T.; Seeber, E.; Leipold, T.; Li, M.; Ma, Y.; Xu, X.; Miehe, G.; Guggenberger, G.; Foken, T.; et al. Carbon pools and fluxes in a Tibetan alpine Kobresia pygmaea pasture partitioned by coupled eddy-covariance measurements and 13CO2 pulse labeling. Sci. Total. Environ. 2015, 505, 1213–1224. [Google Scholar] [CrossRef] [PubMed]
  17. Miehe, G.; Schleuss, P.-M.; Seeber, E.; Babel, W.; Biermann, T.; Braendle, M.; Chen, F.; Coners, H.; Foken, T.; Gerken, T.; et al. The Kobresia pygmaea ecosystem of the Tibetan highlands—Origin, functioning and degradation of the world’s largest pastoral alpine ecosystem: Kobresia pastures of Tibet. Sci. Total. Environ. 2019, 648, 754–771. [Google Scholar] [CrossRef] [PubMed]
  18. Liu, D.; Lei, X.; Gao, W.; Guo, H.; Xie, Y.; Fu, L.; Lei, Y.; Li, Y.; Zhang, Z.; Tang, S. Mapping the potential distribution suitability of 16 tree species under climate change in northeastern China using Maxent modelling. J. For. Res. 2022, 33, 1739–1750. [Google Scholar] [CrossRef]
  19. Kaky, E.; Nolan, V.; Alatawi, A.; Gilbert, F. A comparison between Ensemble and MaxEnt species distribution modelling approaches for conservation: A case study with Egyptian medicinal plants. Ecol. Inform. 2020, 60, 101150. [Google Scholar] [CrossRef]
  20. Yan, X.; Wang, S.; Duan, Y.; Han, J.; Huang, D.; Zhou, J. Current and future distribution of the deciduous shrub Hydrangea macrophylla in China estimated by MaxEnt. Ecol. Evol. 2021, 11, 16099–16112. [Google Scholar] [CrossRef]
  21. Hu, Z.; Guo, K.; Jin, S.; Pan, H. The influence of climatic changes on distribution pattern of six typical Kobresia species in Tibetan Plateau based on MaxEnt model and geographic information system. Theor. Appl. Clim. 2019, 135, 375–390. [Google Scholar] [CrossRef]
  22. Jian, N. A Simulation of Biomes on the Tibetan Plateau and Their Responses to Global Climate Change. Mt. Res. Dev. 2000, 20, 80–89. [Google Scholar] [CrossRef] [Green Version]
  23. Yue, P.P.; Lu, X.F.; Ye, R.R.; Zhang, C.X.; Yang, S.B.; Zhou, Y.B.; Peng, M. Distribution of Stipa purpurea steppe in the Northeastern Qinghai-Xizang Plateau (China). Russ. J. Ecol. 2011, 42, 50–56. [Google Scholar] [CrossRef]
  24. Fick, S.E.; Hijmans, R.J. WorldClim 2: New 1-km spatial resolution climate surfaces for global land areas. Int. J. Climatol. 2017, 37, 4302–4315. [Google Scholar] [CrossRef]
  25. Elith, J.H.; Graham, C.P.H.; Anderson, R.P.; Dudík, M.; Ferrier, S.; Guisan, A.J.; Hijmans, R.; Huettmann, F.; R. Leathwick, J.; Lehmann, A.; et al. Novel methods improve prediction of species’ distributions from occurrence data. Ecography 2006, 29, 129–151. [Google Scholar] [CrossRef] [Green Version]
  26. Rae, D.A.; Armbruster, W.S.; Edwards, M.E.; Svengård-Barre, M. Influence of microclimate and species interactions on the composition of plant and invertebrate communities in alpine northern Norway. Acta Oecologica 2006, 29, 266–282. [Google Scholar] [CrossRef]
  27. Wang, Z.; Yang, G.; Yi, S.; Chen, S.; Wu, Z.; Guan, J.; Zhao, C.; Zhao, Q.; Ye, B. Effects of environmental factors on the distribution of plant communities in a semi-arid region of the Qinghai-Tibet Plateau. Ecol. Res. 2012, 27, 667–675. [Google Scholar] [CrossRef]
  28. Li, J.; Zhang, F.; Lin, L.; Li, H.; Du, Y.; Li, Y.; Cao, G. Response of the plant community and soil water status to alpine Kobresia meadow degradation gradients on the Qinghai–Tibetan Plateau, China. Ecol. Res. 2015, 30, 589–596. [Google Scholar] [CrossRef]
  29. Li, L. Study on the Suitable Distribution Mechanism and Response of the Kobresia Meadow in the Three-Rivers Source Region. Master’s Thesis, Lanzhou University, Lanzhou, China, 2017. [Google Scholar]
  30. Kennedy, A.D. Water as a Limiting Factor in the Antarctic Terrestrial Environment: A Biogeographical Synthesis. Arct. Alp. Res. 1993, 25, 308–315. [Google Scholar] [CrossRef]
  31. Wu, L.; Wang, M.; Ouyang, H.; Cheng, S.; Song, M. Spatial Distribution Modelling of Kobresia pygmaea (Cyperaceae) on the Qinghai-Tibetan Plateau. J. Resour. Ecol. 2017, 8, 20–29. [Google Scholar] [CrossRef]
  32. Boyce, R.L.; Clark, R.; Dawson, C. Factors Determining Alpine Species Distribution on Goliath Peak, Front Range, Colorado, U.S.A. Arctic, Antarct. Alp. Res. 2005, 37, 88–96. [Google Scholar] [CrossRef]
  33. Zhou, Y.; Fan, J.; Zhang, W.; Harris, W.; Zhong, H.; Hu, Z.; Song, L. Factors influencing altitudinal patterns of C3 plant foliar carbon isotope composition of grasslands on the Qinghai-Tibet Plateau, China. Alp. Bot. 2011, 121, 79. [Google Scholar] [CrossRef]
  34. Cavieres, L.A.; Quiroz, C.L.; Molina-Montenegro, M.A. Facilitation of the non-native Taraxacum officinale by native nurse cushion species in the high Andes of central Chile: Are there differences between nurses? Funct. Ecol. 2008, 22, 148–156. [Google Scholar] [CrossRef]
  35. Liu, J.; Duan, Y.; Hao, G.; Ge, X.; Sun, H. Evolutionary history and underlying adaptation of alpine plants on the Qinghai–Tibet Plateau. J. Syst. Evol. 2014, 52, 241–249. [Google Scholar] [CrossRef]
  36. Song, M.; Duan, D.; Chen, H.; Hu, Q.; Zhang, F.; Xu, X.; Tian, Y.; Ouyang, H.; Peng, C. Leaf δ13C reflects ecosystem patterns and responses of alpine plants to the environments on the Tibetan Plateau. Ecography 2008, 31, 499–508. [Google Scholar] [CrossRef]
  37. Liang, E.; Lu, X.; Ren, P.; Li, X.; Zhu, L.; Eckstein, D. Annual increments of juniper dwarf shrubs above the tree line on the central Tibetan Plateau: A useful climatic proxy. Ann. Bot. 2012, 109, 721–728. [Google Scholar] [CrossRef] [PubMed]
  38. Liang, E.; Dawadi, B.; Pederson, N.; Eckstein, D. Is the growth of birch at the upper timberline in the Himalayas limited by moisture or by temperature? Ecology 2014, 95, 2453–2465. [Google Scholar] [CrossRef] [Green Version]
  39. Xu, X.; Chen, H.; Levy, J.K. Spatiotemporal vegetation cover variations in the Qinghai-Tibet Plateau under global climate change. Sci. Bull. 2008, 53, 915–922. [Google Scholar] [CrossRef] [Green Version]
  40. Yang, Y.; Li, X.; Kong, X.; Ma, L.; Hu, X.; Yang, Y. Transcriptome analysis reveals diversified adaptation of Stipa purpurea along a drought gradient on the Tibetan Plateau. Funct. Integr. Genom. 2015, 15, 295–307. [Google Scholar] [CrossRef]
  41. Genxu, W.; Ju, Q.; Guodong, C.; Yuanmin, L. Soil organic carbon pool of grassland soils on the Qinghai-Tibetan Plateau and its global implication. Sci. Total. Environ. 2002, 291, 207–217. [Google Scholar] [CrossRef]
  42. Cao, X.; Wang, J.; Lu, S.; Zhang, X. Simulation of the potential distribution patterns of Picea crassifolia in climate change scenarios based on the maximum entropy (Maxent) model. Acta Ecol. Sin. 2019, 39, 5232–5240. [Google Scholar] [CrossRef]
  43. Zhang, X.; Jiang, Y.; Bi, Y.; Liu, X.; Li, X.; Sun, T.; Chen, H.; Li, J. Identification of potential distribution area for Hippophae rhamnoides subsp. sinensis by the MaxEnt mode. Acta Ecol. Sin. 2022, 42, 1420–1428. [Google Scholar] [CrossRef]
  44. Ma, Y.; Lang, B.; Li, Q.; Shi, J.; Dong, Q. Study on rehabilitating and rebuilding technologies for degenerated alpine meadow in the Changjiang and Yellow river source region. Acta Prataculturae Sin. 2002, 19, 1–5. [Google Scholar]
Figure 1. The occurrence sites of Carex alatauensis on the Qinghai–Tibet Plateau.
Agronomy 13 00564 g001
Figure 2. The receiver operating characteristic curve predicting the current potential distribution of Carex alatauensis based on the MaxEnt model.
Agronomy 13 00564 g002
Figure 3. Jackknife test for climatic factors in the current potential distribution model of Carex alatauensis.
Agronomy 13 00564 g003
Figure 4. Probability response curves of the main climatic factors.
Agronomy 13 00564 g004
Figure 5. Potential distribution of Carex alatauensis based on MaxEnt.
Agronomy 13 00564 g005
Table 1. Bioclimatic variables’ description.
VariableDescription
Bio1Mean annual temperature
Bio2Mean diurnal range
Bio3Isothermality
Bio4Temperature seasonality
Bio5Max temperature of the warmest month
Bio6Minimum temperature of the coldest month
Bio7Temperature annual range
Bio8Mean temperature of the wettest quarter
Bio9Mean temperature of the driest quarter
Bio10Mean temperature of the warmest quarter
Bio11Mean temperature of the coldest quarter
Bio12Annual precipitation
Bio13Precipitation of the wettest month
Bio14Precipitation of the driest month
Bio15Precipitation seasonality
Bio16Precipitation of the wettest quarter
Bio17Precipitation of the driest quarter
Bio18Precipitation of the warmest quarter
Bio19Precipitation of the coldest quarter
Table 2. Contribution rate of each climatic factor for the distribution of Carex alatauensis.
VariablesPercent Contribution/%
Bio1242.31 ± 3.41
Bio1014.63 ± 5.49
Bio212.62 ± 1.23
Bio147.38 ± 0.87
Bio55.17 ± 4.45
Bio35.07 ± 1.61
Bio153.57 ± 1.08
Bio183.52 ± 2.28
Bio172.10 ± 0.95
Bio71.48 ± 1.05
Bio40.82 ± 0.49
Bio190.62 ± 0.16
Bio160.29 ± 0.18
Bio10.17 ± 0.21
Bio60.11 ± 0.14
Bio110.06 ± 0.15
Bio90.05 ± 0.05
Bio80
Bio130
Table 3. Potential distribution area of Carex alatauensis.
ClassificationSimulation Area (km2)
Most suitable region37.41 × 105
Sub-suitable region62.84 × 105
Disclaimer/Publisher’s Note: The statements, opinions and data contained in all publications are solely those of the individual author(s) and contributor(s) and not of MDPI and/or the editor(s). MDPI and/or the editor(s) disclaim responsibility for any injury to people or property resulting from any ideas, methods, instructions or products referred to in the content.

