Article

Response of Multi-Stressed Olea europaea Trees to the Adjustment of Soil pH by Acidifying Agents: Impacts on Nutrient Uptake and Productivity

by
Hamada R. Beheiry
1,
Ahmed A. M. Awad
2,* and
Hamdy A. Z. Hussein
1
1
Horticulture Department, Faculty of Agriculture, Fayoum University, Fayoum 63514, Egypt
2
Soil and Natural Resources, Faculty of Agriculture and Natural Resources, Aswan University, Aswan 81528, Egypt
*
Author to whom correspondence should be addressed.
Agronomy 2023, 13(2), 539; https://doi.org/10.3390/agronomy13020539
Submission received: 31 December 2022 / Revised: 9 February 2023 / Accepted: 10 February 2023 / Published: 14 February 2023

Abstract

:
Soil pH is the most important factor in evaluating plant nutritional status due to its close association with nutrient availability. In the 2018 and 2019 seasons, two field experiments were conducted to evaluate the performance of olive trees (Olea europaea, Picual cv.) grown in sandy clay loam soil under multi-abiotic stresses with the application of three different acidifying agents (AAs), acetic (AC), citric (CA), and sulfuric (SA) acid, at two doses (25 and 50 cm3; AC1 and AC2, CA1 and CA2, and SA1 and SA2, respectively), as compared with a control treatment. This study was established according to a randomized complete block design. In general, our results showed that all the AAs applied surpassed the control treatment with respect to all the studied parameters except for the leaf iron content. Furthermore, the trees treated with CA yielded the best results in terms of the leaf nitrogen, calcium, and magnesium contents; the physiological and growth parameters (except for the performance index); the total fruit weight, flesh weight, and flesh dry matter; the fruit diameter; the oil content; and the total olive yield. Furthermore, the maximum leaf potassium, manganese, zinc, and copper contents were obtained in the trees growing in soil injected with AC. The correlation coefficient fluctuated between positive and negative among the studied characteristics.

1. Introduction

Soil pH is an influential factor in the adsorption/absorption and availability of nutrients in the soil owing to the close relationship between them. In addition, most of the chemical, fertility, and biological properties of soil are strongly associated with soil pH; thus, in turn, it also affects plant growth and development [1,2]. Chemically, soil pH can be defined as the negative logarithm of the active hydrogen (H+) or hydroxyl ion concentration (OH) or, simply, pH = − log [H+]; pOH = − log [OH] [3,4]. A scale ranging from 0 to 14 is used to describe the acidity and alkalinity of soil. pH values of less than 7 refer to acidic conditions, while those above 7 indicate an alkaline environment; however, pH values at 7 are considered neutral [3,5]. Soils in arid and semi-arid regions are commonly alkaline with a high pH [6] as a result of water scarcity, in addition to low precipitation and potential evapotranspiration [7,8], as indicated by the negative correlations between soil pH and temperature and between soil pH and precipitation. Recently, some studies have reported that the soil pH in Egypt varies from neutral to strongly alkaline as an inherent characteristic of the soil, resulting from the nature of the parent material [9] along with the prevailing climatic conditions [10,11,12]. The results obtained from the studies of [13,14,15] indicate that the low availability of some nutrients, especially phosphorus (P) and other micronutrients (except molybdenum), is strongly related to an increase in soil pH. The decrease in micronutrient availability in alkaline soil could be explained by the fact that these cations become strongly bonded with soil organic matter (SOM) and soil colloids as the pH approaches 8.
The available information regarding the strong association between soil pH and nutrient availability suggests that the ability of plants to uptake nutrients through their root hairs and root tips is affected by soil pH. Although this issue is worthy of attention, since alkaline soils cover more than one-fourth of Earth’s surface and the maximum availability of most nutrients occurs at a pH less than 6 [16], studies related to soil alkalinity modifications are still required. Adjustments in soil pH are often caused by the application of either acidic fertilizers or synthetic chemicals; however, these changes are resisted by the soil’s buffering capacity (SBC). Accordingly, the availability of nutrients depends indirectly on the SBC [17,18]. Furthermore, soil pH is not only affected by climatic conditions but also by soil type; calcareous soils are particularly alkaline owing to their high CaCO3 content [19]. In addition, salinity and sodicity are considered as major factors in increasing soil pH. Globally, the total area of salt-affected soils is about 935,000,000 ha [20]; about 560,000,000 ha of this area is characterized by saline–sodic soils [21,22]. Moreover, several factors, such as soil texture, soil mineralogical compounds, and SOM, as well CEC, have an appreciable influence on soil pH [23].
Since the 1960s, many efforts have been made to bring soils to a desired pH [24]. Accordingly, several acidifying materials, either chemical or organic, have been applied to alkaline soil in an attempt to obtain a more optimal pH. For example, the application of organic manures has a significant impact on soil pH [25] due to their role in producing acidic organics and enhancing the cation exchange capacity (CEC), which consequently increases the acid saturation percentage [26]. In addition, the application of some acidifying agents, such as gypsum (CaSO4·2H2O), has been shown to result in a significant adjustment in the pH at a lower cost [27]. Sulfuric acid (SA) and polyacrylamide are also considered as vital chemical treatments [28,29] for lowering soil pH. In addition, other acidifying agents have been applied, including nitric acid (HNO3), hydrochloric acid (HCl), or the salts of trivalent metal ions, including aluminum (Al) and iron (Fe), as well as materials containing ammonium (NH4+) ions [30]. Recently, the influential role of organic acids (OAs) as acidifying agents for lowering soil pH has been reported in some studies. In addition to their effect on soil pH, OAs generally play a pivotal role in enhancing the solubility of micronutrients through chelation and complexation, which in turn improves their uptake by plants [31]. Acetic (AA) and citric acid (CA), both classified as OAs, are natural substances that exhibit a low toxicity to microorganisms; their chemical formulas are CH3COOH and C3H5O(COOH)3, respectively. In their study on three different textured soils (sandy clay loam, clay loam and silt loam) using four chemicals, including aluminum sulfate Al2(SO4)3, hydrogen peroxide (H2O2), hydrochloric acid (HCl), and sulfuric acid H2SO4, [16] reported that Al2(SO4)3 had the greatest effect in terms of lowering pH either alone or in combination with other chemicals. Similarly, H2O2, HCl, and H2SO4 are helpful in the conditioning of soil pH.
In this study, to understand the potential influence of the application of acidifying agents on the availability of nutrients and the physiological aspects of plants, olive (Olea europaea L.) trees grown under multi-stress conditions were selected because of their socioeconomic importance and the fact that the majority of olive trees are cultivated in newly reclaimed soils [32,33]. According to the FAO, 2022 [34], the total area cultivated with olive trees around the world is nearly 11 million ha, more than 90% of which is found in the Mediterranean basin countries, such as Spain, Italy, Greece, Turkey, and Tunisia [35]. In Egypt, olives rank fourth after citrus, mango, and table grape cultivation [36,37]. Egypt is considered as a good competitor in global markets as it produces 13% of the total global yield [34]. In the last thirty years, Egypt has achieved unprecedented progress in terms of the total cultivated area and the total production of several varieties, including Picual, Kalamata, Teffahi, Waleken, etc. In 2017, the total cultivated area reached 101,326 ha, with the total production estimated at about 874,748 tons according to the Agricultural Affairs Sector.
For this purpose, two field experiments were conducted in the growing seasons of 2018 and 2019 on olive trees (Olea europaea, Picual cv.) growing under multi-abiotic stresses (pH = 7.95 vs. 7.87; CaCO3 = 9.1 vs. 9.8%; and ECe 6.5 vs. 7.4 dS·m−1) in a sandy loam clay soil using two doses (25 and 50 cm3) of three different acidifying agents (AAs): acetic acid (AC, AC1, and AC2), citric acid (CA, CA1, and CA2), and sulfuric acid (SA, SA1, and SA2) in an attempt to adjust the soil pH, which is the main problem with Egyptian soils, and evaluated their potential impacts on nutrient availability, which in turn influences the physiological and growth parameters, the yield of table and oil olives, and the fruit’s physical attributes.

2. Materials and Methods

2.1. Field Experiment Site and Climatic Conditions

Two field experiments were performed in the Kawm Ushim region, situated between 29°32′39″ N latitude and 30°52′35″ E longitude and located on the Cairo-Fayoum Desert Road, Egypt, during the 2018 and 2019 seasons, to evaluate the potential performance of some acidifying agents in an attempt to decrease the soil pH within an optimal range for plant uptake. This investigation focused on olive (Olea europaea L.) trees grown in sandy loam clay textured soil in both seasons. The average weather data from January to December for both growing seasons are shown in Table 1.

2.2. Plant Material and Agricultural Practices

The tested Picual variety trees were about 15 years old and were propagated using leafy cuttings planted at a distance of about 5 × 8 m2 between trees under a drip irrigation system. The trees were carefully selected to ensure that they were free from fungal and insect diseases.
All the horticulture practices were accomplished according to the recommendations of the Egyptian Ministry of Agriculture, including the amount and schedule for water irrigation and weed control (glyphosate 48% sprayed prophylactically with Kocide 54.8% copper hydroxide). Based on the technical bulletin NO2, issued by the General Administration of Agriculture in 2016, the fertilization program of olive trees aged over 6 years included the application of ammonium sulfate [(NH4)2SO4 N ≈ 20.6], granular calcium super phosphate [Ca(H2PO4)2 P2O5 ≈ 15.5%], potassium sulfate [K2SO4 K2O ≈ 48%], and magnesium sulfate [MgSO4·7H2O MgO ≈ 24%] as sources of nitrogen (N), phosphorus (P), potassium (K), and magnesium at a rate of 394, 500, 810, and 400 g per tree, respectively.

2.3. Treatments, Application Timing, and Experimental Design

Three acidifying agents—acetic acid (AC), CH3COOH; citric acid (CA), C6H8O7; and sulfuric acid (SA), H2SO4, 99.99%—were injected individually as soil applications. For each acidifying agent (AA), two doses were applied and compared with a control treatment (without AAs) (AC1 = 25 and AC2 = 50 cm3; CA1 = 25 and CA2 = 50 cm3; and SA1 = 25 and SA2 = 50 cm3). These doses were selected depending on the depth of the olive trees’ roots, which ranged from 100 to 120 cm; the soil pH in the study area; and the pH target to reach, as shown in Table 2. All the AAs applied were purchased from Sigma Aldrich, St. Louis, MO, USA. The acidifying agents were prepared via dilution in 20 L of irrigated water and applied to the soil around the tree trunk three times in the middle of March, May, and July during the 2018 and 2019 seasons. The main experimental plots were arranged according to the two doses of the three acidifying agents, in addition to the untreated trees. Thus, there were (3 acidifying agents × 2 doses) six treatments and one control treatment (a total of seven treatments), and each plot included 3 trees that were ordered according to the randomized complete block design (RCBD).

2.4. Soil Sampling and Determination of Chemical and Physical Properties

Soil samples were taken from five consecutive depths (0–25, 25–50, 50–75, 75–100, and 100–120 cm) in the root system area before AA application (in February 2018 and 2019) and transferred to the Soil, Water, and Plant Analysis Laboratory (SWPA) at the Faculty of Agriculture, Fayoum University, for the characterization of the chemical and physical properties, as shown in Table 3. The following properties were analyzed: soil texture was determined using the hydrometer method [38]. Soil pH and soil electrical conductivity (ECe) were determined from the saturation soil paste and extract soil paste using a pH meter (Jenway, UK) and an EC meter (LF 191 Conduktometer, Germany), according to [39,40], respectively.
The calcium carbonate (CaCO3%) content was determined using a Collin’s calcimeter, as described in [39]. The soil organic matter (SOM) was measured according to [41], Walkely and Black’s method.
Soluble cations, such as Na+, K+, Ca2+, and Mg2+, were extracted with ammonium acetate 1 M NH4CH3CO2, while Na+ and K+ were determined using a flame photometer [42]. On the other hand, both Ca2+ and Mg2+ were measured via the EDTA titration method. Soluble anions, such as HCO3, CO32−, and Cl, were determined via the titration method described by [39]. The SO42− ions were calculated as the difference between the total soluble cations and anions. In addition, the macronutrients nitrogen (N), phosphorus (P), and potassium (K) were determined using the methods described by [43,44].

2.5. Physiological and Growth Parameters

One-year-old shoots were randomly collected from each side of the orchard trees to measure shoot length (ShL, cm), the average number of leaves per meter (NLf), and the leaf area (LA, cm2) of the third and fourth leaves from the top of the new spring shoots, which were estimated using a digital planimeter device (Planx 7 Tamaya).
The relative chlorophyll content (SPAD reading) was determined using a SPAD-502 m device (Minolta, Osaka, Japan). The variable fluorescence by maximum fluorescence (fv/fm) and the photosynthetic performance index (PPI) were measured using a fluorimeter (Handy PEA, Hansatech Instruments LTd., Kings Lynn, UK) as described by [45,46].

2.6. Evaluation of Leaf Nutrient Content

Random leaf samples were taken from twenty shoots selected from each tree, transferred to the laboratory, washed with distilled water, oven-dried at 70 °C to constant weight (72 h), and crushed to determine the N, P, K, Na, Ca, and Mg, as described by A.O.A.C, 2005. In addition, the total contents of Fe, Mn, Zn, and Cu were determined via inductively coupled plasma-optical emission spectrometry (ICP-OES, Perkin-Elmer OPTIMA-2100 DV, Norwalk, CT, USA), according to the methods described by Baird et al. [47].

2.7. Statistical Analysis

All parameters studied were analyzed according to a randomized complete block design (RCBD) with four replications. An analysis of variance (ANOVA) was conducted using the GenStat software, 12th edition [48]. Mean values were calculated using Duncan’s multiple range test. Correlation was determined by the calculation of Pearson’s linear correlation coefficient (r).

3. Results

3.1. Effect of Acidifying Agents on Soil pH Values

Initially, the tested soil was characterized as moderately alkaline, similar to the native soil (7.78 vs. 7.89) but also possessing some undesirable characteristics, such as high CaCO3 content (9.1 vs. 9.8%) and salinity (ECe; 6.5 vs. 7.4 dS m−1), which effectively contributed to raising its alkalinity, as shown in Table 3. The data presented in Figure 1 show the soil pH values obtained as a result of the application of the acidifying agents (acetic acid (AC1 = 25 and AC2 = 50 cm3), citric acid (CA1 = 25 and CA2 = 50 cm3), and sulfuric acid (SA1 = 25 and SA2 = 50 cm
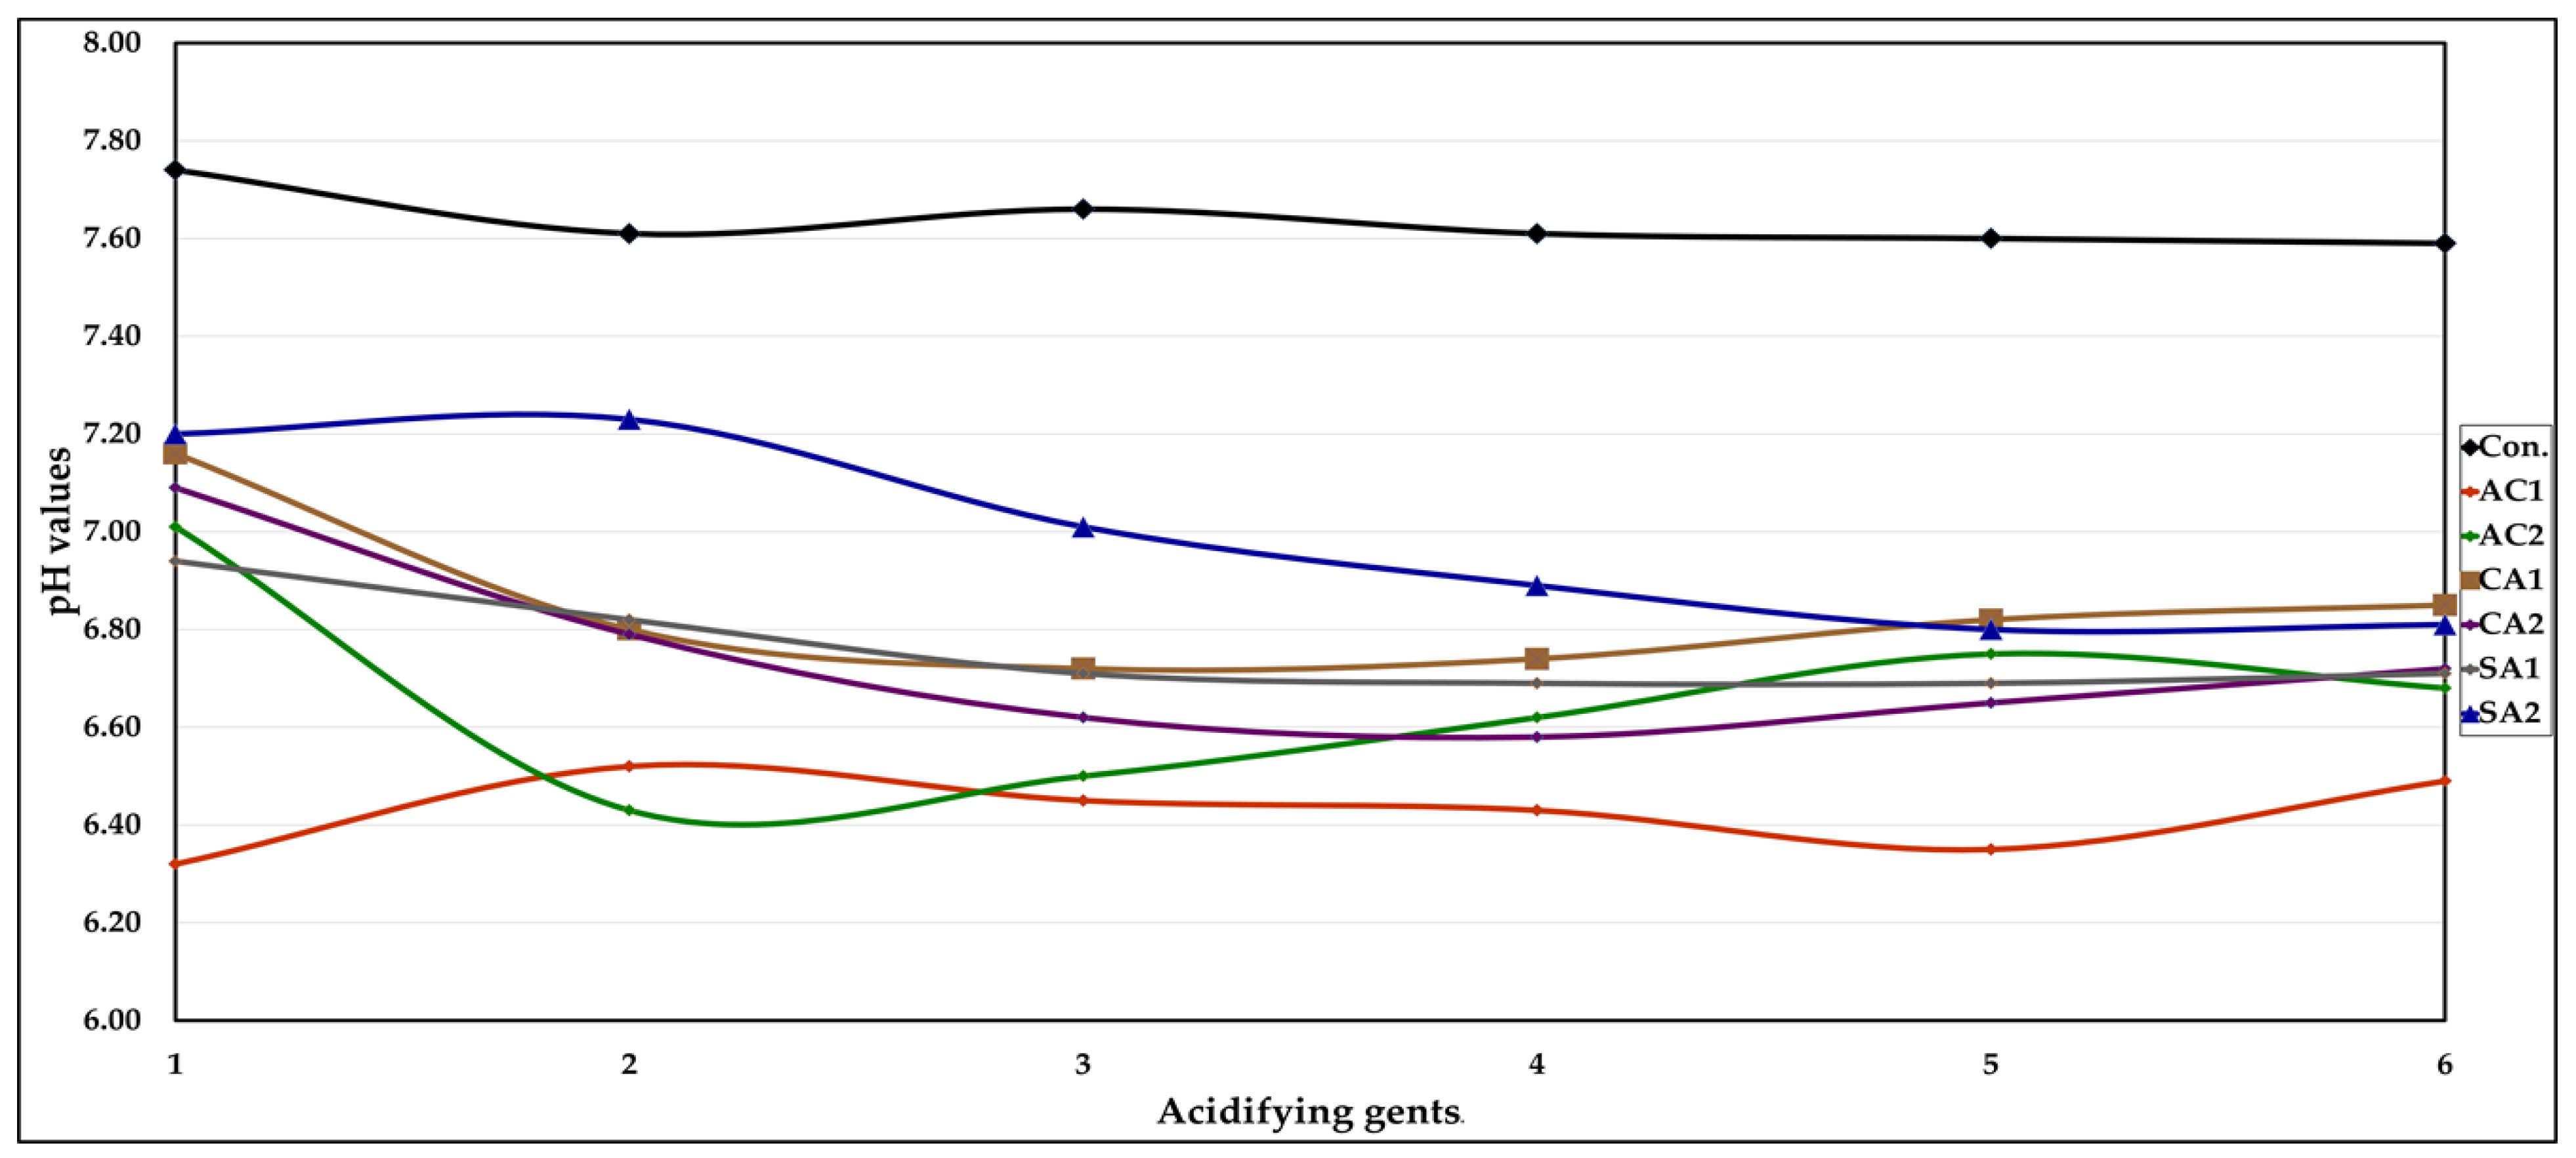
3)), in comparison with those of the untreated soil (Con.) tested in this investigation. The overall trend indicated that the acidifying agents appreciably decreased the soil pH values; however, this occurred at different rates depending on the type of acidifying agent used and the application dose.
It can be seen from the graphical representation of the data that the AC1 treatment resulted in the lowest pH values (6.30 vs. 6.29) immediately after injection (i.e., on the first day), when compared to the other acidifying agents. Furthermore, the soil pH values oscillated, increasing and decreasing, such that there was no stable tendency observed. The lowest pH values detected were 6.30 vs. 6.29 for AC1; 6.43 vs. 6.47 for AC2; 6.72 vs. 6.73 for CA1; 6.58 vs. 6.60 for CA2; 6.69 vs. 6.70 for SA1; and 6.80 vs. 6.82 for SA2 for the 2018 and 2019 growing seasons, respectively.
In addition, decreasing percentages of the highest and lowest values were also observed: 3.37 vs. 3.82 for AC1; 8.27 vs. 7.97 for AC2; 6.15 vs. 6.14 for CA1; 7.19 vs. 7.04 for CA2; 13.57 vs. 15.51 for SA1; and 5.56 vs. 4.75 for SA2 in both seasons, respectively.
The results obtained from the statistical analysis revealed highly significant differences in soil pH with all the acidifying agents applied and a non-significant impact with the control treatment, where the changes in pH were very limited.

3.2. Leaf Macro and Micronutrient Content

The results shown in Table 4 indicate that all the applied acidifying agents appreciably improved the leaf macronutrient content. However, the highest leaf nitrogen content (LNC), with values of 2.50 vs. 2.32% in both seasons, and leaf sodium (LNaC), calcium (LCaC), and magnesium (LMgC) contents, with values of 0.65, 1.38, and 0.43%, respectively, in the first season, were only obtained with the application of CA2.
Furthermore, the plants treated with AC2 had the highest values (0.86 vs. 0.83%) for leaf potassium content (LKC) in both seasons and leaf calcium content (LCaC; 1.51%) in the second season only. While the application of sulfuric acid, irrespective of the applied concentration, was found to be the best treatment for leaf phosphorus content (LPC); maximum leaf values were achieved in the plants treated with SA1 and SA2 during the growing season (0.38 vs. 0.46%, respectively). Dissimilar data were observed for LNaC, LCaC, and LMgC in the second season; however, the highest values were produced in the untreated plants (Con.) and those treated with AC2 and CA1, (0.39, 1.51 and 0.47%, respectively). Concerning the lowest values, similar data were obtained, where the minimum values for LPC in the 2018 and 2019 growing seasons (0.26 vs. 0.25%, respectively) and LCaC in the 2018 season (1.12%) were only achieved in the untreated plants.
Furthermore, the values of 0.52 vs. 0.60% for LKC were produced with the SA2 soil treatment in the 2018 and 2019 growing seasons, respectively. Furthermore, the lowest values of LNC and LNaC were similar in each season. However, the SA1 treatment in the 2018 season and the CA1 treatment in the 2019 season had the least impact on both nutrients, with values of 0.89 vs. 0.39% and 1.07 vs. 0.25% in the first and second seasons, respectively. Moreover, the CA treatment, regardless of the concentration applied, had the weakest effect on LMgC, which was recorded as 0.18 vs. 0.15% for the 2018 and 2019 seasons, respectively. The results depicted in Table 4 show that the increment rates were 180.90 vs. 116.82 for LNC; 46.15 vs. 84.00 for LPC; 65.39 vs. 38.33 for LKC; 28.89 vs. 28.00 for LNaC; 23.21 vs. 60.64 for LCaC; and 138.89 vs. 213.33 for LMgC in the 2018 and 2019 growing seasons, respectively.
The analysis of variance indicated that all the treatments had a significant influence on LNC, LPC, and LNaC in both growing seasons and LKC, LCaC, and LMgC in the second season only at p ≤ 0.01. However, the impact on the contents of the latter three nutrients was significant in the first season at p ≤ 0.05.
As can be seen from Table 5, the use of the acidifying agents applied in this study significantly improved the content of the leaf micronutrients, except for the leaf iron content (LFeC); the highest values (389.67 vs. 449.67 mg kg−1) were produced in the untreated plants in both seasons. Furthermore, the general trends indicated that CA1 was the superior treatment for the leaf zinc content (LZnC) and the leaf copper content (LCuC) in both growing seasons, as well as the leaf manganese content (LMnC) in the first season only, with maximum values of 22.17 vs. 40.03 mg kg−1 for LZnC and 7.09 vs. 8.09 mg kg−1 for LCuC in the 2018 and 2019 seasons, respectively, and 22.17 mg kg−1 for LMnC in the 2018 season. The greatest value for LMnC (20.86 mg kg−1) was observed in the second season with the AC1 treatment.
The least impactful treatment was the control treatment, for which we recorded minimum values for LZnC (16 vs. 27.41 mg kg−1) and LCuC (2.25 vs. 3.25 mg kg−1) in both growing seasons, followed by the CA2 and SA1 treatments, with values of 167.00 vs. 198.50 mg kg−1 for LFeC and 14.75 vs. 16.75 mg kg−1 for LMnC in the 2018 and 2019 seasons, respectively. It can be seen from Table 5 that the increasing percentages of the highest and lowest values were 133.34 vs. 126.53 for LFeC; 50.31 vs. 23.46 for LMnC; 38.56 vs. 46.04 for LZnC; and 215.11 vs. 138.29 for LCuC in the 2018 and 2019 seasons, respectively. The results obtained from the statistical analysis showed highly significant differences among the studied micronutrients in both seasons.

3.3. Growth and Physiological Attributes

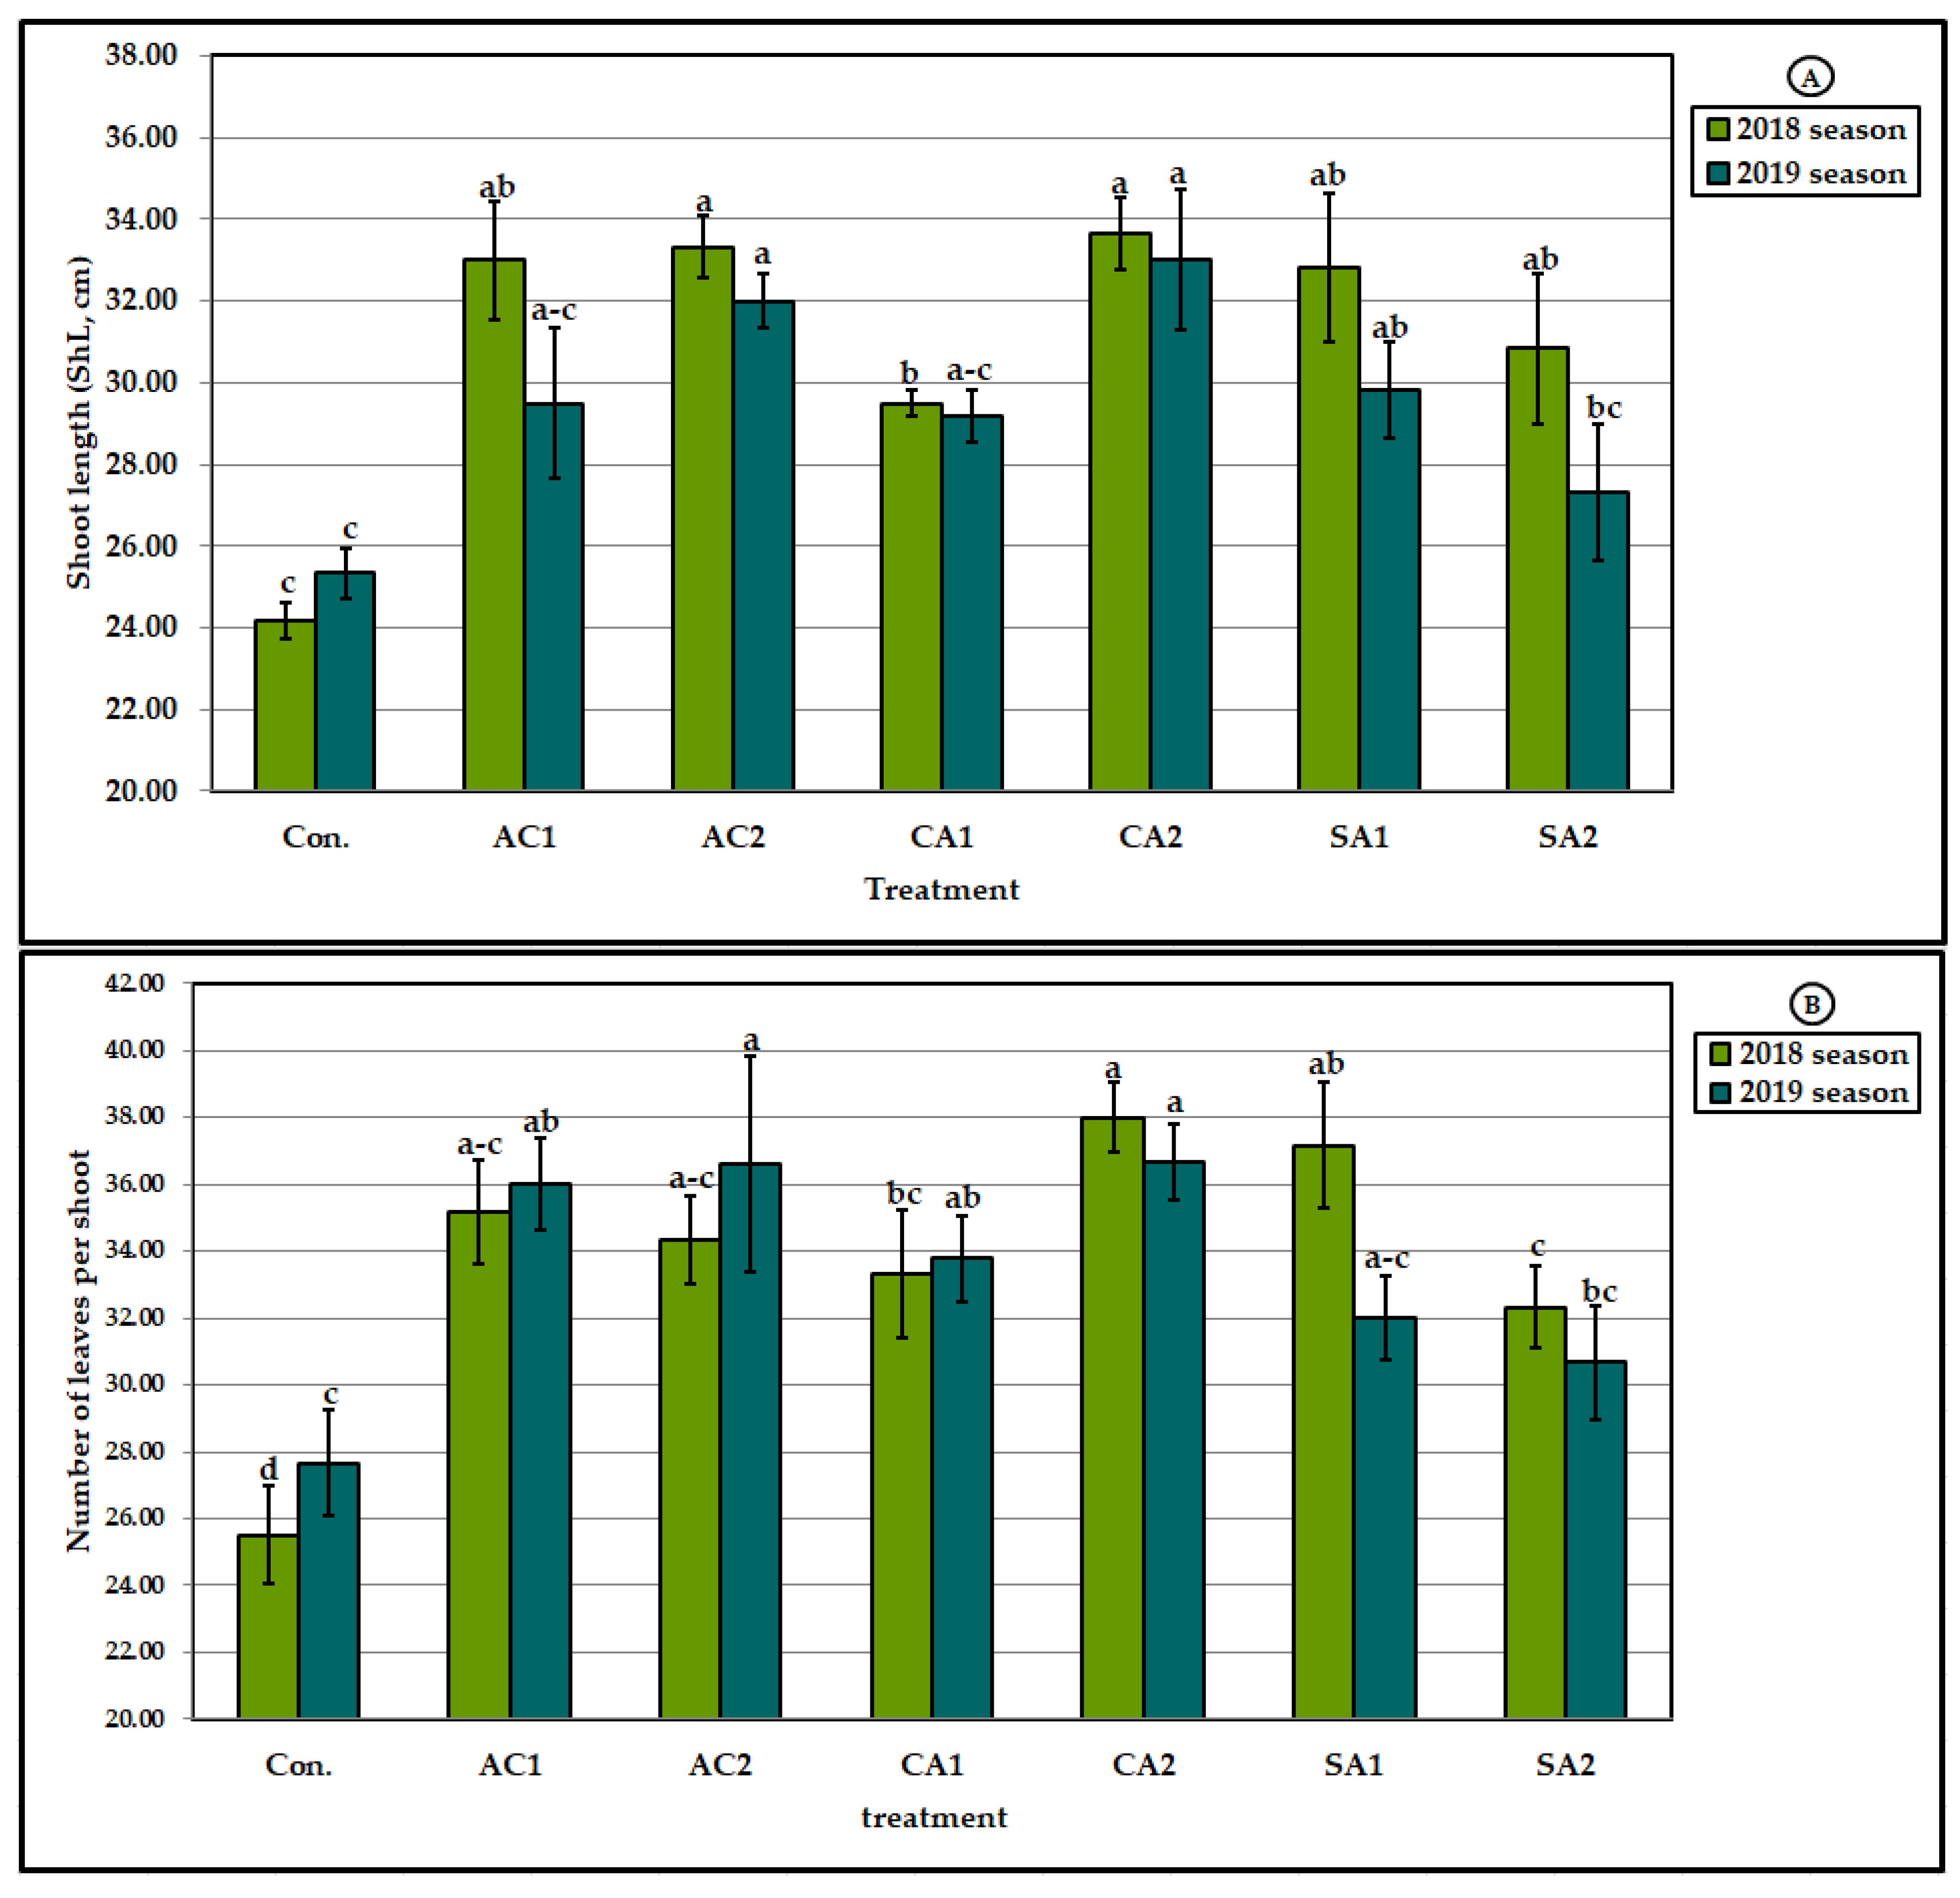
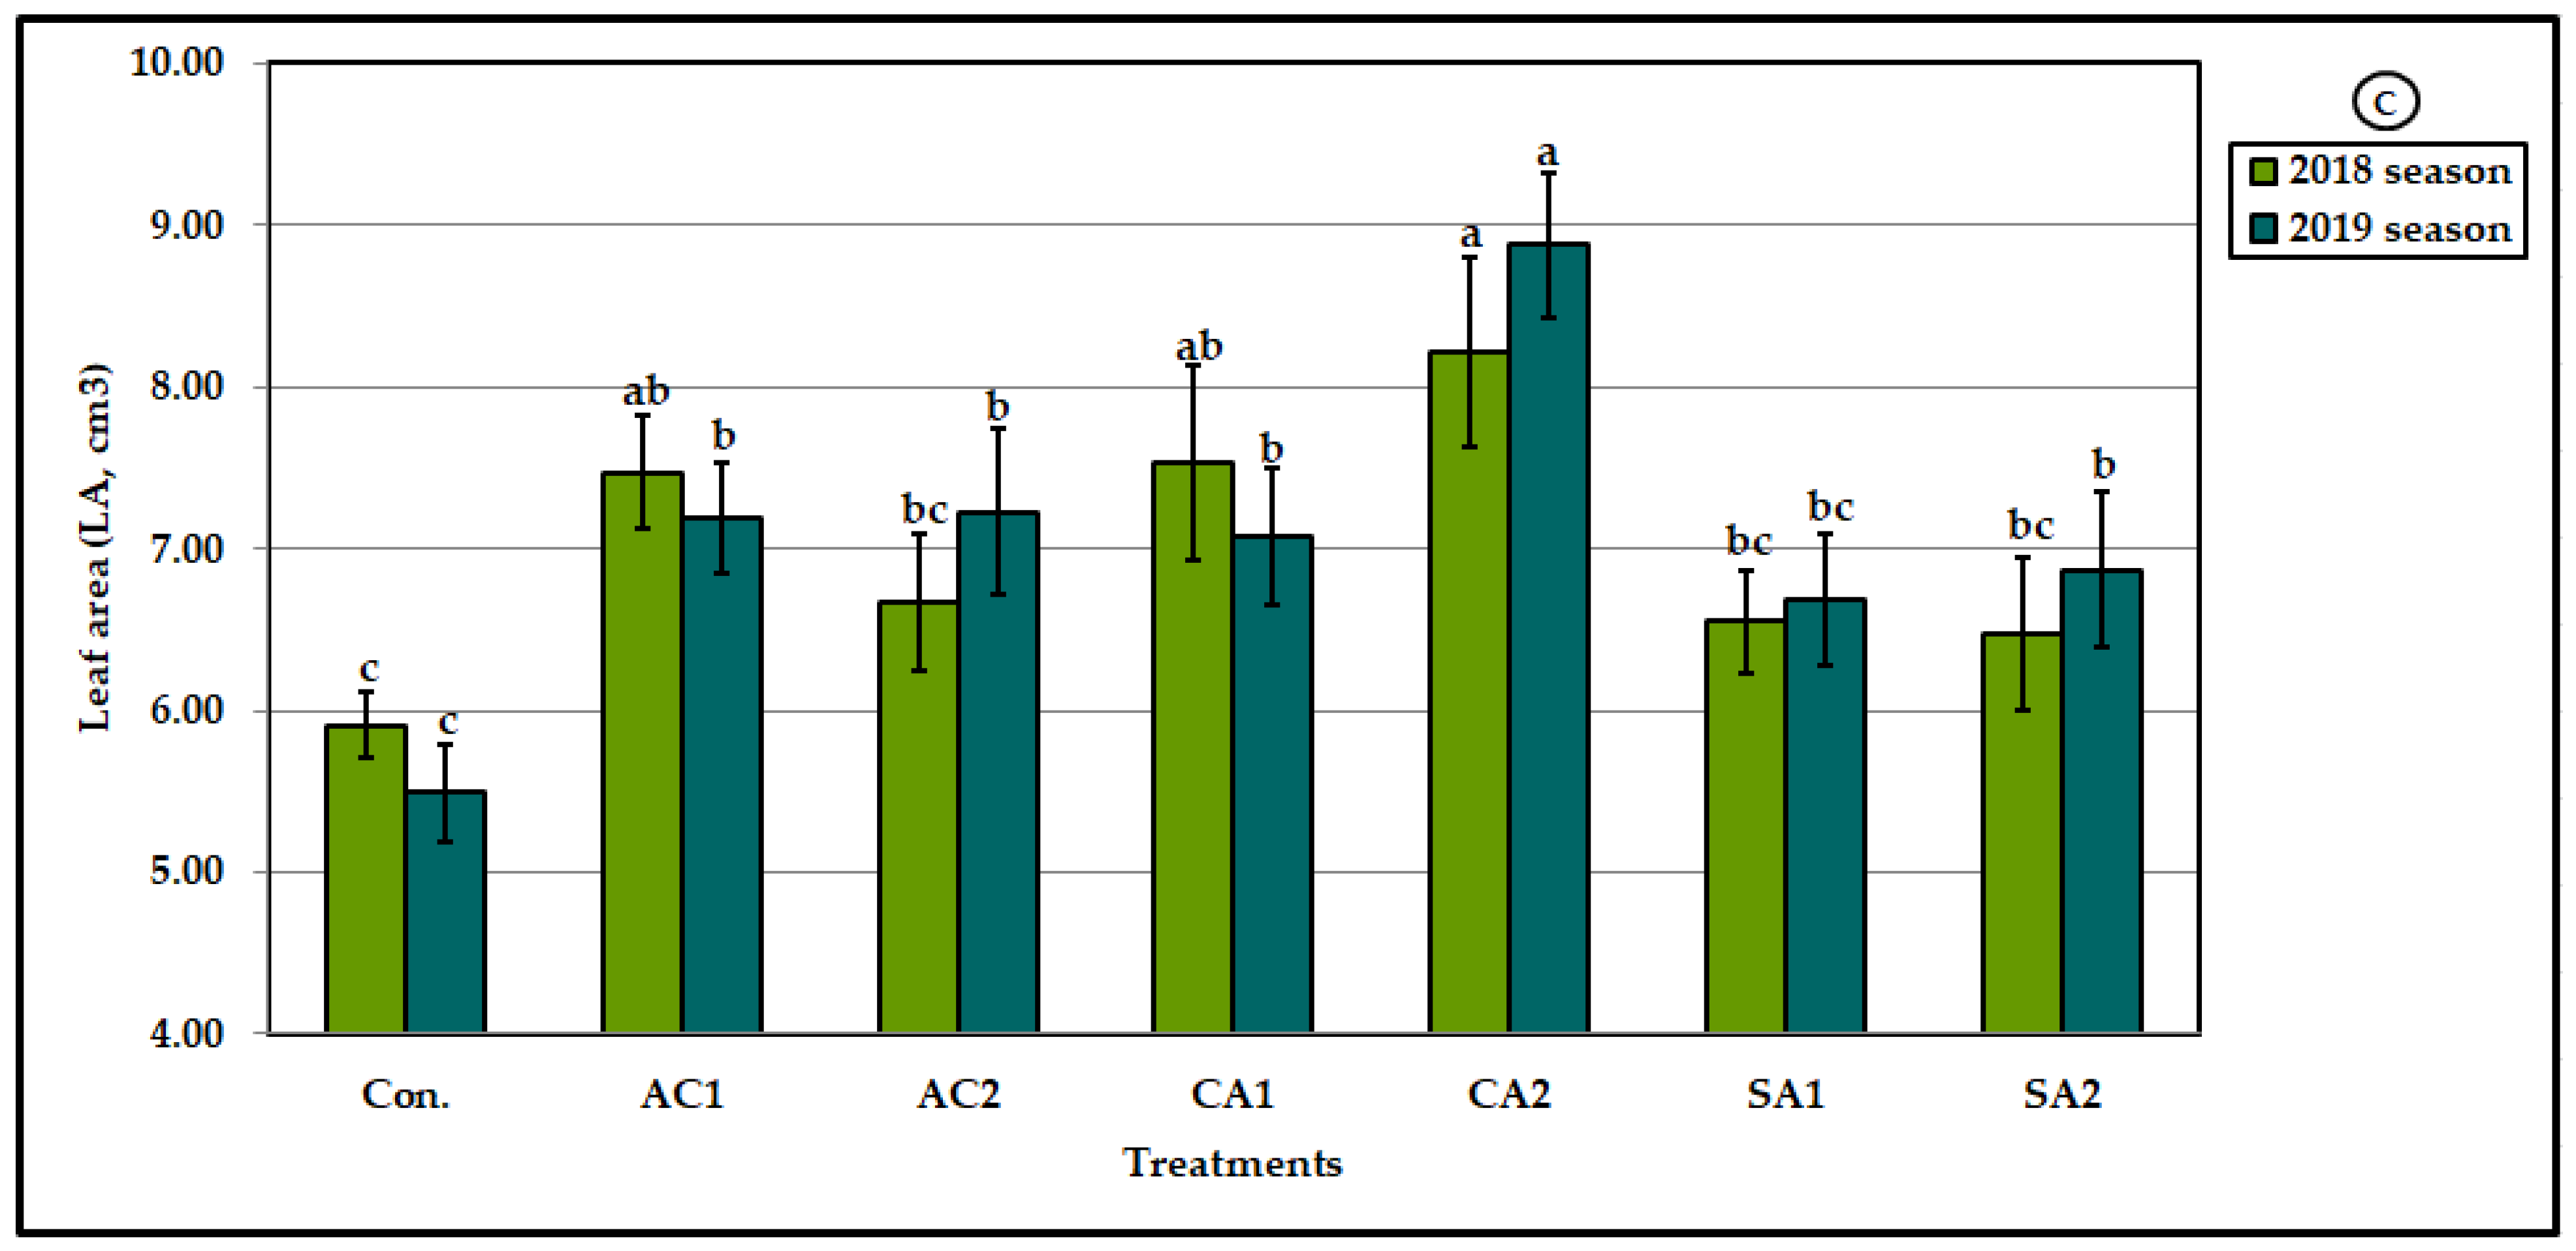
The data pertaining to the impact of the applied acidifying agents, irrespective of the doses, indicated that CA generally surpassed the other acids, as shown in (Figure 2A–C). In particular, the application of a high dose of CA (CA2) had the most desirable effect on all studied growth attributes except the number of leaves per m2 (NLf) in the 2019 season.
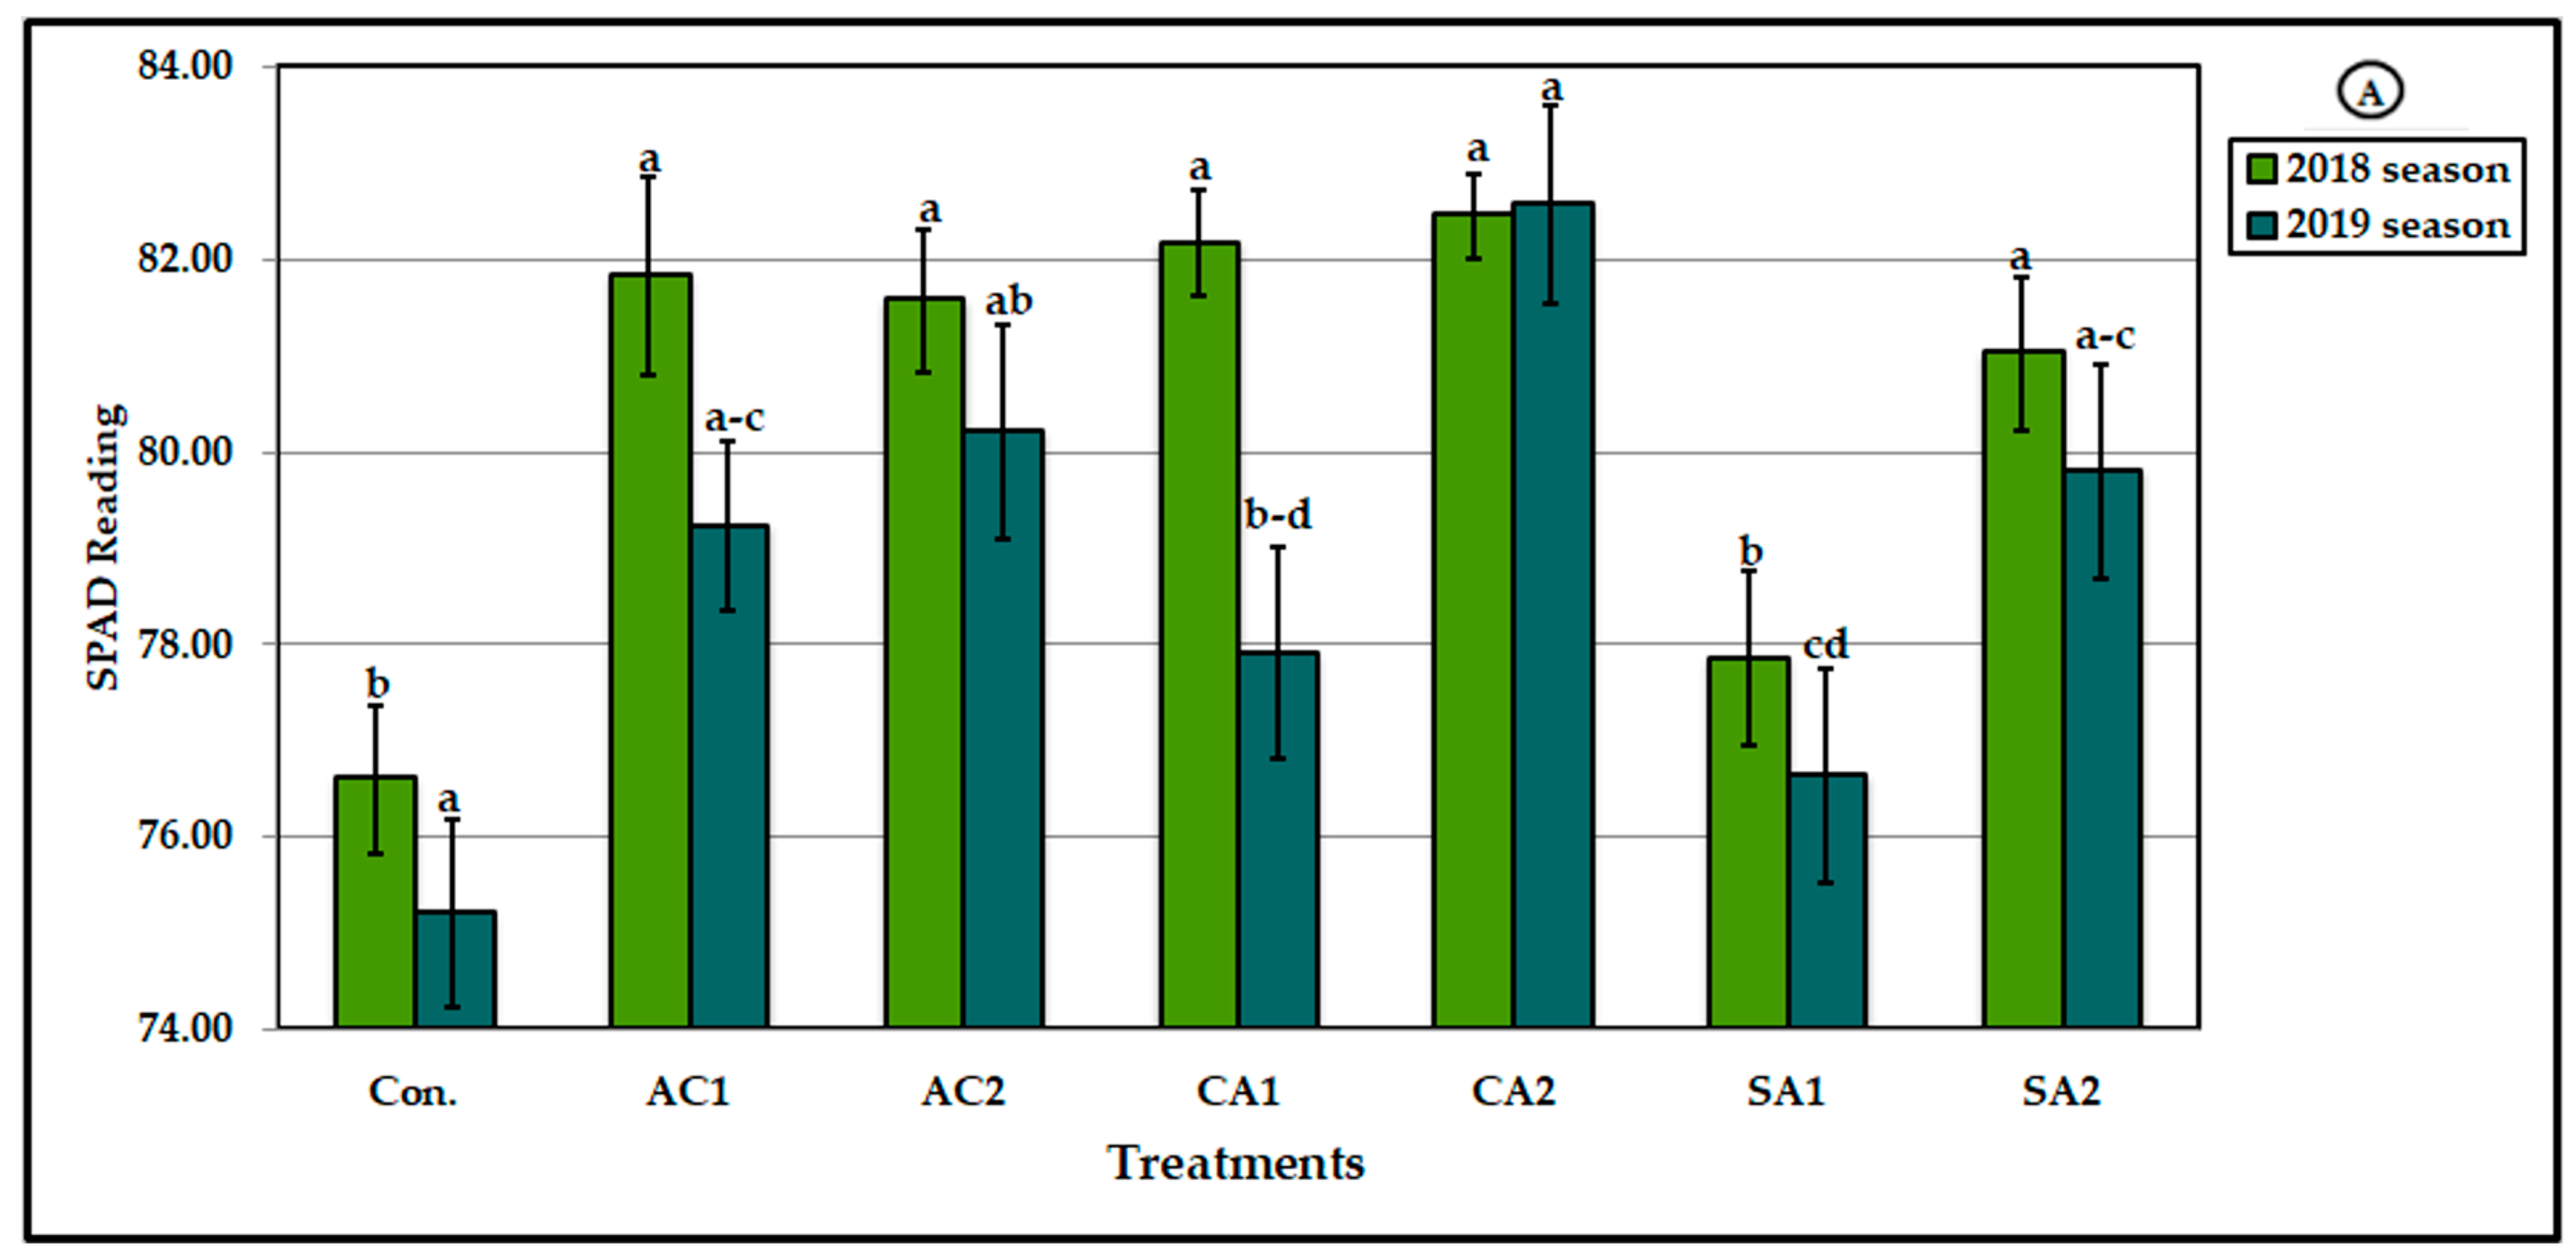
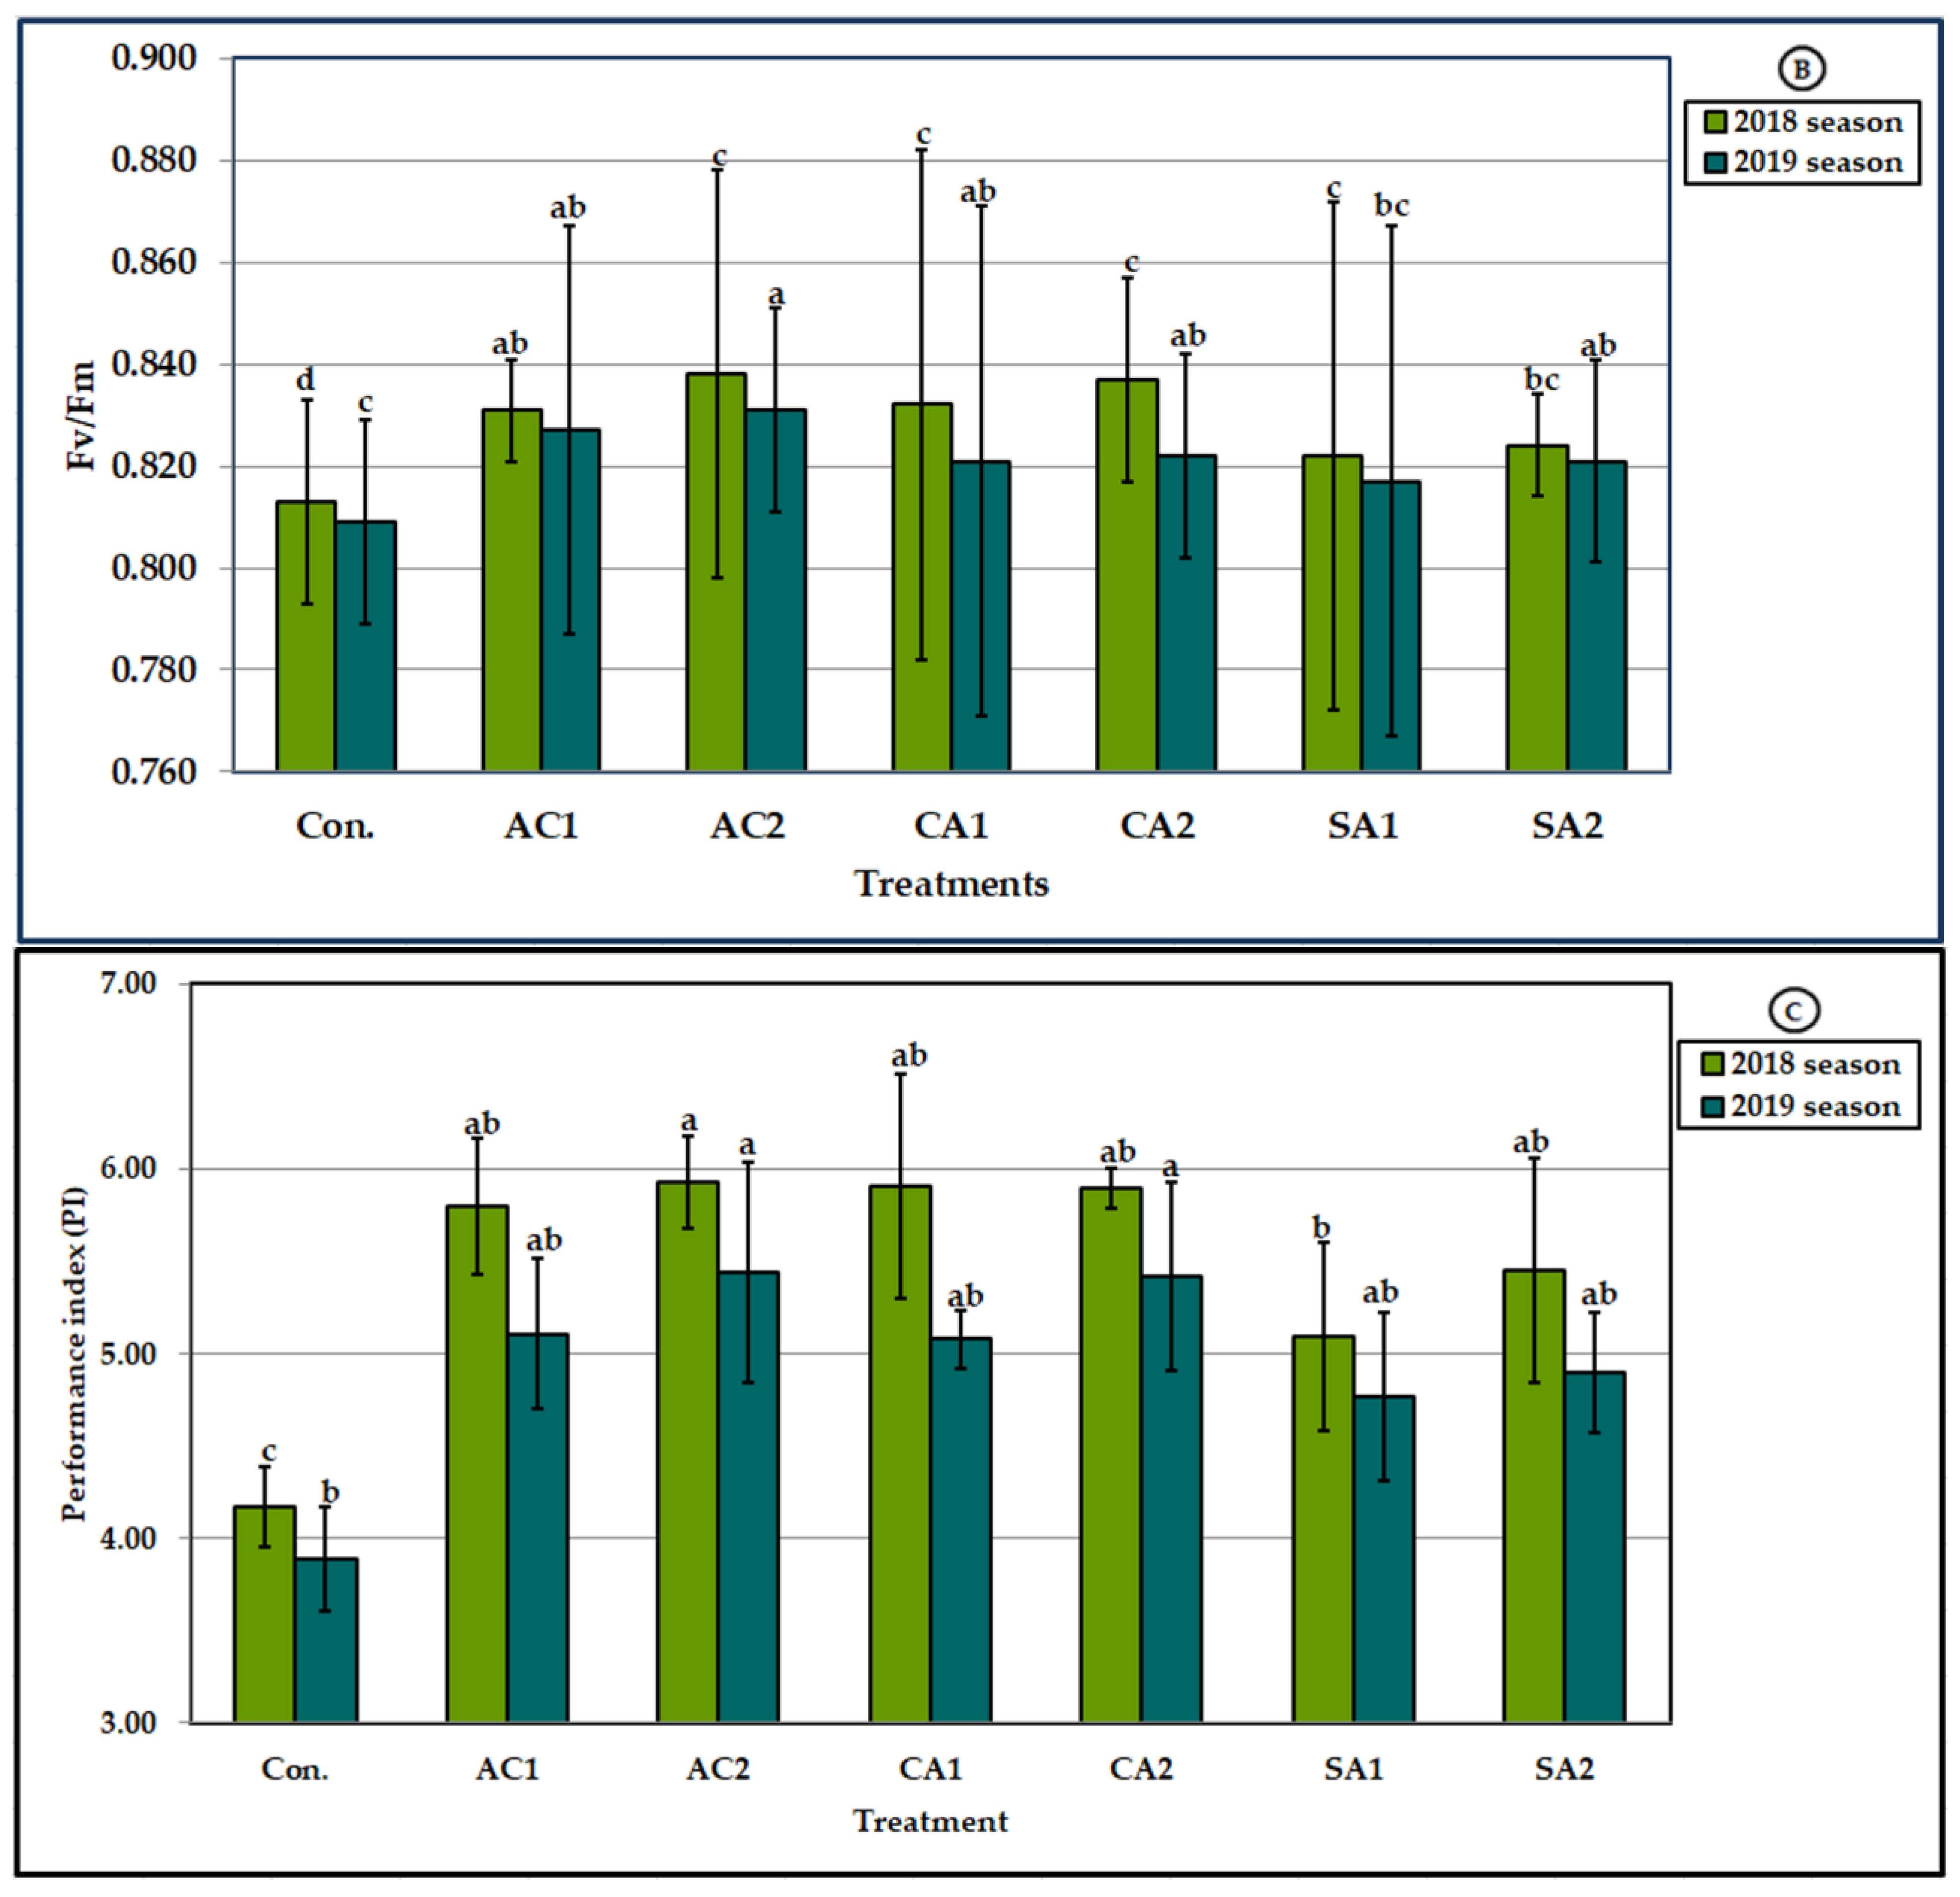
The results (Figure 3A–C) showed that all applied acids markedly increased the studied physiological parameters, including SPAD chlorophyll, Fv/Fm, and the performance index (PI). The data obtained indicated that the AC2 treatment was the superior treatment in both the 2018 and the 2019 seasons, with recorded values of 0.838 vs. 0.831 for fv/fm and 5.39 vs. 5.44 for PI and an increase in percentages of 3.08 vs. 2.72 and 42.21 vs. 39.85% when compared with the control treatment, which had the lowest values (0.813 vs. 0.809 for fv/fm and 4.17 vs. 3.89 for PI) in the 2018 and 2019 seasons, respectively. The plants treated with CA2 had the highest values (82.45 vs. 82.52) for SPAD, while the lowest values (76.60 vs. 75.20) were produced in the untreated plants. The increase in percentages was 7.64 vs. 9.80% for the 2018 and 2019 seasons, respectively.
The results of the ANOVA indicated that all treatments had a significant impact on the SPAD reading and Fv/Fm in the first season at p ≤ 0.01 and a significant influence on PI in the first season at p ≤ 0.05; non-significant effects were observed for the SPAD reading, Fv/Fm, and PI in the second season.

3.4. Fruit Parameters, Olive Oil Yield, and Table Olive Yield

According to the data displayed in Table 6, the studied parameters improved appreciably as a result of the acid treatments. The general trend indicated that the application of AC and CA, irrespective of the dose, resulted in the highest values when compared with SA. However, the maximum values (4.53 vs. 4.52 g), (36.80 vs. 35.51%), and (30.25 vs. 40.75 kg tree−1) for the total fruit weight (TFrW), olive oil content (OOC), and table olive yield (TOY), respectively, were observed in the plants treated with AC2 in both seasons.
Furthermore, the maximum values for the flesh weight (FlW) (3.68 vs. 3.72 g) and the percentage flesh weight on the total fruit weight (FTW) (81.75 vs. 81.65%) in both growing seasons were found in the plants treated with AC1 and CA2, respectively. Dissimilar data were obtained for the flesh dry weight (FDrM), fruit length (FrL), and fruit diameter (FrD). The plants treated with AC2 had the highest values for FlDrW (40.75%) and FrL (24.29 mm) in the first season. On the other hand, it was found that AC1 was the best treatment for FDrM (38.73) and FrD (16.76) in the second season. The application of the CA2 treatment gave the highest values for FrD in the 2018 season (17.86 mm) and FrL in the 2019 season (22.60 mm).
As presented in Table 6, the lowest values of all the studied parameters were recorded with the control treatment (Con.), except for FDrM and OOC in the second season (33.09 and 34.40, respectively). As shown in Table 6, the untreated plants had values of 3.29 vs. 3.41 for TFrW; 2.56 vs. 2.66 for FlW; 77.88 vs. 77.99 for FTW; 19.68 vs. 19.11 for FrL; 14.21 vs. 13.74 for FrD; and 23.00 vs. 31.50 for TOY. The increasing percentages of the maximum and minimum values were 37.69 vs. 25.75 for TFrW, 43.75 vs. 39.85 for FlW, 4.74 vs. 4.69 for FTW, 12.49 vs. 17.04 for FDrM, 23.43 vs. 18.26 for FrL, 25.69 vs. 21.98 for FrD, 10.48 vs. 9.60 for OOC, and 31.52 vs. 29.73 for TOY.
The results obtained from the statistical analysis indicated significant differences among some studied parameters at p ≤ 0.01, including TFrW, FlW, FTW, FDrM, and OOC, in both growing seasons. Furthermore, significant effects were found for FrD and TOY at p ≤ 0.05 in both seasons and FrL in the first season, while a non-significant influence was found for FrL in the second season.

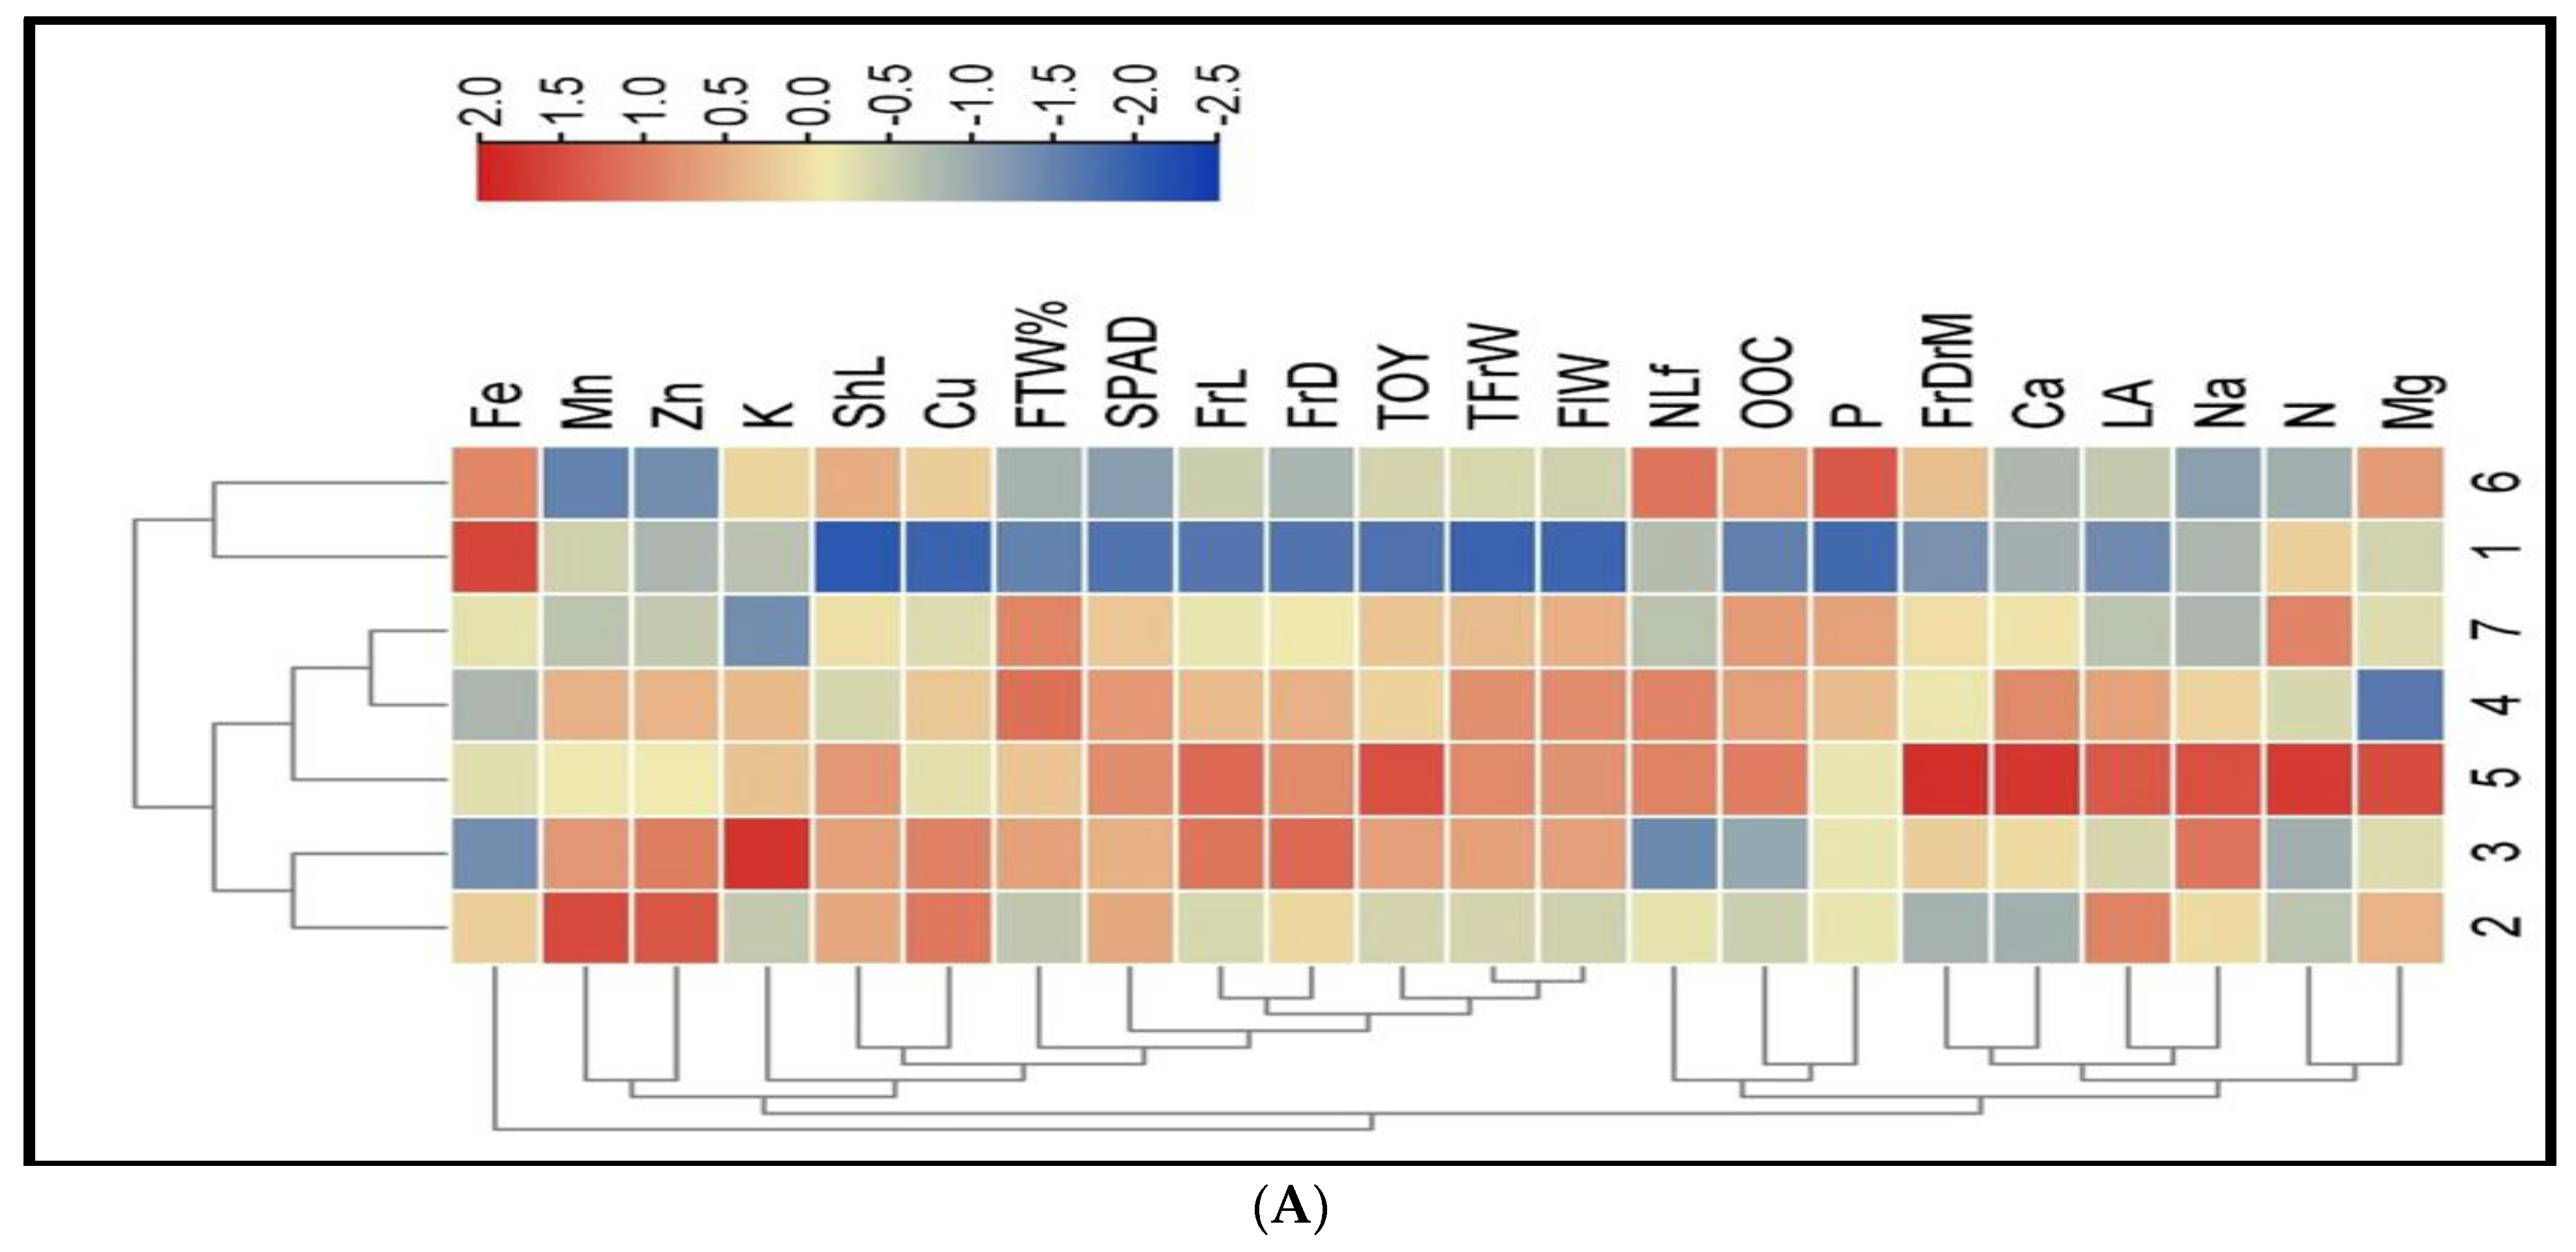
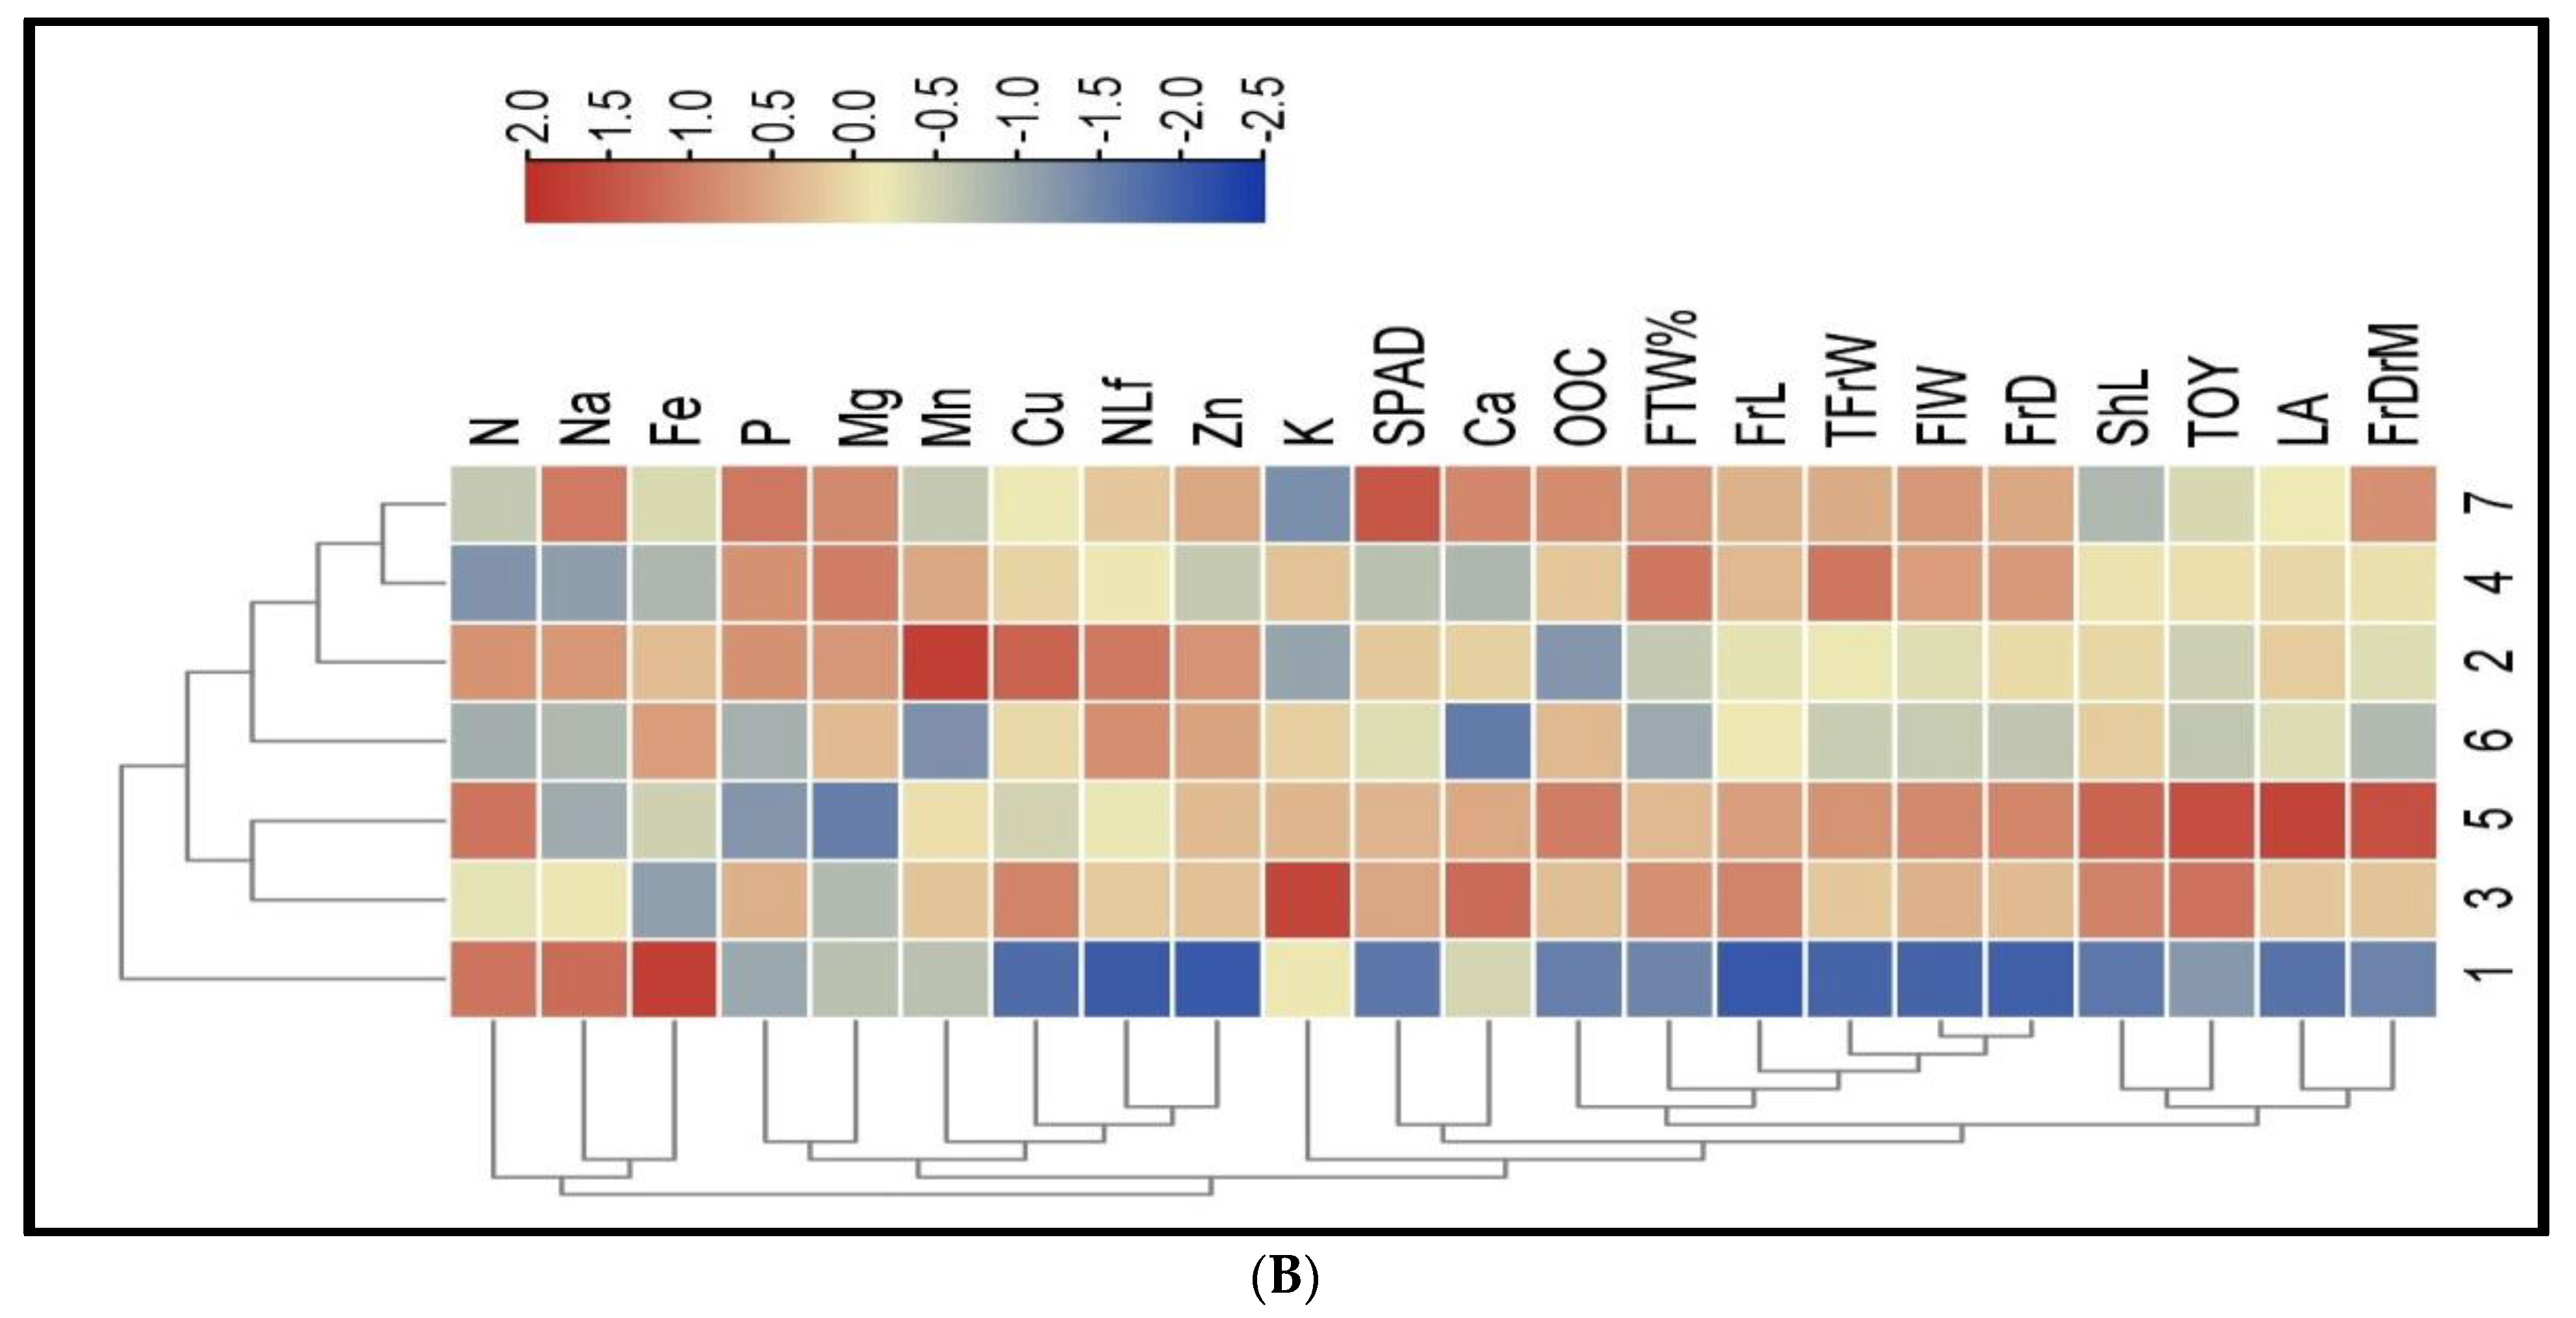
3.5. The Heat Map of Correlation Coefficient and Stepwise Regression

The results of the correlation analysis between the leaf nutrient contents (N, P, K, Ca, Mg, and Na), the physiological and growth parameters (ShL, NLf, LA, and SPAD reading), and the yield and its attributes (TFrW, FrL, FrW, FrDrM, FiW, and TOY) are shown in (Figure 4A,B).
The results obtained from the stepwise regression analysis, presented in Table 7, mention the relationship between the olive oil content (OOC,%) and the total olive yield (TOY, kg) as the dependent variables and the leaf macro- and micronutrients, the physiological and growth parameters, and the yield components as the independent variables of the olive plants (Picual cv.) grown under multi-abiotic stresses in the 2018 and 2019 seasons. Our results indicate that the variations in OOC are explained by the variations in the leaf nitrogen (LNU) and phosphorus uptake (LPU) in the first season and the leaf manganese uptake (LMnU) in the second season, while the differences in TOY were explained on the basis of the total fruit weight (TFrW) in the 2018 season and the shoot length (ShL) and number of leaves (NLf) in the 2019 season. In both seasons, most of the studied parameters contributed effectively to OOC and TOY. The adjusted R2 values were (r= 0.671 vs. 0.708) for OOC and (r = 0.551 vs. 0.897) for TOY in the 2018 and 2019 seasons, respectively.

4. Discussion

Soil pH is a very important property for plant growth and development due to its direct influence on nutrient availability. However, available information regarding this subject is still scarce and incomplete. In Egypt, excessive alkalinity is an inherent problem associated with many factors, the most important of which is the prevailing climate conditions, including high temperature and low precipitation, as presented in Table 1. Furthermore, the nature of the parent material and the predominance of basic cations, such as Ca2+, Mg2+, and Na+, and their accumulation also have an effect on soil pH. In addition, unsuitable fertilization practices, such as applying alkaline fertilizers, can increase alkalinity, despite the high buffering capacity of the soil. The main method of our study relied on determining leaf nutrient contents as a measure of nutrient availability in the soil, which in turn affects physiological processes and improves the total yield and its attributes. The results presented in Figure 1 clearly show that the AC1 treatment more quickly reduced the soil pH when compared to the other AAs. This significant decrease in soil pH was observed from the first day of injection. Although the pH values fluctuated between increase and decrease from the second to the sixth day, the increase was slight. These findings could be attributed to the ionization of the H+ ions of the carboxyl group (-COOH) being faster than that of the other acidifying agents; then, the decrease in pH would be observed. Regarding the control treatment, the results obtained suggested that the soil pH decreased, but in a non-significant manner. This slight decrease could be attributed to the decomposition of H2O molecules into OH and H+ ions in soil and the subsequent adsorption of H+ ions on soil particles as a result of the ion substitution between H+ and the other base ions, such as Ca2+, Mg2+, and Na+. In both seasons, the general trend of our findings indicated that the acidifying agents could be ranked in descending order as follows: AA1 > AA2 > CA2 > CA1 > SA1 > SA2. The effect of the application of both AC and CA surpassed that of SA due to the fact that organic acids have a buffering influence, owing to their high ion exchange capacity [49].
The results shown in Table 4 reveal that CA, irrespective of the dose applied, was more influential in improving the leaf nitrogen (LNC) and magnesium content (LMgC) in both seasons, as well as the leaf calcium content (LCaC) in the first season, when compared with the other AAs. In other words, the increase in LCaC, LNaC, and LMgC may have been due to a disturbance of the ion balance by the acetate (-COOH) anion [50]. These results are in agreement with those of [51], who reported that the addition of increased levels of CA caused an increase in the nutrient content of wheatgrass plants, in addition to a significant decrease in soil pH. Furthermore, it was observed that the rate of decrease in soil pH increased with increasing molarity, although there was no strong evidence to support this assumption. Among the AAs applied, the SA treatment—whether applied at a low dose (as in the first season) or a high dose (as in the second season)—led to significant improvements in LPC. These enhancements are likely due to the pivotal role of SA in dissolving calcium, which is the element most closely related to P ions under alkaline soil conditions [52]. The reaction of H2SO4 with CaCO3 can occur according to the first equation (open reaction) or the second equation (closed reaction) as follows:
H2SO4 + CaCO3 → Ca2+ + SO42− + CO2 + H2O
H2SO4 + 2CaCO3 → 2Ca2+ + SO42− + 2HCO3
As can be seen from in Equation (2), the efficiency of the SA application in the amelioration of high soil pH may be due to the considerable amounts of hydrogen carbonate (HCO3) ions formed in the closed reaction. In other words, SA, irrespective of the dose applied, introduces SO42− and replaces Ca2+ with Na+ in the soil colloids [53,54]. In addition, CA has a high ionic ability to form complexes with soil nutrients [55].
Concerning the leaf micronutrient contents, as shown in Table 4 and Table 5, the results obtained indicated that the AC treatment, regardless of the dose applied, had the greatest influence on the contents of most of the studied nutrients. It was also observed that the higher dose (AC2) was associated with improved macronutrient measures, as was seen for LKC in both seasons and LCaC in the second season only. Conversely, the lower dose of CA (CA1) was strongly related to increases in most of the studied micronutrients except for LFeC, including LMnC, LZnC, and LCuC, in both seasons. These findings could be explained by AC being too rapidly oxidized in the soil, which would cause a decrease in the soil pH values [56]. On the other hand, the decrease in LFeC could be due to competition for sorption sites. However, the accumulation of micronutrients depends not only on soil pH but also on other environmental factors [57]. Another explanation could be that AC is synthesized as a result of its small size and role in the tolerance to abiotic stresses [58]. These findings were confirmed in the studies by [59] on ryegrass plants, where AC production was shown to be enhanced for tolerance to salt stresses through hormone and antioxidant metabolism, improving K+/Na+ homeostasis. Furthermore, ref. [60] suggested that the improved effect of AC could perhaps be due to its large volume, which makes it difficult for it to enter the soil pores.
The results for the leaf nutrient contents were closely related to the improvement in the vegetative growth parameters (ShL, NLSh, and LA (Figure 2A–C) and physiological performance (SPAD reading, fm/fv, and PI (Figure 3A–C) of the olive trees. However, a significant increase in plant growth resulted from the application of a high dose of CA (CA2), which played a significant role in decreasing soil pH and thus increasing the availability of some nutrients in the soil, subsequently enhancing LNC and LMgC. The obvious response to the application of N to olive trees was previously supported by the results of the studies by [61,62], in addition to its conspicuous roles in contributing to the formation of the chlorophyll molecule [63]. Furthermore, the vital role of Mg should be noted: it is a cofactor for many physiological processes that activate phosphorylation, and it is essential for amino acid and fat synthesis [64] and glutathione RNA polymerase, phosphatase, ATPase, and protein kinase activities [65,66]. In their previous studies, refs. [67,68,69] indicated the significant role of N in enhancing horticultural crops, in addition to its crucial role in the plant metabolism system, by increasing leaf area production and promoting photosynthetic processes. In addition, the influential role of Mg in carbohydrate formatting should also be mentioned [70]. In other words, the appreciable enhancements of all plant physiological and growth characteristics could perhaps be due to the improved influence of AC on micronutrient availability (except Fe), resulting from a significant decline in soil pH values, as presented in Table 5. In this context, the positive physiological impact of micronutrient availability was explained by several researchers [71,72,73,74]. Zn is known to be an essential component for many enzymes, such as carbonic anhydrase, and a principle component in tryptophan and indole acetic acid synthesis. Mn is an active component of the water-splitting system of photosystem II. Furthermore, Cu plays a crucial role in photosynthesis and the respiration and metabolism of N and carbon. Although most studies have indicated the positive effect of N on enhancing vegetative growth parameters, the findings of [75] were not in agreement with the majority; the authors reported that N had adverse impacts on root length. Furthermore, the application of AC increased IAA under abiotic stresses [59,76]. The only exception in our results is that SA provided the best results in terms of LPC. Although SA only had a slight effect on lowering soil pH when compared with the other AAs applied, it was the most influential for P uptake by plants. According to the studies by [77,78] on olive trees, P promotes new shoot growth and many physiological processes, such as cell division and the fixation of carbon from carbon dioxide during photosynthesis. These findings were in line with those of a study by [52] on sweet potato plants, which indicated that P played a crucial role in improving physiological and growth parameters. From our point of view, the minimum values for soil pH of 6.69 and 6.70 in the 2018 and 2019 seasons, respectively, as a result of the application of SA1 and SA2, prevented P fixation and reduced its linkage with the Ca2+ ions in the soil solution.
As a result of the positive influences of the application of AAs on the uptake of nutrients—either macro- or micronutrients, as reflected in the growth and physiological parameters—we observed that the total olive yield (TOY) and its attributes, in addition to the olive oil content (OOC), improved, as shown in Table 6. Our results evidently showed that the olive trees responded to the decrease in soil pH that resulted from the application of AAs as compared to the control treatment. The significant improvement in TOY and its attributes as well as the OOC of the Picual trees resulted from the positive effect of the AAs on the reduction in soil pH, which in turn improved the availability of the nutrients in the soil, enhancing their absorption, as shown in Table 4 and Table 5. This trend was observed in our current investigation, where the control trees showed a significant decline in leaf nutrient contents, which, in turn, negatively affected TOY and its attributes.

5. Conclusions

Among the chemical properties of soil, pH is considered to be the most important due to its direct effect on nutrient solubility. Furthermore, simply controlling or changing soil pH is considered to be a very difficult task owing to the soil’s buffering capacity, which resists any changes in pH. In addition, most nutrients have an optimal pH range between 6.0 and 6.5 with respect to their availability [79], which varies according to the element’s behavior. In general, our results showed that all the studied AAs surpassed the control treatment in terms of reducing soil pH values. Furthermore, the daily soil pH measurements taken over the 6 days following application indicated that the AC treatment was faster in reducing soil pH values, while the CA treatment provided the most stable effect. Based on our work, the trees grown in soil injected with CA, followed by those treated with AC, gave the most desirable results when compared with the control treatment, which resulted in maximum leaf iron content, while the SA treatment provided maximum leaf phosphorus content in both seasons. In short, the results of our investigation can be summarized as the effectiveness of the treatments ranked and arranged in descending order, as follows: AC1 > AC2 > CA2 > CA1 > SA1 > SA2.

Author Contributions

Conceptualization, H.A.Z.H. and H.R.B.; data curation, A.A.M.A., H.A.Z.H. and H.R.B.; formal analysis, A.A.M.A. and H.A.Z.H.; investigation, H.A.Z.H., A.A.M.A. and H.R.B.; methodology, A.A.M.A. and H.A.Z.H.; resources, H.A.Z.H. and H.R.B.; software A.A.M.A. and H.R.B.; writing—original draft, A.A.M.A.; writing—review and editing, A.A.M.A. and H.A.Z.H. All authors have read and agreed to the published version of the manuscript.

Funding

This research received no external funding.

Data Availability Statement

The data presented in this study are available upon request from the corresponding author.

Conflicts of Interest

The authors declare no conflict of interest.

References

  1. Ruan, J.; Ma, L.; Shi, Y.; Han, Y. The Impact of pH and calcium on the uptake of Fluoride by tea plants (Camellia sinensis L.). Ann. Bot. 2004, 93, 97–105. [Google Scholar] [CrossRef]
  2. McCauley, A.; Jones, C.; Jacobsen, J. Soil pH and organic matter. Nutr. Manag. Modul. 2009, 8, 1–12. [Google Scholar]
  3. Jackson, K.; Meetei, T.T. Influence of soil pH on nutrient availability: A review. J. Emerg. Technol. Innov. Res. 2018, 5, 707–713. [Google Scholar]
  4. Zhang, Y.-Y.; Wu, W.; Liu, H. Factors affecting variations of soil pH in different horizons in hilly regions. PLoS ONE 2019, 14, e0218563. [Google Scholar] [CrossRef]
  5. Schomberg, H.H.; Steiner, J.L. Estimating crop residue decomposition coefficients using substrate-induced respiration. Soil Biol. Biochem. 1997, 29, 1089–1097. [Google Scholar] [CrossRef]
  6. Kheir, A.M.S.; Shabana, M.M.A.; Seleiman, M.F. Effect of Gypsum, Sulfuric Acid, Nano-Zeolite Application on Saline-Sodic Soil Properties and Wheat Productivity under Different Tillage Types. J. Soil Sci. Agric. Eng. Mansoura Univ. 2018, 9, 829–838. [Google Scholar] [CrossRef]
  7. Chytrỳ, M.; Danihelka, J.; Ermakov, N.; Hájek, M.; Hájková, P.; Kočı, M. Plant species richness in continental southern Siberia: Effects of pH and climate in the context of the species pool hypothesis. Glob. Ecol. Biogeogr. 2007, 16, 668–678. [Google Scholar] [CrossRef]
  8. Ji, C.-J.; Yang, Y.-H.; Han, W.-X.; He, Y.-F.; Smith, J.; Smith, P. Climatic and edaphic controls on soil pH in alpine grasslands on the Tibetan Plateau, China: A quantitative analysis. Pedosphere 2014, 24, 39–44. [Google Scholar]
  9. Reuter, H.I.; Lado, L.R.; Hengl, T.; Montanarella, L. Continental-scale digital soil mapping using European soil profile data: Soil pH. Hambg. Beiträge Zur Phys. Geogr. Und Landsch. 2008, 19, 91–102. [Google Scholar]
  10. Mohamed, M.A.; Elgharably, G.A.; Rabie, M.H. Evaluation of Soil Fertility Status in Toshka, Egypt: Available Micronutrients. World J. Agric. Sci. 2019, 15, 1–6. [Google Scholar] [CrossRef]
  11. Elwa, A.M.; Abou-Shady, A.M.; Sayed, A.; Showman, H. Impact of physical and chemical properties of soil on the growing plant in El Mounira-El Qattara New Valley. Egypt. J. Appl. Sci. 2021, 36, 148–175. [Google Scholar] [CrossRef]
  12. Al-Soghir, M.M.A.; Mohamed, A.G.; El-Desoky, M.A.; Awad, A.A.M. Comprehensive assessment of soil chemical properties for land reclamation and cultivation purposes in the Toshka area, EGYPT. Sustainability 2022, 14, 15611. [Google Scholar] [CrossRef]
  13. Song, K.; Xue, Y.; Zheng, X.; Lv, W.; Qiao, H.; Qin, Q.; Yang, J. Effects of the continuous use of organic manure and chemical fertilizer on soil inorganic phosphorus fractions in calcareous soil. Sci. Rep. 2017, 7, 1164. [Google Scholar] [CrossRef] [PubMed]
  14. Rady, M.M.; El-Shewy, A.A.; Seif El-Yazal, M.A.; Abd El-Gawwad, I.F.M. Integrative application of soil P-solubilizing bacteria and foliar nano P improves Phaseolus vulgaris plant performance and antioxidative defense system components under calcareous soil conditions. J. Soil Sci. Plant Nutr. 2020, 20, 820–839. [Google Scholar] [CrossRef]
  15. Awad, A.A.M.; Sweed, A.A.A.; Rady, M.M.; Majrashi, A.; Ali, E.F. Rebalance the nutritional status and the productivity of high CaCO3-stressed sweet potato plants by foliar nourishment with zinc oxide nanoparticles and ascorbic acid. Agronomy 2021, 11, 1443. [Google Scholar] [CrossRef]
  16. Fazal, T.; Ismail, B.; Shaheen, N.; Numan, A.; Adnan Khan, A. Effect of Different Acidifying Agents on Amendment in Buffering Capacity of Soil. Res. Rev. J. Bot. Sci. 2020, 9, 9–15. [Google Scholar]
  17. Tanikawa, T.; Sobue, A.; Hirano, Y. Acidification processes in soils with different acid buffering capacity in Cryptomeria japonica and Chamaecyparis obtusa forests over two decades. For. Ecol. Manag. 2014, 334, 284–292. [Google Scholar] [CrossRef]
  18. Latifah, O.; Ahmed, O.H.; Majid, N.M.A. Soil pH buffering capacity and nitrogen availability following compost application in a tropical acid soil. Compos. Sci. Util. 2018, 26, 1–15. [Google Scholar] [CrossRef]
  19. Akay, A.; Şeker, C.; Negiş, H. Effect of enhanced elemental sulphur doses on pH value of a calcareous soil. YYU J. Agric. Sci. 2019, 31, 34–40. [Google Scholar]
  20. Rengasamy, P. World salinization with emphasis on Australia. J. Exp. Bot. 2006, 57, 1017–1023. [Google Scholar] [CrossRef]
  21. Zia, M.H.; Saifullah, M.; Sabir, A.; Ghafoor, A.G. Effectiveness of sulphuric acid and gypsum for the reclamation of a calcareous saline-sodic soil under four crop rotations. J. Agron. Crop Sci. 2007, 193, 262–269. [Google Scholar] [CrossRef]
  22. Mahdy, A.M. Comparative effects of different soil amendments on amelioration of saline-sodic soils. Soil Water Res. 2011, 4, 205–216. [Google Scholar] [CrossRef]
  23. Soaud, A.A.; Al darwish, F.H.; Saleh, M.E.; El-Tarabily, K.A.; Sofian-Azirun, M.; Rahman, M.M. Effects of elemental sulfur, phosphorus, micronutrients and Paracoccus versutus on nutrient availability of calcareous soils. Australian J. Crop Sci. 2011, 5, 554. [Google Scholar]
  24. Shiwakoti, S.; Zheljazkov, V.D.; Gollany, H.T.; Xing, B.; Kleber, M. Micronutrient concentrations in soil and wheat decline by long-term tillage and winter wheat-pea rotation. Agronomy 2019, 9, 359. [Google Scholar] [CrossRef]
  25. Awad, A.A.M.; Sweed, A.A.A. Influence of organic manures on soil characteristics and yield of Jerusalem artichoke. Commun. Soil Sci. Plant Anal. 2020, 51, 1101–1113. [Google Scholar] [CrossRef]
  26. Garcıa-Gill, J.C.; Ceppi, S.B.; Velasco, M.I.; Polo, A.; Senesi, N. Long-term effects of amendment with municipal solid waste compost on the elemental and acidic functional group composition and pH-buffer capacity of soil humic acids. Geoderma 2004, 121, 135–142. [Google Scholar] [CrossRef]
  27. Hafez, E.H.; Abou El Hassan, W.H.; Gaafar, I.A.; Seleiman, M.F. Effect of gypsum application and irrigation intervals on clay saline-sodic soil characterization, rice water use efficiency, growth, and yield. J. Agric. Sci. 2015, 7, 208–219. [Google Scholar] [CrossRef] [Green Version]
  28. Matosic, S.; Birkás, S.; Vukadinovic, S.; Kisic, I.; Bogunovic, I. Tillage, manure and gypsum use in reclamation of saline-sodic soils. Agric. Conspec. Sci. 2018, 83, 131–138. [Google Scholar]
  29. Seleiman, M.F.; Kheir, A.M.S. Maize productivity, heavy metals uptake and their availability in contaminated clay and sandy alkaline soils as affected by inorganic and organic amendments. Chemosphere 2018, 204, 514–522. [Google Scholar] [CrossRef]
  30. Islam, M.A.; Milham, P.J.; Dowling, P.M.; Jacobs, B.C.; Garden, D.L. Improved procedures for adjusting soil pH for pot experiments. Commun. Soil Sci. Plant Anal. 2004, 35, 25–37. [Google Scholar] [CrossRef]
  31. Han, F.; Shan, X.Q.; Zhang, S.Z.; Wen, B.; Owens, G. Enhanced cadmium accumulation in maize roots-the impact of organic acids. Plan Soil 2006, 289, 355–368. [Google Scholar] [CrossRef]
  32. Qureshi, F.F.K.; Khan, A.; Hassan, F.; Bibi, N. Effect of girdling and plant growth regulators on productivity in olive. Pak. J. Agric. Res. 2012, 25, 120–128. [Google Scholar]
  33. El-Fouly, M.M.; El-Taweel, A.A.; Osman, I.M.S.; Saad El-Din, I.; Shaaban, S.H.A. Nutrient removal from different parts of Koroneiki olive trees grown in sandy soil as a base of fertilizer recommendation in Egypt. Br. J. Appl. Sci. Technol. 2014, 4, 1718–1728. [Google Scholar] [CrossRef]
  34. FAO. Food and Agriculture Organization of the United Nations, Rome, Italy. 2022. Available online: http://www.fao.org/faostat/en/ (accessed on 9 February 2022).
  35. Rallo, L.; Caruzo, T.; Diez, C.M.; Campisi, G. Olive growing in a time of change: From empiricism to genomics. In The Olive Tree Genome; Rugini, L.B., Muleo, R., Sebastiani, L., Eds.; Springer: Berlin/Heidelberg, Germany, 2016; pp. 55–64. [Google Scholar]
  36. Shahin, M.F.M.; Genaidy, E.A.E.; Haggag, L.F. Impact of amino acids and humic acid as soil application on fruit quality and quantity of “Kalamata” olive trees. Int. J. ChemTech Res. 2015, 8, 75–84. [Google Scholar]
  37. Mahmoud, T.M.; Emam, S.; Mohamed, A.; El-Sharony, T.F. Influence of foliar application withpotassium and magnesium on growth, yield and oil quality of “Koroneiki” olive trees. Am. J. Food Technol. 2017, 12, 209–220. [Google Scholar] [CrossRef]
  38. Bouyoucos, C.J. Hydrometer method improved for making particle size analysis of soil. Soil Sci. Soc. Proc. 1981, 26, 446–465. [Google Scholar]
  39. McLean, E.O. Soil pH and lime requirement. In Methods of Soil Analysis. Part 2. Chemical and Microbiological Properties; Page, A.L., Ed.; American Society of Agronomy: Madison, WI, USA, 1982; pp. 199–224. [Google Scholar]
  40. Page, A.L.; Miller, R.H.; Keeney, D.R. Method of Soil Analysis. Part 2 Chemical and Microbiological Methods; American Society of Agronomy: Madison, WI, USA, 1982; pp. 225–246. [Google Scholar]
  41. Walkey, A.; Black, C.A. An examination of the Degtjareff method for determining soil organic matter and a proposed modification of the chronic acidification method. Soil Sci. 1934, 37, 29–38. [Google Scholar] [CrossRef]
  42. Jackson, M.L. Soil Chemical Analysis; Constable and Co. Ltd.: London, UK, 1962. [Google Scholar]
  43. Olsen, S.R.; Cole, C.V.; Watanabe, F.S.; Dean, L.A. Estimation of Available Phosphorus in Soils by Extraction with Bicarbonate; Department of Agriculture: Washington, DC, USA, 1954.
  44. Chapman, H.D. Cation-exchange capacity. In Methods of Soil Analysis. Part II; Dans, C., Black, A., Eds.; American Society of Agronomy Inc.: Madison, WI, USA, 1965; Chapter 57–58; pp. 891–903. [Google Scholar]
  45. Maxwell, K.; Johnson, G.N. Chlorophyll fluorescence- a practical guide. J. Exp. Bot. 2000, 51, 659–668. [Google Scholar] [CrossRef]
  46. Clark, A.J.; Landolt, W.; Bucher, J.B.; Strasser, R.J. Beech (Fagus sylvatica) response to ozone exposure assessed with a chlorophyll fluorescence performance index. Environ. Pollut. 2000, 109, 501–507. [Google Scholar] [CrossRef]
  47. Baird, R.B.; Eaton, E.D.; Rice, E.W. Standard Methods for the Examination of Water and Waste Water, 23rd ed.; American Public Health Association: Washington, DC, USA, 2017. [Google Scholar]
  48. Di Rienzo, J.A.; Casanoves, F.; Balzarini, M.G.; Gonzalez, L.; Tablada, M.; Robledo, C.W. InfoStat versión. Group InfoStat, FCA, Universidad Nacional de Córdoba, Argentina. 2011. Available online: http://www.infostat.com.ar (accessed on 29 September 2020).
  49. Bohn, H.L.; McNeal, B.L.; O’Conner, G.A. Soil Chemistry, 2nd ed.; Wiley: New York, NY, USA, 1985. [Google Scholar]
  50. Ogawa, D.; Suzuki1, Y.; Yokoo1, T.; Katoh, E.; Teruya, M.; Muramatsu, M.; Ma, J.F.; Yoshida, Y.; Isaji, S.; Ogo, Y.; et al. Acetic-acid-induced jasmonate signaling in root enhances drought avoidance in rice. Sci. Rep. 2021, 11, 6280. [Google Scholar] [CrossRef]
  51. Tusei, C. The Effects of citric acid on pH and nutrient uptake in wheatgrass (Triticum aestivum). IdeaFest Interdiscip. J. Creat. Work. Res. Cal Poly Humboldt 2019, 3, 7. [Google Scholar]
  52. Awad, A.A.M.; Ahmed, A.I.; Elazem, A.H.A.; Sweed, A.A.A. Mitigation of CaCO3 Influence on Ipomoea batatas Plants Using Bacillus megaterium DSM 2894. Agronomy 2022, 12, 1571. [Google Scholar] [CrossRef]
  53. Bello, S.K.; Alayafi, A.H.; AL-Solaimani, S.G.; Abo-Elyousr, K.A.M. Mitigating soil salinity stress with gypsum and bio-organic amendments: A review. Agronomy 2021, 11, 1735. [Google Scholar] [CrossRef]
  54. Wang, X.L.; Guo, X.L.; Hou, X.G.; Zhao, W.; Xu, G.W.; Li, Z.Q. Effects of leaf zeatin and zeatin riboside induced by different clipping heights on the regrowth capacity of ryegrass. Ecol. Res. 2014, 29, 167–180. [Google Scholar] [CrossRef]
  55. Schwab, A.P.; Zhu, D.S.; Banks, M.K. Influence of organic acids on the transport of heavy metals in soil. Chemosphere 2008, 72, 986–994. [Google Scholar] [CrossRef] [PubMed]
  56. Saikia, J.; Sarma, R.K.; Dhandia, R.; Yadav, A.; Bharali, R.; Gupta, V.K.; Saikia, R. Alleviation of drought stress in pulse crops with ACC deaminase producing rhizobacteria isolated from acidic soil of Northeast India. Sci. Rep. 2018, 8, 3560. [Google Scholar] [CrossRef]
  57. Qu, J.; Lou, C.Q.; Yuan, X.; Wang, X.H.; Cong, Q.; Wang, L. the effect of sodium hydrogen phosphate/ citric acid mixtures on phytoremediation by alfalfa & metals availability in soil. J. Soil Sci. Plant Nutr. 2011, 11, 85–95. [Google Scholar]
  58. Kim, J.M.; Sasaki, T.; Ueda, M.; Sako, K.; Seki, M. Chromatin changes in response to drought, salinity, heat, and cold stresses in plants. Front. Plant Sci. 2015, 6, 114. [Google Scholar] [CrossRef]
  59. Zhang, J.; Zhang, Q.; Xing, J.; Li, H.; Miao, J.; Xu, B. Acetic acid mitigated salt stress by alleviating ionic and oxidative damages and regulating hormone metabolism in perennial ryegrass (Lolium perenne L.). Grass Res. 2021, 1, 3. [Google Scholar] [CrossRef]
  60. Shi, J.; Long, T.; Zheng, L.; Gao, S.; Wang, L. Neutralization of industrial alkali-contaminated soil by different agents: Effects and Environmental Impact. Sustainability 2022, 14, 5850. [Google Scholar] [CrossRef]
  61. Erel, R.; Yermiyahu, U.; Van Opstal, J.; Ben-Gal, A.; Schwartz, A.; Dag, A. The importance of olive (Olea europaea L.) tree nutritional status on its productivity. Sci. Hortic. 2013, 159, 8–18. [Google Scholar] [CrossRef]
  62. Haberman, A.; Dag, A.; Shtern, N.; Zipori, I.; Erel, R.; Ben-Gal, A.; Yermiyahu, U. Significance of proper nitrogenfertilizationforoliveproductivityinintensivecultivation. Sci. Hortic. 2019, 246, 710–717. [Google Scholar] [CrossRef]
  63. El-Dissoky, R.A.; Al-Kamar, F.A.; Derar, R.M. Impact of Magnesium Fertilization on Yield and Nutrients Uptake by Maize Grown on two Different Soils. Egypt. J. Soil Sci. 2017, 57, 455–466. [Google Scholar] [CrossRef] [Green Version]
  64. Mengel, K.; Kirkby, E.A. Principles of Plant Nutrition; International Potash Institute: Bern, Switzerland, 2001. [Google Scholar]
  65. Zhao, H.; Zhou, Q.; Zhou, M.; Li, C.; Gong, X.; Liu, C.; Qu, C.; Wang, L.; Si, W.; Hong, F. Magnesium deficiency results in damage of nitrogen and carbon cross-talk of maize and improvement by cerium addition. Biol. Trace Element Res. 2012, 148, 102–109. [Google Scholar] [CrossRef] [PubMed]
  66. Bloom, A.J.; Kameritsch, P. Relative association of Rubisco with manganese and magnesium as a regulatory mechanism in plants. Physiol. Plant. 2017, 161, 545–559. [Google Scholar] [CrossRef]
  67. Fernández-Escobar, R. Use and abuse of nitrogen in olive fertilization. Acta Hortic. 2011, 888, 249–258. [Google Scholar] [CrossRef]
  68. Kirkby, E. Introduction, definition and classification of nutrients. In Marschner’s Mineral Nutrition of Higher Plants, 3rd ed.; Elsevier: Amsterdam, The Netherlands, 2012; pp. 3–5. [Google Scholar]
  69. Hussein, H.A.Z.; Awad, A.A.M.; Beheiry, H.R. Improving nutrients uptake and productivity of stressed olive trees with mono-ammonium phosphate and urea phosphate application. Agronomy 2022, 12, 2390. [Google Scholar] [CrossRef]
  70. Tränkner, M.; Tavakol, E.; Jákli, B. Functioning of potassium and magnesium in photosynthesis, photosynthate translocation and photoprotection. Physiol. Plant. 2018, 163, 414–431. [Google Scholar] [CrossRef]
  71. Rate, A.W.; Sheikh-Abdullah, S.M. The geochemistry of calcareous forest soils in Sulaimani Governorate, Kurdistan Region, Iraq. Geoderma 2017, 289, 54. [Google Scholar] [CrossRef]
  72. Ramírez-Pérez, L.; Morales-Díaz, A.; De Alba-Romenus, K.; González-Morales, S.; Benavides-Mendoza, A.; Juárez-Maldonado, A. Determination of micronutrient accumulation in greenhouse cucumber crop using a modeling approach. Agronomy 2017, 7, 79. [Google Scholar] [CrossRef]
  73. Mam-Rasul, G.A. Zinc Sorption in Calcareous Soils of the Kurdistan Region of Iraq. Soil Sci. 2019, 184, 60. [Google Scholar] [CrossRef]
  74. Salih, H.O. Effect of fertigation-applied sulfuric acid on phosphorus availability and some microelements for greenhouse cucumber. Pol. J. Environ. Stud. 2021, 30, 4901–4909. [Google Scholar] [CrossRef]
  75. Kwon, S.-J.; Kim, H.-R.; Roy, S.K.; Kim, H.-J.; Boo, H.-O.; Woo, S.-H.; Kim, H.-H. Effects of nitrogen, phosphorus and potassium fertilizers on growth characteristics of two species of Bellflower (Platycodon grandiflorum). J. Crop Sci. Biotechnol. 2019, 22, 481–487. [Google Scholar] [CrossRef]
  76. Shanthakumar, S.; Abinandan, S.; Venkateswarlu, K.; Subashchandrabose, S.R.; Megharaj, M. Algalization of acid soils with acid-tolerant strains: Improvement in pH, carbon content, exopolysaccharides, indole acetic acid and dehydrogenase activity. Land Degrad. Dev. 2021, 32, 3157–3166. [Google Scholar] [CrossRef]
  77. Centeno, A.; Gómez del Campo, M. Response of mature olive trees with adequate leaf nutrient status to additional nitrogen, phosphorus, and potassium fertilization. Acta Hortic. 2011, 888, 277–280. [Google Scholar] [CrossRef]
  78. Ferreiraa, I.Q.; Ângelo Rodriguesa, M.; Moutinho-Pereirab, J.M.; Correiab, C.M.; Arrobas, M. Olive tree response to applied phosphorus in field and pot experiments. Sci. Hortic. 2018, 234, 236–244. [Google Scholar] [CrossRef]
  79. Ferrarezi, R.S.; Lin, X.; Neira, A.C.G.; Zambon, F.T.; Hu, H.; Wang, X.; Huang, J.-H.; Fan, G. Substrate pH influences the nutrient absorption and rhizosphere microbiome of Huanglongbing-affected graprfruit plants. Front. Plant Sci. 2022, 13, 856937. [Google Scholar] [CrossRef]
Figure 1. Effect of acidifying agents on the gradual change average in soil pH values during the 2018 and 2019 seasons.
Agronomy 13 00539 g001
Figure 2. Effect of acidifying agents applied to (A) shoot length (ShL, cm); (B) number of leaves per shoot; and (C) leaf area (LA, cm3) of olive trees picual cv. grown in a sandy loam clay soil under multi-abiotic stresses (pH = 7.78 vs. 7.89; CaCO3 = 8.8 vs. 9.2%; and ECe = 6.4 vs. 7.2 dS m−1 and). Different letters in each column indicate significance at p ≤ 0.05. CA1, CA2, AC1, AC2, SA1, and SA2 represent citric acid, acetic acid, and sulfuric acid applied at 25 and 50 cm3, respectively.
Agronomy 13 00539 g002aAgronomy 13 00539 g002b
Figure 3. Impact of soil pH induced by some acidifying agents applied to (A) SPAD reading, (B) fv/fm, and (C) performance index (PI) of olive trees picual cv. grown in a sandy loam clay soil under multi-abiotic stresses (pH = 7.78 vs. 7.89; CaCO3 = 8.8 vs. 9.2%; and ECe = 6.4 vs. 7.2 dS m−1). Different letters in each column indicate significance at p ≤ 0.05. CA1, CA2, AC1, AC2, SA1, and SA2 represent citric acid, acetic acid, and sulfuric acid applied at 25 and 50 cm3, respectively.
Agronomy 13 00539 g003aAgronomy 13 00539 g003b
Figure 4. The heat map of Pearson’s correlation coefficient matrix between leaf nutrient contents (N, P, K, Ca, Mg, and Na) with physiological parameters (ShL, NLf, LA, and SPAD reading) and yield and its attributes (TFrW, FiW%, FrL, FrW, FrDrM, and TOY) in the 2018 (A) and 2019 seasons (B).
Agronomy 13 00539 g004aAgronomy 13 00539 g004b
Table 1. Monthly climate averages for Kawm Ushim region, Fayoum, Egypt, during the 2018 and 2019 seasons.
MonthADTANTARHAWSAM-PEC-AAP
°C(%)(ms−1)(mmd−1)(mmd−1)
January22.152.0560.412.893.580.14
February27.494.4354.002.434.130.10
March31.595.7746.782.964.780.04
April36.897.8340.603.235.590.05
May43.9812.8232.033.556.710.00
June42.4017.0635.563.756.770.00
July42.6719.5939.883.717.550.00
August40.6719.7443.413.516.870.00
September38.9517.1850.353.626.650.00
October35.5012.3351.633.146.410.10
November31.568.9554.602.445.620.07
December22.554.9765.722.904.330.70
ADT °C = average day temperature, ANT °C = average night temperature, ARH = average relative humidity, AWS = average wind speed, AM-PEC-A= average measured pan evaporation class A, and AP = average precipitation.
Table 2. The description of treatments applied, application method, and applying time in the field experiment.
SymbolTreatment DescriptionApplication MethodApplying Time
Con.No acids were applied and treated with irrigated waterThree times in four plots before direct fertilizer applicationAll acids were applied three times before fertilizer application for 2 days. However, the fertilizers were added in the middle of March, May and July. The treatments were applied in around the rhizosphere area
AC1Twenty-five cubic centimeters of acetic acid was added to 20 L of irrigated water per tree
AC2Fifty cubic centimeters of acetic acid was added to 20 L of irrigated water per tree
CA1Twenty-five cubic centimeters of citric acid was added to 20 L of irrigated water per tree
CA2Fifty cubic centimeters of citric acid was added to 20 L of irrigated water per tree
SA1Twenty-five cubic centimeters of sulfuric acid was added to 20 L of irrigated water per tree
SA2Fifty cubic centimeters of sulfuric acid was added to 20 L of irrigated water per tree
Table 3. Some soil chemical and physical properties.
Soil Property2020 Season2021 Season
Particle size distribution (%)
Sand47.3248.49
Silt19.5620.20
Clay33.1231.31
Soil textureSandy clay loamSandy clay loam
pH (in soil paste)7.787.89
ECe (dS m−1)6.47.2
Organic matter (%)0.630.52
CaCO3 (%)8.89.2
Soluble ions (mmol L−1)
CO32−--------
HCO32.83.7
Cl53.455.3
SO42−19.321.1
Ca2+39.641.2
Mg2+7.88.4
Na+22.424.3
K+5.76.2
Macronutrients (mg kg−1)
Total N414640
Available P (extractable with NaHCO3 pH = 8.5)45204830
Available K (extractable with NH4OAC pH = 7.0)13371415
DTPA Extractible micronutriments (mg kg−1)
Fe10.711.2
Mn4.56.3
Zn0.150.14
Cu0.480.38
Table 4. Effect of acidifying agents as a soil application on the leaf macronutrient content of olive trees (Picual cv.) grown in a sandy loam clay soil under multi-abiotic stresses (pH = 7.78 vs. 7.89; CaCO3 = 8.8 vs. 9.2%; and ECe = 6.4 vs. 7.2 dS m−1).
TreatmentLNCLPCLKCLNaCLCaCLMgC
(%, in DM of Leaves)
2018 season
Con.1.43c ± 0.010.26c ± 0.010.59b ± 0.090.42cd ± 0.011.12c ± 0.010.27bc ± 0.01
AC10.90d ± 0.010.32b ± 0.010.60b ± 0.010.50bc ± 0.031.13c ± 0.030.34ab ± 0.02
AC20.71d ± 0.010.32b ± 0.010.86a ± 0.020.61a ± 0.071.21bc ± 0.060.28bc ± 0.04
CA11.07cd ± 0.010.34ab ± 0.020.70ab ± 0.040.51b ± 0.051.29ab ± 0.050.18c ± 0.05
CA22.50a ± 0.010.32b ± 0.010.69ab ± 0.070.65a ± 0.081.38a ± 0.010.43a ± 0.06
SA10.89d ± 0.010.38a ± 0.020.67b ± 0.050.39d ± 0.031.13c ± 0.050.36ab ± 0.03
SA21.97b ± 0.010.35ab ± 0.020.52b ± 0.030.43cd ± 0.011.20bc ± 0.030.28bc ± 0.04
2019 season
Con.2.14a ± 0.010.25c ± 0.010.69b ± 0.030.39a ± 0.011.16e ± 0.010.25b ± 0.01
AC12.14a ± 0.010.43b ± 0.010.62c ± 0.010.36a ± 0.011.27d ± 0.080.43a ± 0.03
AC21.61b ± 0.030.40b ± 0.010.83a ± 0.010.31b ± 0.031.51a ± 0.050.24b ± 0.11
CA11.07c ± 0.010.43ab ± 0.010.72b ± 0.020.25c ± 0.031.08f ± 0.030.47a ± 0.05
CA22.32a ± 0.010.24c ± 0.020.73b ± 0.040.26c ± 0.011.36c ± 0.100.15bc ± 0.01
SA11.25bc ± 0.020.27c ± 0.060.71b ± 0.030.27c ± 0.010.94g ± 0.030.38a ± 0.03
SA21.43bc ± 0.010.46a ± 0.020.60c ± 0.030.38a ± 0.031.44b ± 0.030.25c ± 0.01
Mean values (±SE), different letters in each column indicate significance at p ≤ 0.05. CA1, CA2, AC1, AC2, SA1, and SA2 represent citric acid, acetic acid, and sulfuric acid applied at 25 and 50 cm3, respectively.
Table 5. Effect of acidifying agents as a soil application on the leaf micronutrient content of olive trees (Picual cv.) grown in a sandy loam clay soil under multi-abiotic stresses (pH = 7.78 vs. 7.89; CaCO3 = 8.8 vs. 9.2%; and ECe = 6.4 vs. 7.2 dS m−1).
TreatmentLFeCLMnCLZnCLCuC
(mg·kg−1, in DM of Leaves).
2018 season
Con.389.67a ± 9.7217.03cd ± 0.1216.00e ± 0.482.25d ± 0.14
AC1259.42c ± 10.1622.17a ± 0.1922.17a ± 0.197.09a ± 0.34
AC2167.00e ± 4.6119.92b ± 0.5320.92b ± 0.056.83a ± 0.19
CA1195.25de ± 4.1919.25b ± 0.2419.25c ± 0.245.25b ± 0.05
CA2228.50cd ± 2.0217.75c ± 0.1417.75d ± 0.144.42c ± 0.14
SA1320.92b ± 4.7614.75e ± 0.4314.75f ± 0.335.17b ± 0.10
SA2231.42cd ± 10.8316.59d ± 0.2416.59e ± 0.234.33c ± 0.29
2019 season
Con.449.67a ± 7.6018.00d ± 0.4827.41d ± 0.423.25c ± 0.14
AC1300.42b ± 2.4523.67a ± 0.1040.03a ± 0.868.09a ± 0.24
AC2198.50d ± 7.5320.00bc ± 0.5837.50b ± 0.737.33a ± 0.10
CA1216.25cd ± 1.5920.68b ± 0.0933.37c ± 0.765.75b ± 0.33
CA2238.50c ± 2.6019.37c ± 0.0837.80ab ± 0.684.92b ± 0.43
SA1329.50b ± 8.3716.75e ± 0.1439.12ab ± 0.295.67b ± 0.38
SA2246.25c ± 1.8818.18d ± 0.0138.91ab ± 0.535.33b ± 0.30
Mean values (±SE), different letters in each column indicate significance at p ≤ 0.05. CA1, CA2, AC1, AC2, SA1, and SA2 represent citric acid, acetic acid, and sulfuric acid applied at 25 and 50 cm3, respectively.
Table 6. Effect of acidifying agents as a soil application on fruit parameters, oil content, and total yield of olive trees (Picual cv.) grown in a sandy loam clay soil under multi-abiotic stresses (pH = 7.78 vs. 7.89; CaCO3 = 8.8 vs. 9.2%; and ECe = 6.4 vs. 7.2 dS m−1).
TreatmentTFrWFhWFhTWFhDrMFrLFrDOOCTOY
(g)(%)(mm)(%)(kg Tree−1)
2018 season
Con.3.29c ± 0.102.56c ± 0.0877.88d ± 0.3936.23c ± 0.9419.68d ± 0.5314.21d ± 0.4033.31b ± 0.4323.00c ± 1.08
AC13.92b ± 0.133.11b ± 0.1379.40c ± 0.1436.82c ± 0.5721.76cd ± 0.2916.26a–c ± 0.5134.72b ± 0.6324.50bc ± 1.66
AC24.38a ± 0.193.58a ± 0.1781.57ab ± 0.1938.31b ± 0.6123.99ab ± 0.7317.86ab ± 0.5433.97b ± 0.7828.25ab ± 1.93
CA14.51a ± 0.183.68a ± 0.1281.46ab ± 0.6137.80b ± 0.8623.36a–c ± 0.9117.28a–c ± 0.5336.29a ± 0.5526.75a–c ± 1.89
CA24.53a ± 0.223.65a ± 0.1480.81b ± 0.4240.75a ± 0.9524.29a ± 0.8118.18a ± 0.8236.80a ± 0.4530.25a ± 1.89
SA13.93b ± 0.233.10b ± 0.1378.85c ± 0.1338.53b ± 0.6621.69cd ± 0.4915.45cd ± 0.3236.29a ± 0.5624.75bc ± 1.31
SA24.34a ± 0.193.56a ± 0.1781.91a ± 0.1938.04b ± 0.6922.04bc ± 0.4816.05b–d ± 0.4636.36a ± 0.5325.75a–c ± 1.08
2019 season
Con.3.41f ± 0.242.66e ± 0.1177.99g ± 0.2235.15cd ± 0.3219.11b ± 0.7013.74b ± 0.6432.75b ± 0.4131.50c ± 0.96
AC13.91e ± 0.223.10d ± 0.1279.40e ± 0.2133.09e ± 0.8920.93ab ± 0.4515.54a ± 0.1432.40b ± 0.3533.75c ± 1.25
AC24.27c ± 0.203.49c ± 0.1881.65a ± 0.2236.24bc ± 0.7822.60a ± 0.4816.07a ± 0.1434.63a ± 0.6038.75ab ± 1.30
CA14.51a ± 0.203.72a ± 0.1381.46c ± 0.3138.73a ± 0.7322.45a ± 0.6816.76a ± 0.6135.50a ± 0.4635.50bc ± 1.32
CA24.52a ± 0.183.65a ± 0.1780.91d ± 0.1535.67c ± 0.8121.95a ± 0.6916.72a ± 0.6735.51a ± 0.8540.75a ± 1.25
SA13.95d ± 0.223.11d ± 0.1978.73f ± 0.2234.35d ± 0.8621.45ab ± 0.6015.42ab ± 0.3534.72a ± 0.4132.75c ± 1.11
SA24.40b ± 0.263.59b ± 0.1381.56b ± 0.1837.28b ± 0.6021.61ab ± 0.5715.96a ± 0.5035.31a ± 0.3934.00c ± 1.35
Mean values (±SE), different letters in each column indicate significance at p ≤ 0.05. CA1, CA2, AC1, AC2, SA1, and SA2 represent citric acid, acetic acid, and sulfuric acid applied at 25 and 50 cm3, respectively. TFrW = total fruit weight, FhW = flesh weight, FhTW = flesh weight/total fruit weight, FhDrM = flesh dry matter, FrL = fruit length, FrD = fruit diameter, OOC = olive oil content and TOY = total olive yield.
Table 7. Proportional contribution in predicting olive oil content (OOC) and total olive yield (TOY) using stepwise multiple linear regression for olive tree (Picual cv.) with three acidifying agents applied in two doses in comparison with untreated trees in 2018 and 2019 seasons.
SeasonrR2Adj. R2SEESignificanceFitted Equation
20180.6710.4510.3901.368***OOC = 25.921 + 20.539LNU + 24.317LPU
0.5510.3040.2673.175***TOY = 7.298 + 4.410TFrW
20190.7080.5010.4461.167***OOC = 29.023 + 3.083FiW − 0.257LMnU
0.8970.8040.7701.700***TOY = 2.956 + 0.772ShL + 1.015FrL − 0.118NLf
r = correlation coefficient, R2 = coefficient of determination, Adj. R2 = adjusted R2, and SEE = standard error of estimates *** means differences at p ≤ 0.001 probability levels.
Disclaimer/Publisher’s Note: The statements, opinions and data contained in all publications are solely those of the individual author(s) and contributor(s) and not of MDPI and/or the editor(s). MDPI and/or the editor(s) disclaim responsibility for any injury to people or property resulting from any ideas, methods, instructions or products referred to in the content.

