Article

Drip Irrigation at a Soil Water Suction of 30 kPa Helps AMF and GRSP to Enhance Greenhouse Macro-Aggregates

1
College of Land and Environment, Shenyang Agricultural University, Shenyang 110866, China
2
Northeast Key Laboratory of Conservation and Improvement of Cultivated Land (Shenyang), Ministry of Agriculture, Shenyang 110866, China
3
Monitoring & Experimental Station of Corn Nutrition and Fertilization in Northeast Region, Ministry of Agriculture, Shenyang 110866, China
4
National Engineering Research Center for Efficient Utilization of Soil and Fertilizer Resources, Shenyang 110866, China
*
Author to whom correspondence should be addressed.
These authors contributed equally to this work.
Agronomy 2023, 13(2), 522; https://doi.org/10.3390/agronomy13020522
Submission received: 26 December 2022 / Revised: 9 February 2023 / Accepted: 9 February 2023 / Published: 11 February 2023
(This article belongs to the Special Issue Effects of Arable Farming Measures on Nutrient Dynamics)

Abstract

:
Drip irrigation is fundamental in water-saving agricultural greenhouses, especially in tomato (Solanum lycopersicum L.) greenhouses. However, a long-term drip irrigation has been observed to be associated with soil degradation, concerning both soil aggregate structure and soil microbial community. To evaluate how drip irrigation scheduling influences the soil structure and arbuscular mycorrhizal fungi (AMF), a long-term irrigation experiment was carried out in a tomato greenhouse in 2011, using an irrigation program with dripping water starting when the soil reached a suction of 20 kPa (D20), 30 kPa (D30) and 40 kPa (D40). In 2017, we tested the AMF community and soil aggregate composition by soil wet sieving. Aggregates of 0.25–1 mm represented the main class of aggregates (32.4%–43.1%) in this experiment. At D30, we measured the highest mean weight diameter (MWD) and soil organic carbon (SOC) and glomalin-related soil protein (GRSP) levels. Thus, D30 promoted soil aggregate stability in the greenhouse. According to the high-throughput sequencing results of AMF, Glomus at D30 was the main factor leading to a high soil aggregate stability, because its OTU relative abundance was significantly higher than those of Ambispora and Paraglomus. Through redundancy analysis, the GRSP concentration was positively correlated with the SOC and total N (TN) levels and with the presence of the genera Ambispora, Glomus and Paraglomus. This evidenced that AMF and SOC helped to increase GRSP concentration and aggregate stability. Therefore, initiating irrigation when the soil reaches a water suction of 30 kPa could promote soil aggregate stability by favoring AMF abundance.

1. Introduction

Irrigation is an important determinant for crop yield and soil aggregate structure in greenhouse cultivations. A vigorous growing of tomato plants (Solanum lycopersicum L.) in greenhouses needs a soil moisture content up to 65%. Water may be more necessary during the period of tomato ripening. Drip irrigation has a long history and is extensively used worldwide, in many cases replacing furrow and sprinkler irrigation and other methods [1]. On the one hand, drip irrigation increases crop yield, improves water use efficiency [2] and reduces diseases [3]. On the other, drip irrigation scheduling, the frequency of water application and the amount of water applied can influence the distribution of soil aggregate classes and soil microbial communities, especially arbuscular mycorrhizal fungi (AMF) [4].
Soil water movement is closely related to the structure of soil aggregates. Soil aggregates are key functional components of arable land, support soil quality and ensure agricultural sustainability [5]. Generally, aggregates are classified into three groups, i.e., macro–aggregates (>0.25 mm), micro–aggregates (<0.25 mm) and clay particle (<0.053 mm) [6]. The soil aggregate diameter and stability are always determined by the soil cementing agents, such as AMF [7,8,9,10]. AMF are ubiquitous symbiotic fungi that inhabit the roots of over 80% of higher plant species [11]. They can help the transfer of nutrients and water between the soil and the host plants [12,13].
Soil aggregates formation and maintenance were shown to be influenced by extraradical mycorrhizal hyphae (EMH), exudates and residues of AMF [14,15]. EMH and exudates intertwine and aggregate the soil particles producing soil aggregates [16] and contribute to the stability of soil aggregates [17]. AMF can produce glomalin-related soil protein (GRSP), which also helps soil aggregates formation [18,19,20]. AMF and GRSP promote the adhesion of soil particles into micro-aggregates that finally develop into macro-aggregates [21,22]. The concentration of GRSP is significantly higher in water-stable aggregates than in unstable aggregates [23]. Therefore, the presence of AMF is important to maintain a proper soil structure and benefit plant growth.
An optimal irrigation regime can establish moderate moisture, temperature and oxygen status in the soil throughout a crop growth period. Cycles of soil wetting and drying (D/W) are one of main factors influencing AMF communities [24,25]. A soil water deficit was shown to increase the concentration of GRSP, while Glomus intraradices and Glomus mosseae could significantly increase the production of GRSP [16]. However, information on how drip irrigation influence GRSP, AMF and soil aggregates in greenhouses is limited. Therefore, we hypothesized that the soil water balance is a crucial factor affecting the activity of AMF, the concentrations of GRSP and the stability of soil aggregates. This study is expected to inform irrigation schemes to conserve the soil structure in greenhouses.

2. Materials and Methods

2.1. Greenhouse Description and Experimental Design

This study was conducted in a polyethylene greenhouse at the Experiment Station for Water Saving Irrigation of Shenyang Agriculture University, in Northeastern China (41°49′ N, 123°35′ E and 43 m ASL), and began in 2011. The extent of fertilization was the same every year and consisted of chicken manure, 37.5 t ha−1, (NH4)2HPO4, 0.6 t ha−1, K2SO4, 0.6 t ha−1 and urea, 0.15 t ha−1. The soil was meadow brown earth (MollicGleysols, FAO-UNESCO system; Histosols, WRB). In the top layer (0–15 cm), before imposing the irrigation treatment, pH was 6.3, organic matter was 22.9 g kg−1 soil, total N (TN) was 1.35 g kg−1 soil, total P was 0.45 g kg−1 soil, and total K was 22.2 g kg−1. The soil water retention curve is showed in Figure S1. The plots were fertilized before transplanting with 15 g m−2 of urea (N = 46%), 60 g m−2 of ammonium phosphate (N = 17% and P2O5 = 45%), and 60 g m−2 potassium sulfate (K2O = 46%), mixed in the upper 20 cm soil layer. Chicken manure and cattle manure were applied during soil preparation at the rates of 225 g m−2 and 375 g m−2, respectively. The soil texture was clay loam, its bulk density was 1.31 g cm−3, and its porosity was 37.41%.
Drip irrigation was used in three conditions: (1) irrigation when the soil water suction reached 20 kPa (D20), (2) irrigation when the soil water suction reached 30 kPa (D30) and (3) irrigation when the soil water suction reached 40 kPa (D40). The irrigation treatment plots were arranged in a complete randomized block design with three replicates (each plot was 20 m2). The plots were separated by polythene sheeting to prevent the movement of water and nutrients. Tensiometers (IFC CO., Australia) were placed in the 0–30 cm soil layer and read at 8:00 a.m. every morning. The plots were irrigated to an upper limit of 6 kPa of soil water suction. A single-plot irrigation volume (Q) was calculated as follows:
Q = (θ2 − θ1) × H × R × S
where Q is the single plot-irrigation volume (m3), θ1 is the soil moisture when the soil is at its lower limit of water requirement, and θ2 is the soil moisture when the soil is at its upper limit of water requirement. H is the thickness of the soil to be wetted (20 cm), R is the fraction of the wetted area (0.50), and S is the plot area (20 m2). Table S1 shows the irrigation dates and volumes.

2.2. Crop Management

Tomato (Solanum lycopersicum L.) was grown from May to August every year. Seedlings with 2–3 leaves were transplanted into the experimental greenhouse using a ridge-furrow system covered with a black film (Figure 1). In total, 24 plants were planted on each ridge, with row spacing of 50 cm and plant spacing of 30 cm. A topdressing of urea was applied with irrigation water at a rate of 15 g m−2 on day 47 and day 72 after planting.

2.3. Soil Sampling and Aggregate Fractionation

We collected the soil samples and plant samples in 2017. Three random plants per irrigation treatment were carefully dug up. The soil samples at the rhizosphere were shaken to separate them from the roots and were collected. They were transported to the laboratory and stored at 4 °C before the analysis.
The soil aggregate fractions were isolated by the wet sieving protocol for microbiological analysis [26,27]. The aggregate size classes were: >2 mm, 1–2 mm, 0.25–1 mm, 0.053–0.25 mm and < 0.053 mm in diameter. The five classes were freeze-dried and divided for chemical analysis, GRSP determination and DNA extraction. The mean weight diameter (MWD)—an index of aggregate stability—was calculated according to the following equation:
M W D ( m m ) = i = 1 n w i   x ¯ i
where wi is the proportion of the total sample weight retained on the i sieve, and x ¯ i (mm) is the mean diameter of the soil aggregate size class [28].

2.4. Analysis of SOC, TN and GRSP

Soil organic carbon (SOC) and TN were determined on a total organic carbon analyzer (Jena Multi C/N 3100, Hanau, Germany). Total GRSP (T-GRSP) and easily extractable GRSP (EE-GRSP) were extracted from the soil (1 g) as described by Wright and Upadhyaya [10]. In brief, T-GRSP was extracted with 8 mL of a 50 mM sodium citrate solution, pH 8.0, at 121 °C in an autoclave for 60 min and then removed by centrifugation at 10,000 rpm for 5 min; EE-GRSP was extracted with 8 mL of a 20 mM solution adjusted to pH 7.0 at 121 °C in an autoclave for 30 min and then removed by centrifugation at 10,000 rpm for 5 min. The protein content was measured using the Bradford assay and bovine serum albumin as a standard [29].

2.5. High-Throughput Sequencing

DNA was extracted in triplicate from the aggregate samples of different size classes using the FastDNA® SPIN Kit for soil (MP Biomedicals, Santa Ana, CA, USA) following the manufacturer’s protocol, dissolved in 100 μL of TE (Tris and EDTA) buffer and tested for purity using a NanoDrop spectrophotometer 2000 (Thermo Fisher Scientific, Waltham, MA, USA); they were stored at −20 °C until further use. After DNA extraction, the DNA was sent to Novogene Bioinformatics Technology Co., Ltd. (Beijing, China) for IlluminaHiseq2500 amplicon sequencing (Illumina, USA) analysis. Total genomic DNA was amplified using the primers AMV4.5NF (AAGCTCGTAGTTGAATTTCG) and AMDGR (CCCAACTATC CCTATTAA TCAT) of the AMF gene [30].

2.6. Data Analysis

2.6.1. Bioinformatic Analysis

The paired-end reads for each sample were merged using fast length adjustment of short reads (FLASH V1.2.7). Data filtration and data removal were performed using the Quantitative Insights Microbial Ecology (QIIME Version 1.7.0). Then, the UPARSE pipeline version 7.0.1001 was used to infer operational taxonomic units (OTUs) at 97% sequence identity. We used the Shannon index and Chao1 estimator [31] to determine the diversity of the AMF communities by QIIME and R 3.4.3.

2.6.2. Statistical Analysis

Means and standard deviations were determined using Excel 2013 (Microsoft, Redmond, WA, USA). One/two-way analysis of variance (ANOVA) and Duncan’s multiple range tests (p ≤ 0.05) were performed using SPSS 22.0 (SPSS Inc., Chicago, IL, USA). The Figures were generated using Origin 8.5 (OriginLab Corp., Northampton, MA, USA). A redundancy analysis was carried out by the “VEGAN” package in the R statistical environment to describe the connections among the relative abundance of AMF and the properties of the soil aggregate size classes (SOC, TN, C/N, T-GRSP and EE-GRSP).

3. Results

3.1. Aggregate Size Class Distribution and Mean Weight Diameter

The soil aggregate size distribution and MWD were dramatically affected by the drip irrigation regime (Figure 2). The size classes in the range of 0.25–1 mm were the most abundant in all irrigation treatments, contributing about 33.2%–43.1% of the total soil weight, followed by the 0.053–2 mm size class, representing 13.5%–31.4% of the total soil weight. The proportions of the size classes >2 mm and <0.053 mm were the lowest and contributed 5.8%–12.3% to the total soil weight. The large aggregates (>0.25 mm) proportion at D30 was significantly higher than those at D20 and D40 (p < 0.05). The MWD ranged between 0.81 mm and 1.10 mm among the three treatments (Figure 2). In all treatments, the MWD was the highest at D30 (35.8%).

3.2. Distribution of SOC, TN and C/N Ratio in the Soil Aggregates

The concentration of SOC and TN were significantly affected by the soil aggregate size classes and the different irrigation treatments and showed similar trends for all the aggregate classes (Table 1). The distribution of SOC in the aggregates ranged from 10.11 g kg−1 to 19.31 g kg−1, and that of TN from 1.08 g kg−1 to 1.93 g kg−1 g. Among the soil aggregate size classes, the macro-aggregates generally contained the greatest amounts of SOC and TN, which were at the lowest levels in the micro-aggregates. The SOC and TN levels were higher in the D20 and D30 treatments, irrespective of the aggregate size class. The C/N ratio did not differ for any of the aggregate size classes, except for the aggregates >2 mm.

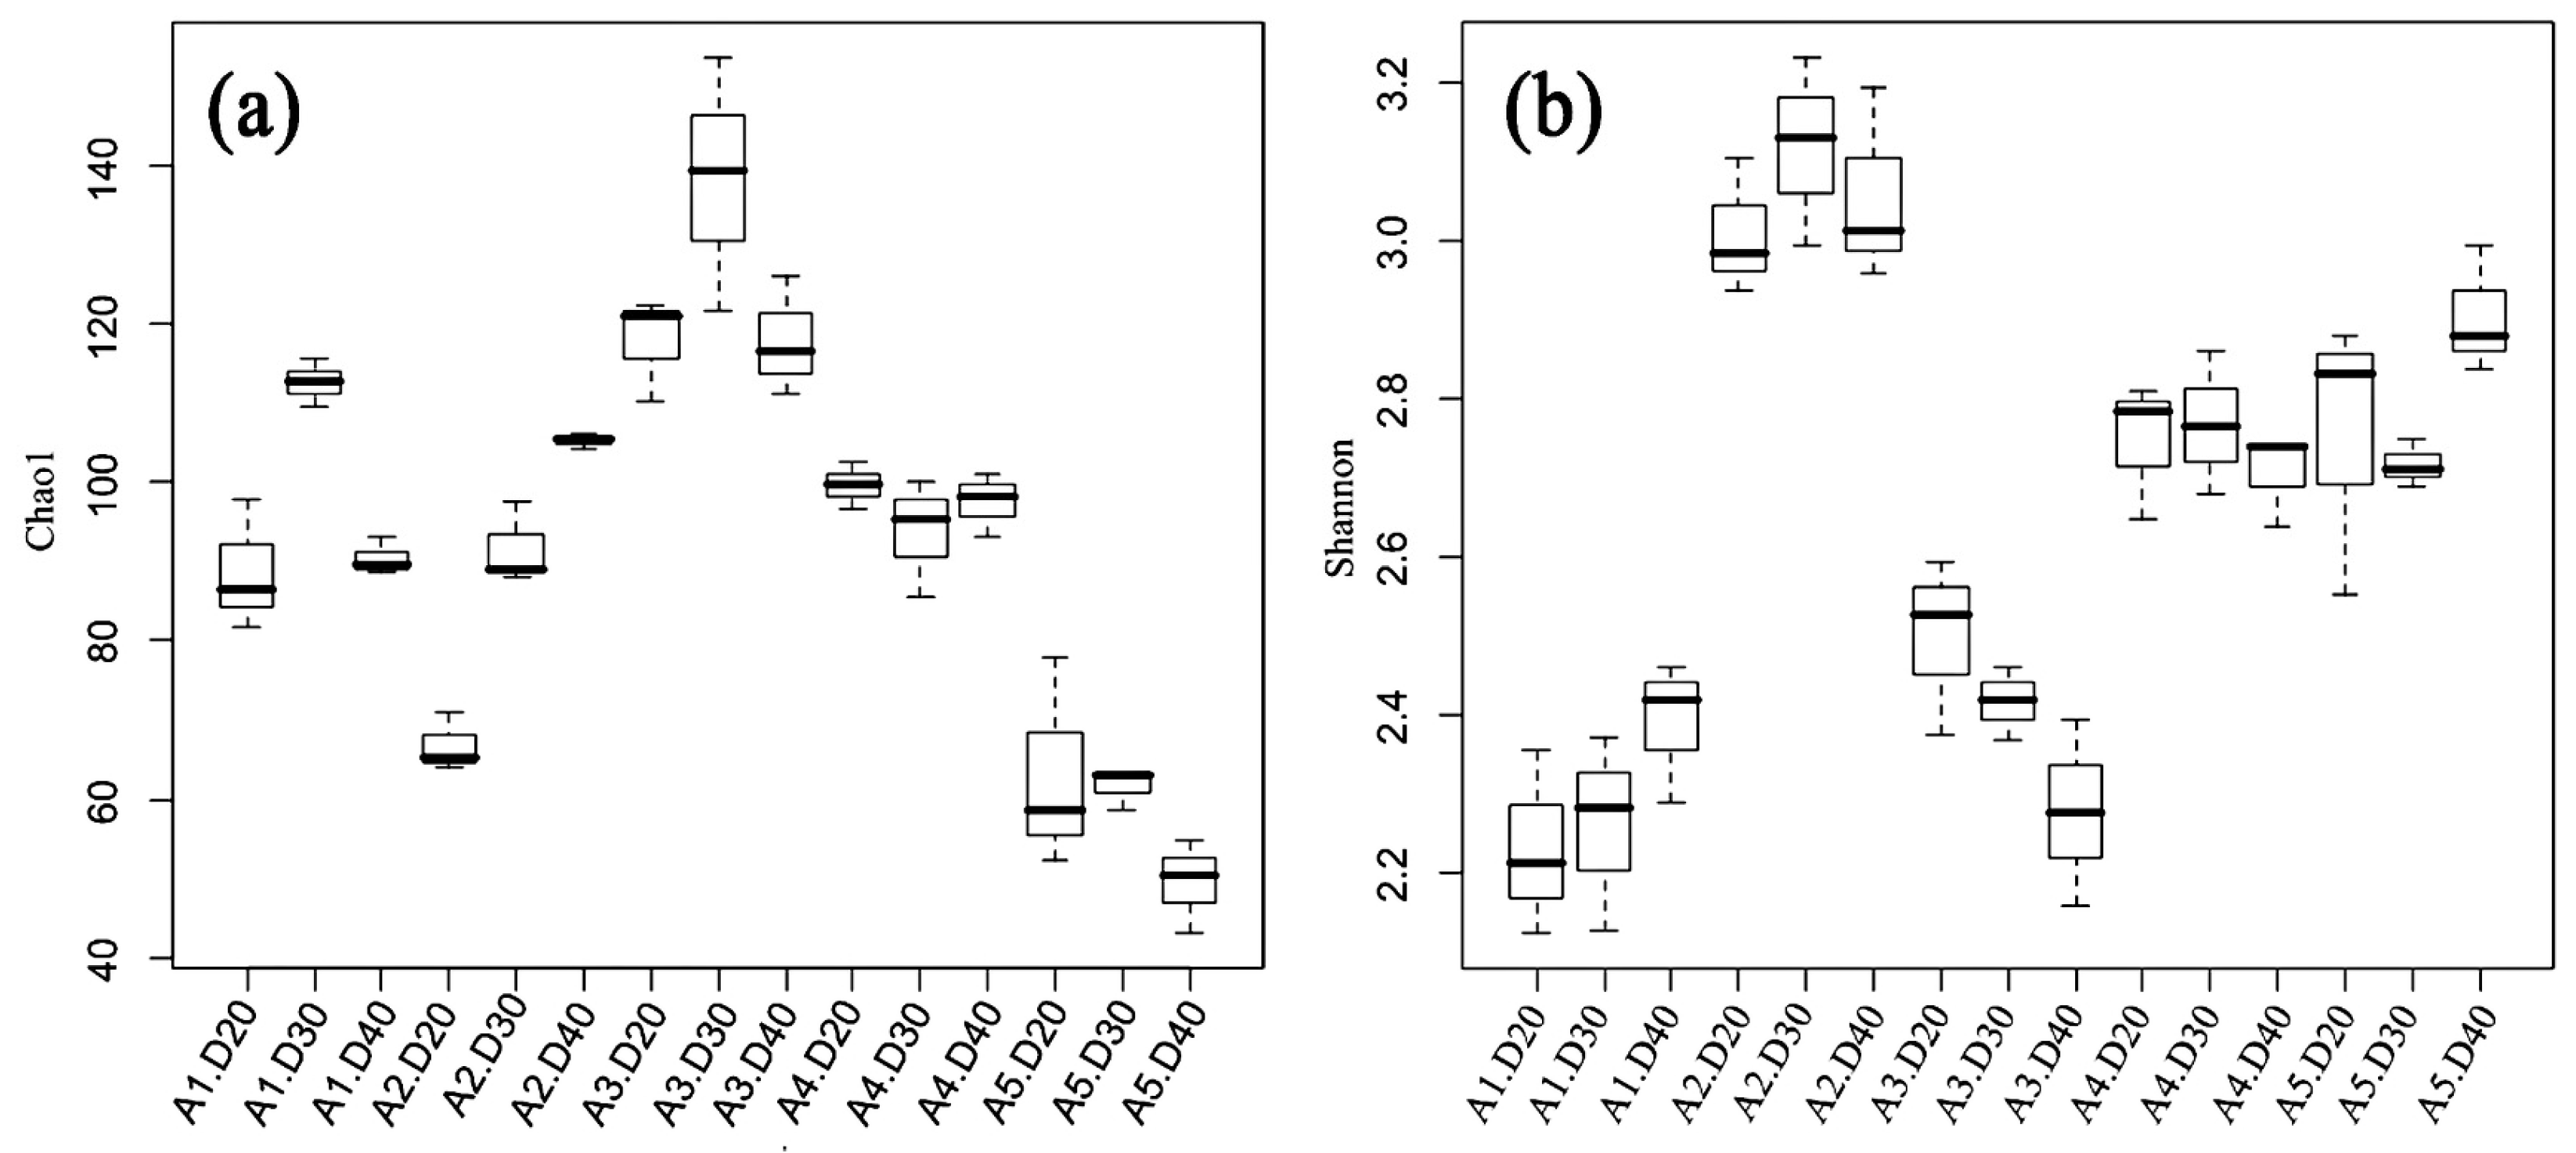
3.3. Diversity and Richness Indices of AMF

The Chao1 richness estimator and the Shannon diversity index were significantly affected by the irrigation treatment (Figure 3). Compared with other treatments, D30 significantly increased (p < 0.05) the Chao1 indices of the soil aggregates in the >2 mm and 0.25–1 mm classes (Figure 3a). Furthermore, the Chao1 indices were the highest for the 0.25–1 mm aggregates and the lowest for the <0.053 mm aggregates.
The Shannon indices did not show a significant difference. For different sizes of the soil aggregates, the lowest values of the Shannon index was found for the >2 mm aggregates and the 0.25–1 mm aggregates, and the highest ones for the 1–2 mm aggregates (Figure 3b).

3.4. AMF Community Structure

More than 58,665 effective tags were obtained for each soil aggregate. Seven AMF genera were identified (Figure 4). The predominant genera were Ambispora, Archaeospora, Gigaspora, Scutellospora, Claroideoglomus, Glomus and Paraglomus. These major genera were present in all aggregates. Among the most abundant genera, Ambispora, Glomus and Paraglomus were the most out-abundant genera in the >0.053 mm aggregate fractions, accounting from 89.6% to 96.8% of the total genera. Ambispora and Glomus were the most OTU-abundant genera in the <0.053 mm fraction, accounting from 86.7% to 94.3% of the total genera. Compared to the other treatments, D30 led to the highest OTU abundance for Glomus, while the OTU abundance of Ambispora was significantly lower.

3.5. Variation of Total Glomalin and Easily Extractable Glomalin Levels

The concentration of EE-GRSP followed a distribution pattern similar to that of T-GRSP (Figure 5). T-GRSP concentration ranged from 0.71 mg g−1 to 2.05 mg g−1 in the aggregates. The macro-aggregates had the greatest concentration of T-GRSP, and the micro-aggregates had the lowest. Compared with D20, D30 and D40 significantly increased the concentration of T-GRSP in the macro-aggregates (p < 0.05). However, the concentration of T-GRSP in the <0.053 mm aggregates at D40 was higher than at D20 and D30.
EE-GRSP level in the aggregates are shown in Figure 5. We observed similar distribution patterns for T-GRSP. EE-GRSP concentration ranged from 0.40 mg g−1 to 0.79 mg g−1 in the aggregates. The 0.25–2 mm aggregates had the greatest concentration of EE-GRSP, whereas the aggregates >2 mm and <0.25 mm had the lowest. Compared with D20 and D40, D30 significantly increased (p < 0.05) the concentration of EE-GRSP in the macro-aggregates. However, the level of EE-GRSP in the <0.053 mm aggregates was higher under the D40 treatment than in the other conditions. Furthermore, there was no significant difference in EE-GRSP concentration between D20 and D30 (p < 0.05).

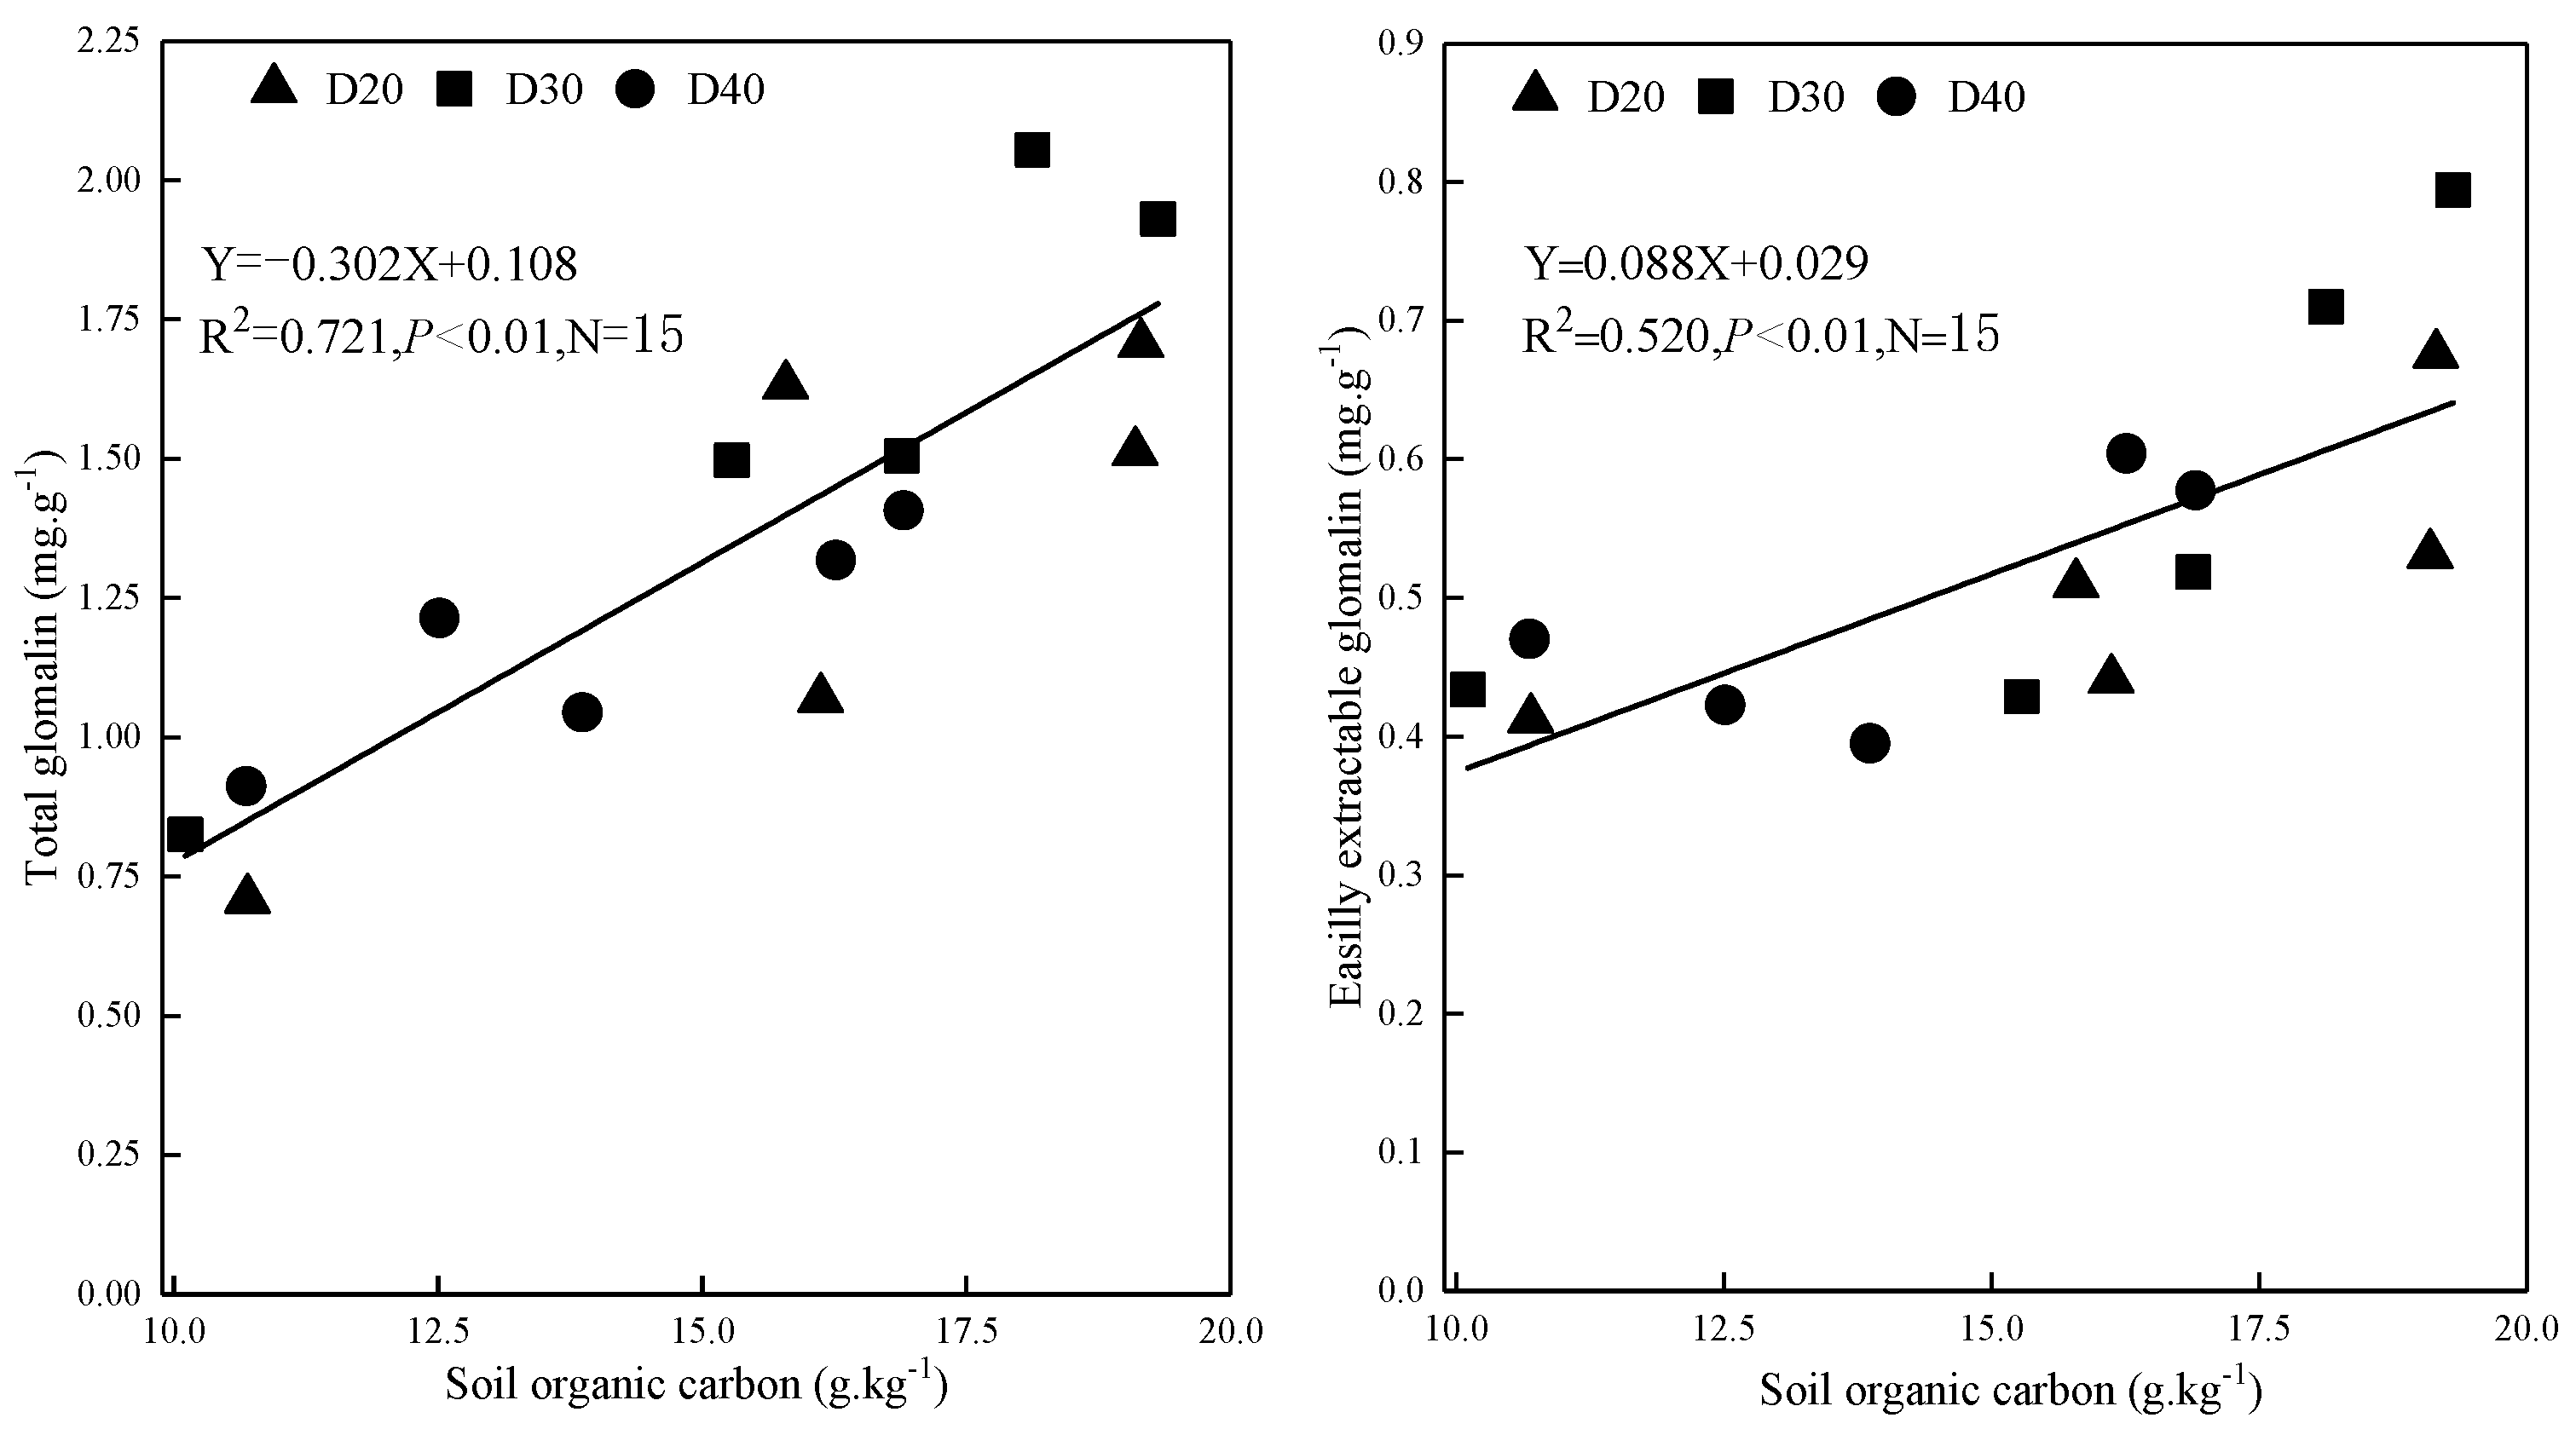
3.6. Relationships between GRSP Concentration, AMF OTU Relative Abundance and Soil Properties

Multivariate redundancy analysis was performed to describe the relationships between AMF communities and soil aggregate properties. In the redundancy analysis (RDA) biplot, the first component (RDA1) and the second component (RDA2) explained 62.3% and 19.7% of the variance, respectively (Figure 6). As indicated by the close grouping and the vectors, the TG-EEG and EE-GRSP levels in the soil aggregates were dominated by SOC and TN.
According to Figure 7, the concentrations of SOC positively correlated with those of T-GRSP (r2 = 0.721) and EE-GRSP (r2 = 0.520). The out-relative-abundant genera Ambispora, Glomus and Paraglomus were positively correlated with the levels of SOC, TN, TG-GRSP and EE-GRSP. However, Archaeospora, Gigaspora, Claroideoglomus and Scutellospora were negatively associated with these soil aggregate parameters.

4. Discussion

4.1. Distribution of Aggregate Size Classes

The different drip irrigation regimes obviously influenced the soil aggregate distribution over the 6-year experiment (Figure 2). In our study, the water content of the soil was different at the same development stage of the tomato plants; the initial water content in the soil changed due to the different drip irrigation regimes. Previous research showed that a soil aggregate size distribution and aggregate stability were affected by the soil initial water condition and the D/W cycles [32]. The proportion of micro-aggregates could be increased when the soil initial water content increased to the saturation state [33]. After two D/W cycles (44 d), the water-stable macro–aggregates were present in a significantly lower proportion, and the macro-aggregates were not disrupted anymore [34].
The D40 irrigation regime had the lowest number of D/W cycles. The large aggregates were disrupted because of the soil shrinking after drying [35]. However, when more D/W cycles were present, as in the 20 kPa irrigation treatment, the proportion of macro-aggregates showed a smaller decrease. It is possible that the aggregates were subjected to a repulsive force and lost apparent cohesion when were frequently exposed to the D/W cycles [36]. Therefore, the values of the MWD varied under different drip irrigation regimes in the following order: D30 > D40 > D20.

4.2. SOC and TN in Different Aggregate Size Classes

Similar studies reported that macro–aggregates contain higher concentrations of SOC and TN than micro-aggregates [27,37,38]. In our greenhouse soil, the contents of SOC and TN were much higher in the macro-aggregates under the D20 and D30 irrigation treatments (Table 1). This indicated that irrigation regimes leading to a smaller soil water suction (high irrigation frequency with low amounts of water) greatly increased the concentrations of SOC and TN in the macro-aggregates. A hierarchical organization of soil aggregates suggests that the macro-aggregates are bound together by gluing agents [27,39]. This theory explains the reduction in the size of the aggregates with the loss of SOC and the increase in the size of the aggregates with the increase in SOC [17,40].
Various other factors, natural and anthropogenic, control SOC and TN accumulation and decomposition, such as climate change, topographical factors, soil–water balance and soil texture [41]. The accumulation and decomposition of SOC and TN occur dependently on the soil water content [42]. Long-term irrigation regimes of croplands altered the soil water retention. In our study, the soil often showed constant values of its water potential for long periods with the three irrigation treatments (D20, D30 and D40). The topsoil (at a 30 cm depth) became saturated and fell into D/W cycles by drying rapidly. Among the three treatments, the D40 significantly decreased the concentration of SOC and TN after 90 days (Table 1). Drying and rewetting probably promoted the mineralization of C and N by disrupting the soil aggregates and causing microbial death or cell lysis [43].
The mineralization of organic matter plays an important role in making nutrients available to plants, and the D/W cycles could reduce soil C and N mineralization [44]. Wetting a soil could rapidly increase carbon mineralization during the first 2–8 h, and then decrease it over the following 12–24 h [45]. C and N would be released more easily after moistening if the soil stored them over prolonged times. In our work, the accumulation of SOC decreased in the D40 treatment because the D40 treatment involved less D/W cycles. Remaining for a longer time in drought increased the aerobic conditions and the oxidative capacity of SOC [42]. These differences might be ascribed to the low soil water content due to the reliance on a drip irrigation regime in the study area.

4.3. AMF community Diversity and Composition

Short-term waterlogging could increase the species richness of AMF. We found seven genera, four of which appeared as dominators (Figure 4), in our test [46]. The irrigation regime altered the soil matrix limiting the energy reserves, leading to AMF death and influencing colonization by affecting the soil nutrient content and pH [24,47,48]. In our study, the values found for the Shannon and Chao1 indices were attributed to the differences in the water amount. The irrigation water used in the D40 treatment was lower than that in D20 and D30. This changed the soil water content and the number of D/W cycles. Large amounts of water could decrease the root colonization by AMF [49]. Waterlogging may change a soil’s characteristics, decrease the soil pH, and increase its labile carbon content [50]. Prolonged flooding created anaerobic conditions and decreased the activity of AMF [51]. AMF are aerobic fungi, and low oxygen levels could inhibit mycorrhizae formation. Therefore, an arid soil is conducive to the growth of these fungi, promoting the development of mycorrhizal infections.
The AMF communities were found to differ greatly among the soil aggregate size classes and depending on agricultural practices [37]. In this work, Ambispora and Glomus were the most common genera. They were dominant in all aggregate size classes. Similar studies also reported that the genera Glomus and Archaeospora were dominant and significantly increased in clay particles [52,53]. Furthermore, macro-aggregates generally harbor a larger biodiversity of AMF than micro-aggregates. Therefore, the AMF community composition shifts with the aggregate size class, depending on the soil matrix, the nutrient, oxygen and water content and other factors [54]. In the 0.25–1 mm soil aggregates, the relative abundance of Paraglomus increased significantly. Actually, this was the result of the sharp decrease in the relative abundance of Claroideoglomus. The richness of Claroideoglomus showed a negative correlation with the SOC level, while the amount of SOC was the highest in the 0.25–1 mm soil aggregates. Creating a special habitat for the soil microorganisms, the different aggregate size classes have a great influence on the AMF community structure, diversity and function. The AMF communities adapt to different drip irrigation frequencies and intensities. However, the mechanisms regulating the microbial composition in soil aggregates needs further study.

4.4. Concentration of GRSP

There are many factors influencing the concentration of GRSP, such as tillage, fertilization, AMF communities and environmental stress [52,55]. Our results showed that the GRSP concentration was influenced by the different drip irrigation regimes and were higher with the D20 and D30 treatments than with the D40. This conclusion is inconsistent with the report that drought stress improved the GRSP concentration [56] and may be due to the changing of the soil initial water content as a result of the different drip irrigation regimes. D40 decreased the frequency and increased the amount of water retained in any single irrigation event (Table S1).
The GRSP content was positively correlated with the soil carbon content, soil aggregate stability and the density of AMF [57]. Over 80% of the GRSP (by weight) produced was contained in the AMF hyphae and spores [58]. GRSP was produced by the species Glomus luteum, Glomus verruculosum and Glomus versiforme [59]. The D20 and D30 treatments led to the highest SOC levels in every aggregate. Therefore, it is possible that the D20 and D30 irrigation treatments increased the diversity of AMF and boosted GRSP production.
GRSP had a strong effect on soil aggregate stabilization, such as dry and water stability [60]. We found that the SOC concentration showed a significantly positive relationship with the T-GRSP (r2 = 0.721) and EE-GRSP (r2 = 0.520) levels in this study (Figure 7). This is in agreement with other investigations [61,62]. SOC concentration is tightly related to GRSP concentration [63]. This suggests that GRSP could play a crucial role in SOC pools. Conversely, SOC and N could be considered predictors of GRSP [64]. Furthermore, our RDA analysis revealed that the T-GRSP and EE-GRSP levels were significantly correlated with the presence of Ambispora, Glomus and Paraglomus. The GRSP values were significantly different in relation to the abundance of Glomus mosseas and Glomus intraradices [16], and the AMF strains may vary considerably dependently on the GRSP concentration [65].

5. Conclusions

This study demonstrated that different drip irrigation regimes could greatly influence aggregate size distribution, AMF community composition, and the concentrations of SOC, TN and GRSP in different aggregate size classes. The soil water suction of 30 kPa led to a favorable low limit of irrigation at a 0–30 cm depth. The macro-aggregates (>0.25 mm) were enhanced by the increased contents of GRSP and SOC. Therefore, irrigating at a suction pressure of 30 kPa was scientifically confirmed to be suitable in this paper.

Supplementary Materials

The following supporting information can be downloaded at: https://www.mdpi.com/article/10.3390/agronomy13020522/s1, Table S1: Irrigation dates and amounts under different drip irrigation treatments; Figure S1: Soil water recession curve of 0–100 kPa.

Author Contributions

Conceptualization, H.Z. and Y.Z. (Yulong Zhang); methodology, X.Y.; investigation and resources, Q.F., N.Y. and Y.Z. (Yuling Zhang); formal analysis/writing—original draft preparation/writing—review and editing, J.M. and J.L.; project administration and funding acquisition, H.Z. and X.Y. All authors have read and agreed to the published version of the manuscript.

Funding

This work was supported by National Natural Science Foundation of China: 32072677; Key projects of the Ministry of Agriculture and Rural Affairs of the PR China: NK2022180201; Liaoning Province Applied Basic Research Plan: 2022JH2/101300173.

Conflicts of Interest

The authors declare no conflict of interest.

References

  1. Camp, C.R. Subsurface drip irrigation: A review. Trans. Asae 1998, 41, 1353–1367. [Google Scholar] [CrossRef]
  2. Musa, M.; Iqbal, M.; Tariq, M.; Sahi, F.H.; Cheema, N.M.; Jahan, F.N. Comparative water use efficiency of drip and furrow irrigation systems for off-season vegetables under plastic tunnel. SAARC J. Agric. 2014, 12, 62–71. [Google Scholar] [CrossRef]
  3. Ślusarski, C.; Spotti, C.A. Efficacy of chloropicrin application by drip irrigation in controlling the soil-borne diseases of greenhouse pepper on commercial farms in Poland. Crop Prot. 2016, 89, 216–222. [Google Scholar] [CrossRef]
  4. Hu, H.; Tian, F.; Hu, H. Soil particle size distribution and its relationship with soil water and salt under mulched drip irrigation in Xinjiang of China. Sci. China Technol. Sci. 2011, 54, 1568. [Google Scholar] [CrossRef]
  5. Liu, X.B.; Zhang, X.Y.; Wang, Y.X.; Sui, Y.Y.; Zhang, S.L.; Herbert, S.J.; Ding, G. Soil degradation: A problem threatening the sustainable development of agriculture in Northeast China. Plant Soil Environ. 2010, 56, 87–97. [Google Scholar] [CrossRef]
  6. Tisdall, J.M.; Oades, J.M. Organic matter and water-stable aggregates in soils. Eur. J. Soil Sci. 1982, 33, 141–163. [Google Scholar] [CrossRef]
  7. Bronick, C.J.; Lal, R. Soil structure and management: A review. Geoderma 2005, 124, 3–22. [Google Scholar] [CrossRef]
  8. Matthiasc, R.; Noorf, M.; Evaf, L.; Pedrom, A. Mycelium of arbuscular mycorrhizal fungi increases soil water repellency and is sufficient to maintain water-stable soil aggregates. Soil Biol. Biochem. 2010, 42, 1189–1191. [Google Scholar]
  9. Gehring, C.A. Chapter 13—Introduction: Mycorrhizas and soil structure, moisture, and salinity. Fertility, Structure, and Carbon Storage. 2017, 235–240, 235–240. [Google Scholar]
  10. Wright, S.F.; Upadhyaya, A. A survey of soils for aggregate stability and glomalin, a glycoprotein produced by hyphae of arbuscular mycorrhizal fungi. Plant Soil 1998, 198, 97–107. [Google Scholar] [CrossRef]
  11. Berruti, A.; Lumini, E.; Balestrini, R.; Bianciotto, V. Arbuscular Mycorrhizal Fungi as Natural Biofertilizers: Let’s Benefit from Past Successes. Front Microbiol. 2016, 6, 1559. [Google Scholar] [CrossRef] [PubMed]
  12. Chao, W.; White, P.J.; Li, C. Colonization and community structure of arbuscular mycorrhizal fungi in maize roots at different depths in the soil profile respond differently to phosphorus inputs on a long-term experimental site. Mycorrhiza 2017, 27, 369. [Google Scholar]
  13. Zhu, Y.G.; Miller, R.M. Carbon cycling by arbuscular mycorrhizal fungi in soil-plant systems. Trends Plant Sci. 2003, 8, 407. [Google Scholar] [CrossRef] [PubMed]
  14. Kohler, J.; Roldán, A.; Campoy, M.; Caravaca, F. Unraveling the role of hyphal networks from arbuscular mycorrhizal fungi in aggregate stabilization of semiarid soils with different textures and carbonate contents. Plant Soil 2017, 410, 273–281. [Google Scholar] [CrossRef]
  15. Rillig, M.C.; Mummey, D.L. Mycorrhizas and soil structure. New Phytol. 2006, 171, 41–53. [Google Scholar] [CrossRef] [PubMed]
  16. Bedini, S.; Pellegrino, E.; Avio, L.; Pellegrini, S.; Bazzoffi, P.; Argese, E.; Giovannetti, M. Changes in soil aggregation and glomalin-related soil protein content as affected by the arbuscular mycorrhizal fungal species Glomus mosseae and Glomus intraradices. Soil Biol. Biochem. 2009, 41, 1491–1496. [Google Scholar] [CrossRef]
  17. Olsson, P.A.; Johnson, N.C. Tracking carbon from the atmosphere to the rhizosphere. Ecol. Lett. 2005, 8, 1264–1270. [Google Scholar] [CrossRef]
  18. Fokom, R.; Adamou, S.; Teugwa, M.C.; Boyogueno, A.D.B.; Nana, W.L.; Ngonkeu, M.E.L.; Tchameni, N.S.; Nwaga, D.; Ndzomo, G.T.; Zollo, P.H.A. Glomalin related soil protein, carbon, nitrogen and soil aggregate stability as affected by land use variation in the humid forest zone of south Cameroon. Soil Tillage Res. 2012, 120, 69–75. [Google Scholar] [CrossRef]
  19. Hodge, A.; Fitter, A.H. Substantial nitrogen acquisition by arbuscular mycorrhizal fungi from organic material has implications for N cycling. Proc. Natl. Acad. Sci. USA 2010, 107, 13754. [Google Scholar] [CrossRef]
  20. Rillig, M.C. Arbuscular mycorrhizae and terrestrial ecosystem processes. Ecol. Lett. 2004, 7, 740–754. [Google Scholar] [CrossRef]
  21. Borie, F.; Rubio, R.; Morales, A. Arbuscular mycorrhizal fungi and soil aggregation hongos micorrícicos arbusculares y agregación de suelo. J. Soil Sci. Plant Nutr. 2008, 8, 9–18. [Google Scholar]
  22. Varelacervero, S.; Vasar, M.; Davison, J.; Barea, J.M. The composition of arbuscular mycorrhizal fungal communities differs among the roots, spores and extraradical mycelia associated with five Mediterranean plant species. Environ. Microbiol. 2015, 17, 2882–2895. [Google Scholar] [CrossRef]
  23. Hontoria, C.; Velásquez, R.; Benito, M.; Almorox, J.; Moliner, A. Bradford-reactive soil proteins and aggregate stability under abandoned versus tilled olive groves in a semi-arid calcisol. Soil Biol. Biochem. 2009, 41, 1583–1585. [Google Scholar] [CrossRef]
  24. Gordon, H.; Haygarth, P.M.; Bardgett, R.D. Drying and rewetting effects on soil microbial community composition and nutrient leaching. Soil Biol. Biochem. 2008, 40, 302–311. [Google Scholar] [CrossRef]
  25. Ye, X.H.; Han, B.; Li, W.; Zhang, X.C.; Zhang, Y.L.; Lin, X.G.; Zou, H.T. Effects of different irrigation methods on nitrous oxide emissions and ammonia oxidizers microorganisms in greenhouse tomato fields. Agric. Water Manag. 2018, 203, 115–123. [Google Scholar] [CrossRef]
  26. Allison, S.D.; Jastrow, J.D. Activities of extracellular enzymes in physically isolated fractions of restored grassland soils. Soil Biol. Biochem. 2006, 38, 3245–3256. [Google Scholar] [CrossRef]
  27. Six, J.; Paustian, K.; Elliott, E.T.; Combrink, C. Soil structure and organic matter: I. Distribution of aggregate-size classes and aggregate-associated carbon. Soil Sci. Soc. Am. J. 2000, 64, 681–689. [Google Scholar] [CrossRef]
  28. Kemper, W.D.; Rosenau, R.C.; Klute, A. Aggregate stability and size distribution. Methods Soil Anal. Part 1 Phys. Mineral. Methods 1986, 5, 425–442. [Google Scholar]
  29. He, F. Bradford Protein Assay. Bio-Protocol 2011, 1, e45. [Google Scholar] [CrossRef]
  30. Sato, K.; Suyama, Y.; Saito, M.; Sugawara, K. A new primer for discrimination of arbuscular mycorrhizal fungi with polymerase chain reaction-denature gradient gel electrophoresis. Grassl. Sci. 2005, 51, 179–181. [Google Scholar] [CrossRef]
  31. Chao, A. Nonparametric Estimation of the Number of Classes in a Population. Scand. J. Stat. 1984, 11, 265–270. [Google Scholar]
  32. Ma, R.; Cai, C.; Li, Z.; Wang, J.; Xiao, T.; Peng, G.; Yang, W. Evaluation of soil aggregate microstructure and stability under wetting and drying cycles in two Ultisols using synchrotron-based X-ray micro-computed tomography. Soil Tillage Res. 2015, 149, 1–11. [Google Scholar] [CrossRef]
  33. Truman, C.C.; Bradford, J.M.; Ferris, J.E. Antecedent Water Content and Rainfall Energy Influence on Soil Aggregate Breakdown. Soil Sci. Soc. Am. J. 1990, 54, 1385–1392. [Google Scholar] [CrossRef]
  34. Denef, K.; Six, J.; Paustian, K.; Merckx, R. Importance of macroaggregate dynamics in controlling soil carbon stabilization: Short-term effects of physical disturbance induced by dry–wet cycles. Soil Biol. Biochem. 2001, 33, 2145–2153. [Google Scholar] [CrossRef]
  35. Lado, M.; Ben-Hur, M.; Shainberg, I. Soil Wetting and Texture Effects on Aggregate Stability, Seal Formation, and Erosion. Soil Sci. Soc. Am. J. 2004, 68, 1992–1999. [Google Scholar] [CrossRef]
  36. Wang, E.; Cruse, R.M.; Chen, X.; Daigh, A. Effects of moisture condition and freeze/thaw cycles on surface soil aggregate size distribution and stability. Can. J. Soil Sci. 2012, 92, 529–536. [Google Scholar] [CrossRef]
  37. Chen, X.; Li, Z.; Liu, M.; Jiang, C.; Che, Y. Microbial community and functional diversity associated with different aggregate fractions of a paddy soil fertilized with organic manure and/or NPK fertilizer for 20 years. J. Soils Sediments 2015, 15, 292–301. [Google Scholar] [CrossRef]
  38. Qiu, L.; Wei, X.; Gao, J.; Zhang, X. Dynamics of soil aggregate-associated organic carbon along an afforestation chronosequence. Plant Soil 2015, 391, 237–251. [Google Scholar] [CrossRef]
  39. Sainju, U.M.; Caesar-TonThat, T.; Jabro, J.D. Carbon and nitrogen fractions in dryland soil aggregates affected by long-term tillage and cropping sequence. Soil Sci. Soc. Am. J. 2009, 73, 1488–1495. [Google Scholar] [CrossRef]
  40. McCarthy, J.F.; Ilavsky, J.; Jastrow, J.D.; Mayer, L.M.; Perfect, E.; Zhuang, J. Protection of organic carbon in soil microaggregates via restructuring of aggregate porosity and filling of pores with accumulating organic matter. Geochim. Et Cosmochim. Acta 2008, 72, 4725–4744. [Google Scholar] [CrossRef]
  41. Zinn, Y.L.; Lal, R.; Resck, D.V.S. Texture and organic carbon relations described by a profile pedotransfer function for Brazilian Cerrado soils. Geoderma 2005, 127, 168–173. [Google Scholar] [CrossRef]
  42. Li, D.; Shao, M.A. Soil organic carbon and influencing factors in different landscapes in an arid region of northwestern China. Catena 2014, 116, 95–104. [Google Scholar] [CrossRef]
  43. Turner, B.L.; Driessen, J.P.; Haygarth, P.M.; Mckelvie, I.D. Potential contribution of lysed bacterial cells to phosphorus solubilisation in two rewetted Australian pasture soils. Soil Biol. Biochem. 2003, 35, 187–189. [Google Scholar] [CrossRef]
  44. Mikha, M.M.; Rice, C.W.; Milliken, G.A. Carbon and nitrogen mineralization as affected by drying and wetting cycles. Soil Biol. Biochem. 2005, 37, 339–347. [Google Scholar] [CrossRef]
  45. Mcinerney, M.; Bolger, T. Temperature, wetting cycles and soil texture effects on carbon and nitrogen dynamics in stabilized earthworm casts. Soil Biol. Biochem. 2000, 32, 335–349. [Google Scholar] [CrossRef]
  46. Yang, H.; Koide, R.T.; Zhang, Q. Short-term waterlogging increases arbuscular mycorrhizal fungal species richness and shifts community composition. Plant Soil 2016, 404, 373–384. [Google Scholar] [CrossRef]
  47. Stevens, K.J.; Spender, S.W.; Peterson, R.L. Phosphorus, arbuscular mycorrhizal fungi and performance of the wetland plant Lythrum salicaria L. under inundated conditions. Mycorrhiza 2002, 12, 277. [Google Scholar] [PubMed]
  48. Yıldırım, O.; Halloran, N.; Çavuşoğlu, S.; ŞEngül, N. Effects of different irrigation programs on the growth, yield, and fruit quality of drip-irrigated melon. Turk. J. Agric. For. 2014, 33, 243–255. [Google Scholar]
  49. Miller, S.P.; Sharitz, R.R. Manipulation of Flooding and Arbuscular Mycorrhiza Formation Influences Growth and Nutrition of Two Semiaquatic Grass Species. Funct. Ecol. 2010, 14, 738–748. [Google Scholar] [CrossRef]
  50. Mendoza, R.; Escudero, V.; García, I. Plant growth, nutrient acquisition and mycorrhizal symbioses of a waterlogging tolerant legume (Lotus glaber Mill.) in a saline-sodic soil. Plant Soil 2005, 275, 305–315. [Google Scholar] [CrossRef]
  51. Braunberger, P.G.; Abbott, L.K.; Robson, A.D. Infectivity of arbuscular mycorrhizal fungi after wetting and drying. New Phytol. 1996, 134, 673–684. [Google Scholar] [CrossRef]
  52. Dai, J.; Hu, J.; Zhu, A.; Bai, J.; Wang, J.; Lin, X. No tillage enhances arbuscular mycorrhizal fungal population, glomalin-related soil protein content, and organic carbon accumulation in soil macroaggregates. J. Soils Sediments 2015, 15, 1055–1062. [Google Scholar] [CrossRef]
  53. Daniell, T.J.; Husband, R.; Fitter, A.H.; Young, J.P.W. Molecular diversity of arbuscular mycorrhizal fungi colonising arable crops. Fems Microbiol. Ecol. 2001, 36, 203. [Google Scholar] [CrossRef]
  54. Ladd, J.N.; Gestel, M.V.; Monrozier, L.J.; Amato, M. Distribution of organic 14 C and 15 N in particle-size fractions of soils incubated with 14 C, 15 N-labelled glucose/NH 4, and legume and wheat straw residues. Soil Biol. Biochem. 1996, 28, 893–905. [Google Scholar] [CrossRef]
  55. Hammer, E.C.; Rillig, M.C. The Influence of Different Stresses on Glomalin Levels in an Arbuscular Mycorrhizal Fungus—Salinity Increases Glomalin Content. PLoS ONE 2011, 6, e28426. [Google Scholar] [CrossRef] [PubMed]
  56. Josef, K.; Fuensanta, C.; Antonio, R. Effect of drought on the stability of rhizosphere soil aggregates of Lactuca sativa grown in a degraded soil inoculated with PGPR and AM fungi. Appl. Soil Ecol. 2009, 42, 160–165. [Google Scholar]
  57. Lovelock, C.E.; Wright, S.F.; Nichols, K.A. Using glomalin as an indicator for arbuscular mycorrhizal hyphal growth: An example from a tropical rain forest soil. Soil Biol. Biochem. 2004, 36, 1009–1012. [Google Scholar] [CrossRef]
  58. Driver, J.D.; Holben, W.E.; Rillig, M.C. Characterization of glomalin as a hyphal wall component of arbuscular mycorrhizal fungi. Soil Biol. Biochem. 2005, 37, 101–106. [Google Scholar] [CrossRef]
  59. Saidi, A.; Husin, E.F.; Rasyidin, A.; Eddiwal, E.; Ismon, L. Selection of Aruscular Mycorrhizal Fungi (AMF) indigeneus in ultisol for promoting the production of glmalin and aggregate formation processes. Int. J. Adv. Sci. Eng. Inf. Technol. 2015, 4, 430. [Google Scholar] [CrossRef]
  60. Wu, Q.S.; Cao, M.Q.; Zou, Y.N.; He, X. Direct and indirect effects of glomalin, mycorrhizal hyphae, and roots on aggregate stability in rhizosphere of trifoliate orange. Sci. Rep. 2014, 4, 5823. [Google Scholar] [CrossRef]
  61. Rillig, M.C.; Maestre, F.T.; Lamit, L.J. Microsite differences in fungal hyphal length, glomalin, and soil aggregate stability in semiarid Mediterranean steppes. Soil Biol. Biochem. 2003, 35, 1257–1260. [Google Scholar] [CrossRef]
  62. Yang, Y.; He, C.; Li, H.; Ban, Y.; Ming, T. The effects of arbuscular mycorrhizal fungi on glomalin-related soil protein distribution, aggregate stability and their relationships with soil properties at different soil depths in lead-zinc contaminated area. PLoS ONE 2017, 12, e0182264. [Google Scholar] [CrossRef] [PubMed]
  63. Wu, Q.S.; Huang, Y.M.; Yan, L.; Nasrullah; He, X.H. Contribution of arbuscular mycorrhizas to glomalin-related soil protein, soil organic carbon and aggregate stability in citrus rhizosphere. Int. J. Agric. Biol. 2014, 16, 207–212. [Google Scholar]
  64. Rillig, M.C.; Ramsey, P.W.; Morris, S.; Paul, E.A. Glomalin, an arbuscular-mycorrhizal fungal soil protein, responds to land-use change. Plant Soil 2003, 253, 293–299. [Google Scholar] [CrossRef]
  65. Peng, S.; Guo, T.; Liu, G. The effects of arbuscular mycorrhizal hyphal networks on soil aggregations of purple soil in southwest China. Soil Biol. Biochem. 2013, 57, 411–417. [Google Scholar] [CrossRef]
Figure 1. Profile of the tomato planting method.
Agronomy 13 00522 g001
Figure 2. Soil aggregate size distribution and mean weight diameter (MWD). Note: the relative abundance and MWD were different significantly (p < 0.05).
Agronomy 13 00522 g002
Figure 3. AMF diversity indexes Chao1 (a) and Shannon (b) for the soil aggregates. Note: A, aggregate size class (A1: >2 mm, A2: 1–2 mm, A3: 0.25–1 mm, A4: 0.053–0.25 mm, A5: <0.053 mm).
Agronomy 13 00522 g003
Figure 4. Genera and relative abundance of AMF in the soil aggregates. Note: A, aggregate size class (A1: >2 mm, A2: 1–2 mm, A3: 0.25–1 mm, A4: 0.053–0.25 mm, A5: <0.053 mm).
Agronomy 13 00522 g004
Figure 5. Variation of total glomalin and easily extractable glomalin levels in the aggregates. Note: Different lowercase letters within the same column denote significant differences (p < 0.05).
Agronomy 13 00522 g005
Figure 6. Comparison of the AMF communities in the soil via RDA. Note: A, aggregate size class (A1: >2 mm, A2: 1–2 mm, A3: 0.25–1 mm, A4: 0.053–0.25 mm, A5: <0.053 mm).
Agronomy 13 00522 g006
Figure 7. Concentration of SOC in relation to those of T−GRSP or EE−GRSP.
Agronomy 13 00522 g007
Table 1. Distribution of SOC, TN and C/N ratio according to the aggregate size class under different drip irrigation treatments.
Aggregate Size Class
(cm)
TreatmentSOC
(g kg−1)
TN
(g kg−1)
C/N Ratio
>2D2015.79 ± 0.21 a1.48 ± 0.02 a10.73 ± 0.06 b
D3016.89 ± 0.56 a1.33 ± 0.05 a12.92 ± 0.07 a
D4012.51 ± 1.26 b1.24 ± 0.09 b10.07 ± 0.38 b
1–2D2019.15 ± 1.42 a1.87 ± 0.06 a11.02 ± 0.53 a
D3019.31 ± 1.92 a1.93 ± 0.10 a10.08 ± 0.47 a
D4016.91 ± 0.80 b1.62 ± 0.03 b10.44 ± 1.06 a
0.25–1D2019.10 ± 0.39 a1.76 ± 0.01 a11.06 ± 0.28 a
D3018.13 ± 0.46 b1.73 ± 0.01 a10.45 ± 0.20 a
D4016.26 ± 0.35 c1.68 ± 0.03 b10.03 ± 0.16 a
0.053–0.25D2016.12 ± 0.43 a1.47 ± 0.11 a10.32 ± 0.17 a
D3015.28 ± 0.40 a1.48 ± 0.14 a10.74 ± 0.72 a
D4013.87 ± 0.84 b1.31 ± 0. 06 b10.16 ± 0.41 a
<0.053D2010.70 ± 0.37 a1.12 ± 0.07 a9.87 ± 0.08 a
D3010.11 ± 0.50 a1.08 ± 0.04 a9.29 ± 0.20 a
D4010.69 ± 0.34 a1.14 ± 0.02 a9.34 ± 0.16 a
A*******
D*****NS
A × D**NSNS
Note: the values are the means of three replicates; the standard errors are parentheses. Different lowercase letters within the same column denote significant differences (p < 0.05). A, aggregate size class; D, drip irrigation regime; NS, not significant; * p < 0.05; ** p < 0.01; *** p < 0.001.
Disclaimer/Publisher’s Note: The statements, opinions and data contained in all publications are solely those of the individual author(s) and contributor(s) and not of MDPI and/or the editor(s). MDPI and/or the editor(s) disclaim responsibility for any injury to people or property resulting from any ideas, methods, instructions or products referred to in the content.

