Article

Phosphorus Application during Rapeseed Season Combined with Straw Return Improves Crop Productivity and Soil Bacterial Diversity in Rape-Rice Rotation

School of Life Science and Engineering, Southwest University of Science and Technology, Mianyang 621010, China
*
Author to whom correspondence should be addressed.
These authors contributed equally to this work.
Agronomy 2023, 13(2), 506; https://doi.org/10.3390/agronomy13020506
Submission received: 6 January 2023 / Revised: 5 February 2023 / Accepted: 6 February 2023 / Published: 9 February 2023

Abstract

:
Rape-rice rotation uses large amounts of phosphate fertilizers with low utilization rates and large amounts of straw. Therefore, it is necessary to establish a suitable phosphorus fertilizer application mode for straw-returning in a rape-rice rotation system. The treatments were: P application with straw return (T2) and without straw return (T1), no P application in either rapeseed season (P1), application of 120 kg·ha−1 P2O5 on rapeseed and 90 kg·ha−1 P2O5 on rice (P2), application of 120 kg·ha−1 P2O5 only on rapeseed (P3), and application of 90 kg·ha−1 P2O5 only on rice (P4). The results showed that the maximum rapeseed grain yields of T2P3 were increased by 15.57% and 21.05% in 2019 and 18.02% and 32.69% in 2020 compared with those of T2P2 and T2P4, respectively. In the rice season, the maximum yields of T2P3 increased by 17.31% and 6.67% in 2019 and 16.42% and 5.23% in 2020 compared to those of T2P2 and T2P4, respectively. Meanwhile, soil bacterial diversity reached its highest under the T2P3 and T2P2 treatments, but the difference was not statistically significant. Straw return combined with phosphorus application of 120 kg·ha−1 during rape season increased crop productivity and diversity of the soil bacterial community structure during rape-rice rotation.

1. Introduction

Rape-rice rotation is a common water and drought rotation system in the Yangtze River Basin [1]. The application of phosphorus fertilizer is a high-yield cultivation measure in this crop rotation system. Currently, the recommended amount of phosphate fertilizer has been reported in the rape and rice seasons [2,3]. Because of different varieties, soil conditions, and field climate, the recommended amount of phosphate fertilizer for rapeseed is 45–145 kg·ha−1, and the amount of phosphate fertilizer for rice is 55–90 kg·ha−1 [4,5]. However, the utilization rate of phosphate fertilizers in the current season is only 10%−20% [6]. A large amount of phosphate fertilizer is adsorbed and fixed by the soil, becoming a potential phosphorus source for subsequent crops [7], which provides conditions for reducing phosphorus fertilizer application in the rape-rice rotation system.
In water-drought rotation, the seasonal alternation of water and changes in soil Eh value reflected in the forms by which phosphorus was available in the soil and affected its plant uptake [8]. After flooding in paddy fields, phosphorus availability to rice increased due to the reduction of Fe3+ and increased solubility of Ca-P compounds [9]. However, after the conversion from water to dry farming, the effectiveness of phosphorus is reduced, mainly affecting the morphological composition of inorganic phosphorus [10]. Meanwhile, phosphorus entering the soil forms insoluble compounds, such as Al-P, Fe-P, and Ca-P with Fe3+, Al3+, and Ca2+ in the soil and is adsorbed on the surface of soil particles [11]. The effectiveness of phosphorus on rape has decreased, and more phosphorus fertilizers are needed [12]. Therefore, the reasonable distribution and application amount of phosphorus fertilizer in the two seasons under water-drought rotation is of great significance for improving the annual utilization efficiency of phosphorus fertilizer and reducing non-point source pollution [13].
In recent years, straw return has become the main treatment method for straw after crop harvest with the promotion of straw-returning technology in production. On the one hand, straw returns to the soil to supplement organic carbon sources, nitrogen, phosphorus, and potassium to improve physical and chemical properties [14,15]. In contrast, straw decomposition produces organic acids to promote the dissolution of soil inorganic phosphorus and the growth of soil microorganisms with a phosphorus-solubilizing function [16]. Fan et al. also believed that soil microorganisms were active in humification after straw return, and the number of efficient phosphate-solubilizing bacteria and microbial populations increased, which aggravated soil phosphorus activity and increased soil available phosphorus content [17]. In terms of microbial community structure and diversity, Guo Lijin et al. reported that straw return and phosphorus application significantly increased the biomass and diversity of soil bacteria [18] while Sun et al. believed that straw return had little effect on the soil bacterial community, which was related to the physical and chemical properties and nutrient content of the soil itself [19]. The above studies showed that the response of soil bacterial communities to straw return was affected by soil physical and chemical properties and nutrient content. Therefore, it is necessary to strengthen the understanding of soil bacterial community structure under straw return and different phosphorus treatments.
There are few reports on straw returning and reducing phosphate fertilizer application under rape-rice rotation. In this long-term positioning experiment, we analyzed and compared the effects of straw returning and different phosphate fertilizer applications on crop productivity, soil bacterial community structure, and phosphate-solubilizing bacteria under rape-rice rotation to provide a scientific basis and optimized application of phosphate fertilizer for rape-rice rotation.

2. Materials and Methods

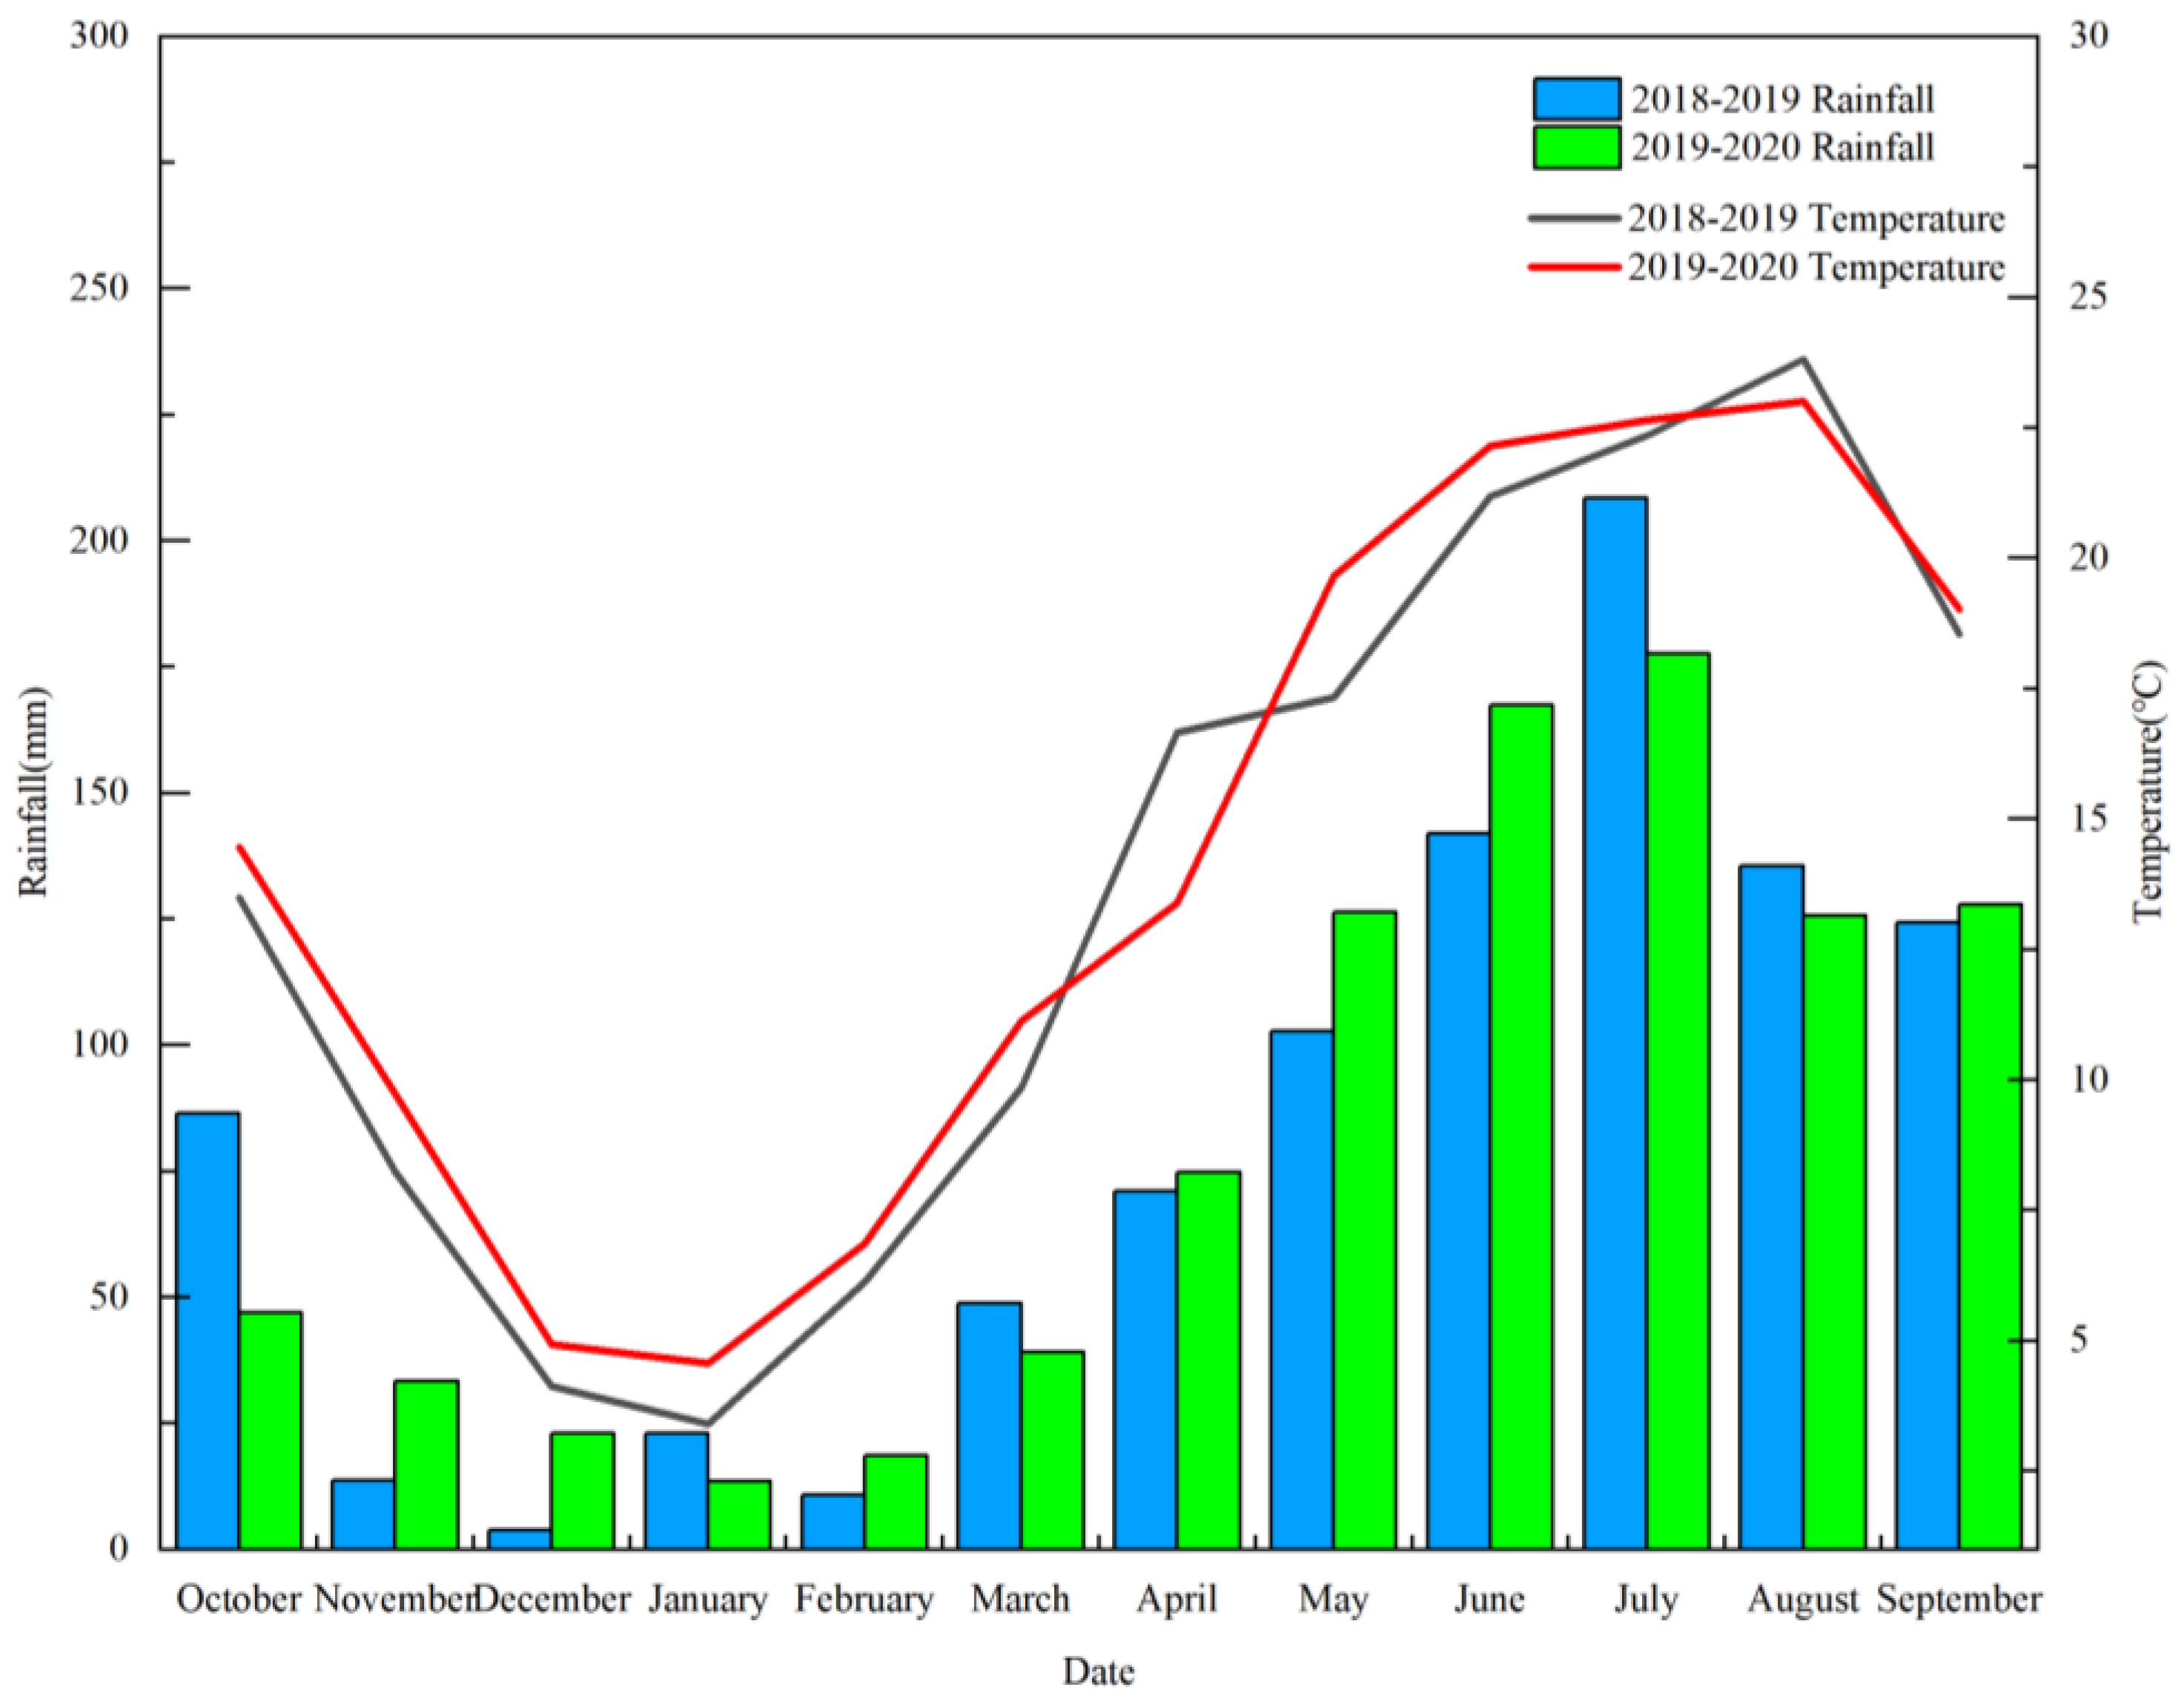
2.1. Experimental Site

The experiments were conducted in 2018, 2019, and 2020 in the experimental Base of the Southwest University of Science and Technology (31.31′ N, 104.67′ E), Mianyang City, Sichuan Province, China. Before the experiment, a winter rape-rice rotation system was used in the paddy field. The experimental field was divided into 24 plots after the rice harvest in September 2018. Bunds surrounded the plots, with a width of 40 cm and a height of 25 cm. All bunds were covered with a plastic film installed at a depth of 20 cm below the soil surface to avoid the flow of water and fertilizer. The plot area was 10.46 m2. The soil in the experimental field was fluvo-aquic, a typical soil type in this area. The organic matter, including total nitrogen (N), total phosphorus (P2O5), Olsen-p, and total potassium content, and pH in the upper 20 cm of soil after rice harvesting were 2.15%, 1.61g·kg−1, 5.81g·kg−1, 12.8g kg−1, and 6.1, respectively. The meteorological data during the experiment are shown in Figure 1.
Rapeseed-rice rotation is the primary cropping system in the region, with two crops per year. The winter rapeseed trial began in October 2018, and the rice trial began after harvesting during the first rapeseed season. This trial is currently ongoing. The seedling-transplanting method was adopted for winter rape. The seedlings were raised on September 1 and transplanted on October 12 every year. The transplanting density was 114,300 plants·ha−1 and harvested the following year on May 1. Rice adapts to the method of seeding and transplanting. Dry-raised rice seedlings were grown on April 1 of each year and transplanted on May 7. The transplanting density was 163,800 plants·ha−1,, and the plants were harvested on September 25. The winter rapeseed variety was Chuanyou 46, and the rice variety was Jingliangyou 534.

2.2. Experimental Design

The study was laid out in a randomized complete block design (RCBD) with three replications. Two different straw-returning methods were used: no straw returning (T1) and straw returning (T2) under four P application modes with eight treatments. The Four P application modes are listed in Table 1. The aboveground part of the previous crop straw was removed from the plot without straw return. In the plot with returning straws, the previous crop straw was crushed to 5–7 cm with a pulverizer and plowed into a 15 cm soil layer using a rotary cultivator.
In the winter rapeseed season, a fertilizer dose of 180:150 kg N:K2O ha−1 was applied to all treatments, and phosphate fertilizer was applied according to Table 1. Full P2O5, 50% of the N, and full K2O were applied as basal fertilizers, and 50% N was applied at the bud stage. In the rice season, a fertilizer dose of 180:225 kg N: K2O ha−1 was applied to all treatments, and phosphate fertilizer was applied according to Table 1. Full P2O5, 50% of the N, and full K2O were applied as basal fertilizers, 30% N was applied at the mid-tillering stage while residual N was applied at the panicle initiation stage. The nitrogen, phosphorus, and potassium fertilizers used in the experiment were urea (46% N content), calcium superphosphate (16% P2O5 content), and potassium chloride (60% K2O content), respectively. Cultivation management during rice and oilseed rape planting was carried out according to the local high-yielding methods.

2.3. Data Record

2.3.1. Grain Yield and Components of Rapeseed

At rape maturity, in each plot, 20 plants were randomly selected to determine yield traits, number of pods per plant, number of seeds per pod, and 1000-grain weight. After a single harvest in each plot, the yield was measured after drying to remove impurities.

2.3.2. Leaf Area Index (LAI) and Aboveground Dry Matter Weight of Rice in the Main Growth Period

Plant samples were collected at the maximum tillering stage (MT), full heading stage (FH), and maturity stage (MS), according to the average number of tillers. Plant samples were washed with water to remove the roots and divided into stems, leaves, and panicles (full heading and maturity stages). The LAI was measured (MT and FH) and dried at 70 °C for 30 min after inactivation at 105 °C until the mass was constant, weighed, and the aboveground dry matter mass was calculated.

2.3.3. Maximum Tiller Number and Ratio of the Tiller

The number of tillers was surveyed every four days during the tillering stage using a fixed set of 30 holes after transplantation. The final effective number of tillers was recorded to calculate the spike rate: spike rate = effective spikes/maximum number of tillers.

2.3.4. Determination of Chlorophyll Content in Rice Flag Leaf

After the heading stage, rice flag leaves under each treatment were taken every seven days, and the middle of the leaf without veins was used as the test material. Each time, 0.1 g of leaves were weighed into a 25 mL test tube, 25 mL of a 5:5 (v/v) mixture of anhydrous ethanol and acetone extract was added, and the tubes were placed in the dark to extract chlorophyll from the leaves. After the leaves had faded entirely, the volume was adjusted to 25 mL using the extraction reagent. The absorbance was measured at 663 and 646 nm using the extracting reagent as a blank and was calculated as follows:
Chlorophyll a mass concentration = 12.2 × OD663 − 2.83 × OD646.
Chlorophyll b mass concentration = 20.11 × OD646 − 5.02 × OD663
Chlorophyll content (mg/g) = mass concentration of chlorophyll a or b
(mg/L) × total extract (mL)/fresh mass of leaves × 1000.

2.3.5. Grain Yield and Components of Rice

At maturity, 20 plants were selected according to the average effective panicle for seed testing (to determine the number of grains per panicle, seed-setting rate, and 1000-grain weight). After a single harvest in each plot, the yield was measured after drying to remove impurities.

2.3.6. Soil Total Phosphorus Content and Olsen-P Content

Soil samples were taken from 0 to 20 cm deep by the diagonal method at the mature stage of rape, after rice transplantation at the start tillering stage (ST), maximum tillering stage (MT), full heading stage (FH), and mature stage (MS) of rice, and three points were sampled in 2019 and 2020. The soil weighed approximately 600 g. After mixing the soil samples, the animal and plant residues were removed, bagged, returned to a dry and ventilated place, and naturally dried in the shade. After drying, the soil was crushed, sieved, packed in a sealed bag, and stored in the shade. Sample Determination Reference Lu R K Soil Total Phosphorus and Olsen-P content determination methods [20].

2.3.7. Determination of Soil Bacterial Diversity and Community Structure

In 2020, after rice transplanting at the start tillering stage (ST), 0–20 cm of fresh soil under each treatment was collected diagonally, and all animal and plant residues were screened out. Soil samples (0.5 g) from each treatment were used for DNA extraction using a MoBio PowerSoil® DNA Extraction Kit (12888). Purified genomic DNA was used as a polymerase chain reaction (PCR) template. Bacterial V3-V4 region was amplified using the 515F (5′-GTGCCAGCMGCCGCGG-3′) and 907R (5′-CCGTCA ATTCMTTTRAGTTT-3′) primers. The conditions for PCR are 25 µL reaction system, ten times, PCR buffer 5 µL (with MgCl2), dNTP 0.5 µL, forward and reverse primers 0.5 µL each, Tap enzyme 0.25 µL (250 U), DNA template 1 µL, and ddH2O filled to 25 µL. The PCR reaction comprised the following steps: pre-denaturation at 98 °C for 3 min; 25 cycles of 98 °C for 15 s, 50 °C for 30 s, and 72 °C for 30 s, and extension at 72 °C for 7 min. PCR products were detected using 1.7% agarose gel electrophoresis, followed by high-throughput sequencing on the Illumina MiSeq sequencing platform. After obtaining the original sequences and performing quality control, they were clustered into operational taxonomic units (OTUs) with a 97% sequence similarity level. Classification and annotation were performed according to the RDP and UNITE databases to obtain corresponding bacterial and fungal taxonomic information.

2.4. Data Analysis

The sequences obtained by high-throughput sequencing were analyzed according to the following steps: (1) double-ended sequences were spliced using FLASH, (2) Cutadapt was used to remove the primers, and (3) QIIME was used to remove low-quality sequences with mass fractions less than 20 and sequences shorter than 300 bp. (4) using RDP database to remove chimaeras. (5) The high-quality sequences obtained by Uparse software were divided into OTUs with 97% similarity and annotated with Greengeens 13.8 database, the BLAST method. Alpha diversity (Shannon and Shannon indices) was analyzed based on the number of OTUs in the samples. SPSS 22.0 software was used for two factors analysis of variance, and Pearson’s two-tailed test was used for correlation analysis. Duncan’s New Multiple Range Test was used for multiple comparisons of mean values (p < 0.05). Microsoft Excel 2010 and Origin 8.0 software were used for data processing and graph plotting.

3. Results

3.1. Effects of Straw Returning and Different P Application Modes on Rape Yield

The straw return and P application mode significantly affected rapeseed yield in 2019 and 2020 and were closely related to the number of pods per plant (Table 2). For the same P application mode, compared with T1, T2 significantly increased the rapeseed yield by 11.46% and 6.41% in 2019 and 2020, respectively. This impact is because T2 increased the number of pods per plant, the number of seeds per pod, and 1000-grain wight compared to T1. The maximum rapeseed yield was observed in the T2P3 treatments, which was significantly higher than that of other treatments during both years. Compared with T2P2, T2P3 significantly increased the rapeseed yield by 15.57% in 2019 and 21.05% in 2020. This yield increment followed the increase in the number of pods per plant and seeds per pod in both years. However, compared with T2P2, T2P4 did not significantly decrease the rapeseed yield in 2019, but it significantly decreased by 8.77% in 2020 because of a decrease in the number of pods per plant in two years. Still, T2P4 significantly increased the 1000-grain wight in 2019 and notably enhanced the number of seeds per pod in both years.

3.2. Effect of Straw Return and Different P Application Modes on Dry Matter Accumulation in Rice during the Main Growth Periods

Different treatments significantly affected dry matter accumulation in rice during the main growth periods in 2019 and 2020 (Table 3). Under the same P application mode, the dry matter accumulation at the highest tillering stage in T2 treatment decreased by 5.49% and 4.21% in 2019 and 2020, respectively, compared with that in T1, but increased at the highest tillering stage-maturity stage. Under the same P application mode, compared with T1, the dry matter accumulation at the mature stage in T2 increased by 3.56% and 4.40% in 2019 and 2020, respectively. The maximum dry matter accumulation in the main growth stages of rice was observed in the T2P3 treatment, which was significantly higher than that in T2P2 during both trial years. At the full heading stage, T2P3 treatment increased by 6.34% in 2019 and 10.09% in 2020, compared with T2P2 treatments. At the maturity stage, compared with T2P2, T2P3 notably increased by 5.56% and 10.85% in 2019 and 2020, respectively, while the difference between T2P3 and T2P4 treatments was not significant in 2020.

3.3. Effect of Straw Return and Different P Application Modes on the Pre-Flowering Dry Matter Output of Rice

Significant differences were observed in △T between the different straw returning and P application modes in both trial years (Table 3). Under the same P application mode, △T in the T2 treatment increased by 18.21% in 2019 and 26.09% in 2020, compared to that in the T1 treatment. Compared with that in T2P2 and T2P4, △T in T2P3 treatments increased by 18.97% and 10.25% in 2019, respectively, while the difference between T2P2, T2P3, and T2P4 treatments was not significant in 2020. The maximum △T was observed in the T2P3 treatment, which was higher than that in the other treatments.

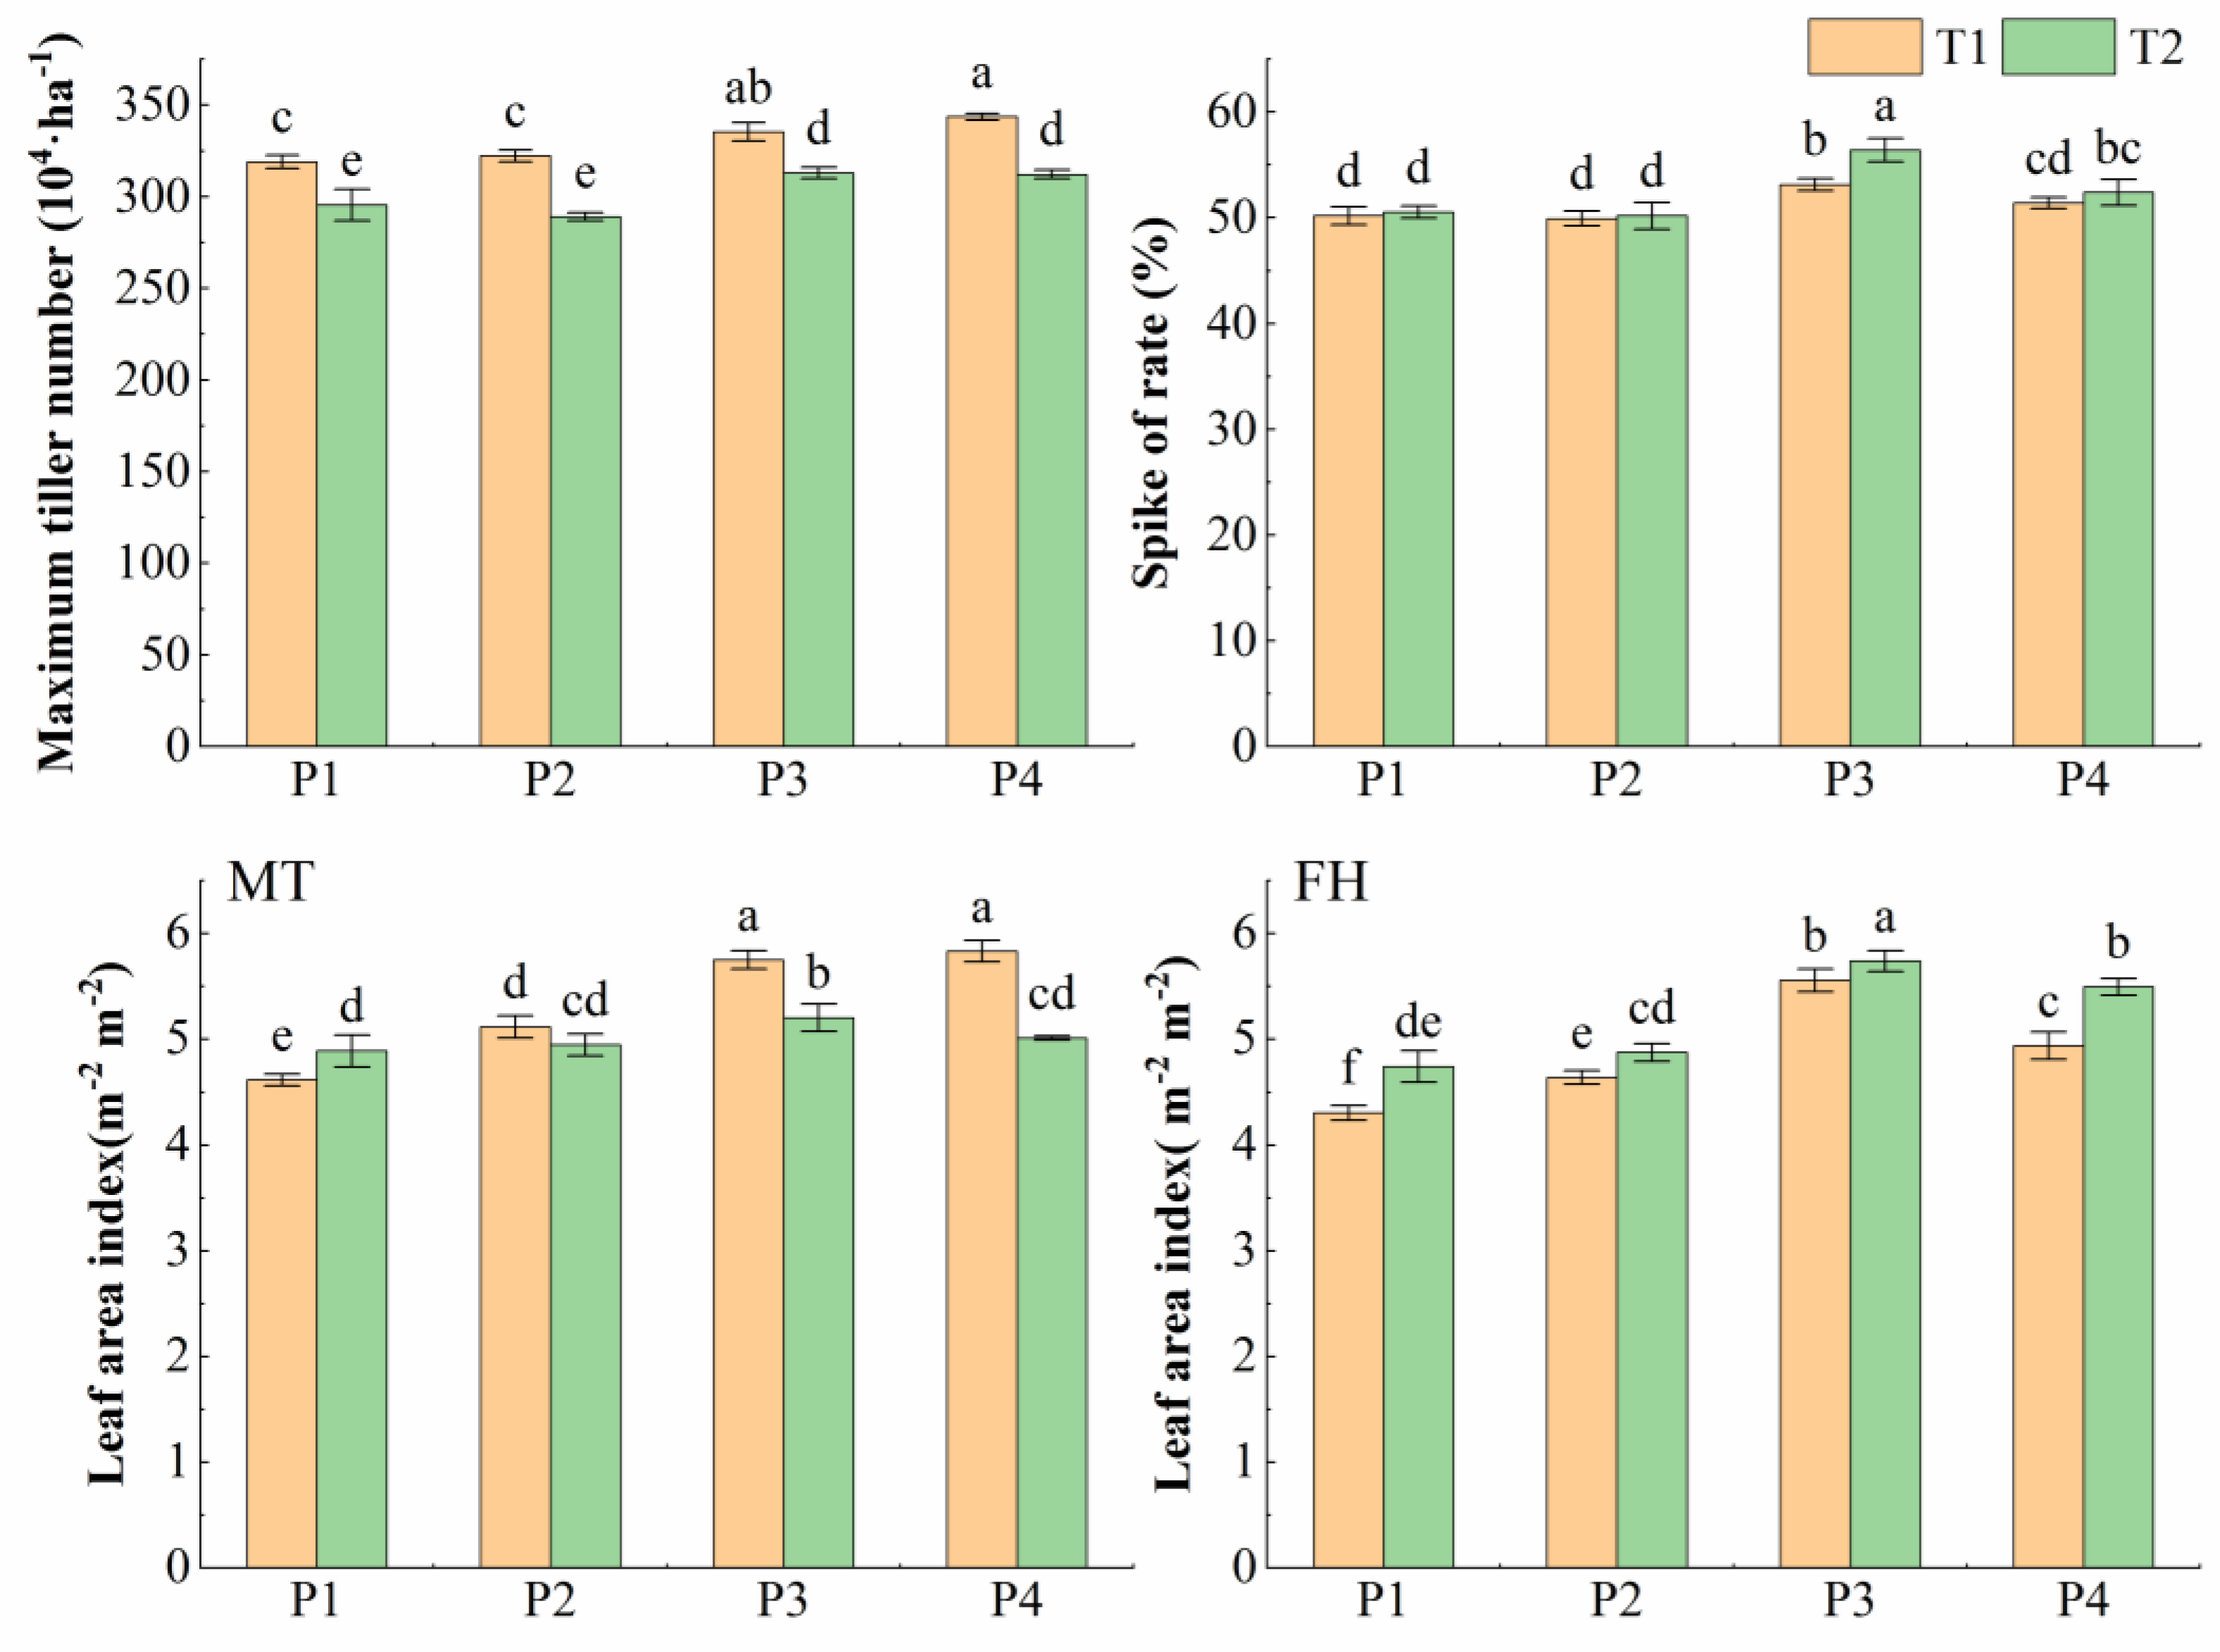
3.4. Effect of Straw Return and Different P Application Modes on Maximum Tiller Number, the Ratio of Tiller, and Leaf Area Index of Rice

Different straw return and P application modes significantly affected the maximum tiller number, the ratio of tillers, and LAI (Figure 2). Under the same P application mode, T2 was significantly decreased by the maximum tiller number and leaf area index at the maximum tillering stage while it increased the leaf area index at the full heading stage compared to that of T1. In addition, T2 had a significantly higher spike rate than T1 in the P2 and P3 treatments. Under T1 or T2 treatment, the maximum tiller number and leaf index at the high-tillering stage in P3 and P4 were significantly higher than those in P2 and P1, but there was no significant difference between P3 and P4. The spike rate and leaf area index at the full heading stage in P3 were significantly higher than those in P4, P2, and P3.

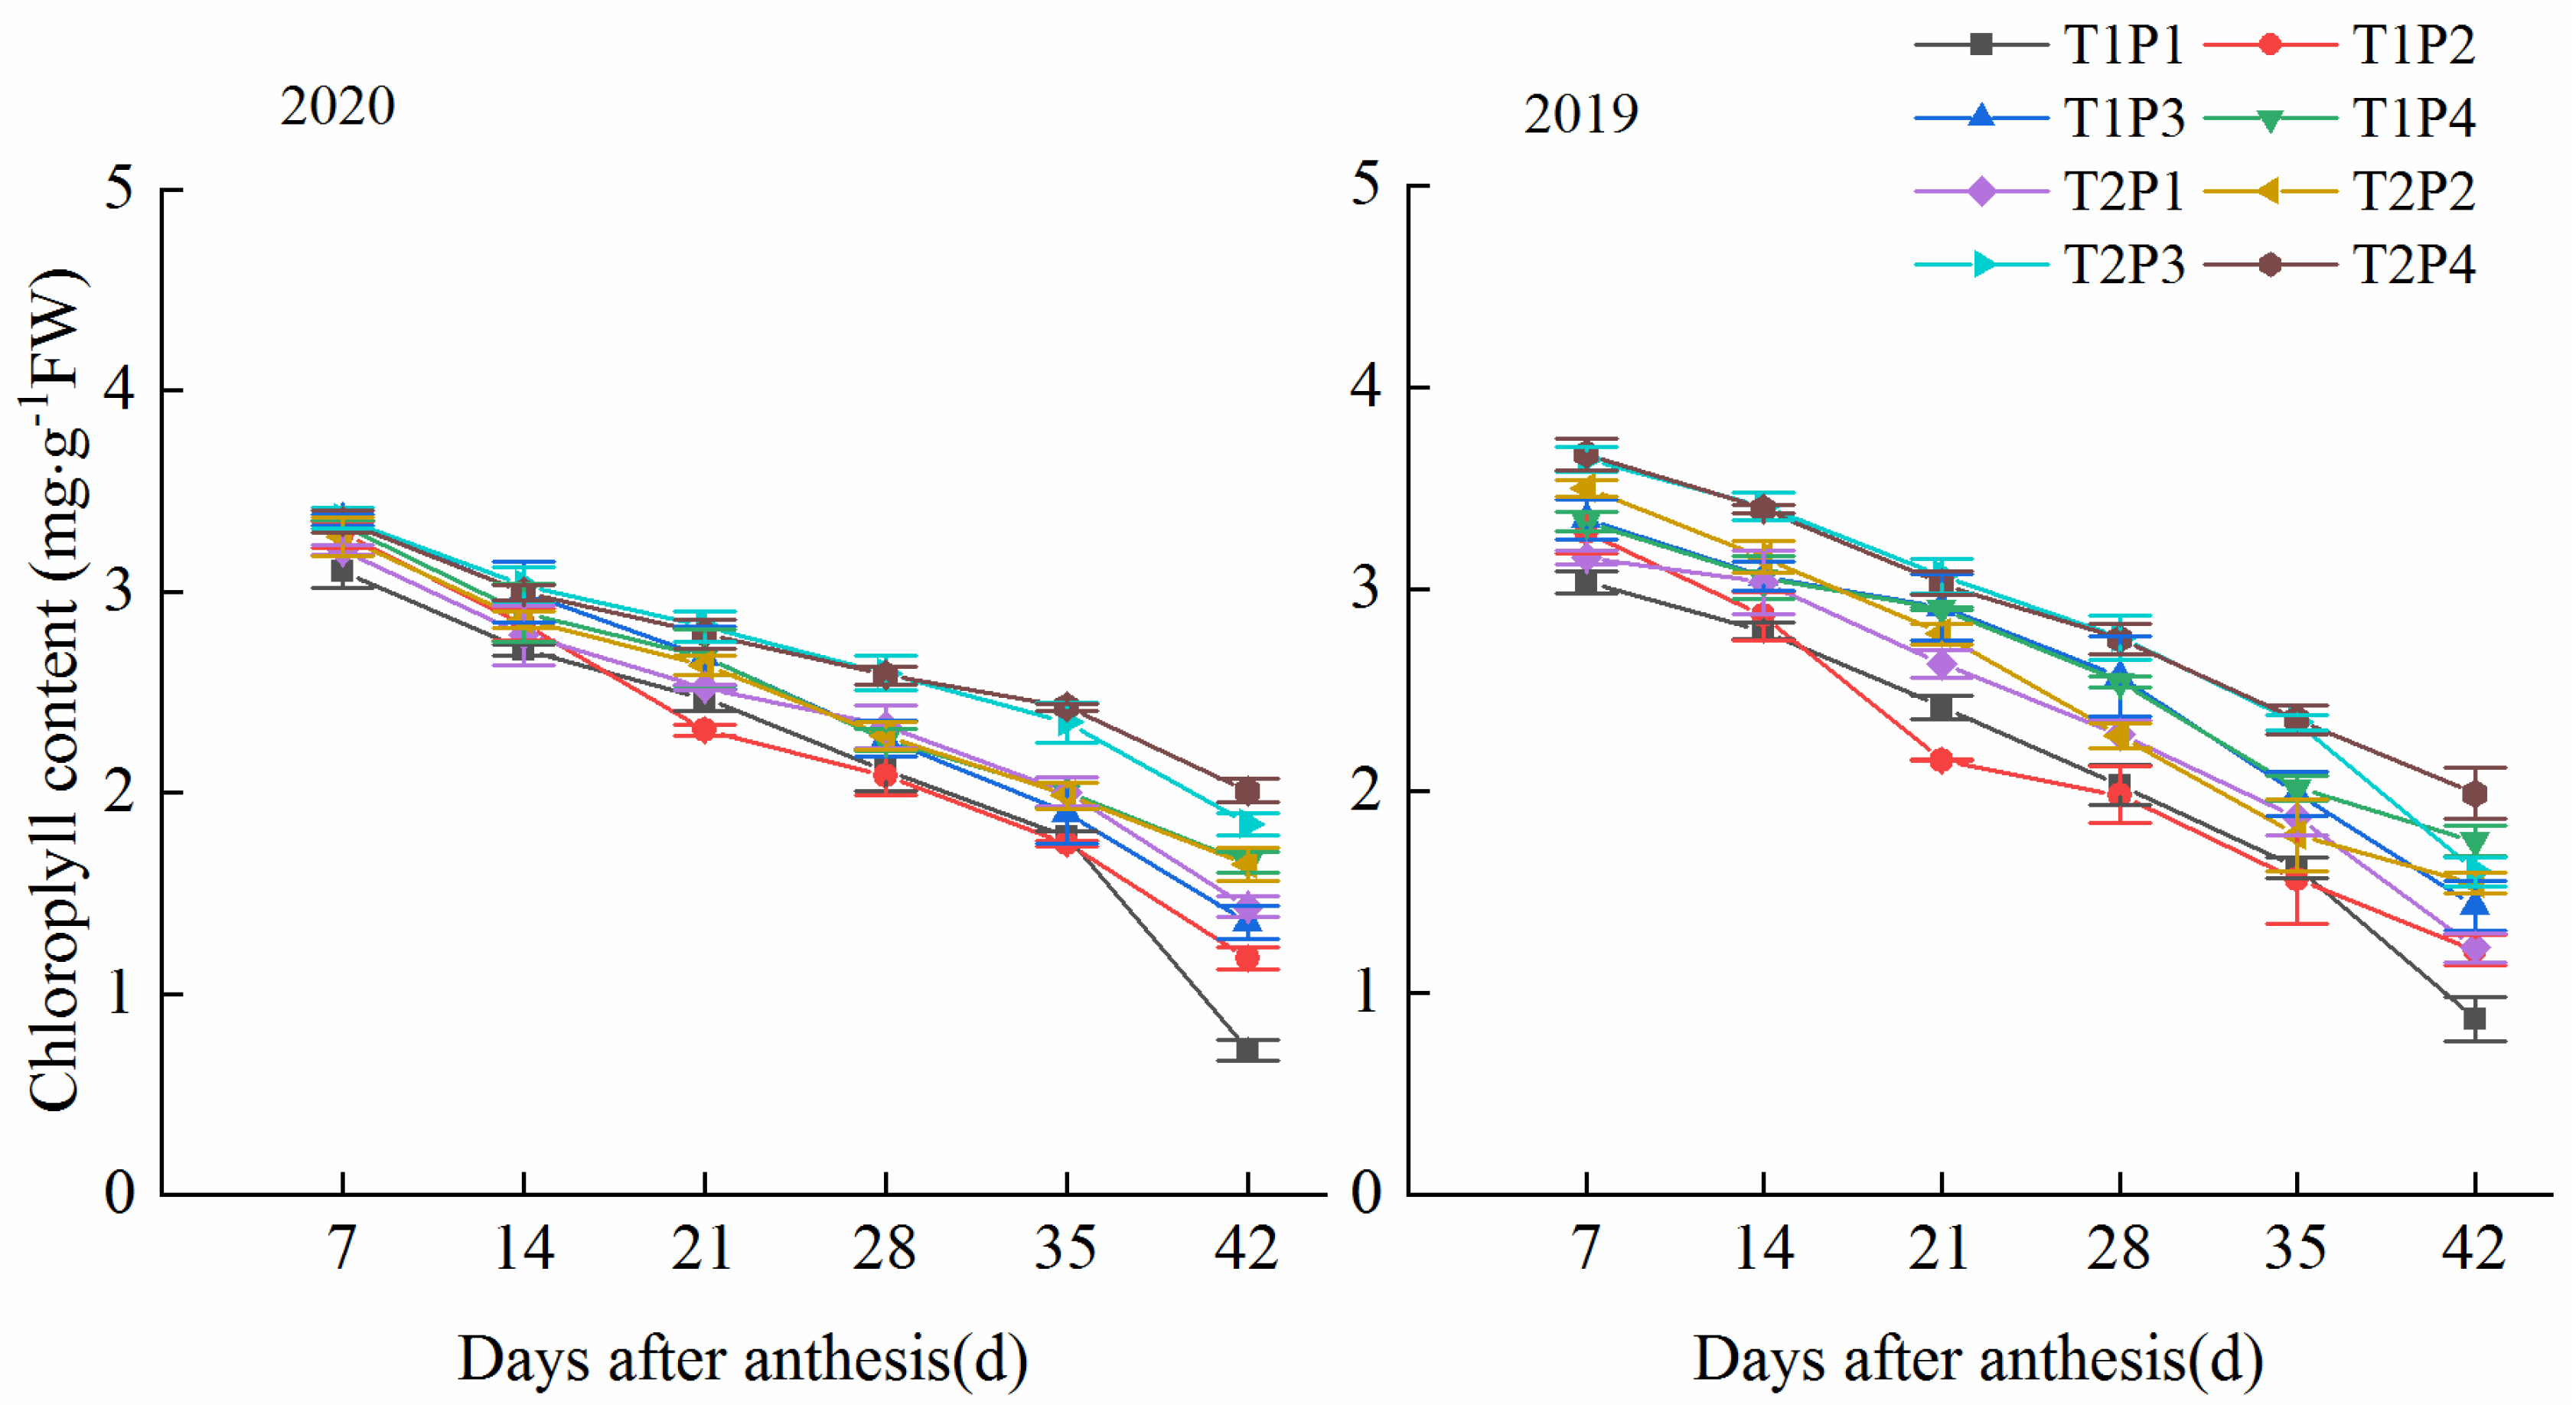
3.5. Effect of Straw Return and Different P Application Modes on the Chlorophyll Content of Post-Heading Flag Leaves of Rice

As shown in Figure 3, the chlorophyll content of rice was the highest 7 days after heading under each treatment. As development progressed, flag leaf chlorophyll decreased slowly from 7 to 21 d and more rapidly from 21 to 42 d. At 7 d after heading, the chlorophyll content of flag leaves increased significantly by 4.90–8.17% and 3.18–5.38% in P3 compared to that in P1 and P2 treatments while the difference between P3 and P4 treatments was not significant. At 28 d of the heading, the chlorophyll content under different P application modes was P3 > P2 > P4 > P1. On day 28, compared to day 7, the chlorophyll content of flag leaves under each P application mode decreased in the order P2 > P1 > P3 > P4. This showed phosphorus application in alternate seasons delayed chloroplast degradation and improved chlorophyll production.
Under the same P application mode, T2 significantly increased chlorophyll content 7–35 days after heading compared to the T1 treatment in both trial years. The chlorophyll content of flag leaves was significantly increased by 1.27–44.82% in the T2 treatment compared with that in the T1 treatment at 14–35 days after heading.

3.6. Effects of Straw Return and Different P Application Modes on Rice Yield

There were significant differences in the grain yield and its components under different P application modes and straw return (Table 4). Compared with T1, T2 significantly increased the grain yield by 6.32% and 5.26% in 2019 and 2020, respectively, under the same P application mode. This is because T2 increased the number of effective panicles, spikelets per panicle, and filled grain rate in 2019 and 2020. The maximum grain yield was observed in the T2P3 treatments, significantly higher than those of T2P2 and T2P4 during the two trial years. Compared with that of T2P2 and T2P4, the grain yield of T2P3 notably increased by 17.31% and 6.67% in 2019 and 16.42% and 5.23% in 2020, respectively. This was because T2P3 produced 13.85%, 7.24%, 15.05%, and 5.98% more panicles per ha than T2P2 and T2P4 in 2019 and 2020, respectively. In addition, compared to T2P2, T2P3 was significantly increased by the filled grain rate in 2019. Compared with T2P2 and T2P4, T2P3 notably enhanced the 1000-grain weight in 2020.

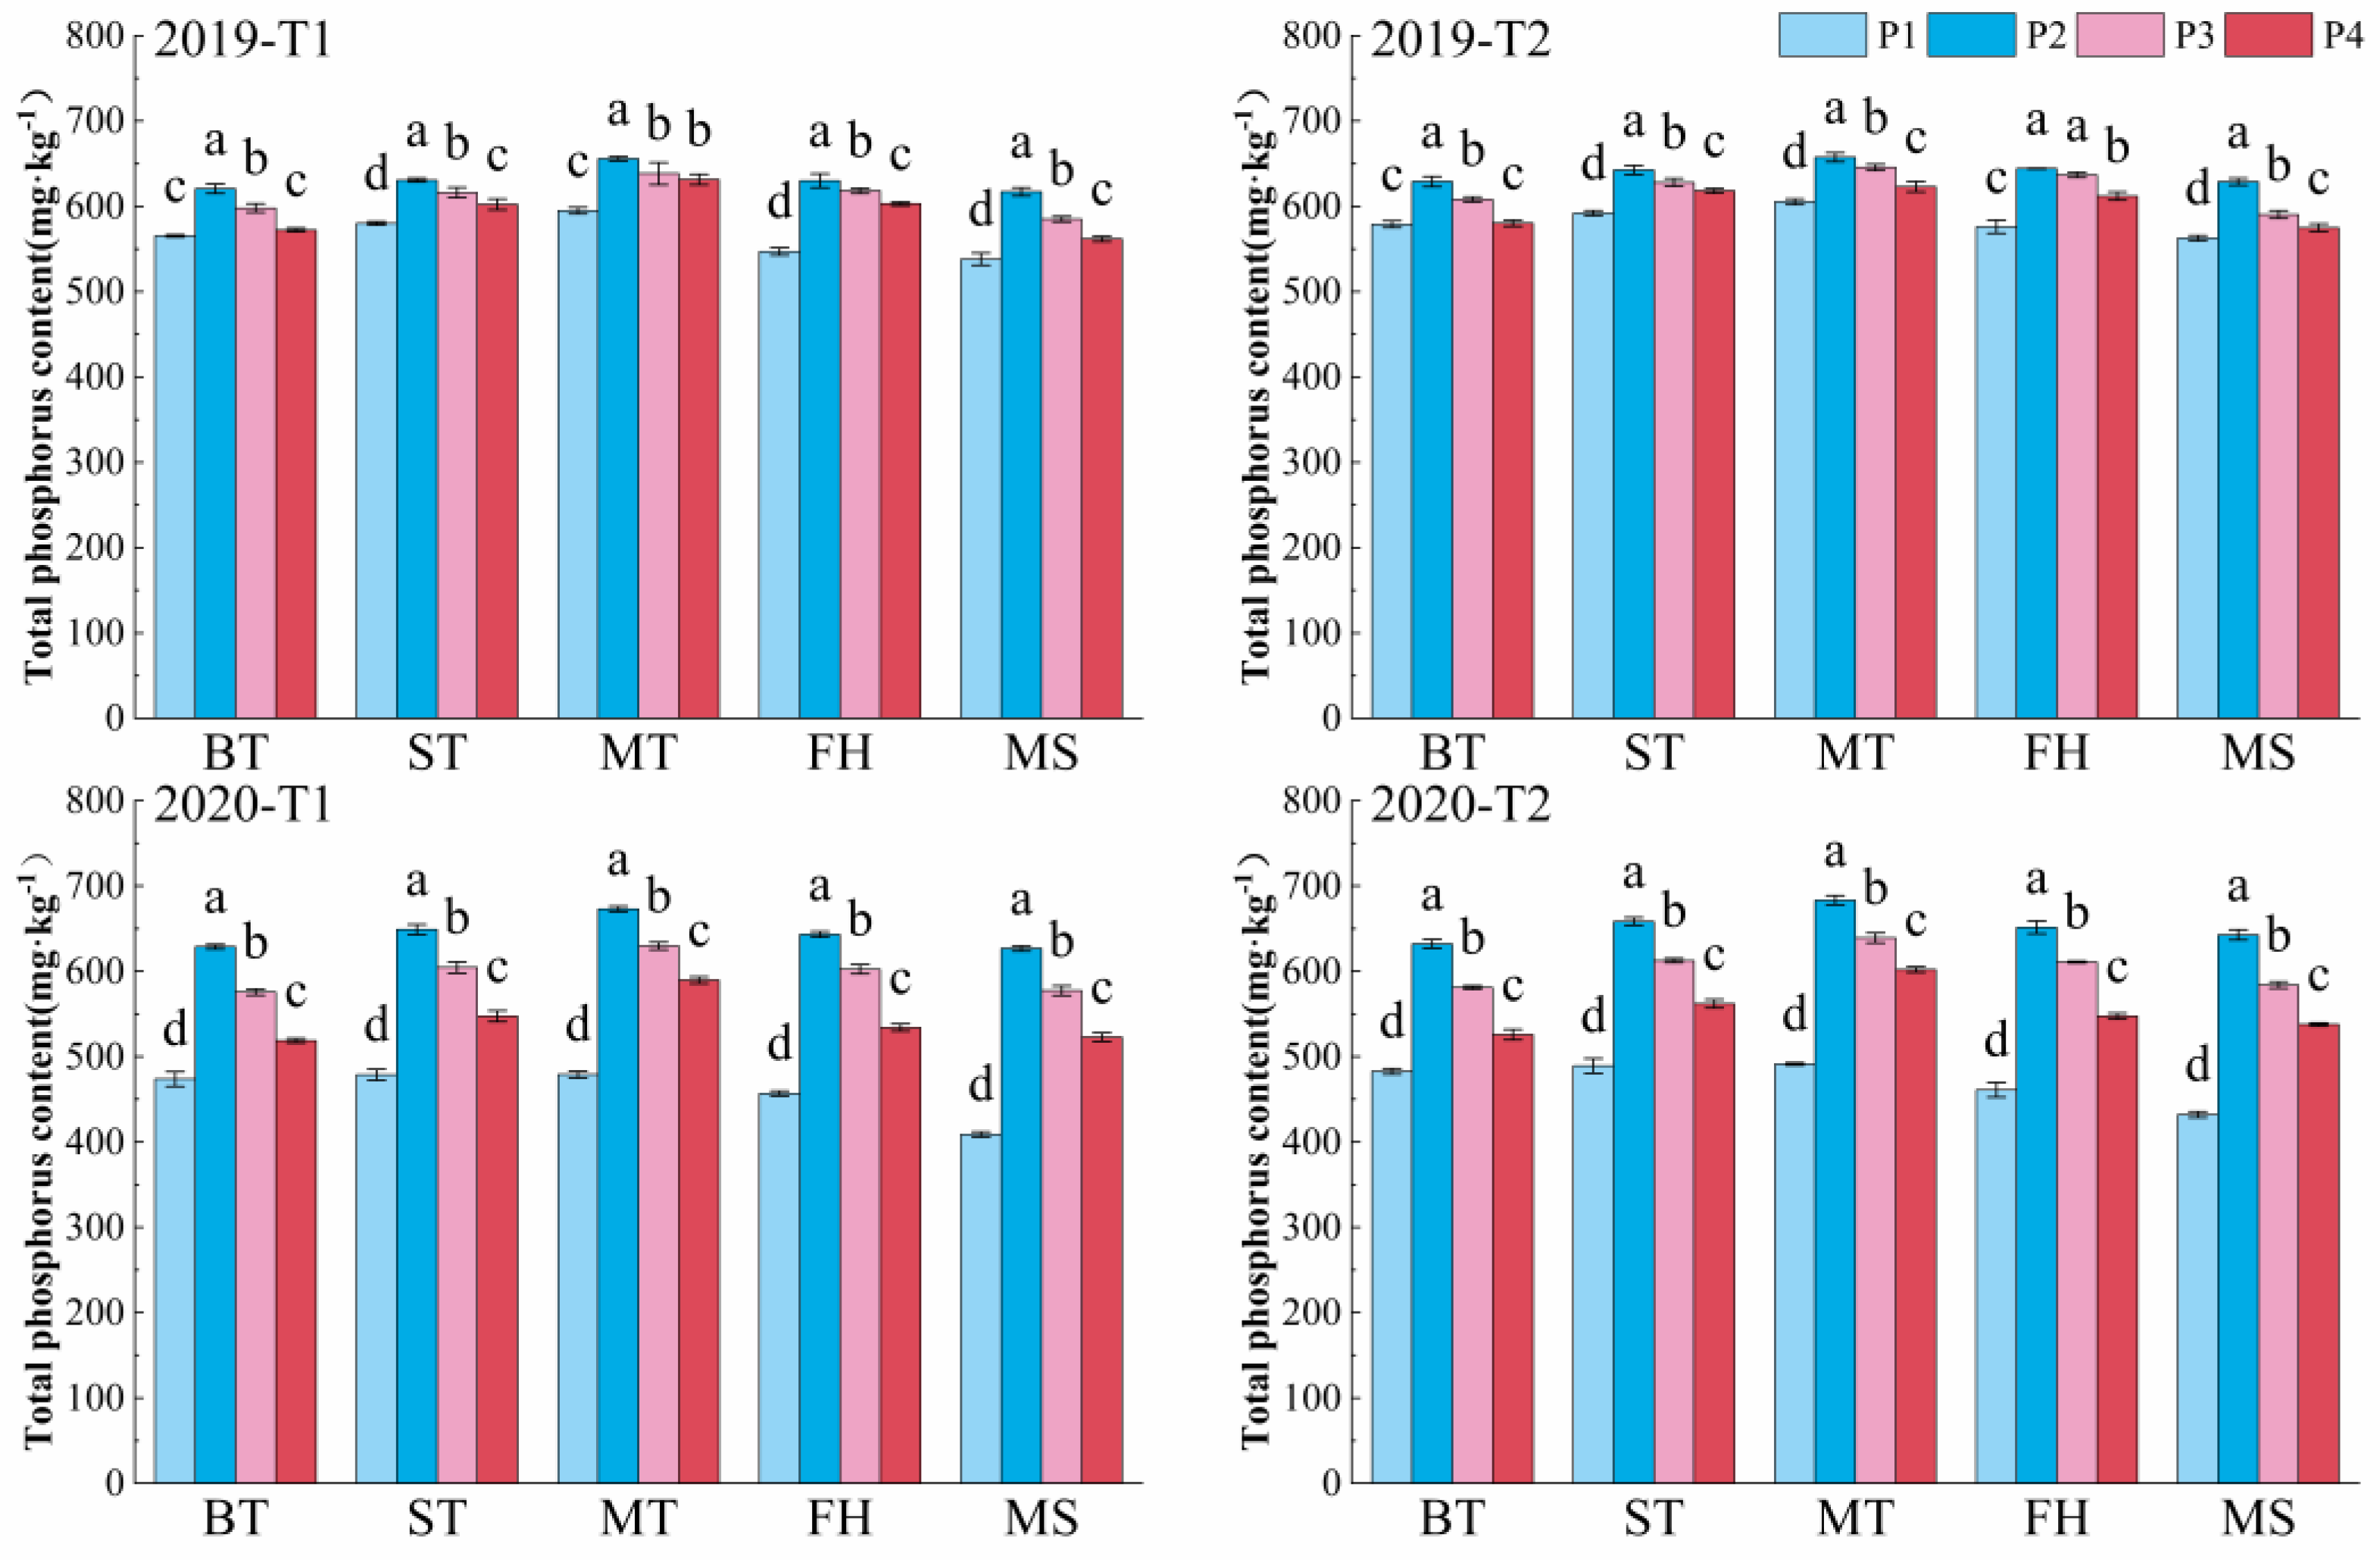
3.7. Effects of Straw Return and Different P Application Modes on Soil Total Phosphorus in Rice Main Growing Period

Straw return and P application modes significantly affected soil total phosphorus content in 2019 and 2020 (Figure 4). Under T1 and T2, the total phosphorus content in the soil during each growth period of rice under each P application mode followed the order P2 > P3 > P4 > P1. The total phosphorus content of the soil under P2 treatment for the rape-rice two seasons from 2019 to 2020 increased from 6.21–6.55 g/kg to 6.29–6.73 g/kg, showing that P2 increases the total phosphorus content in the soil. The total phosphorus content in the P3 and P4 treatments decreased by 3.92–7.10% and 8.37–26.50%, respectively, compared to that in the P2 treatment during the rice growing period. During the main growing period of rice under P1, P2, P3, and P4 treatment, the soil total phosphorus content in T2 increased by 1.91–5.66%, 1.36–2.56%, 1.15–3.00%, and 1.35–2.84%, respectively, compared to T1.

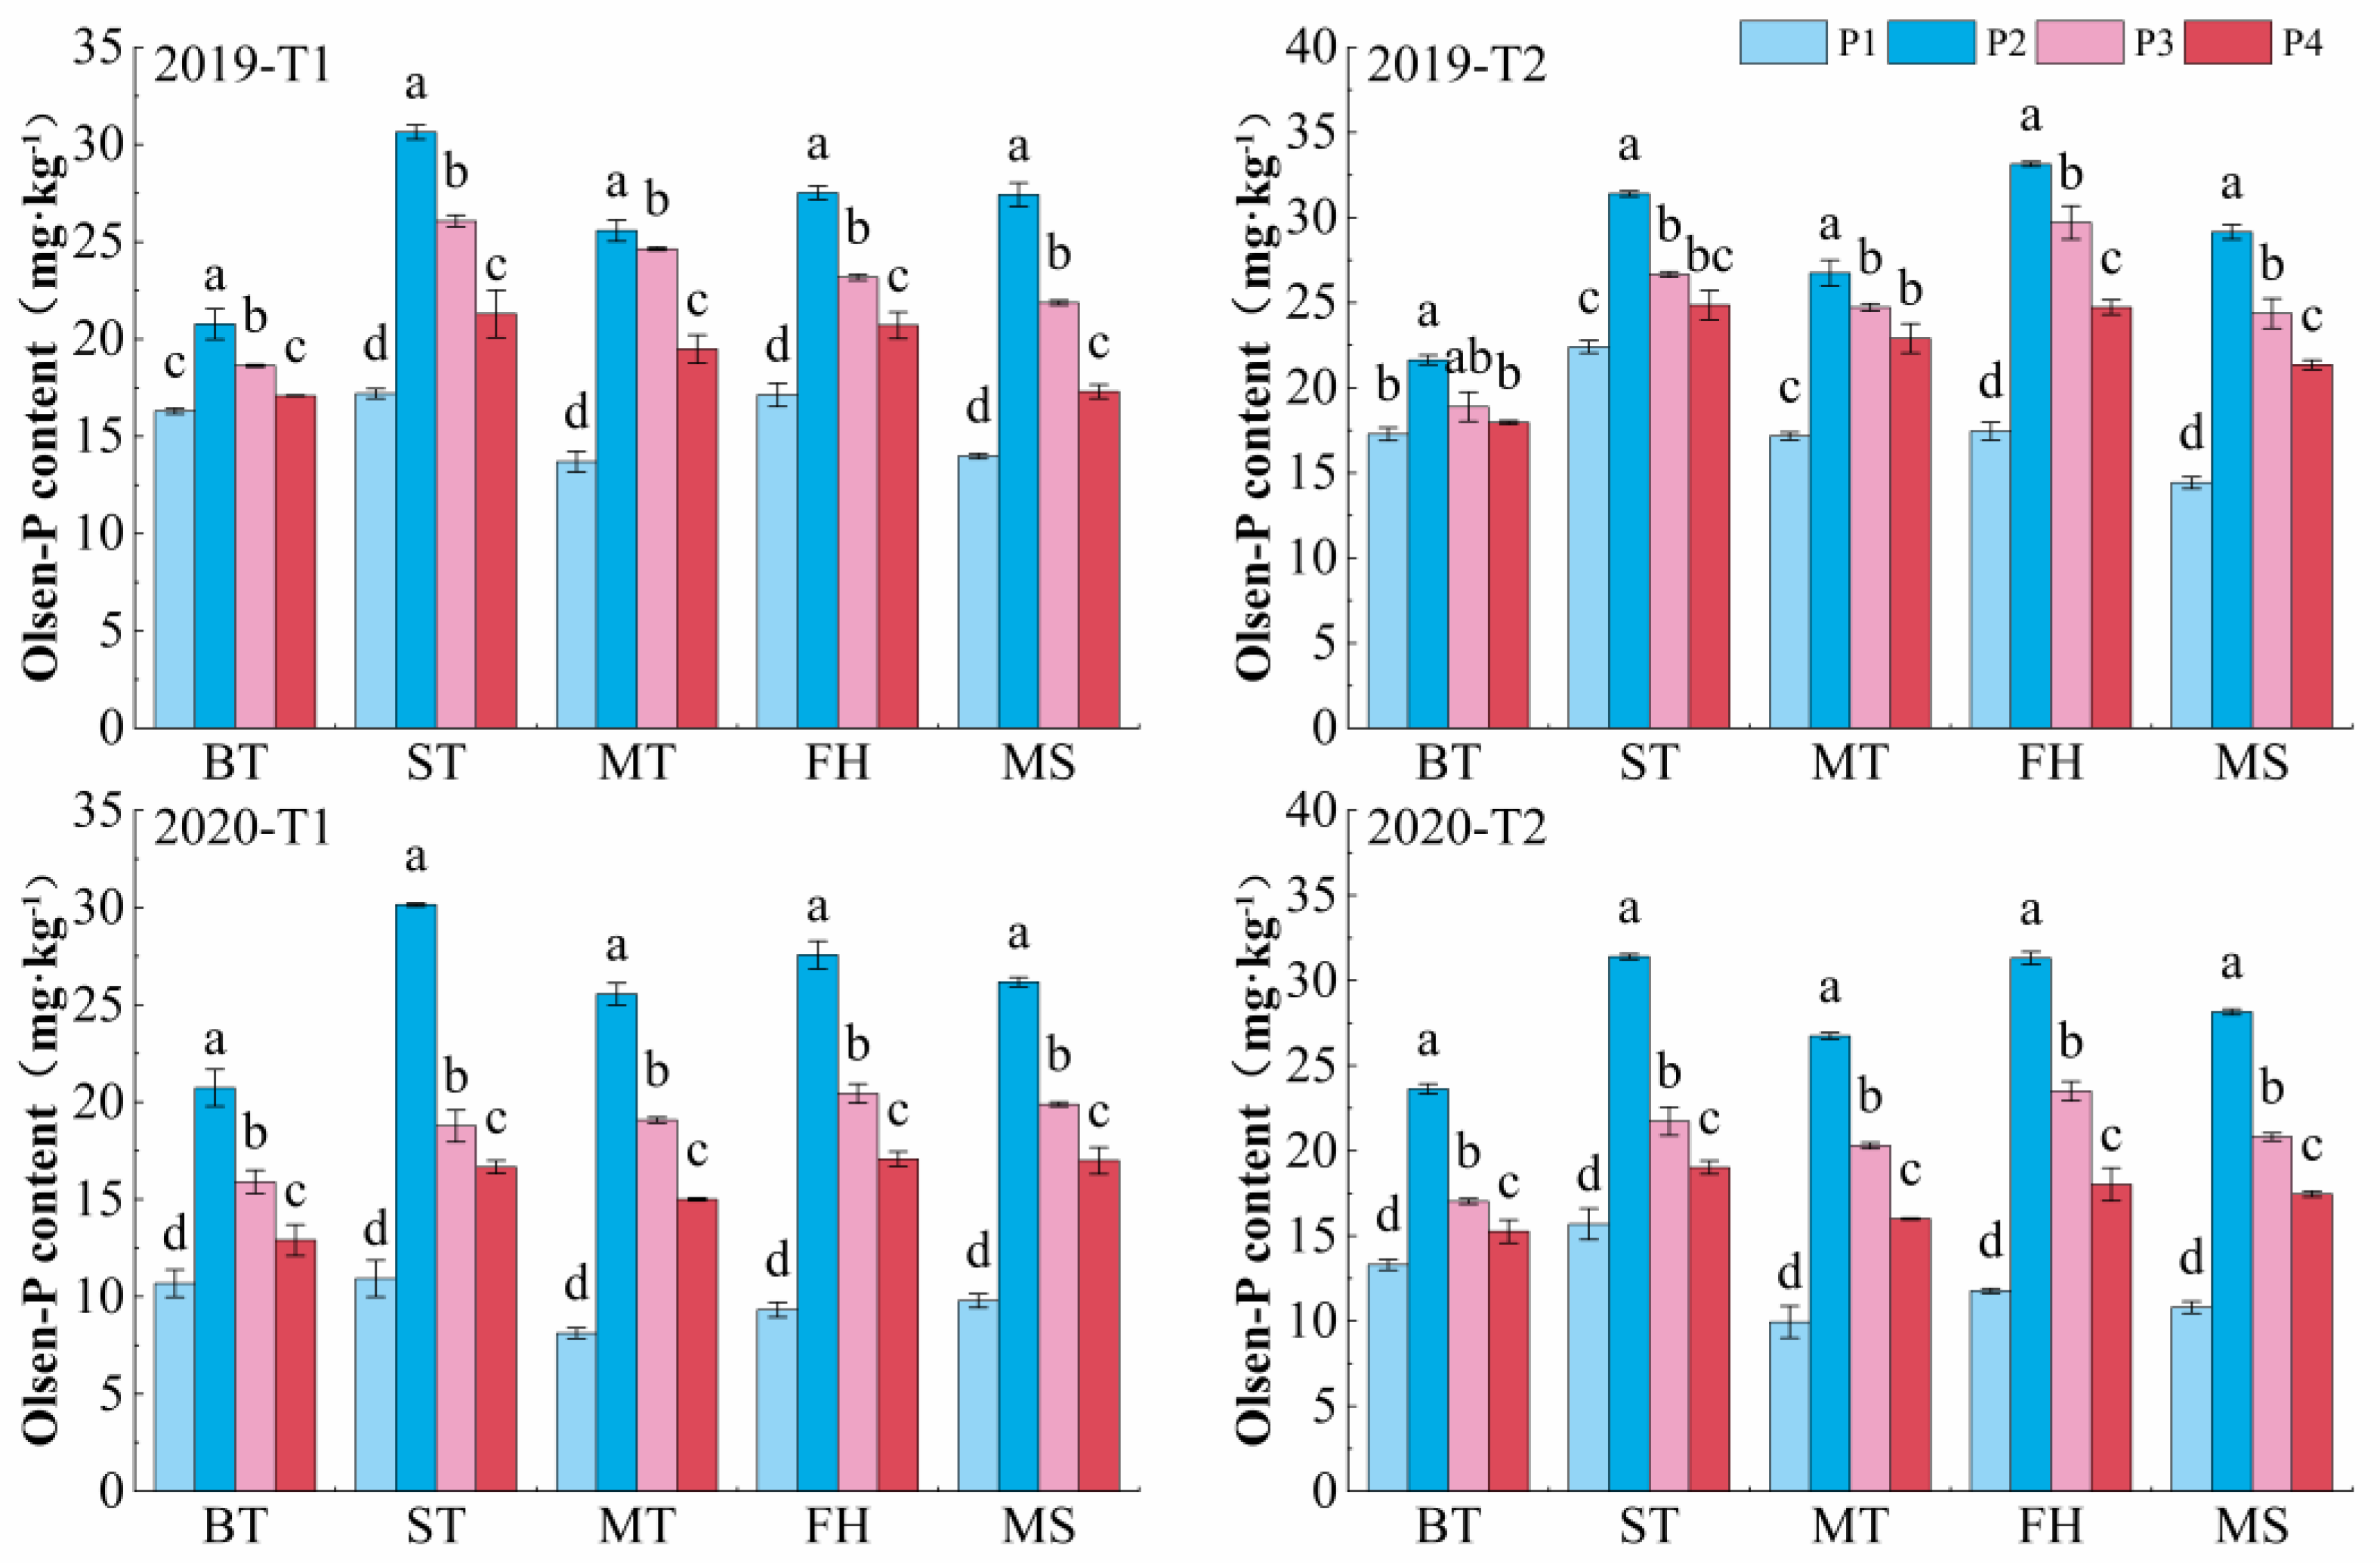
3.8. Effects of Straw Return and Different P Application Modes on Soil Olsen-P during the Main Rice Growing Period

The soil Olsen-P content was significantly different under different P application modes and straw returning (Figure 5). Under the T1 and T2 treatments, the soil Olsen-P content during the main growth period of rice followed the order P2 > P3 > P4 > P1 under each P application mode. During the T1 treatment in 2019, the soil Olsen-P content decreased by 26.29–99.10%, 5.63–18.29%, and 17.35–30.72 with P1, P3, and P4 treatments, respectively, compared to that with P2 treatment. In 2020, this decreased by 87.83–186.41%, 23.86–35.57%, and 36.58–40.38% under the P1, P3, and P4 treatments, respectively, compared to that under the P2 treatment. It shows differences in the soil available phosphorus content between treatments, and the difference between treatments gradually increases with increasing numbers of years. Under the same P application mode, the soil total phosphorus content increased by 6.04 to 17.63% in the T2 treatment compared to that under the T1 treatment, showing that recycling straw in the field increases the soil Olsen-P content during the main rice growing period.

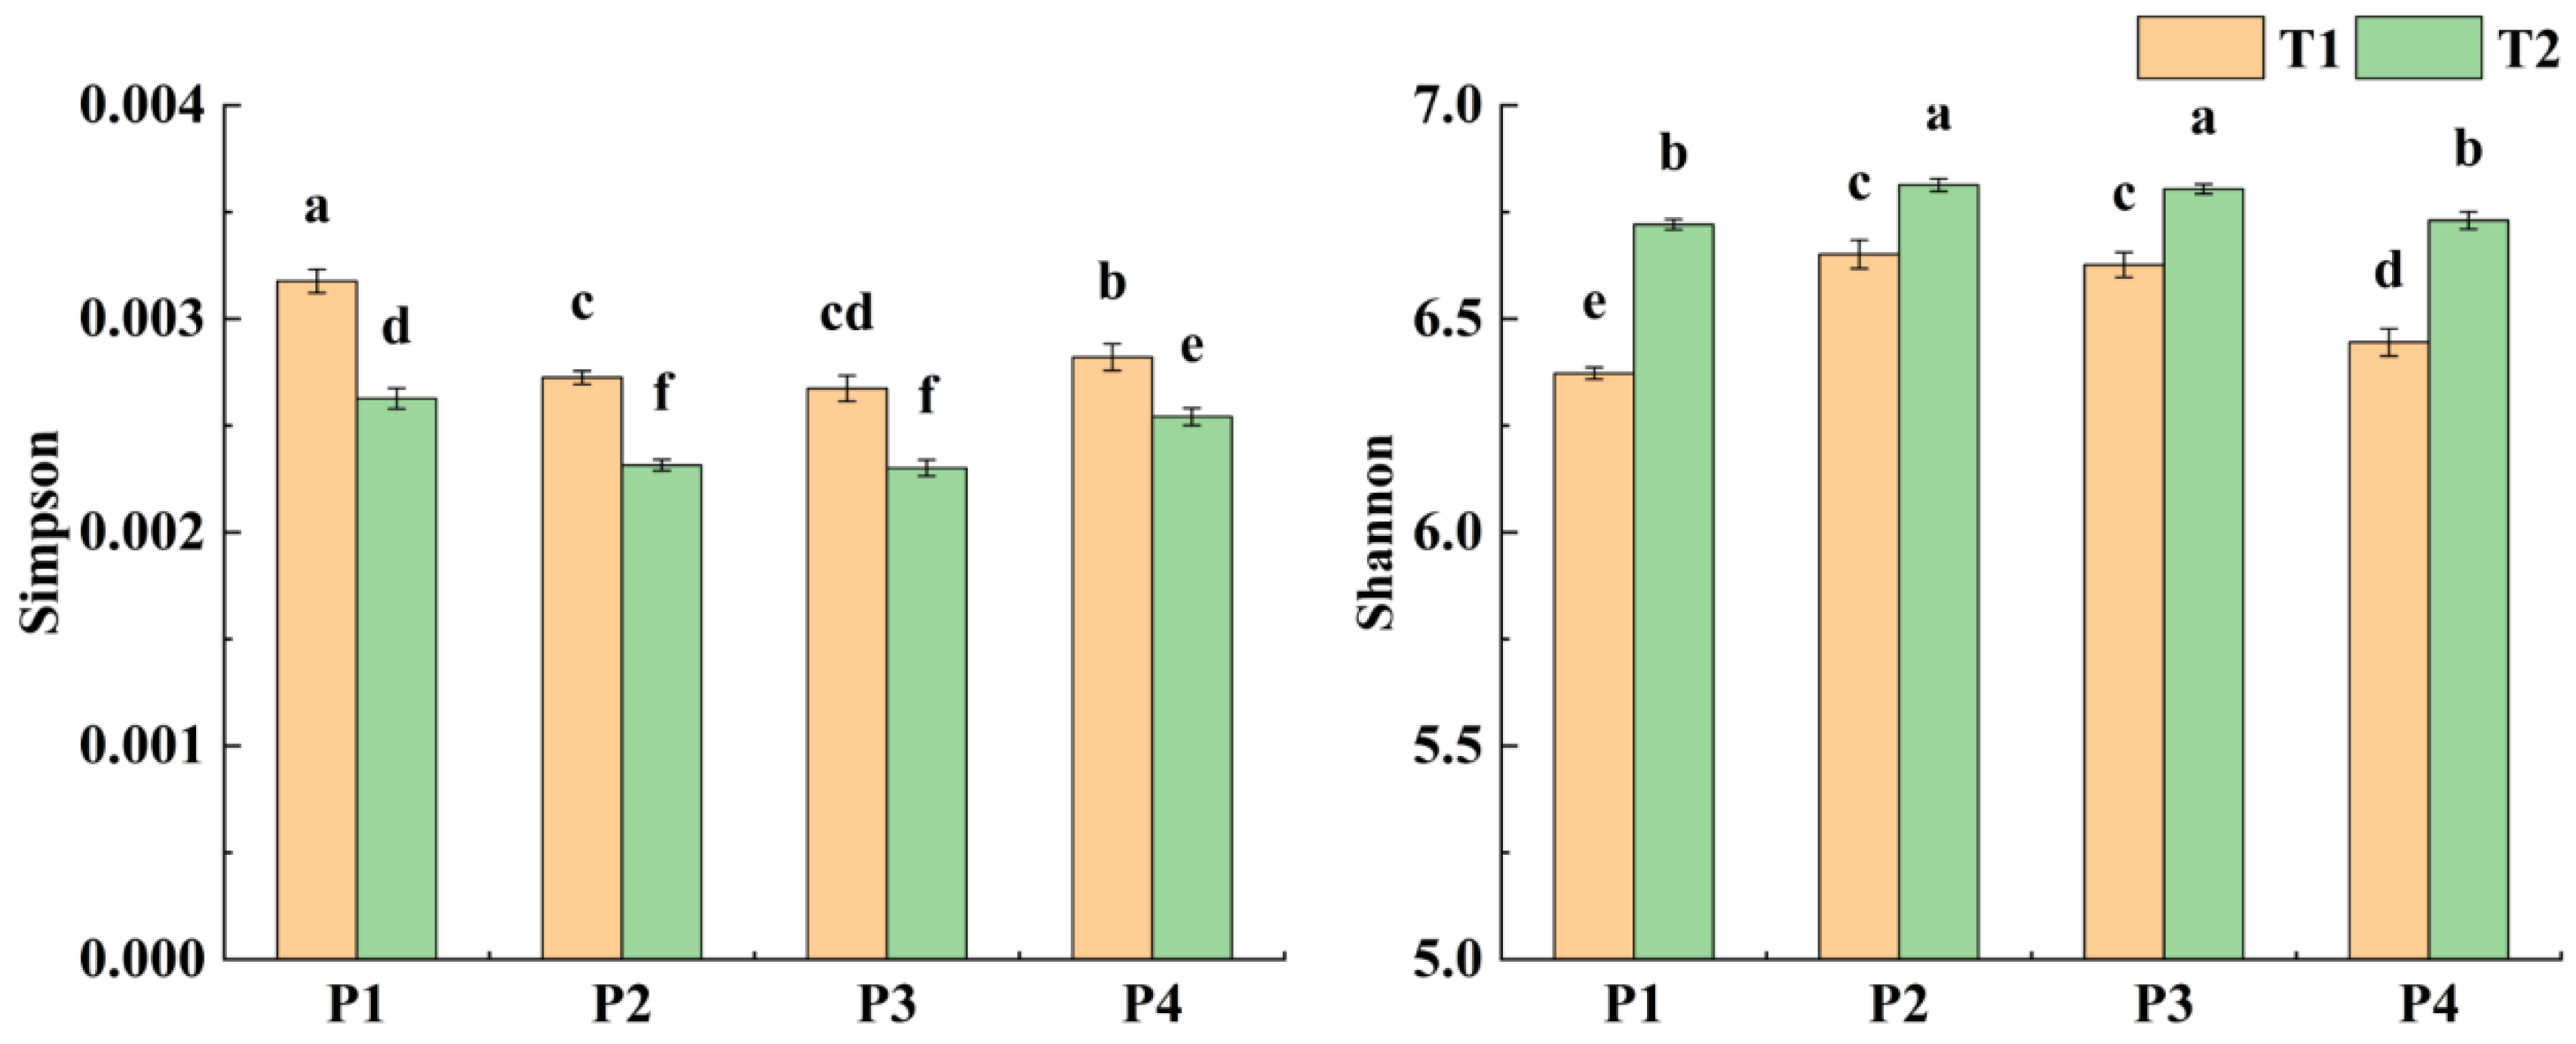
3.9. Effects of Straw Return and Different P Application Modes on Soil Bacterial Diversity

Straw return and P application mode significantly affected soil bacterial diversity (Figure 6). Simpson and Shannon indices were used to calculate bacterial species richness in the sample. A higher Shannon index value indicates higher species richness in the sample, whereas a lower Simpson index value indicates the same. Compared with T1, T2 significantly increased the soil bacterial diversity under the same P application mode. The maximum soil diversity was observed in the T2P2 and T2P3 treatments, whereas the difference between the T2P3 and T2P4 treatments was not statistically significant.

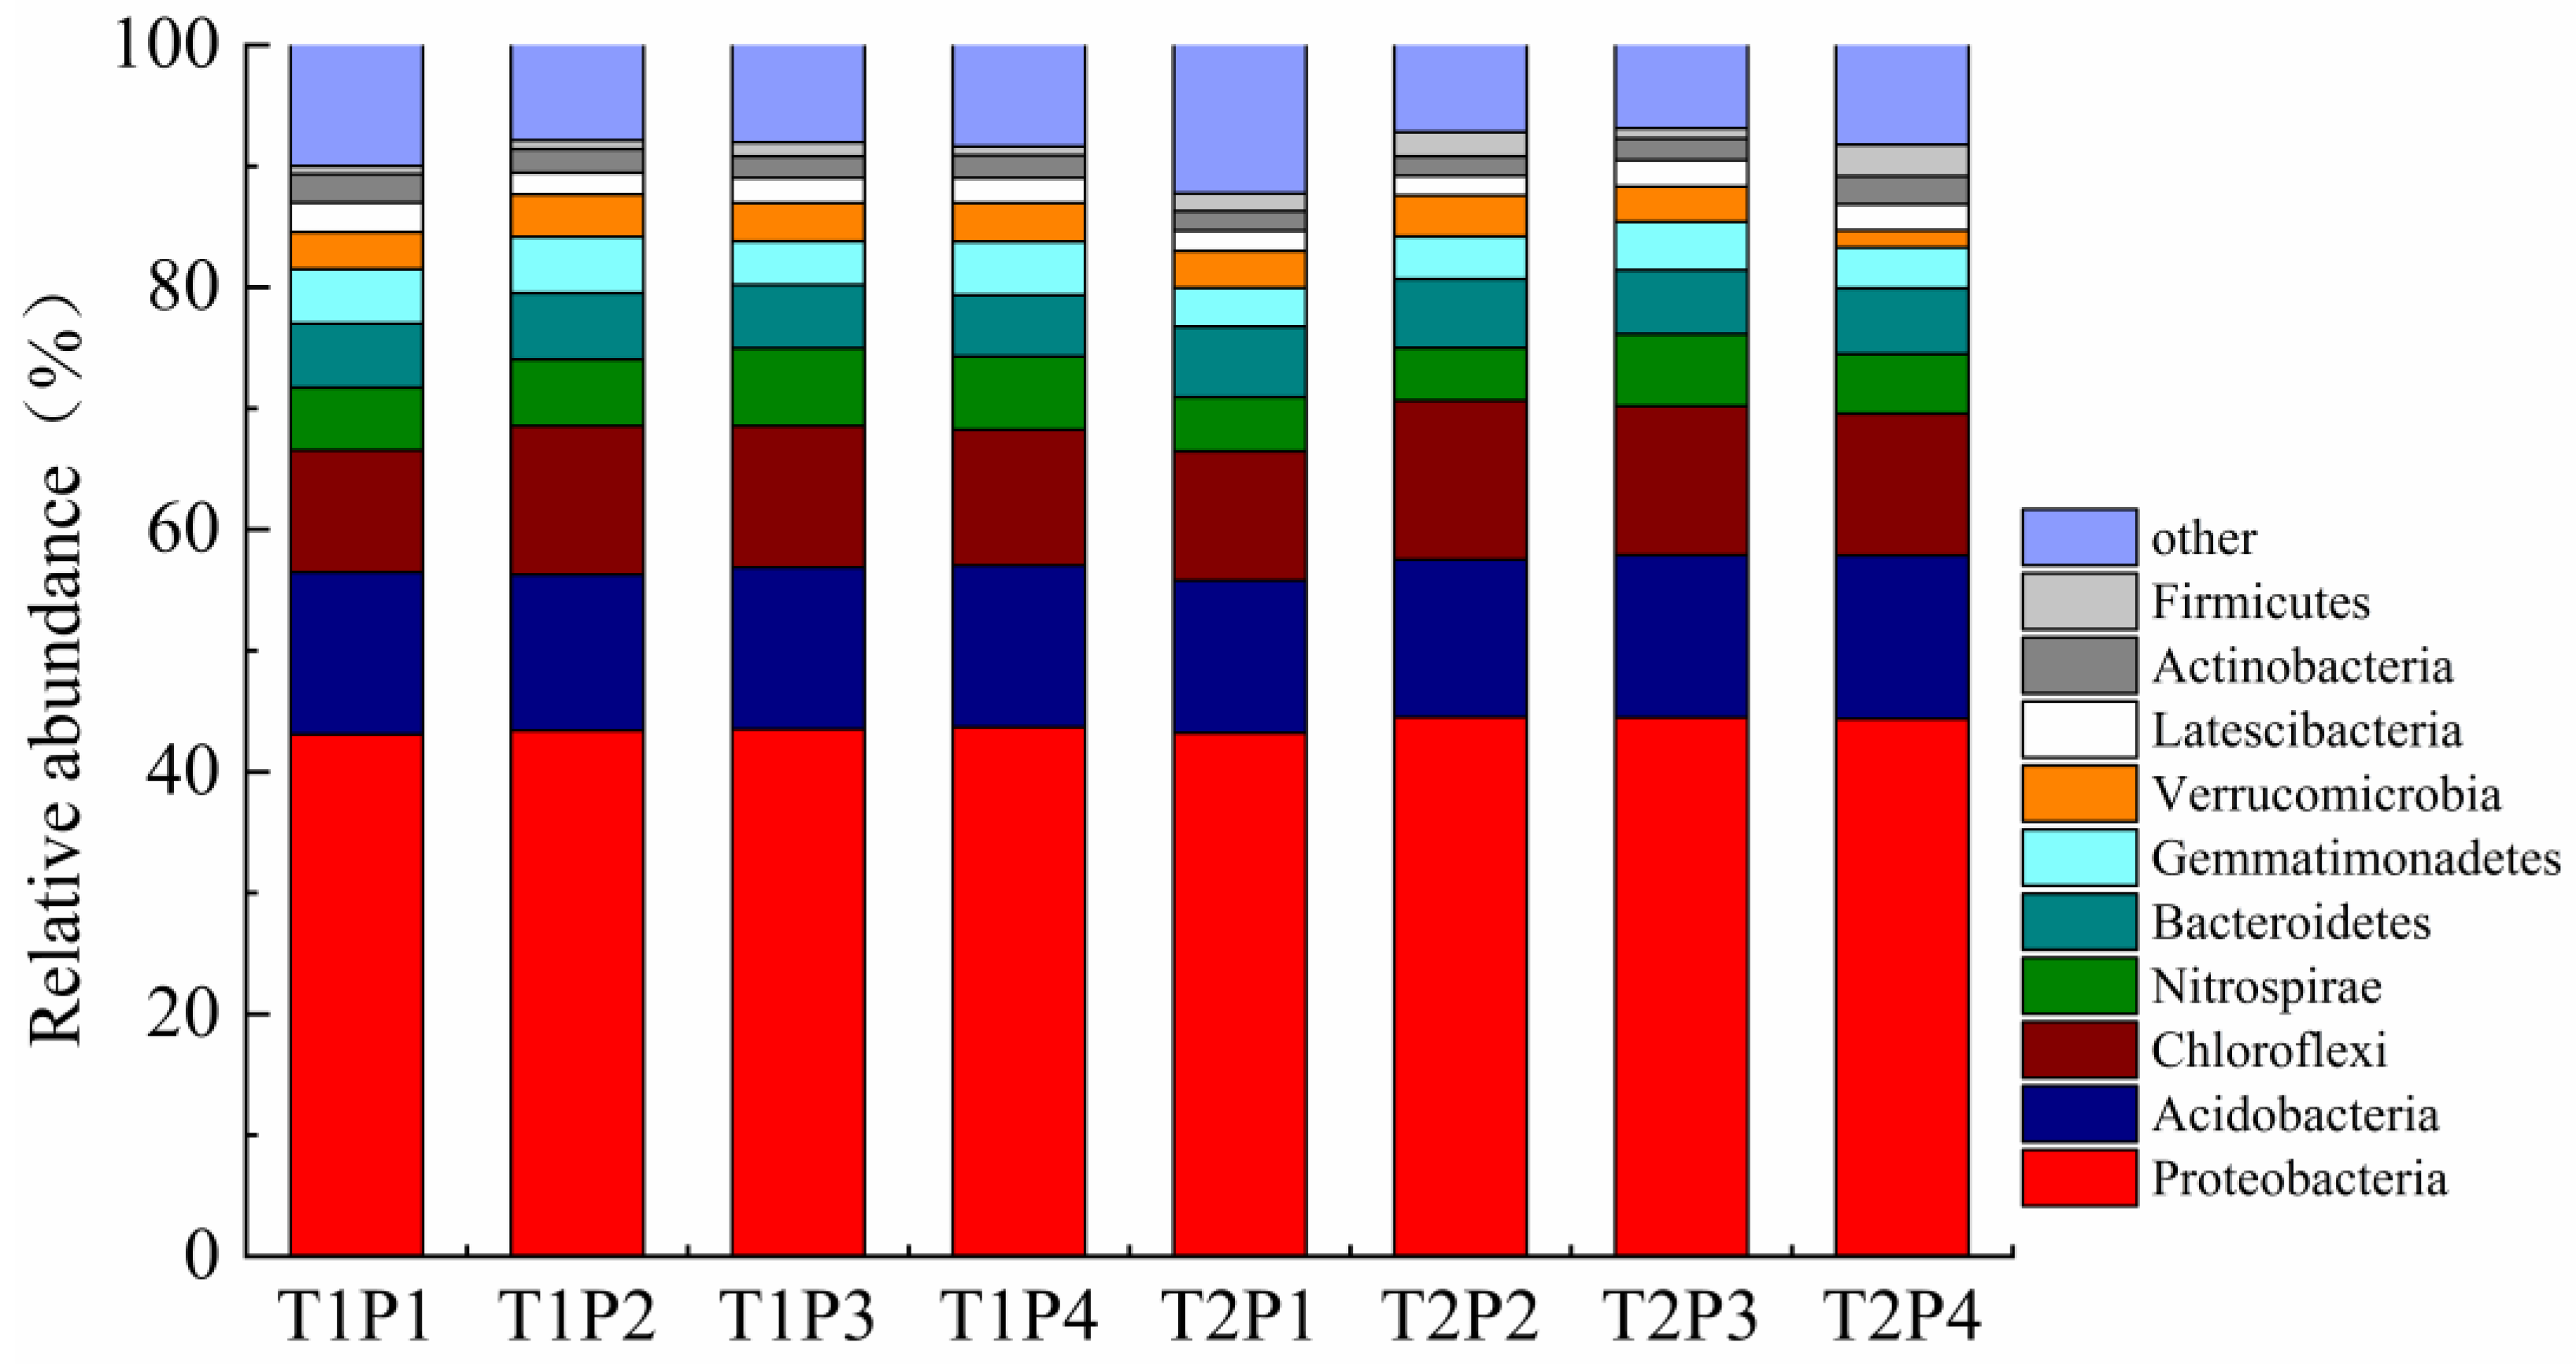
3.10. Effects of Straw Return and Different P Application Modes on Soil Bacterial Communities at the Phylum Level

As shown in Figure 7, the ten most abundant bacterial communities under each treatment were Proteobacteria, Acidobacteria, Chloroflexi, Nitrospirae, Bacteroidetes, Gemmatimonadetes, Verrucomiceobia, Latescibacteria, Actinobacteria, Firmicutes, accounting for 87.75–92.14% of the total abundance. Among them, the dominant bacterial phylum (relative abundance ≧ 5%) was Proteobacteria (43.10–44.53%), followed by Acidobacteria (12.58–13.50%), Chloroflexus (10.07–13.58%), Nitrospirillum (4.34–6.43%), and Bacteroides (5.06–5.84%). Under the same straw treatments, Chlorocurcus abundance increased under P2 treatment by 21.82–22.96%, 5.23–6.98%, and 4.83–9.50% compared with that under P1, P3, and P4 treatments, respectively. However, under the same phosphorus application treatment, Chloroflexus abundance increased by 4.51–7.03% in the T2 treatment compared to that in the T1 treatment, and there was no significant difference among other phyla. This showed that straw returning to the field and different phosphorus application treatments had no significant effect on the composition of the dominant bacterial phylum but affected the composition ratio of specific bacterial communities.

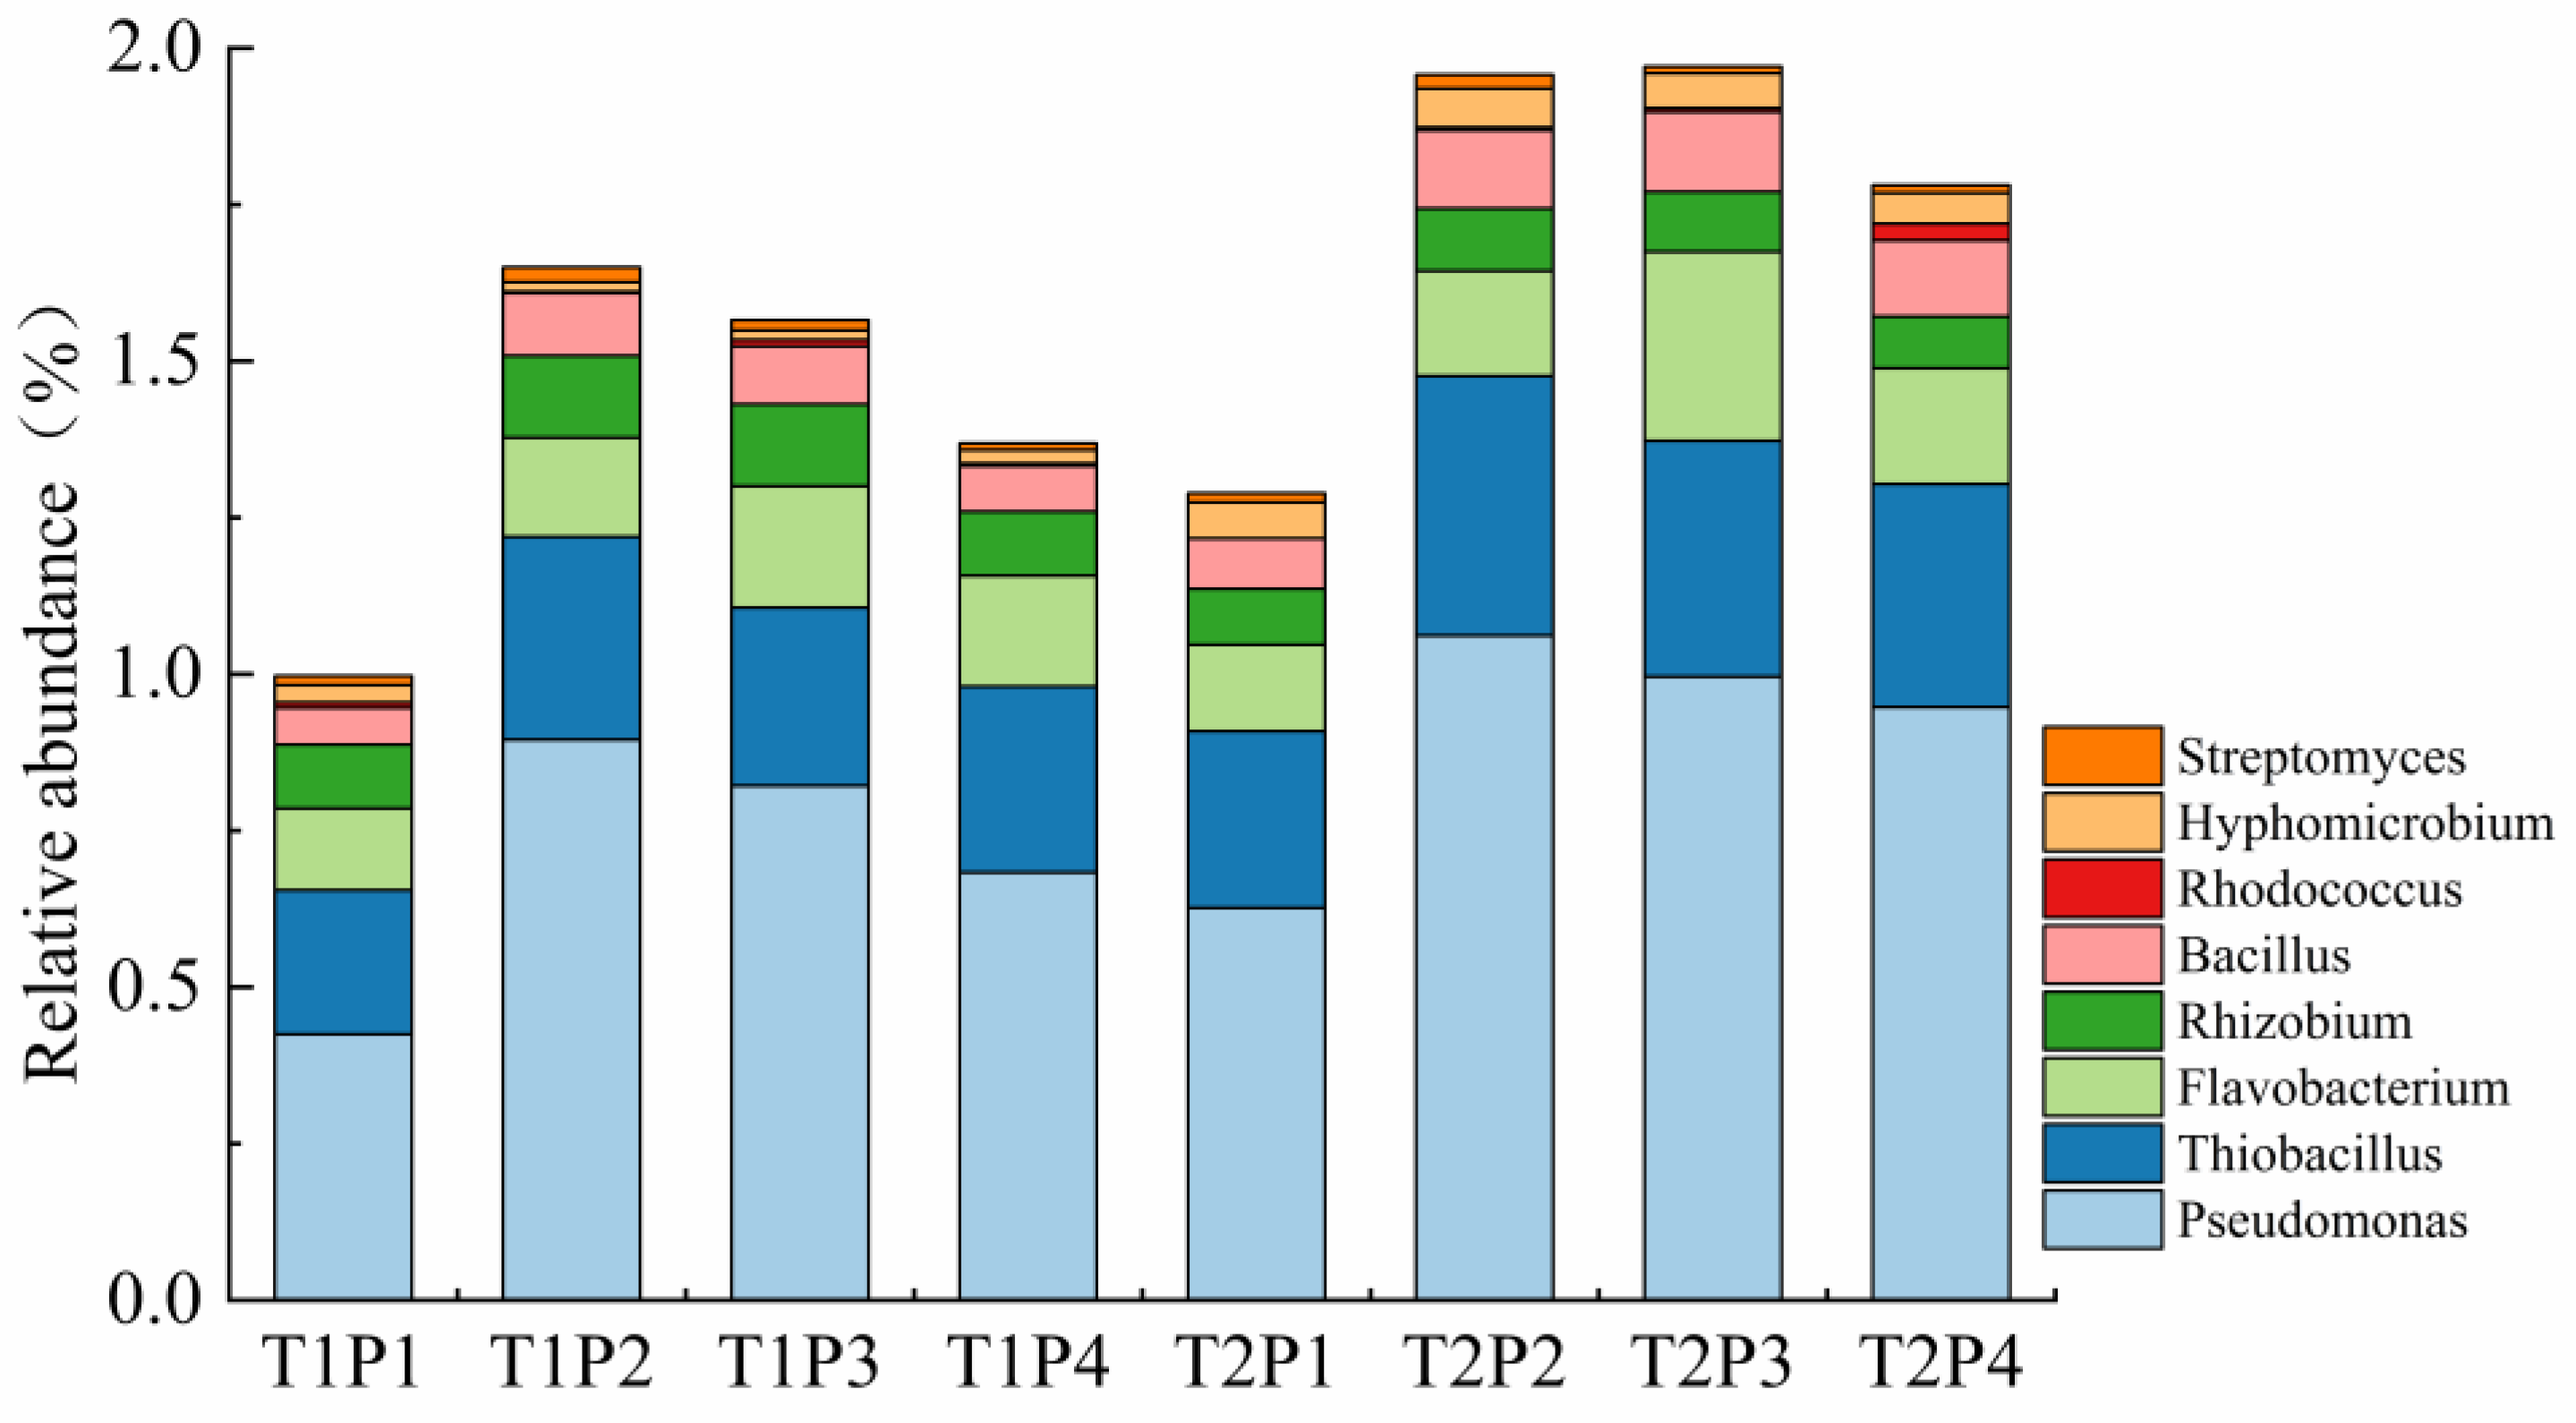
3.11. Effects of Straw-Returning and Different P Application Modes on Relative Abundance of Soil Phosphate-Solubilizing Bacteria at Genus Level

The relative abundances of phosphate-solubilizing bacteria in the soil under different treatments are shown in Figure 8. Under the same P application mode, the relative abundance of Pseudomonas, Thiobacillus, Flavobacterium, and Bacillus increased by 28.53%, 25.92%, 20.15%, and 40.25%, respectively, in the T2 treatment compared with that in the T1 treatment but the relative abundance of Rhizobium decreased. Maximum relative abundances of Pseudomonas and Thiobacillus were observed in the T2P2 treatment. Compared to that of T2P3 and T2P4, the relative abundance of T2P2 was increased by 6.62% and 12.09% in Pseudomonas and 10.01% and 16.31% in Thiobacillus, respectively. However, compared to that in T2P3, the relative abundance of Flavobacterium in T2P2 and T2P4 was decreased by 44.29% and 38.66%, respectively. The relative abundance of Rhizobium and Bacillus was the highest under the P2 and P3 treatments, whereas the difference between the P3 and P4 treatments was not statistically significant.

3.12. Correlation between Soil Phosphorus Content and Phosphorus Solubilizing Bacteria

Table 5 shows the correlation analysis between total phosphorus (TP), Olsen-P, and soil phosphorus-solubilizing bacteria. TP and Olsen-P had statistically significant correlations with Pseudomonas, Thiobacillus, and Bacillus.

4. Discussion

4.1. Effect of Straw Return and Different P Application Modes on Crop Productivity in Rape–Rice Rotation

In water and drought rotation, the wet and dry seasonal alternation affects the chemical form and availability of phosphorus in the soil. In this study, the soil Olsen-P content in the rice season was higher than in the rape season under the P3 treatment (Figure 4), which indicates that more phosphate fertilizer is needed to maintain the appropriate soil available phosphorus content in the dry season [8]. In the rapeseed season, T2P3 treatment had high agronomic traits, and yield was mainly to improve the number of pods per plant compared to T2P4 (Table 2). Our results were consistent with those of Rong-yan et al., who reported that applying phosphorus in the rice season and no phosphorus in the rapeseed season will reduce the yield of rape. Therefore, the rape season needs to be supplemented with phosphorus fertilizer to meet its phosphorus demand [21]. However, compared with the T2P2 treatment, the yield significantly increased with T2P3, mainly by increasing the number of pods per plant and the number of seeds per pod. This increment suggests that long-term application of phosphate fertilizer in the rape and rice seasons would cause excessive soil phosphorus content (Figure 4 and Figure 5), and the current phosphorus application mode (P2) had an inhibitory effect on rape growth in the rape-rice rotation system. Jianming et al. reported that excessive phosphate fertilizer reduced rapeseed yield [22]. In addition, increasing rapeseed yield by straw return in this experiment mainly increased pod number per plant, seed number per pod, and 1000-seed weight (Table 2). Our results are consistent with those of Yuan et al. Manman et al. reported that rice straw returning could increase the yield of rape, mainly due to the release of nutrients such as nitrogen, phosphorus, and potassium after straw decomposition, as well as the improvement of soil vitality and the promotion of rape growth [23].
Rotation improves soil phosphorus bioavailability and phosphorus nutrition in succeeding crops [24]. After the paddy field is flooded, the soil redox potential decreases, and the valence of the compound bound to phosphorus in the soil changes, releasing fixed phosphorus; however, its solubility increases, improving the effectiveness of phosphorus [25]. In addition, the decrease in Eh promotes the degradation of organic matter in soil and releases the phosphorus fixed in organic matter, which leads to a clear residual effect of phosphorus fertilizer on the succeeding rice [10,26]. In this study, T2P3 resulted in the highest agronomic traits and grain yields compared to T2P2, T2P4, and other treatments (Table 4). The increase was mainly attributed to the higher panicle number per hectare under T2P3 than the other treatments. Effective panicle formation is closely related to tiller number, young panicle differentiation, and dry matter accumulation and distribution in rice [27]. In this study, the advantages of T2P3 and T2P4 in the panicle number per hectare can be traced back to the maximum tiller number in the vegetative growth period compared with that of T2P2 (Figure 3); however, they were not statistically significant. However, during photosynthesis, material accumulation, and nutrient organ material transfer out of rice, T2P3 treatment increased LAI, delayed the decline rate of chlorophyll after anthesis, increased the dry matter accumulation in the main growth period of rice, increased the dry matter output of nutrient organ material after anthesis, promoted the differentiation of young panicles, and increased effective panicles compared to T2P2, T2P4, and other treatments. Yuan Guoyin et al. also reported that under an annual reduction of 15% of phosphorus amount in maize-rice rotation, all phosphate fertilizers applied during the maize season did not reduce the material accumulation and yield of rice [28]. In addition, straw returning (T2) inhibited the early growth of rice but promoted mid and late-season biomass accumulation, and increased effective panicles Li et al., which is consistent with the results of previous studies [29].
This experiment proved the feasibility of reducing the application of phosphorus fertilizer in the rice season, increasing the yield of straw return, and improving the effectiveness of soil phosphorus. However, the application rate and distribution of phosphorus fertilizer, fertilizer utilization efficiency, soil physical and chemical properties, and phosphorus components in rice-rapeseed rotation under straw return require further study.

4.2. Effect of Straw Return and Different Phosphorus Application Modes on Soil Phosphorus Content and Soil Bacterial Composition

Fertilization measures drive the evolution of soil microbial communities by altering the physical, chemical, and biological characteristics of the soil [30,31]. In this study, straw return and different phosphorus application modes changed the content of total phosphorus and available phosphorus in soil (Figure 4 and Figure 5), changed the community structure of soil bacteria, and affected the diversity of soil bacteria (Figure 7). T2P2 and T2P3 resulted in the highest soil bacterial diversity; however, there was no significant difference between the T2P2 and T2P3 treatments. One possible explanation is that straw return increased soil SOC and DOC. DOC is an organic carbon source that soil microorganisms can directly use, and DOC is the most critical factor limiting the growth of soil microorganisms; therefore, straw return increases soil bacterial diversity [32]. TP is also an essential determinant of bacterial community structure. Tan et al. also reported that the application of phosphate fertilizer increased the diversity of soil bacteria [33]. In addition, there was no significant difference in diversity between the P2 and P3 treatments, which may be due to the high total phosphorus content of the two treatments. Due to the redundancy of soil microbial function, excessive phosphorus has a limited effect on microbial diversity [34]. At the phylum level, the relative abundances of Proteobacteria and Acidobacteria were not significantly different among treatments (Figure 8). However, phosphorus application and straw return increased the relative abundance of Chloroflexi, which may be explained by Chloroflexi being more adapted to anaerobic environments. Paddy field mulching and straw return provide a hypoxic environment and nutrient sources to promote growth [35].
Phosphate-solubilizing microorganisms are essential in improving soil available phosphorus content and use efficiency [36]. In this experiment, eight types of phosphate-solubilizing bacteria were reported. This study found that straw return and different phosphorus application modes affected the relative abundance of Pseudomonas, Thiobacillus, Flavobacterium, and Bacillus in the soil (Figure 8). Our results are consistent with those of Yu et al., who reported that the level of phosphorus application was closely related to the proliferation rate of phosphate-solubilizing bacteria. However, there was a significant difference in the increased proportion among different strains under the same phosphorus application level due to different strains [37]. Du et al. also reported that increasing the amount of phosphorus promoted an increase in the number of phosphate-solubilizing bacteria to a certain extent, but excessive phosphorus application was not conducive to the proliferation of phosphate-solubilizing bacteria [38]. Therefore, an appropriate level of phosphorus fertilizer application is of great significance for increasing the number of soil phosphate-solubilizing bacteria. Most phosphate-solubilizing bacteria in the soil are heterotrophic microorganisms [39]. In this experiment, straw return increased the relative abundance of Pseudomonas, Thiobacillus, Flavobacterium, and Bacillus, similar to the results of previous studies. Ramer et al. also reported that straw return supplements organic carbon sources to the soil to promote the proliferation of phosphate-solubilizing bacteria [40]. Correlation analysis showed that available phosphorus, total phosphorus, and bacterial diversity at the genus level, Pseudomonas, Thiobacillus, and Bacillus, were significantly positively correlated. The genera Pseudomonas, Thiobacillus, and Bacillus have several phosphorus-dissolving bacteria, which can decompose inorganic and organic phosphorus and improve the availability of soil phosphorus [41]. This indicates that, compared to conventional phosphorus application (P2) in the two seasons of rape and rice, P3 treatment can maintain a better soil phosphorus level without reducing soil bacterial diversity. At the same time, returning straws to the field can further increase the abundance index of soil bacteria and the relative abundance of related phosphorus-dissolving bacteria and increase the adequate supply of phosphorus in the soil.

5. Conclusions

This study proved the feasibility of reducing phosphorus application in the rice season by using residual phosphorus fertilizer in the rape season. The annual amount of phosphorus fertilizer (P2O5) was reduced to 120 kg·ha−1 and applied during the rape season. Combined with straw returning, the crop productivity of the rape-rice rotation system was improved. Meanwhile, the diversity of the soil bacterial community and the relative abundance of related phosphate-solubilizing bacteria improved.

Author Contributions

R.-p.Z. and Z.H.: Data Curation, Writing—Original Draft. R.A.: Investigation. N.-n.Z., L.Z. and T.-y.F.: Methodology, Software. K.-y.Z., X.-h.L. and L.A.: Methodology. P.M. All authors have read and agreed to the published version of the manuscript.

Funding

This research was funded by Research and model construction of rice stress-resistance and high-yield synergistic technology in hilly areas, grant number 2017YFD0301706 and The Southwest University of Science and Technology Doctoral Fund was funded by 21zx7145.

Data Availability Statement

Not applicable.

Acknowledgments

We thank Research and model construction of rice stress-resistance and high-yield synergistic technology in hilly areas(Grant no. 2017YFD0301706) and Southwest University of Science and Technology Doctoral Fund (21zx7145) the funds used in this work.

Conflicts of Interest

The authors declare that they have no conflict of interest.

References

  1. Shi, Y.P.; Huang, J.F.; Chen, Y.P.; Xiong-Wei, N.I. Nutrient balance of rape-rice and wheat-rice alternating rotation by different ways of fertilization and its effect on crop yield in new farmland of northern zhejiang plain. Acta Agric. Zhejiangensis 2012, 24, 90–91. [Google Scholar]
  2. Liu, X.; Gong, D.; Lou, X.; Han, L.J.; Yang, D.H.; Yang, C. Effect of N, P and K fertilizer combined application in mid-season rice on Jianghan plain and recommendation of its fertilizer application rate. Acta Agric. Jiangxi 2012, 24, 77–80. [Google Scholar] [CrossRef]
  3. Hui, L.I.; Jianwei, L.U.; Tao, R.E.N.; Xiaokun, L.I.; Cong, R. Nutrient efficiency of winter oilseed rape in an intensive cropping system: A regional analysis. Pedosphere 2017, 27, 364–370. [Google Scholar]
  4. Strong, W.M.; Barry, G. The availability of soil and fertilizer phosphorus to wheat and rape at different water regimes. Soil Res. 1980, 18, 353–362. [Google Scholar] [CrossRef]
  5. Wu, L.I.; Yang, X.J.; Tang, X.R. Effect of reduced phosphorus fertilizer on early/late season rice yield in south china: Effect of reduced phosphorus fertilizer on early/late season rice yield in south china. Chin. J. Eco-Agric. 2010, 18, 606–610. [Google Scholar] [CrossRef]
  6. Wang, Y.Z.; Chen, X.; Shi, L. Phosphorus availability in cropland soils of China and related affecting factors. Chin. J. Appl. Ecol. 2013, 1, 260–268. [Google Scholar]
  7. Iglesias-Jiménez, E.; Pérez García, V.; Espino, M.; Hernández, J.M. City refuse compost as a phosphorus source to overcome the p-fixation capacity of sesquioxide-rich soils. Plant Soil 1993, 148, 115–127. [Google Scholar] [CrossRef]
  8. Fan, M.S.; Jang, R.F.; Zhang, F.S.; Lu, S.H.; Liu, X.J. Nutrient management stategy of paddy rice-upland crop rotation system. Chin. J. Appl. Ecol. 2008, 19, 424–432. [Google Scholar]
  9. Turner, B.L.; Baxter, R.; Whitton, B.A. Nitrogen and phosphorus in soil solutions and drainage streams in Upper Teesdale, northern England: Implications of organic compounds for biological nutrient limitation. Sci. Total Environ. 2003, 314, 153–170. [Google Scholar] [CrossRef]
  10. Blackwel, M.S.A.; Brookes, P.C.; La Fuente-Martinez, N.L.; Gordon, H.; Murray, P.J.; Snars, K.E.; Williams, J.K.; Bol, R.; Haygarth, P.M. Phosphorus solubilization and potential transfer to surface waters from the soil microbial biomass following drying–rewetting and freezing–thawing. Adv. Agron. 2010, 106, 1–35. [Google Scholar]
  11. Singh, Y.S.; Dobermann, A.; Singh, B. Optimal phosphorus management strategies for wheat-rice cropping on a loamy sand. Soil Sci. Soc. Am. J. 2000, 64, 1422. [Google Scholar] [CrossRef]
  12. He, Z.; Xu, C.; Zhou, B.B.; Xue, L.H.; Yang, L.Z. Effects of long-term ferilization without phosphorus on greenhouse gas emissions from paddy fields. Chin. J. Appl. Ecol. 2021, 32, 942–950. [Google Scholar] [CrossRef]
  13. Tang, Q.X.; Ren, T.Z.; Lei, B.K.; Zhai, L.M.; Liu, H.B. Characteristics of nitrogenand phosphorus loss in various crop rotation systems innorthern watershed of Erhai Lake. Plant Nutr. Fertil. Sci. 2011, 17, 608–615. [Google Scholar] [CrossRef]
  14. Huang, W.; Jian, F.W.; Pan, X.H.; Tan, X.M.; Zeng, Y.J.; Shi, Q. H Effects of long-term straw return on soil organic carbon fractions and enzyme activities in a double-cropped rice paddy in south china. J. Integr. Agric. 2021, 20, 236–247. [Google Scholar] [CrossRef]
  15. Wang, Q.; Li, M.; Chen, X.; Su, Y.; Yu, M.; Shen, A. Effects of nitrogen management on soil microbial community structure at different growth stages under straw returning in paddy soils. J. Appl. Ecol. 2020, 31, 935–944. [Google Scholar] [CrossRef]
  16. Sheng, R.; Xiao, H.A.; Tan, Z.J.; Ding, L.J.; Xie, D.P. Advance in phosphorus-dissolving microorganisms and the mechanisms on phosphorus transformation and availability. Chin. J. Soil Sci. 2010, 41, 1505–1510. [Google Scholar] [CrossRef]
  17. Fan, B.Q.; Liu, Q.L. Effect of conservation tillage and straw application on the soil microorganism and P-dissolving characteristics. Chin. J. Eco-Agric. 2005, 1, 130–132. [Google Scholar]
  18. Guo, L.J.; Cao, C.G.; Zhang, Z.S. Short-term Effects of Tillage Practices and Wheat-straw Returned to Rice Fields on Topsoil Microbial Community Structure and Microbial diversity in Central China. J. Agro-Environ. Sci. 2013, 32, 1577–1584. [Google Scholar]
  19. Sun, R.; Zhang, X.X.; Guo, X.; Wang, D.; Chu, H. Bacterial diversity in soils subjected to long-term chemical fertilization can be more stably maintained with the addition of livestock manure than wheat straw. Sci. Found. China 2015, 88, 9–18. [Google Scholar] [CrossRef]
  20. Lu, R.K. Soil Agrochemical Analysis Methods; China Agricultural Science and Technology Press: Beijing, China, 2000. [Google Scholar]
  21. Bu, R.; Ren, T.; Lu, J.W.; Kun, L.X.; Cong, R.H.; Chun, L.Y. Analysis of P Fertilizer Efficiency Under Rice-Rapeseed Rotation System. Sci. Agric. Sin. 2014, 47, 1227–1234. [Google Scholar]
  22. Lei, J.M.; Yang, Z.Q.; Sheng, Z.E.; Luo, Z.X.; Yuan, J.H.; Guo, Y. Effects of phosphorus and manure on canola growth period, grain yield and quality. Agric. Res. Arid. Areas 2016, 5, 46. [Google Scholar]
  23. Yuan, M.M.; Wu, G.; Hu, R.; Geng, W.; Sun, Y.X. Effects of straw returning plus fertilization on crop yield and fertilizer use efficiency in rice-rapeseed rotation system. Chin. J. Ecol. 2018, 37, 3597–3604. [Google Scholar]
  24. Wang, K.; Ren, T.; Yan, J.; Zhu, D.; Liao, S.; Zhang, Y. Straw Returning Mediates Soil Microbial Biomass Carbon and Phosphorus Turnover to Enhance Soil Phosphorus Availability in Rice-Oilseed Rape Rotation. Soc. Sci. Electron. Publ. 2022, 335, 107991. [Google Scholar] [CrossRef]
  25. Suriyagoda, L.D.; Ryan, M.H.; Renton, M.; Lambers, H. Plant responses to limited moisture and phosphorus availability: A meta-analysis. Adv. Agron. 2014, 124, 143–200. [Google Scholar]
  26. Lu, Y.N.; Wang, Y.; Wang, S.Q.; Zhu, W.-B.; Xu, Z. Reduced P fertilization for rice/wheat rotation in Taihu Lake region. J. Agro-Environ. Sci. 2016, 35, 507–513. [Google Scholar]
  27. Tian, G.L.; Zhou, Y.; Sun, B.; Zhang, R.Q.; Zhou, X.G.; Guo, S.W. Effects of nitrogen and transplanting density on the mechanisms of tillering dynamic of rice. J. Plant Nutr. Fertil. 2018, 24, 896–904. [Google Scholar]
  28. Yuan, G.Y.; Han, Y.L.; Cheng, W.; Fang, X.D.; Wang, D.; Ping, L.I. Influence on P use efficiency by application of annual P as basal fertilizer in maize-rice rotation. Resour. Environ. Yangtze Basin 2017, 26, 2137–2145. [Google Scholar]
  29. Li, X.; Cheng, J.; Liang, J.; Chen, M.Y.; Ren, H.R.; Zhang, H.C. Effects of total straw returning and nitrogen application on grain yield and nitrogen absorption and utilization of machine transplanted Japonica rice. Acta Agron. Sin. 2017, 43, 912–924. [Google Scholar] [CrossRef]
  30. Tla, D.; Lg, C.; Cca, B.; Wt, D.; Cla, B. Long-term rice-oilseed rape rotation increases soil organic carbon by improving functional groups of soil organic matter. Agric. Ecosyst. Environ. 2021, 319, 107548. [Google Scholar]
  31. Xue, B.; Huang, L.; Huang, Y.; Yin, Z.; Li, X.; Lu, J. Effects of organic carbon and iron oxides on soil aggregate stability under different tillage systems in a rice–rape cropping system. Catena 2019, 177, 1–12. [Google Scholar] [CrossRef]
  32. Li, F.; Chen, L.; Zhang, J. Bacterial community structure after long-term organic and inorganic fertilization reveals important associations between soil nutrients and specific taxa involved in nutrient transformations. Front. Microbiol. 2017, 8, 187. [Google Scholar] [CrossRef] [PubMed]
  33. Tan, H.; Barret, M.; Mooij, M.J. Long-term phosphorus fertilisation increased the diversity of the total bacterial community and the phoD phosphorus mineraliser group in pasture soils. Biol. Fertil. Soils 2013, 49, 661–672. [Google Scholar] [CrossRef]
  34. Bender, S.F.; Wagg, C.; van der Heijden, M.G. An underground revolution: Biodiversity and soil ecological engineering for agricultural sustainability. Trends Ecol. Evol. 2016, 31, 440–452. [Google Scholar] [CrossRef] [PubMed]
  35. Song, Z.Z.; Lu, S.; Liu, Z. Start-up of simultaneous ANAMMOX and denitrification process and changes in microbial community characteristics. Environ. Sci. 2019, 40, 5057–5065. [Google Scholar]
  36. Yu, E.L.I.; Yao, T.; Rong, L.Y. Characteristics of iaa secretion and phosphate dissolving of phosphate-solubilizing bacteria and its effect on alfalfa growth. Acta Agrestia Sin. 2010, 18, 84–88. [Google Scholar]
  37. Yu, X.; Zhu, T.H.; Liu, X.; Liu, G.H. Effects of different phosphate solubilizing bacteria on growth, photosynthetic characteristics and phosphate nutrition of pecan. J. Fruit Sci. 2010, 27, 725–729. [Google Scholar]
  38. Du, L.; Cheng, G.; Wang, S.P.; Hong, J.; Huang, X.; Zhang, L.H. Effecys of phosphate-solubilizing bacteria on rhizospheremicroorganism and enzyme acticities of lettuce. Hubei Agric. Sci. 2019, 58, 70–74. [Google Scholar]
  39. Lazcano, C.; Gómez-Brandón, M.; Revilla, P.; Domínguez, J. Short-term effects of organic and inorganic fertilizers on soil microbial community structure and function. Biol. Fertil. Soils 2013, 49, 723–733. [Google Scholar] [CrossRef]
  40. Rames, E.K.; Smith, M.K.; Hamill, S.D.; De Faveri, J. Microbial indicators related to yield and disease and changes in soil microbial community structure with ginger farm management practices. Australas. Plant Pathol. 2013, 42, 685–692. [Google Scholar] [CrossRef]
  41. Peix, A.; Rivas, R.; Santa-Regina, I.; Mateos, P.F. Pseudomonas lutea sp. nov., a novel phosphate-solubilizing bacterium isolated from the rhizosphere of grasses. Int. J. Syst. Evol. Microbiol. 2004, 54, 847–850. [Google Scholar] [CrossRef] [Green Version]
Figure 1. Meteorological data of rainfall and temperature during the experiment.
Agronomy 13 00506 g001
Figure 2. Maximum tiller number, spike rate and leaf area index under different treatments in 2020. Note: T1, no straw return; and T2, straw returning. P—No P application; P2—P application on both rapeseed and rice; P3—P application on rapeseed; P4—P application on rice; MT: Maximum tillering stage; FT: full heading stage; Different small letters indicate significant differences among treatments at p < 0.05 level.
Agronomy 13 00506 g002
Figure 3. Chlorophyll content of rice post-shoot flag leaves under different treatments in 2019 and 2020. Note: T1, no straw return; and T2, straw returning. P—No P application; P2—P application on both rapeseed and rice; P3—P application on rapeseed; P4—P application on rice.
Agronomy 13 00506 g003
Figure 4. Soil total phosphorus under different treatments in 2019 and 2020. Note T1, no straw return; and T2, straw returning. P—No P application; P2—P application on both rapeseed and rice; P3—P application on rapeseed; P4—P application on rice: BT: mature stage of rape, ST: after rice transplanting of start tillering stage; MT: maximum tillering stage of rice; FT: full heading stage of rice; MS: mature stage of rice. Different small letters indicate significant differences among treatments at p < 0.05 level.
Agronomy 13 00506 g004
Figure 5. Soil Olsen-P content under different treatments in 2019 and 2020. Note: T1, no straw return; and T2, straw returning. P—No P application; P2—P application on both rapeseed and rice; P3—P application on rapeseed; P4—P application on rice; BT: mature stage of rape, ST: after rice transplanting of start tillering stage; MT: maximum tillering stage of rice; FT: full heading stage of rice; MS: mature stage of rice. Different small letters indicate significant differences among treatments at p < 0.05 level.
Agronomy 13 00506 g005
Figure 6. Soil bacterial diversity index under different treatments in 2020. Note T1, no straw return; and T2, straw returning. P—No P application; P2—P application on both rapeseed and rice; P3—P application on rapeseed; P4—P application on rice; Different small letters indicate significant differences among treatments at p < 0.05 level.
Agronomy 13 00506 g006
Figure 7. Relative abundance of main soil bacterial communities at phylum level under different treatments in 2020. Note: T1, no straw return; and T2, straw returning. P—No P application; P2—P application on both rapeseed and rice; P3—P application on rapeseed; P4—P application on rice.
Agronomy 13 00506 g007
Figure 8. Relative abundance of soil phosphate -solubilizing bacteria at genus level under different treatments in 2020. Note; T1, no straw return; and T2, straw returning. P—No P application; P2—P application on both rapeseed and rice; P3—P application on rapeseed; P4—P application on rice.
Agronomy 13 00506 g008
Table 1. Phosphorus application amount in winter rape-rice rotation system under different P application modes.
TreatmentRapesed SeasonRice Season
P2O5 kg·ha−1P2O5 kg·ha−1
P100
P212090
P31200
P4090
Table 2. Rapeseed yield and its conponment under different treatments in 2019 and 2020.
YearTrratmentNumber of Pods per PlantNumber of Seeds per Pod1000-GrainwightYield
gt·ha−1
2019T1P1323.28d13.04b3.78ab1.82c
T1P2507.73b12.69b3.72b2.75b
T1P3535.31a13.34b3.87ab3.16a
T1P4405.67c14.37a3.98a2.65b
Mean443.00B13.36B3.84B2.6B
T2P1347.63d13.48bc4.06a2.17c
T2P2520.57b12.92c3.76b2.89b
T2P3546.83a13.65b3.92ab3.34a
T2P4424.87c14.55a3.99a2.83b
Mean460.81A13.65A3.93A2.81A
2020T1P1175.50d13.92b3.72b1.04d
T1P2481.50b13.03c3.63b2.60b
T1P3508.44a13.93b3.88ab3.14a
T1P4328.71c15.20a4.01a2.29c
Mean373.53B14.02A3.82B2.27B
T2P1212.40d14.11b4.11a1.41d
T2P2496.33b13.18c3.81b2.85b
T2P3529.73a14.61ab3.90ab3.45a
T2P4385.70c14.91a3.96ab2.60c
Mean406.04A14.2A3.95A2.58A
F valueY10,795.86 **205.88 **ns622.63 **
T1735.62 **31.67 **169.35 **561.13 **
P41,610.82 **308.02 **145.49 **3960.56 **
T × P94.89 **7.40 **80.20 **10.14 **
Note: T1, no straw return; and T2, straw returning. P—No P application; P2—P application on both rapeseed and rice; P3—P application on rapeseed; P4—P application on rice; Values followed by different small letters indicate. Significant difference among treatments (p < 0.05). **—p < 0.01; ns—No significant difference.
Table 3. Dry matter accumulation and pre-flowering dry matter output of rice during the main growth periods under different treatments in 2019 and 2020 (t·ha−1).
YearTreatmentMTWFHWMSWMTW-FHWFHW-MSW△T
2019T1P12.40c9.92c13.66d7.52c3.74c1.87d
T1P22.60b10.79b15.28c8.19b4.50b2.11c
T1P33.44a11.94a16.55a8.49a4.61a2.55a
T1P43.29a11.54a15.98b8.26b4.44b2.36b
Mean2.93 A11.05A15.37B8.12B4.32A2.22
T2P12.57c10.64c14.66c8.07c4.03c2.26d
T2P22.71b11.67b16.02b8.96b4.36b2.53c
T2P33.01a12.41a16.91a9.40a4.50a3.01a
T2P42.79b11.69b16.05b8.89b4.37b2.73b
Mean2.77B11.6A15.91A8.83A4.31A2.63
2020T1P13.50c8.37b12.50b4.86a4.14a0.92c
T1P24.05b8.53b12.54b4.47b4.01b0.93c
T1P34.35a9.28a13.54a4.93a4.27a1.17a
T1P44.25a9.12a13.34a4.86a4.22a1.08b
Mean4.04A8.82A12.98B4.78A4.16A1.03B
T2P13.83b8.87b13.05b5.04b4.17b1.22b
T2P23.90ab8.92b12.90b5.02b3.99c1.27ab
T2P33.97a9.82a14.30a5.85a4.48a1.41a
T2P43.78b9.54a13.96a5.80a4.40a1.29ab
Mean3.87B9.29A13.55A5.42A4.27A1.30A
F valueY13,571.40 **11,906.94 **66,733.41 **15,550.23 **20.91 **3896.77 **
T303.68 **640.59 **3705.90 **652.55 **ns275.98 **
P796.93 **859.84 **7708.95 **157.54 **62.23 **98.61 **
T × P323.35 **23.11 **90.82 **18.66 **7.76 **ns
Note: T1, no straw return; and T2, straw returning. P—No P application; P2—P application on both rapeseed and rice; P3—P application on rapeseed; P4—P application on rice; MTW: above ground dry wight at maximum tillering stage; FHW: above ground dry weight at full heading stage; MSW: above ground dry weight at mature stage; △T: the amount of translocation before heading; Different small letters indicate significant differences among treatments at p < 0.05 level; **—p < 0.01; ns—No significant difference.
Table 4. Rice yield and yield components under different treatments in 2019 and 2020.
YearTreatmentEffective PaniclesSpikelet per Panicle1000-Grain WeightFilled Grain RateGrain Yield
104·ha−1g%t·ha−1
2019T1P1181.65c198.00b24.04b86.03c7.44d
T1P2187.17b205.47a24.46a89.33b8.41c
T1P3197.54a209.89a24.60a92.13a9.53a
T1P4199.91a207.75a24.35a91.2a9.17b
Mean191.57B204.94B24.36A89.68B8.64B
T2P1192.44c203.00a24.00a87.27c8.18d
T2P2195.23c207.33a24.17a89.17b8.72c
T2P3221.26a209.60a24.26a92.43a10.23a
T2P4206.32b208.00a24.19a92.36a9.59b
Mean203.8A206.98A24.15A90.31A9.18A
2020T1P1183.46c190.77b23.44b88.02ab7.29c
T1P2179.63c191.95b23.75a86.65b7.00c
T1P3203.11a200.45a23.90a89.44a8.70a
T1P4194.92b198.60a23.87a87.17ab8.06b
Mean190.28B195.44B23.74A87.82B7.76B
T2P1187.01c192.78b23.20b89.47a7.80c
T2P2185.09c198.52a23.44b88.32a7.61c
T2P3212.94a199.67a24.18a89.83a8.86a
T2P4200.93b200.76a23.41b89.17a8.42b
Mean196.49A197.93A23.67A89.2A8.17A
F valueY509.09 **818.65 **285.89 **60.61 **896.79 **
T303.53 **48.84 **29.78 **27.88 **231.22 **
P446.31 **141.00 **41.25 **61.00 **596.89 **
T × P22.29 **10.57 **3.59 *nsns
Note: T1, no straw return; and T2, straw return. P1—No P application; P2—P application on both rapeseed and rice; P3—P application on rapeseed; P4—P application on rice; Different small letters indicate significant differences among treatments at p < 0.05 level; **—p < 0.01; * p < 0.05; ns—No significant difference.
Table 5. Correlation analysis between phosphorus solubilizing bacteria and soil TP and Olsen-P.
Correlation IndexPseudomonasThiobacillusBacillus
TP0.86 ** 0.79 *0.76 *
Olsen-P0.87 ** 0.75 *0.74 *
Note: **—p < 0.01; * p < 0.05.
Disclaimer/Publisher’s Note: The statements, opinions and data contained in all publications are solely those of the individual author(s) and contributor(s) and not of MDPI and/or the editor(s). MDPI and/or the editor(s) disclaim responsibility for any injury to people or property resulting from any ideas, methods, instructions or products referred to in the content.

