Article

Detection of Soybean Insect Pest and a Forecasting Platform Using Deep Learning with Unmanned Ground Vehicles

1
Department of Plant Bioscience, Pusan National University, Miryang 50463, Republic of Korea
2
Division of Bio & Medical Bigdata Department (BK4 Program), Gyeongsang National University, Jinju 52828, Republic of Korea
3
Division of Life Science Department, Gyeongsang National University, Jinju 52828, Republic of Korea
4
Life and Industry Convergence Research Institute, Pusan National University, Miryang 50463, Republic of Korea
*
Authors to whom correspondence should be addressed.
These authors contributed equally to this work.
Agronomy 2023, 13(2), 477; https://doi.org/10.3390/agronomy13020477
Submission received: 25 December 2022 / Revised: 3 February 2023 / Accepted: 5 February 2023 / Published: 6 February 2023

Abstract

:
Soybeans (Glycine max (L.) Merr.), a popular food resource worldwide, have various uses throughout the industry, from everyday foods and health functional foods to cosmetics. Soybeans are vulnerable to pests such as stink bugs, beetles, mites, and moths, which reduce yields. Riptortus pedestris (R. pedestris) has been reported to cause damage to pods and leaves throughout the soybean growing season. In this study, an experiment was conducted to detect R. pedestris according to three different environmental conditions (pod filling stage, maturity stage, artificial cage) by developing a surveillance platform based on an unmanned ground vehicle (UGV) GoPro CAM. Deep learning technology (MRCNN, YOLOv3, Detectron2)-based models used in this experiment can be quickly challenged (i.e., built with lightweight parameter) immediately through a web application. The image dataset was distributed by random selection for training, validation, and testing and then preprocessed by labeling the image for annotation. The deep learning model localized and classified the R. pedestris individuals through a bounding box and masking in the image data. The model achieved high performances, at 0.952, 0.716, and 0.873, respectively, represented through the calculated means of average precision (mAP) value. The manufactured model will enable the identification of R. pedestris in the field and can be an effective tool for insect forecasting in the early stage of pest outbreaks in crop production.

1. Introduction

Soybean (Glycine max (L.) Merr.), a popular food resource worldwide, is used in various ways throughout the industry. In recent years, as the value of the valuable components in soybeans has emerged, their applications have become diverse, including in health supplements and cosmetics. Therefore, protecting soybean yields from climate change and pest infestations has become a key concern for breeders. Despite research by breeders trying to increase the productivity of soybeans, they are vulnerable to insect pests such as stink bugs, scarabs, mites, and moths, which reduce yields. Among the various pests that inhibit productivity, Riptortus pedestris (R. pedestris) has been reported to damage soybean pods throughout their growth period, excluding the flowering period [1].
R. pedestris belongs to the Alydidae family [2] and harms many crops worldwide [2]. In South Korea, there are records of five genera and six species [3] of this family, and there are over 50 genera and 200 species evenly distributed worldwide between subtropical and tropical regions [4]. It was first named Gerris pedestris Fabricius in 1775. After 1873, it was called R. clavatus Stal, and in 2005, Kikuhara Sunomyn renamed R. clavatus as R. pedestris [2]. Pests that feed on soybean include R. pedestris, Halyomorpha halys, Piezodorus, Chinavia hilaris, Cletus schmidti Kiritshenko, Homoeocerus dilatatus, Dolycoris baccarum, etc. Among them, R. pedestris is recorded as the most common and most damaging species [3,5]. In South Korea, the density of both nymph and adult insects has increased as a major pest that directly causes a decrease in soybean yield [3,6]. It has been shown that F1 generation occurs between early July and late August, with activity starting at the end of March after wintering and the spawning season starting in early May [7]. R. pedestris egg counts and lifespans vary depending on the number of soybean pods used as the primary food source. This suggests that soybean feeding significantly impacts the lifecycle of R. pedestris [2,8].
R. pedestris is estimated to occur three times yearly in Korea [2]. It overwintered within weeds or surrounding plants, and the dormant stage-induced critical day length was 13.5 h at 30–30 °C based on a latitude of 35°. The dormant stage-caused critical day length was reported to be between 14–15 h in the relatively high latitude of 39.7° [2,9]. It was reported that the long-day condition must be satisfied for the end of dormancy and that dormancy was terminated when females were exposed to 14 days or more in the high-temperature long-day condition of 25 °C. After the end of dormancy, adults are observed among winter crops in the spring. These units of insects are known to survive by feeding on other legumes until insects emerge in soybean fields [6]. Mating was performed at 15–20 day intervals under 25 °C, and the average development period from the egg to the fifth stage of nymph was 34 days [2].
The pests inflict intense damage in the R3 stage, giving rise to many plate-shaped pods, deformed seeds, and causing a decrease in the soybean yield [6]. After soybeans are damaged by R. pedestris, the leaves and stems appear to weaken, their transition to the reproductive growth stage is inhibited, and the contents of fat and carbohydrates in the damaged seeds tend to decrease. In particular, in the case of Myungjunamulkong, the germination rate fell to 2% when the area damaged by R. pedestris was more than 50% [2]. Pest control treatment usually begins after R. pedestris and is investigated visually in a soybean field. By this time, the insect pests have already spread across the area, causing damage to pods and immature seeds.
As a control method, researchers have employed diflubenzuron [10], a chitin biosynthesis inhibitor, an inhibitor of spawning and hatching, collective pheromone traps [2,11], natural enemies [2], manned crops [2], and eco-friendly agricultural materials [6]. Farmers typically use pesticides for pest control. However, this treatment is less likely to be effective because R. pedestris has high mobility. Furthermore, since R. pedestris has a symbiotic relationship with bacteria that degrade the components of pesticides, spraying the pesticides continuously may cause the emergence of resistant species [6,12]. In addition, it takes time and labor to control pests once they are prevalent in a soybean field. Therefore, forecasting is essential to achieving the two objectives of decreasing the number of R. pedestris and preventing soybean yield losses.
Traditional methods of R. pedestris prediction include the flushing method and the beating method. The flushing method examines the distribution of R. pedestris in flight by hitting a leaf with a stick. Moreover, the beating method involves placing a cloth or sticky plate of a specific size on the ground to investigate falling insects hitting a plant [2,13]. However, the distribution of R. pedestris cannot be investigated accurately with the flushing and beating methods. As an extension of the classic forecasting method, the mask region-based convolutional neural networks (MRCNN), YOLOv3, and Detectron2 with the R. pedestris detection platform based on deep learning can be used in this experiment [14,15,16,17]. An unmanned ground vehicle (UGV) with a portable camera can automatically collect images of pests from soybean fields. Deep learning algorithms can convert the image of pests on leaves and stems into the number of pests. The reporting of pests numbers can be an early indicator of pest emergence and a starting point for developing a pest control strategy together with UGV. A soybean pest forecasting program can detect pests even in areas that are difficult for people to access, enabling farmers to increase yield.
In recent years, deep learning has been a technology that has made significant progress in artificial intelligence (AI) and machine learning. In agriculture, studies on technologies such as the Agric-robot, Agric-sensor, Agric-app, GPS Farm monitoring system, etc., are being conducted [18]. In the context of pests, deep learning enables the classification and localization of multi-resolution pest images. In the case of wheat, wheat mites scattered on leaves were placed in bounding boxes to mark their location, and their distribution was determined by annotation treatment [19]. In addition, deep learning applied to Cryptoleste pusillus (S.), Sitophilus oryzae (L.), Oryzaephilus surinamensis (L.), Tribolium confusum (Jaquelin Du Val), Rhizopertha dominica (F.), and Lasioderma serricorne (F.) predicted rice pests scattered among stored grains [20]. AlexNet, GoogleNET, and SqueezeNet were used in a recent deep learning-based pest detection study. Deep learning training and inference of AI were implemented using image data from food crops such as rice, corn, wheat, beet, alfalfa, Vitis, citrus, and mango, which are host plants for pests such as Xylotrechus, Ampelophaga, and Cicadellidae [21]. For the detection and diagnosis of oilseed rape insect pests, a pest management platform was developed through a real-time diagnosis application based on deep learning. This management platform also performed the real-time detection of pest insects such as Athalia rosae japanensis, Creatonotus transiens, and Entomoscelis adonidis using Faster RCNN, RFCN, and SSD [22,23]. Object detection performance for scabs and rust occurring in apple leaves based on YOLOv3, YOLOv4, and the proposed model has been reported [24]. Performance of fine-grain object detection based on YOLOv4, a proposed model, and research on performance improvement, including performance verification, network, and parameter modification have also been undertaken [25]. Another study has researched real-time framework detection analysis for a commercial orchards canopy condition based on Dense-Net backbone with YOLOv4 [26]. Research of wildlife object detection to prevent biodiversity loss, ecosystem damage, and poaching using the proposed WilDect-YOLO framework has also been undertaken [27].
Object detection models have challenging problems detecting low-pixel targets and many objects are not distinguishable from the background. In addition, many object detection studies were mainly optimized for common objects such as a person, car, dog, and cat of MS COCO and PASCAL VOC datasets. Therefore, a study provided an improved algorithm that can effectively increase the accuracy of small target detection based on YOLOv3 [28]. A study on detecting small-pixel objects by increasing a convolution operation based on the YOLOv3 model and Unmanned aerial vehicle (UAV) has also been undertaken [29]. For the YOLOv5 research, for one of the state-of-art object detection model, high-quality aerial images were collected to improve the difficulty of detecting small objects in aerial images, and performance was improved through manipulated layers [30]. Since R. pedestris, the target object of this study, occupies a small volume of pixels and is difficult to distinguish from background information depending on environmental conditions, object detection is achieved through high-quality data and appropriate architecture proposals.
In this study, the insect image data from the soybean field were used as the training and testing sets in MRCNN, YOLOv3, and Detectron2. There are four RCNN-type series models of deep learning-based image detection (RCNN, Fast RCNN, Faster RCNN, and MRCNN). The first three CNNs are models for object detection only, but MRCNN improves upon Faster RCNN and adds object detection and instance segmentation. In addition, MRCNN is a model that improves visibility by including a mask on the bounding box of each object detected by Faster RCNN [31]. In this experiment, R. pedestris image data collection, annotation processing, and weight training were required in training the AI model. After annotating and learning, we proceeded with verification and confirmation. The objective of the present study was to build up an early detection platform for R. pedestris that can appear during the soybeans growing season based on deep learning and object detection tools.

2. Materials and Methods

2.1. Planting and Management for the Field Experiment

The experiment was conducted in the experimental field of Pusan National University (PNU), Miryang, South Korea, on 23 June 2021. Daewonkong, a prominent domestic cultivar for soybean paste and tofu, was planted at a planting density of 0.8 × 0.2 m, with a total area of 518.4 m2 (43.2 × 12.0 m). A drip irrigation system and a soil moisture sensor for each block (JnP, Seoul, South Korea) were used to supply adequate and sufficient moisture for crops [32]. R. pedestris image data were obtained using a GoPro camera between 10 am and 6 pm when R. pedestris is most active throughout its entire growth period except the flowering stage [7].

2.2. Video Recording Device for Data Accumulation

The action camera used in the experiment was a GoPro Hero 8 Black (GoPro Inc., 3025 Clearview Way, San Mateo, CA 94402, USA). The Hyper-Smooth 2.0+ Boost function automatically corrects any distortion of the image that may occur owing to the curvature of the ground or conditions in the field. The image resolution was set to FOV with a linear digital lens and time-lapse images were taken at 0.5-s intervals. The time-lapse conditions were zoom—1.0×, exposure value—+0.5, white balance—auto, ISO min—400, and ISO max—1600. Video quality was supported up to 1080, 2.7K, 4K, 1440 (4:3), 2.7K (4:3), and 4K (4:3), and FPS up to 24, 30, 60, 120, and 240. In addition to video, there are functions, such as Slow Motioning and Time-Lapse, that can be used to compose time-series image data. The camera was attached to the UGV and image data were recorded at an average distance of 40 cm between the camera and the plant.

2.3. Unmanned Ground Vehicle

The UGV used in this experiment was the Devastator Tank Mobile Platform (DFrobot Inc., Shanghai, Room 501, Building 9, No 498 Guoshoujin Road, Pudong, Shanghai 201203, China) and the MZ Large Remote-Control Car (MZ-model Inc., Neiyang Industrial Area, Zhulin, Lian Shang Town, Chenghai District, Shantou City, Guangdong 515000, China). The Devastator Tank Mobile Robot (DMR) is a robot platform using Raspberry pi 3 B+ implemented as a Python code-based project. The DMR runs at 133 RPM at a rated voltage of 6V. Its assembled dimensions are (L × W × H): 225 × 220 × 180 mm/8.86 × 8.66 × 4.25 inches, and the body is made of metal. Caterpillar tracks are attached to the wheel. Its platform is based on coding tools such as Raspberry pi and Romeo All-in-one, and various sensors, such as a gyro sensor, ultrasonic sensor, GPS sensor, infrared sensor, etc., can be used. The Mpotow Large Remote-Control Car (MRC) is a rock crawling climbing RC (Radio Control) car made of ABS plastic + alloy material. The controller is connected at 2.4 GHz, and the drive type is a 6WD model. It uses a 9.6V 1000 mAh Ni-cd battery and the maximum speed is 140 m/min. The control distance is 35–50 m and the assembled dimensions (L × W × H) are 48.6 × 30.6 × 22.5 cm. DMR is a small-sized self-driving unit, and MRC is a medium-sized remote-control unit. Each unit can take a video of plant lines for 36 m and 144 m lengths per minute, respectively. If the planting interval is 0.2 m, each unit can record a number of images, at 180 and 720 objects of plants per minute, respectively.

2.4. Image-Based Soybean Insect Pest Recognition

In the MRCNN model [15], the time-lapse image data were used as training and test sets. Our method used the image data from the pod-filling stages (R1 to R6) period as a training set. The test set consisted of the pod-filling stages dataset, the maturity stages (R7 to R9) dataset, and the laboratory dataset. The pod-filling stages image data used as a test set were collected under the same conditions as the input data and the maturity stages image data were collected when the soybean leaves showed a yellow color after R6. The laboratory condition image data were collected in the environment set up for rearing insect pests, which was artificially created inside the laboratory.

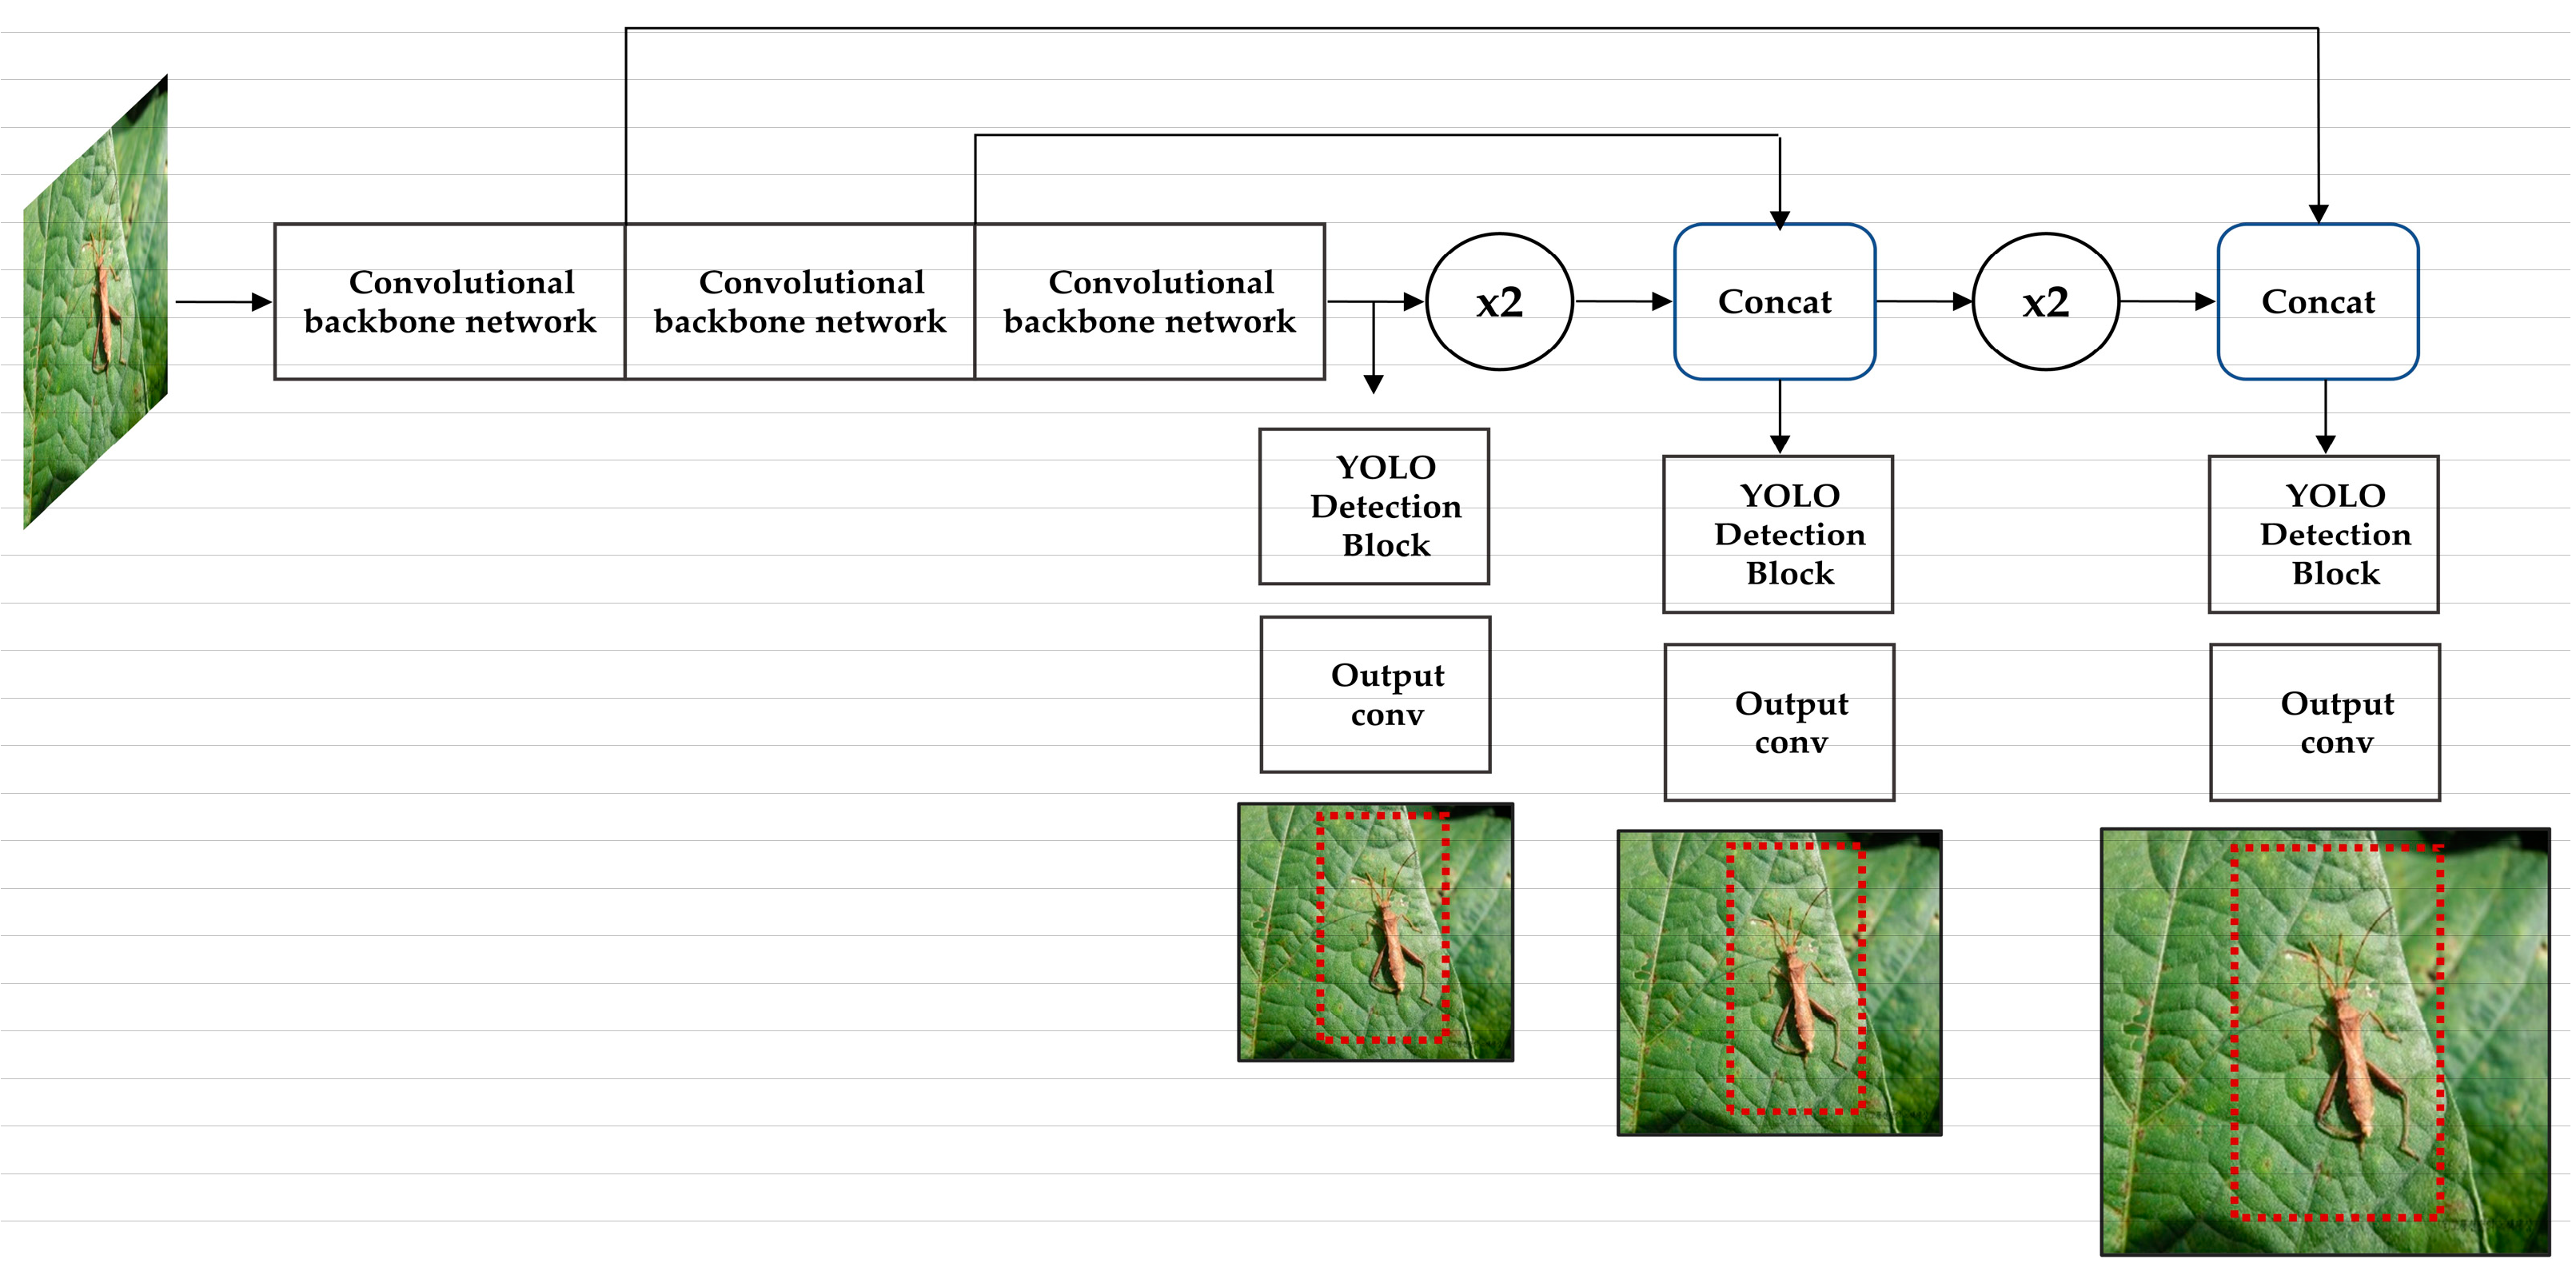
2.5. Object Detection Model

MRCNN has a structure that adds a classification branch to predict the class of objects obtained from the RPN of the Faster RCNN and a mask branch to predict segmentation masks parallel to the bounding box regression branch (Figure 1). The number of images used for AI training is 2 per GPU and the GPU used in this experiment is one unit of NVIDIA GeForce RTX 3090. The project is implemented in a python 3.6 environment with Tensorflow 1.14.0 and Keras 2.2.5. During object detection via AI learning, the region of interest (ROI) is simplified through the refinement process and pooled through the non-maximum suppression (NMS) algorithm (Figure 2). The MRCNN model configurations consist of NMS: 0.7; image size: 1024, 1024, 3; number of ROIs per image: 128; ROI positive ratio: 0.33; detection max instances: 100; detection threshold: 0.3; learning momentum: 0.9; learning rate: 0.002; mask pool size: 14; RoI positive ratio: 0.33; RPN train anchors per image: 256; validation steps: 50; train ROIs per image: 128, respectively. The backbone of this model consists of backbone strides based on resnet101: 4, 8, 16, 32, 64, and top-down layers of 256 size were used to build the feature pyramid. The Keras model summary consists of total params: 64,158,584, trainable params: 64,047,096, and non-trainable params: 111,488, respectively.
YOLOv3 consists of a single neural network similar to the human visual system and is a model that proceeds with the bounding box and classification simultaneously [16,33,34]. In this model, training and testing are run by a GPU using RTX 3090. The training parameters summary includes image size: 640 × 640, batch size: 16, epoch number: 500, learning rate: 1 × 10⁻³, optimizer: Stochastic Gradient Descent (SGD), image resize: 480, IoU threshold: 0.2, weight decay: 0.00005, momentum: 0.9, filter: 1024, output channel: 125, respectively (Figure 3).
Detetron2 is an open-source project of Facebook AI Research (FACE) [17]. A training loop is learned with a PyTorch engine. This includes DensePose, feature pyramid networks (FPN), and numerical variations on the Pioneering MRCNN model families, which were known using FPN models in this research (Figure 4). The training parameters summary includes min-size of train: 480, 512, 544, 576, 608, 640, 672, 704, 736, 768, 800; min-size of test: 800; backbone network: resnet101, anchor size: 32, 64, 128, 256, 512; number of convolutional networks: 4; batch size: 16; steps: 12,000, 16,000; max iteration: 18,000, respectively.
All three models were trained using a Pascal VOC dataset. To assess the performance of the models, the means of average precision (mAP) value was estimated as an indicator of MRCNN, YOLOv3, and Detectron2 [35]. The object detection performance was evaluated using the precision-recall curve and average precision (AP). In the case of AP, a representative performance discriminator produces a monotonic reduction graph of precision-recall (PR) curves in a more advanced way than the PR curve evaluation method. The area of the graph’s x- and y-axes is AP. The mAP was measured via a Pascal VOC mAP (AP50), a performance indicator with an intersection over union (IoU) of 0.5. The IoU refers to the overlap area of the boundary box predicted by the object detection model and the boundary box of the training data divided by the value of the total area. The mAP was calculated for model performance tests with variations of environmental conditions and benchmarking study of suggested models.
I o U = A r e a   o f   O v e r l a p A r e a   o f   U n i o n
In this experiment, the valuation consists of the confidence score, the classified objects/identified objects index (C/I), and the mAP. A confidence score indicates whether the AI accurately derives the target output from the convolutional network. It is calculated as a percentage at the top of the bounding box. The confidence score in the MRCNN configuration was measured in the spectrum with min: 0.5 to max: 1.0. C/I is a value derived by analyzing the precision and recall of objects in each image detected for object detection prediction via the MRCNN model. C/I is calculated as an index indicating the ratio of classified objects (predicted results of the insect pest) to identified objects (insect pest of input raw image data).
C / I = C l a s s i f i e d   o b j e c t I d e n t i f i e d   o b j e c t

2.6. Web Application for Portable Object Detection

A portable application of a deep learning model was implemented based on the Flask web framework and used to perform R. pedestris detection through a portable deep learning model. Flask is a Python-based microweb framework and uses the werkzeug WSGI (Web Server Gateway Interface) toolkit and the Jinja2 template engine [36]. Web application deployment is built using Nginx, Gunicorn, and three functions added to the web application: image uploading, model activation, and result shows [37,38]. When the client uploads an image file to the web page, the data go through Nginx and Gunicorn to reach the Flask model, and the deep learning model completes R. pedestris detection. After that, the ID, file name, file path, image binary data, and the number of detected R. pedestris objects are stored in the Sqlite3 database, while the file name and the number of detected stink bugs are placed into a CSV file and provided to the client.

3. Results

3.1. Dataset

Data were collected in the field and under laboratory conditions. The data from the field condition using the UGV were acquired before and after the stage of soybean physiological maturity. Our data consisted of the pod filling stages set, the maturity stages set, and the laboratory set. In the field, an autonomous UGV was driven repeatedly between plants in a specific field block, collecting field image data in time series using the time-lapse function of the camera attached to the UGV. We collected about 5000 image data and applied them to filtering and pre-processing to remove distorted and defective data. In the artificially created cage in the laboratory, time-lapse photography could be performed throughout the growth of R. pedestris. The collected total laboratory image data consisted of 15,000 pieces, and after filtering, 500 pest images were randomly selected for AI learning. For pest image data, 450 training sets and 50 test/validation sets were trained ten times in deep learning.

3.2. Evaluation of Loss Score for Iterations in AI Learning

After training the MRCNN model on the R. pedestris dataset, there were 150 training iterations; the max and min loss scores were 1.377 and 0.124, respectively. The total learning time was 15 h, 6 min, and 13 s. The value of the loss function gradually decreased as the iteration progressed. The max degree of the slope in the loss graph was 1.599 and the min degree was 0.356. The line smooth declined sharply between epochs 1 and 10, the initial stage of AI learning. After epoch 10, the slope of the loss graph curve became gentle, as the value of line smooth was low here (Figure 5).

3.3. Object Detection Output of R. pedestris

The input image data, comprising images of insect pests collected and randomly selected in the PNU field, were confirmed via object detection and image segmentation after passing through the convolution network, as shown in Figure 3. As a result, a score calculated by AI was assigned to each object and each segmented insect object was classified with a different color mask (Figure 6 and Figure 7).
The confidence scores for the pod-filling stages, the maturity stages, and laboratory data were 0.998, 0.958, and 0.971, respectively. The C/I value for the pod-filling stages was the highest (0.994), followed by laboratory conditions (0.842), and the maturity stages (0.794). The mAP values for the pod-filling stages, the maturity stages, and laboratory data were 0.952, 0.716, and 0.873, respectively (Table 1 and Figure 8). Therefore, the data from the pod-filling stages were used for the training set. The validation test was performed using data from both pod-filling and the maturity stages and the artificial cages created in the laboratory.
The deviation between the mAP indices of model benchmarking with MRCNN, YOLOv3, and Detectron2 was 0.01~0.03, thus showing a slight difference. The mAP was higher than 0.9 in each model. YOLOv3 achieved the highest mAP value of 0.97541, and Detectron2 had the lowest of 0.94435 (Figure 9).

3.4. App-Based R. Pedestris Object Detection Model

We created a simple web service using the model-serving API to demonstrate that field-gathered photos would be transmitted to the model-serving API, and the output would be determined by a human (Figure 10 and Figure 11). Python Flask, https://github.com/pallets/flask/ (accessed on 18 January 2023), was used to develop the API, and although the model serving was performed on the CPU rather than the GPU, it was still feasible for irregular image transfer events. The analysis on the CPU took the following amount of time to complete. The number of images was measured via settings 25, 50, and 100. When 25 images were input into the model, the running time was 79.0 sec/image recorded. It was 67.4 sec/image when 50 images were input and 69.2 sec/image when 100 images were input (Figure 12 and Table 2). The resulting number of R. pedestris was recorded and exported in CSV format. R. pedestris counts were obtained from the images and UGV surveillance can be utilized to identify R. pedestris outbreaks early on with the help of the AI-based prediction model.

4. Discussion

Although several studies on resistance to R. pedestris in soybeans have been conducted in many countries, soybean varieties that are resistant to the insect pest have not been identified, except for a few cases showing relatively less damage [39,40,41]. Therefore, to reduce the damage caused by R. pedestris in the soybean field, developing a precise monitoring system for timely control in conjunction with research to find resistant soybean resources is crucial.
In recent years, various tasks such as mechanization, automation, and agronomic management have been attempted in agriculture [42,43]. In particular, studies on data collection and analysis related to crop growth using automation and unmanned vehicles with various sensors are being conducted [44,45]. In addition, IoT-based crop monitoring with multiple sensors is being conducted in agronomy as a cutting-edge technology that can be applied to various crops [46]. Drones, known as representative unmanned aerial vehicles, have been widely applied in many fields of agriculture and can be used to conduct crop management at the macroscopic level across the field [47,48]. However, this method has a significant drawback in that the lower part of the plant cannot be observed owing to the volume of the canopy. In the case of R. pedestris, most units are attached to young pods, but the upper leaves hide these pods, so it is difficult to obtain images of them using drones. In contrast, machines that can collect data from above the ground, such as UGVs, are operated close to the individual crop. Various types of insect pests exist in cultivated fields, and it is not easy for farmers to directly observe and control them all. Therefore, appropriate crop monitoring systems are required to conduct pest management precisely, including small devices, such as the UGV [49,50]. However, the UGV is limited to a running time of 30 min due to a battery capacity issue. Because the UGV uses nickel cadmium rechargeable batteries, it causes a loss of battery capacity as charging is repeated, so extra batteries are essential and battery replacement is frequent. In addition, since there is a possibility that R. pedestris may fly away due to noise generated during motor output, it is necessary to be delicate in the operation of the UGV.
The data pool for deep learning can be increased through data augmentation processing such as flipping, cropping, rotation, feature standardization, ZCA whitening, and color noise adjustment in sample images [51,52]. In this study, however, data augmentation was not applied, and artificial intelligence learning was conducted with actual field datasets obtained from a UGV and camera (Figure 5). Because the selection was performed with high-quality images for both field and laboratory data, high-quality AI learning was possible. Thus, the results derived from object detection could be reliably used to identify insect pests. From the graph in Figure 3, it can be seen that the loss curve decreased as the iteration increased in the model. The loss function is one of the indicators used to judge whether the AI model is learning well or whether it has been overfitted or underfitted in the optimization process. The loss function is also related to the error rate. In the case of the loss function causing a reduction in the curve, the error rate also decreases. Thus, as a performance evaluation indicator, the lower the loss score, the better the model’s performance. As a result, this study revealed that the loss curve decreased as the number of iterations increased during AI training, indicating that the model’s error rate was low and its performance had improved.
In this study, three different models, MRCNN, YOLOv3, and Detectron2, were used for object detection. The mAP values of the three models were compared in the reliability of their performance, 0.95797, 0.97541, and 0.94435, respectively, indicating that all three models could be used to conduct the object detection of R. pedestris. However, we believed it would be most effective to use the optimal model based on the environments and target traits. Therefore, it would be necessary to continuously improve the model’s performance using the data generated by the used model. Furthermore, considering the purpose of this study, it might be appropriate to choose the MRCNN model from the three models because the MRCNN model, which further refines the target area using a segmentation mask to classify the image of the pests, has high visual reliability in extracting the location information of the pests [31,53].
When performing object detection of R. pedestris, portable object prediction using a specific application has several advantages. First, the image data of objects collected in the field must be physically transferred to a machine with a GPU to process them. However, objects can be detected immediately in the field using a network server without a computer or device when using an app. This means the R. pedestris attached to soybean plants can be detected without any loss resulting from a person approaching the soybeans and the pest being blown away, so appropriate numerical data can be collected. This way, it is possible to provide more precise numerical data than the conventional measurement method. In addition, the automation process can be conducted by transmitting the image data to an app through the network server without human labor. However, if the amount of image data provided at one time increases, the measurement speed per unit is delayed, and the quality of detection outputs is reduced. Therefore, sheets of input image data were limited to ten images per time point.

5. Conclusions and Future Research

R. pedestris, a major soybean pest, spreads throughout the soybean field, causing significant damage to the growth and yield every year. Supplementary Figure S1a depicts the occurrence of and damage by R. pedestris in soybean fields and the plate-shaped pods caused by R. pedestris. As the density of R. pedestris in soybean fields increases, the vitality of the soybeans is diminished. However, the symptoms of plant damage are visible beneath the canopy of the leaves. Therefore, we considered using a UGV to observe pests directly above the ground near the plants [54]. After pre-processing and augmentation, the accumulated R. pedestris videos and images were used as training, validation, and test datasets for the AI-based object detection model. The manufactured model (MRCNN, YOLOv3, Detectron2) is built with a relatively lightweight algorithm compared to the state-of-art model (YOLOv5, YOLOv7, U-net, and more), making it suitable for beginner challenging studies in agronomy. In addition, agricultural managers can quickly obtain information about insect pests using a portable web application. Furthermore, the early detection of R. pedestris through the pest management process via a UGV detection network and AI object detection can help to prevent the occurrence of plate-shaped pods and infected pods in soybean fields. Therefore, it is necessary to actively predict the occurrence of R. pedestris when making early decisions on pesticide treatments.
As far as we know, this is the first time that R. pedestris has been recognized in a field using deep learning technology rather than human eyes, and a corresponding app has been developed. In the future, the results from the present study might provide the framework of the whole process to researchers who want to conduct insect pest detection and forecasting studies regardless of the type of insect pest.

Supplementary Materials

The following are available online at https://www.mdpi.com/article/10.3390/agronomy13020477/s1; Figure S1. (a) R. pedestris in the soybean field can cause plate-shaped pods by sucking. (b) AI-based object detection model using image data of R. pedestris. (c) Insect pest control after forecasting using the model

Author Contributions

Conceptualization, T.-H.J. and Y.J.K.; methodology, Y.-H.P. and S.H.C.; software: Y.-H.P. and S.H.C.; formal analysis, Y.-H.P., S.H.C. and Y.J.K.; investigation, Y.-H.P. and Y.-J.K.; resources, T.-H.J.; data curation, Y.-H.P., S.H.C., Y.J.K. and T.-H.J.; writing—original draft preparation, Y.-H.P. and S.H.C.; writing—review and editing, T.-H.J., Y.J.K. and S.-W.K.; funding acquisition, T.-H.J. All authors have read and agreed to the published version of the manuscript.

Funding

This work was carried out with the support of the Cooperative Research Program for Agriculture Science and Technology Development (Project No. PJ016403022022), Rural Development Administration.

Data Availability Statement

MDPI Research Data Policies.

Conflicts of Interest

The authors declare no conflict of interest.

References

  1. Jung, J.K.; Seo, B.Y.; Moon, J.K.; Park, J.H. Oviposition preference of the bean bug, Riptortus clavatus (Thunberg) (Hemiptera: Alydidae), on soybean and mungbean plants. Korean J. Appl. Entomol. 2008, 47, 379–383. [Google Scholar] [CrossRef]
  2. Lim, U.T. Occurrence and control method of Riptortus pedestris (Hemiptera: Alydidae): Korean perspectives. Korean J. Appl. Entomol. 2013, 52, 437–448. [Google Scholar] [CrossRef]
  3. Paik, C.H.; Lee, G.H.; Choi, M.Y.; Seo, H.Y.; Kim, D.H.; Hwang, C.Y.; Kim, S.S. Status of the occurrence of insect pests and their natural enemies in soybean fields in Honam province. Korean J. Appl. Entomol. 2007, 46, 275–280. [Google Scholar] [CrossRef]
  4. Ghahari, H.; Carpintero, D.L.; Moulet, P.; Linnvuori, R.E.; Ostovan, H. Annotated catalogue of the Iranian broad-headed bugs (Hemiptera: Heteroptera: Alydidae). Acta Entomol. Musei Natl. Pragae 2010, 50, 425–436. [Google Scholar]
  5. Kang, C.H. Review on true bugs infesting tree fruits, upland crops, and weeds in Korea. J. Appl. Entomol. 2003, 4, 269–277. [Google Scholar]
  6. Seo, M.J.; Kwon, H.R.; Yoon, K.S.; Kang, M.A.; Park, M.W.; Jo, S.H.; Shin, H.S.; Kim, S.H.; Kang, E.G.; Yu, Y.M.; et al. Seasonal occurrence, development, and preference of Riptortus pedestris on hairy vetch. Korean J. Appl. Entomol. 2011, 50, 47–53. [Google Scholar] [CrossRef]
  7. Kikuchi, A. A simple rearing method of Piezodorus hybneri Gmelin and Riptortus clavatus Thunberg (Hemiptera: Pentatomidae, Alydidae), supplying dried seeds. Bull. Natl. Agric. Res. Cent. 1986, 6, 33–42. [Google Scholar]
  8. Kwon, H.R.; Kim, S.H.; Park, M.W.; Jo, S.H.; Shin, H.S.; Cho, H.S.; Youn, Y.N. Environmentally-friendly control of Riptortus pedestris (Hemiptera: Alydidae) by environmental friendly agricultural materials. Korean J. Agric. Sci. 2011, 38, 413–419. [Google Scholar]
  9. Numata, H. Environmental factors that determine the seasonal onset and termination of reproduction in seed-sucking bugs (Heteroptera) in Japan. Appl. Entomol. Zool. 2004, 39, 565–573. [Google Scholar] [CrossRef]
  10. Ahn, Y.J.; Kim, G.H.; Cho, K.Y. Susceptibility of embryonic and postembryonic developmental stages of Riptortus clavatus (Hemiptera: Alydidae) to diflubenzuron. Korean J. Appl. Entomol. 1992, 31, 480–485. [Google Scholar]
  11. Yasuda, T.; Mizutani, N.; Endo, N.; Fukuda, T.; Matsuyama, T.; Ito, K.; Moriya, S.; Sasaki, R. A new component of attractive aggregation pheromone in the bean bug, Riptortus clavatus (Thunberg) (Heteroptera: Alydidae). Appl. Entomol. Zool. 2007, 42, 1–7. [Google Scholar] [CrossRef]
  12. Kikuchi, Y.; Hayatsu, M.; Hosokawa, T.; Nagayama, A.; Tago, K.; Fukatsu, T. Symbiont-mediated insecticide resistance. Proc. Natl. Acad. Sci. USA 2012, 109, 8618–8622. [Google Scholar] [CrossRef]
  13. Bae, S.D.; Kim, H.J.; Lee, G.H.; Park, S.T. Development of observation methods for density of stink bugs in soybean field. Korean J. Appl. Entomol. 2007, 46, 153–158. [Google Scholar] [CrossRef]
  14. Geissmann, Q.; Abram, P.K.; Wu, D.; Haney, C.H.; Carrillo, J. Sticky Pi, an AI-powered smart insect trap for community chronoecology. bioRxiv 2021. [Google Scholar] [CrossRef]
  15. Available online: https://github.com/matterport/Mask_RCNN.git (accessed on 18 January 2023).
  16. Available online: https://pjreddie.com/darknet/yolo/ (accessed on 18 January 2023).
  17. Available online: https://github.com/facebookresearch/detectron2.git (accessed on 18 January 2023).
  18. Shamshiri, R.R.; Weltzien, C.; Hameed, I.A.; Yule, I.J.; Grift, T.E.; Balasundram, S.K.; Pitonakova, L.; Chowdhary, G. Research and development in agricultural robotics: A perspective of digital farming. Int. J. Agric. Biol. Eng. 2018, 11, 1–14. [Google Scholar] [CrossRef]
  19. Li, W.; Chen, P.; Wang, B.; Xie, C. Automatic localization and count of agricultural crop pests based on an improved deep learning pipeline. Sci. Rep. 2019, 9, 1–11. [Google Scholar] [CrossRef]
  20. Shen, Y.; Zhou, H.L.; Li, J.G.; Jian, F.J.; JayasYoun, D.S. Detection of stored-grain insects using deep learning. Comput. Electron. Agric. 2018, 145, 319–325. [Google Scholar] [CrossRef]
  21. Khalifa, N.E.M.; Mohamed, L.; Mohamed, H.N.T. Insect pests recognition based on deep transfer learning models. J. Theor. Appl. Inf. Technol. 2020, 98, 60–68. [Google Scholar]
  22. He, Y.; Zeng, H.; Fan, Y.; Ji, S.; Wu, J. Application of deep learning in integrated pest management: A real-time system for detection and diagnosis of oilseed rape pests. Mob. Inf. Syst. 2019, 2019, 4570808. [Google Scholar] [CrossRef]
  23. Ren, S.; He, K.; Girshick, R.; Sun, J. Faster r-cnn: Towards real-time object detection with region proposal networks. Adv. Neural Inf. Process. Syst. 2015, 28, 91–99. [Google Scholar] [CrossRef]
  24. Roy, A.M.; Jayabrata, B. A deep learning enabled multi-class plant disease detection model based on computer vision. AI 2021, 2, 413–428. [Google Scholar] [CrossRef]
  25. Roy, A.M.; Rikhi, B.; Jayabrata, B. A fast accurate fine-grain object detection model based on YOLOv4 deep neural network. Neural Comput. Appl. 2022, 34, 3895–3921. [Google Scholar] [CrossRef]
  26. Roy, A.M.; Jayabrata, B. Real-time growth stage detection model for high degree of occultation using DenseNet-fused YOLOv4. Comput. Electron. Agric. 2022, 193, 106694. [Google Scholar] [CrossRef]
  27. Roy, A.M.; Bhaduri, J.; Kumar, T.; Raj, K. WilDect-YOLO: An efficient and robust computer vision-based accurate object localization model for automated endangered wildlife detection. Ecol. Inform. 2022, 2022, 101919. [Google Scholar] [CrossRef]
  28. Xianbao, C.; Guihua, Q.; Yu, J.; Zhaomin, Z. An improved small object detection method based on Yolo V3. Pattern Anal. Appl. 2021, 24, 1347–1355. [Google Scholar] [CrossRef]
  29. Liu, M.; Wang, X.; Zhou, A.; Fu, X.; Ma, Y.; Piao, C. Uav-yolo: Small object detection on unmanned aerial vehicle perspective. Sensors 2020, 20, 2238. [Google Scholar] [CrossRef] [Green Version]
  30. Kim, M.; Jongmin, J.; Sungho, K. ECAP-YOLO: Efficient Channel Attention Pyramid YOLO for Small Object Detection in Aerial Image. Remote Sens. 2021, 13, 4851. [Google Scholar] [CrossRef]
  31. He, K.; Gkioxari, G.; Dollár, P.; Girshick, R. Mask r-cnn. Mask r-cnn. In Proceedings of the IEEE International Conference on Computer Vision, Venice, Italy, 22–29 October 2017. [Google Scholar]
  32. Nam, S.-W.; Young-Shik, K. Discharge variation of perforated hoses and drip irrigation systems for protected cultivation. Prot. Hortic. Plant Fact. 2007, 16, 297–302. [Google Scholar]
  33. Redmon, J.; Divvala, S.; Girshick, R.; Farhadi, A. You only look once: Unified, real-time object detection. In Proceedings of the IEEE Conference on Computer Vision and Pattern Recognition, Las Vegas, NV, USA, 26 June–1 July 2016. [Google Scholar]
  34. Farhadi, A.; Joseph, R. Yolov3: An incremental improvement. In Computer Vision and Pattern Recognition; Springer: Berlin/Heidelberg, Germany, 2018. [Google Scholar]
  35. Gerovichev, A.; Sadeh, A.; Winter, V.; Bar-Massada, A.; Keasar, T.; Keasar, C. High throughput data acquisition and deep learning for insect ecoinformatics. Front. Ecol. Evol. 2021, 9, 309. [Google Scholar] [CrossRef]
  36. Vogel, P.; Klooster, T.; Andrikopoulos, V.; Lungu, M. A low-effort analytics platform for visualizing evolving Flask-based Python web services. In Proceedings of the 2017 IEEE Working Conference on Software Visualization (VISSOFT), Shanghai, China, 18–19 September 2017. [Google Scholar]
  37. Eby, P.J. Python Web Server Gateway Interface v1. 0. Línea]. Available online: https://www.python.org/dev/peps/pep-0333/ (accessed on 18 January 2023).
  38. Chesneau, B. Gunicorn. Available online: https://docs.gunicorn.org/en/latest/index.html# (accessed on 18 January 2023).
  39. Oh, Y.J.; Cho, S.K.; Kim, K.H.; Paik, C.H.; Cho, Y.; Kim, H.S.; Kim, T.S. Responses of Growth Characteristics of Soybean [Glycine max (L.) Merr.] Cultivars to Riptortus clavatus Thunberg (Hemiptera: Alydidae). Korean J. Breed. Sci. 2009, 41, 488–495. [Google Scholar]
  40. Wada, T.; Nobuyuki, E.; Masakazu, T. Reducing seed damage by soybean bugs by growing small-seeded soybeans and delaying sowing time. Crop Prot. 2006, 25, 726–731. [Google Scholar] [CrossRef]
  41. Lee, J.; Jeong, Y.; Shannon, J.G.; Park, S.; Choung, M.; Hwang, Y. Agronomic characteristics of small-seeded RILs derived from Eunhakong (Glycine max) × KLG10084 (G. soja). Korean J. Breed. 2005, 37, 288–294. [Google Scholar]
  42. Kashyap, P.K.; Kumar, S.; Jaiswal, A.; Prasad, M.; Gandomi, A.H. Towards Precision Agriculture: IoT-enabled Intelligent Irrigation Systems Using Deep Learning Neural Network. IEEE Sens. J. 2021, 21, 17479–17491. [Google Scholar] [CrossRef]
  43. Machleb, J.; Peteinatos, G.G.; Sökefeld, M.; Gerhards, R. Sensor-Based Intrarow Mechanical Weed Control in Sugar Beets with Motorized Finger Weeders. Agronomy 2021, 11, 1517. [Google Scholar] [CrossRef]
  44. Palumbo, M.; D’Imperio, M.; Tucci, V.; Cefola, M.; Pace, B.; Santamaria, P.; Parente, A.; Montesano, F.F. Sensor-Based Irrigation Reduces Water Consumption without Compromising Yield and Postharvest Quality of Soilless Green Bean. Agronomy 2021, 11, 2485. [Google Scholar] [CrossRef]
  45. Redmon, J.; Farhadi, A. Yolov3: An incremental improvement. arXiv 2018. [Google Scholar] [CrossRef]
  46. Saiz-Rubio, V.; Francisco, R.-M. From smart farming towards agriculture 5.0: A review on crop data management. Agronomy 2020, 10, 207. [Google Scholar] [CrossRef]
  47. Lee, D.-H.; Hyeon-Jin, K.; Jong-Hwa, P. UAV, a Farm Map, and Machine Learning Technology Convergence Classification Method of a Corn Cultivation Area. Agronomy 2021, 11, 1554. [Google Scholar] [CrossRef]
  48. Lan, Y.; Qian, S.; Chen, S.; Zhao, Y.; Deng, X.; Wang, G.; Zang, Y.; Wang, J.; Qiu, X. Influence of the Downwash Wind Field of Plant Protection UAV on Droplet Deposition Distribution Characteristics at Different Flight Heights. Agronomy 2021, 11, 2399. [Google Scholar] [CrossRef]
  49. Pitla, S.; Bajwa, S.; Bhusal, S.; Brumm, T.; Brown-Brandl, T.M.; Buckmaster, D.R.; Thomasson, A. Ground and Aerial Robots for Agricultural Production: Opportunities and Challenges; CAST: Ames, IO, USA, 2020. [Google Scholar]
  50. Zheng, Y.; Lan, Y.; Xu, B.; Wang, Z.; Tan, Y.; Wang, S. Development of an UGV System for Measuring Crop Conditions in Precision Aerial Application. In Proceedings of the American Society of Agricultural and Biological Engineers, Kansas City, MO, USA, 21–24 July 2013; p. 1. [Google Scholar]
  51. Zhong, Y.; Gao, J.; Lei, Q.; Zhou, Y. A vision-based counting and recognition system for flying insects in intelligent agriculture. Sensors 2018, 18, 1489. [Google Scholar] [CrossRef]
  52. Shorten, C.; Taghi, M.K. A survey on image data augmentation for deep learning. J. Big Data 2019, 6, 1–48. [Google Scholar] [CrossRef]
  53. Champ, J.; Mora-Fallas, A.; Goëau, H.; Mata-Montero, E.; Bonnet, P.; Joly, A. Instance segmentation for the fine detection of crop and weed plants by precision agricultural robots. Appl. Plant Sci. 2020, 8, e11373. [Google Scholar] [CrossRef]
  54. Noskov, A.; Joerg, B.; Nicolas, F. A review of insect monitoring approaches with special reference to radar techniques. Sensors 2021, 21, 1474. [Google Scholar] [CrossRef]
Figure 1. Mask RCNN architecture. An unmanned ground vehicle (UGV) was used to detect the distribution and pattern of R. pedestris in the field. To collect image samples of R. pedestris, the UGV performed low-floor photography. Pests can be detected as a result of artificial intelligence learning through convolutional neural networks in apps and computer devices using the collected data.
Agronomy 13 00477 g001
Figure 2. Region of interest (ROI) pooling process. Artificial intelligence identifies many region proposals that were classified as a result of a convolutional neural network. The region proposal goes through a max-pooling process during the refinement stage of object detection. Through ROI pooling, the confidence and region of the bounding box are being accurate, and the network builds features of a fixed size.
Agronomy 13 00477 g002
Figure 3. YOLOv3 architecture. The architecture of the YOLOv3 model using DarkNet53-based convolutional backbone network. The convolutions, skip connections, and 3 prediction heads enable YOLOv3 to process images at a different spatial compression.
Agronomy 13 00477 g003
Figure 4. Detectron2 architecture. Detectron2 consists of a Feature Pyramid Network (FPN), Region Proposal Network, RoI Heads, and RoI pooler. Extracts feature maps from input image at different scales and detect object regions from the multi-scale features.
Agronomy 13 00477 g004
Figure 5. Loss graph for iterations in object detection. The loss score corresponds to the error rate of the neural network. If the loss score decreases as the iteration increases in the training process of the deep learning model, it means that the object detection performance of the model is improved. The slope of the loss score for iteration on the x-axis is defined as a line smooth value.
Agronomy 13 00477 g005
Figure 6. Prediction of object detection. In prediction, which is the result of neural network learning using the original image, the class of R. pedestris can be detected through classification and localization and the positions of objects are displayed as in the picture on the right.
Agronomy 13 00477 g006
Figure 7. Detection feature map under each condition. As a result of detection, a mask and bounding box are applied to the objects one wants to be detected. When several objects are detected in one sample image, they are distinguished by different colors. (a) R. pedestris object detection feature map derived using samples from pod filling stages (R1 to R6) of soybean growth; (b) feature map using samples from maturity stages (R7 to R9); (c) the results from an artificial cage in the laboratory.
Agronomy 13 00477 g007
Figure 8. Confidence score and C/I, mAP index for each condition. The confidence score is an indicator of the accuracy and reliability of objects and classes detected by the deep learning model. C/I is an index indicating the ratio of objects detected by artificial intelligence to objects shown in the test set data. mAP values (means of average precision) calculated from the model.
Agronomy 13 00477 g008
Figure 9. mAP (means of average precision) score for model benchmarking. The performance of the convolutional neural network (CNN) model is mainly evaluated using mAP. The area under the graph line is called AP (average precision) in the precision-recall graph. The higher the AP, the better the overall performance of the algorithm. The average of the AP values of all classes inherent in the algorithm is called the mAP. This experiment calculated mAP through model benchmarking studies of MRCNN, YOLOv3, and Detectron2 using Field (R1~R6) data.
Agronomy 13 00477 g009
Figure 10. R. pedestris detection in web application tools. (a) The web app’s main screen; (b) the result screen that appears after detection is completed; (c) the number of detected boxes in each photo is marked and sent to the provided portable device as a CSV file.
Agronomy 13 00477 g010
Figure 11. Detection outputs using the application with R. pedestris on the web. (a) Original image before submission to the web app; (b) after submission to the web app, it is detected with YOLOv3; (c) the best IOU score detected among the bounding boxes.
Agronomy 13 00477 g011
Figure 12. (a) A curve showing the decrease in runtime according to the number of images. (b) A graph indicating the C/I value of objects according to several input images of 25, 50, and 100, and the confidence score.
Agronomy 13 00477 g012
Table 1. Classification performance of each condition.
ConditionsTraining Set SizeConfidence ScoreC/I 1mAP
Field (R1~R6)5000.998 (0.114/0.0023) *0.994 (0.187/0.0038)0.952
Field (R7~)5000.958 (0.362/0.0074)0.794 (0.262/0.0053)0.716
Laboratory5000.971 (0.121/0.0025)0.842 (0.238/0.0049)0.873
1 C/I: Classified objects/Identified object ratio. * Values for [standard deviation (SD)/standard error (SE)].
Table 2. C/I with a confidence score and run times for iteration.
ImagesDetect Time (Sec/Replication)C/IConfidence score
2579.0 (0.0111/2.3 × 10−4) *10095.75 (0.0185/3.8 × 10−4)
5067.4 (0.0440/9.0 × 10−4)10095.98 (0.0436/8.9 × 10−4)
10069.2 (0.0364/7.4 × 10−4)10095.82 (0.0838/1.7 × 10−3)
* Values for [standard deviation (SD)/standard error(SE)].
Disclaimer/Publisher’s Note: The statements, opinions and data contained in all publications are solely those of the individual author(s) and contributor(s) and not of MDPI and/or the editor(s). MDPI and/or the editor(s) disclaim responsibility for any injury to people or property resulting from any ideas, methods, instructions or products referred to in the content.

