
Assessment of Heavy Metal Pollution of Agricultural Soil, Irrigation Water, and Vegetables in and Nearby the Cupriferous City of Lubumbashi, (Democratic Republic of the Congo)
 , ,
, ,
Abstract
:1. Introduction
2. Materials and Methods
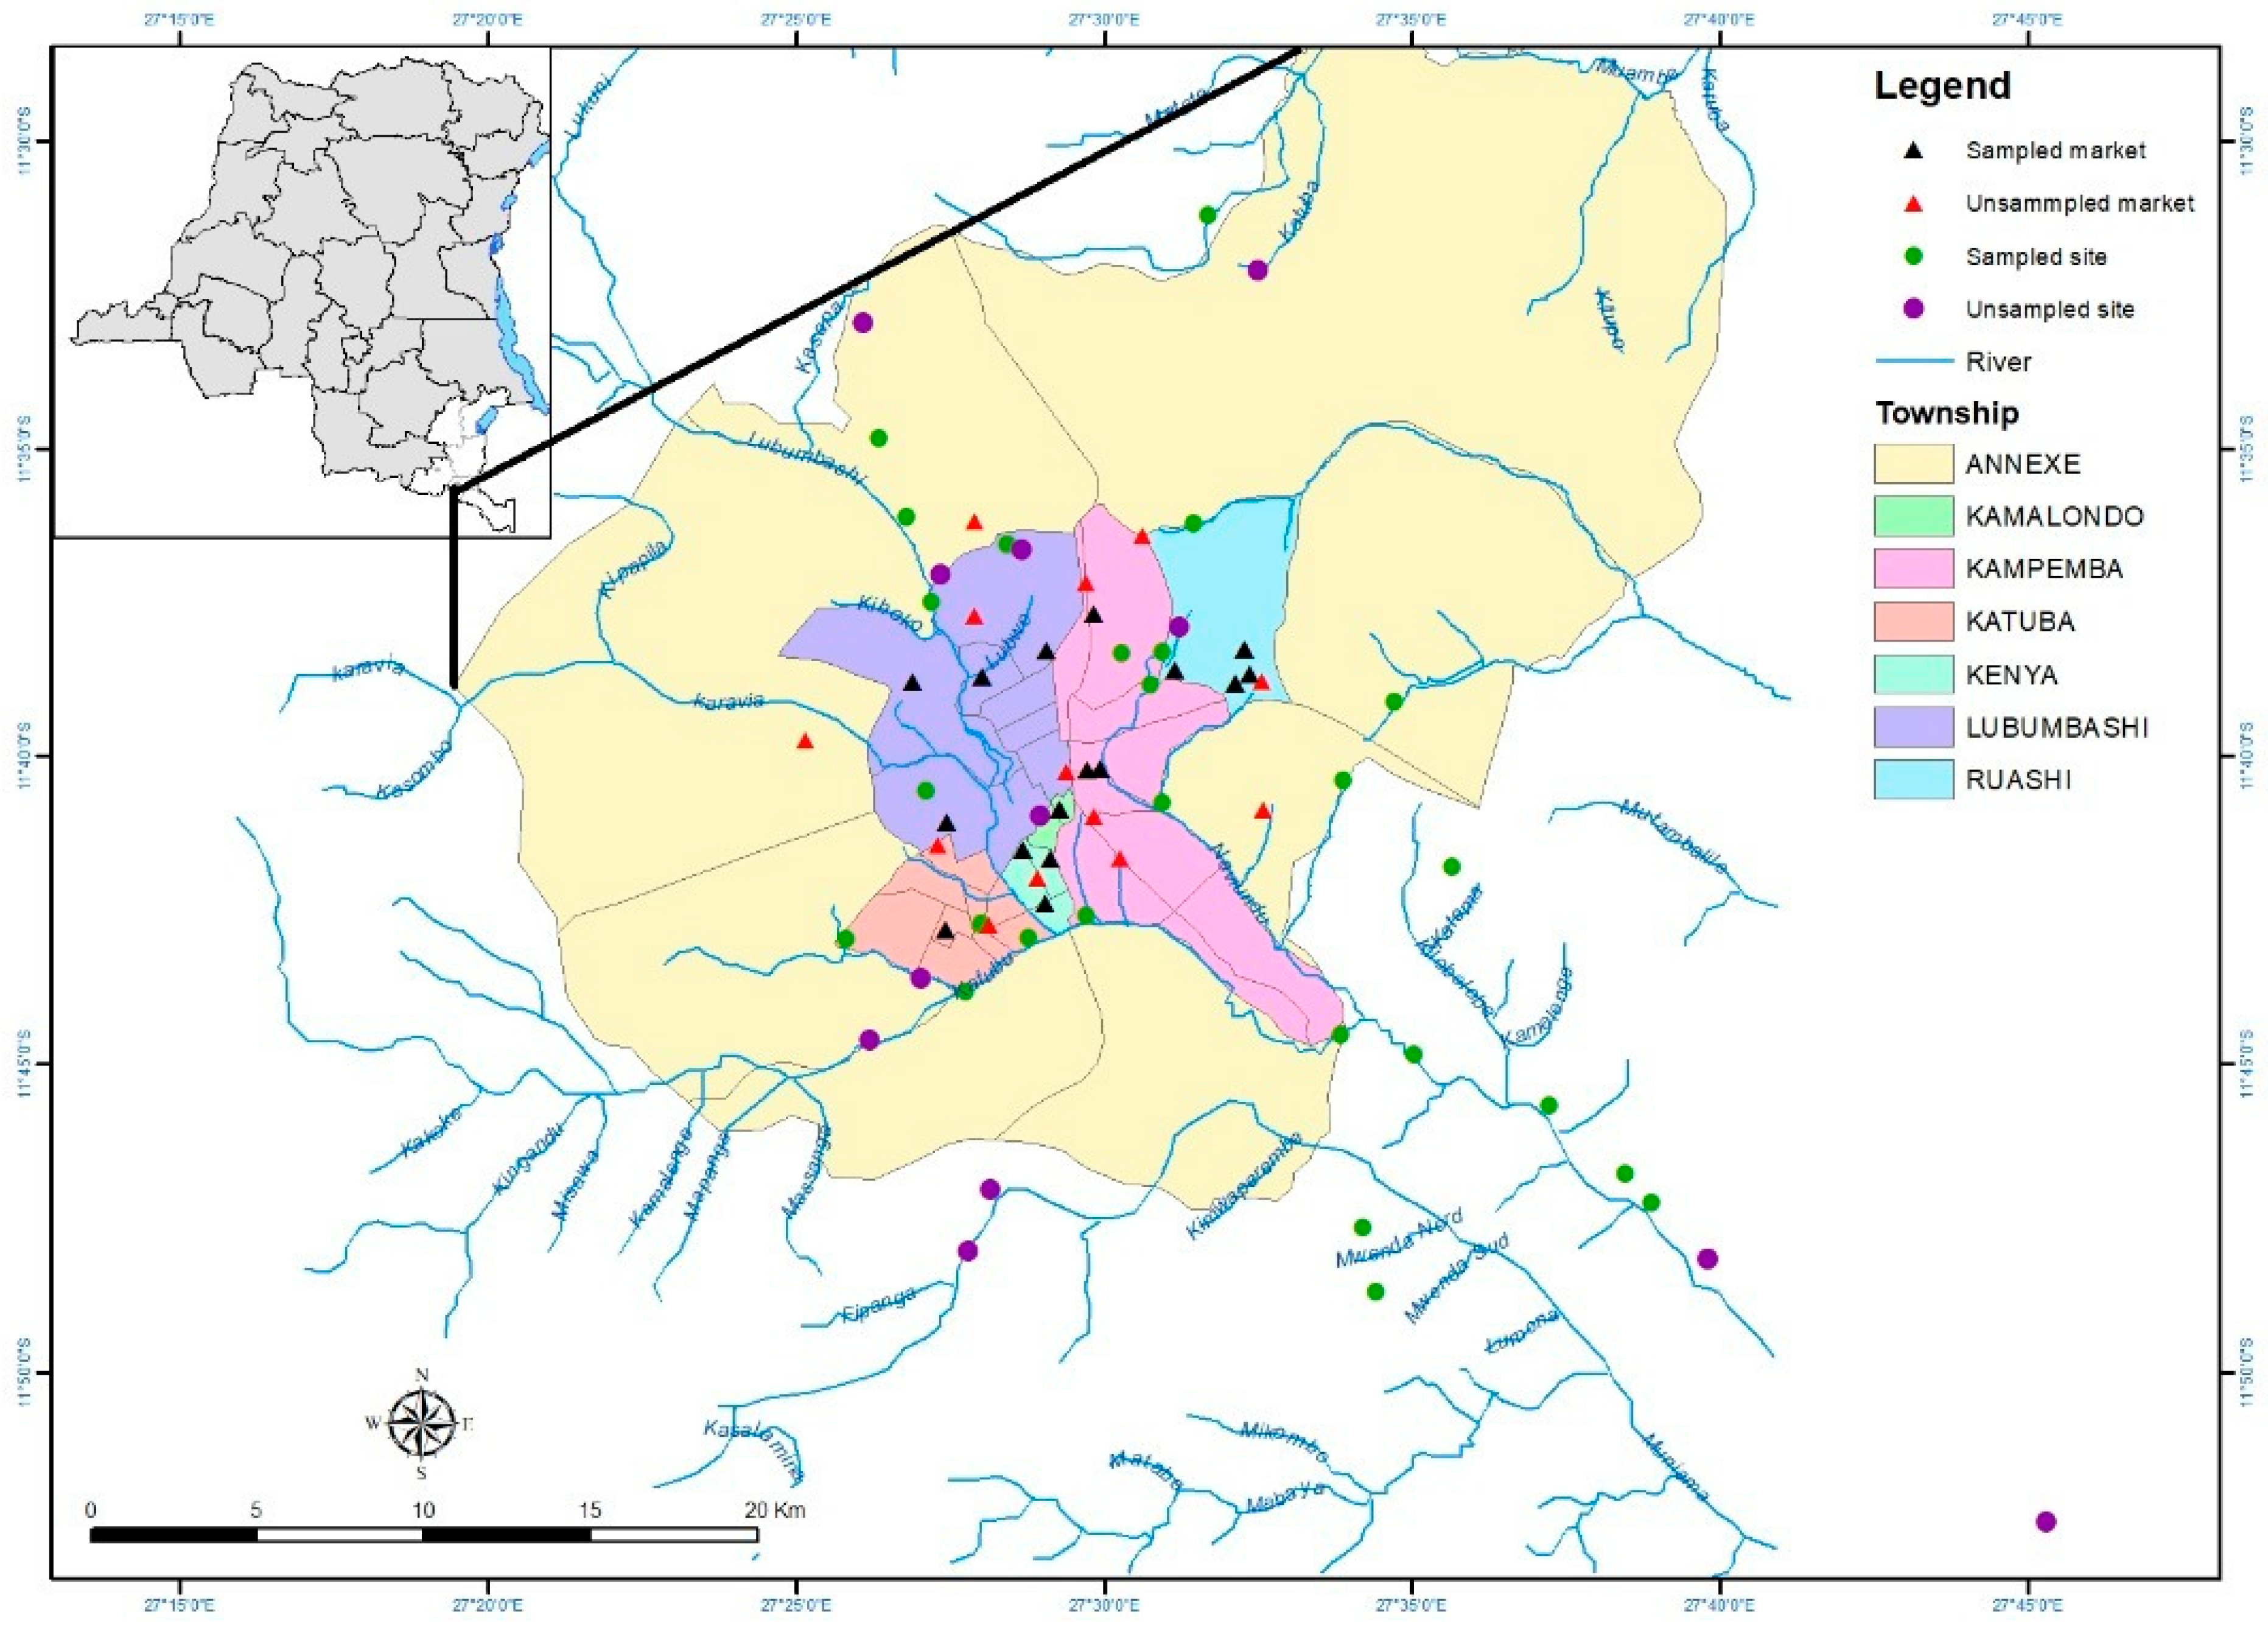
2.1. Identification of the Market Gardens and Urban Markets of Lubumbashi
2.2. Sampling Methods
2.2.1. Soils
2.2.2. Water Samples
2.2.3. Vegetables
2.3. Indices of Agricultural Soil Contamination and Pollution
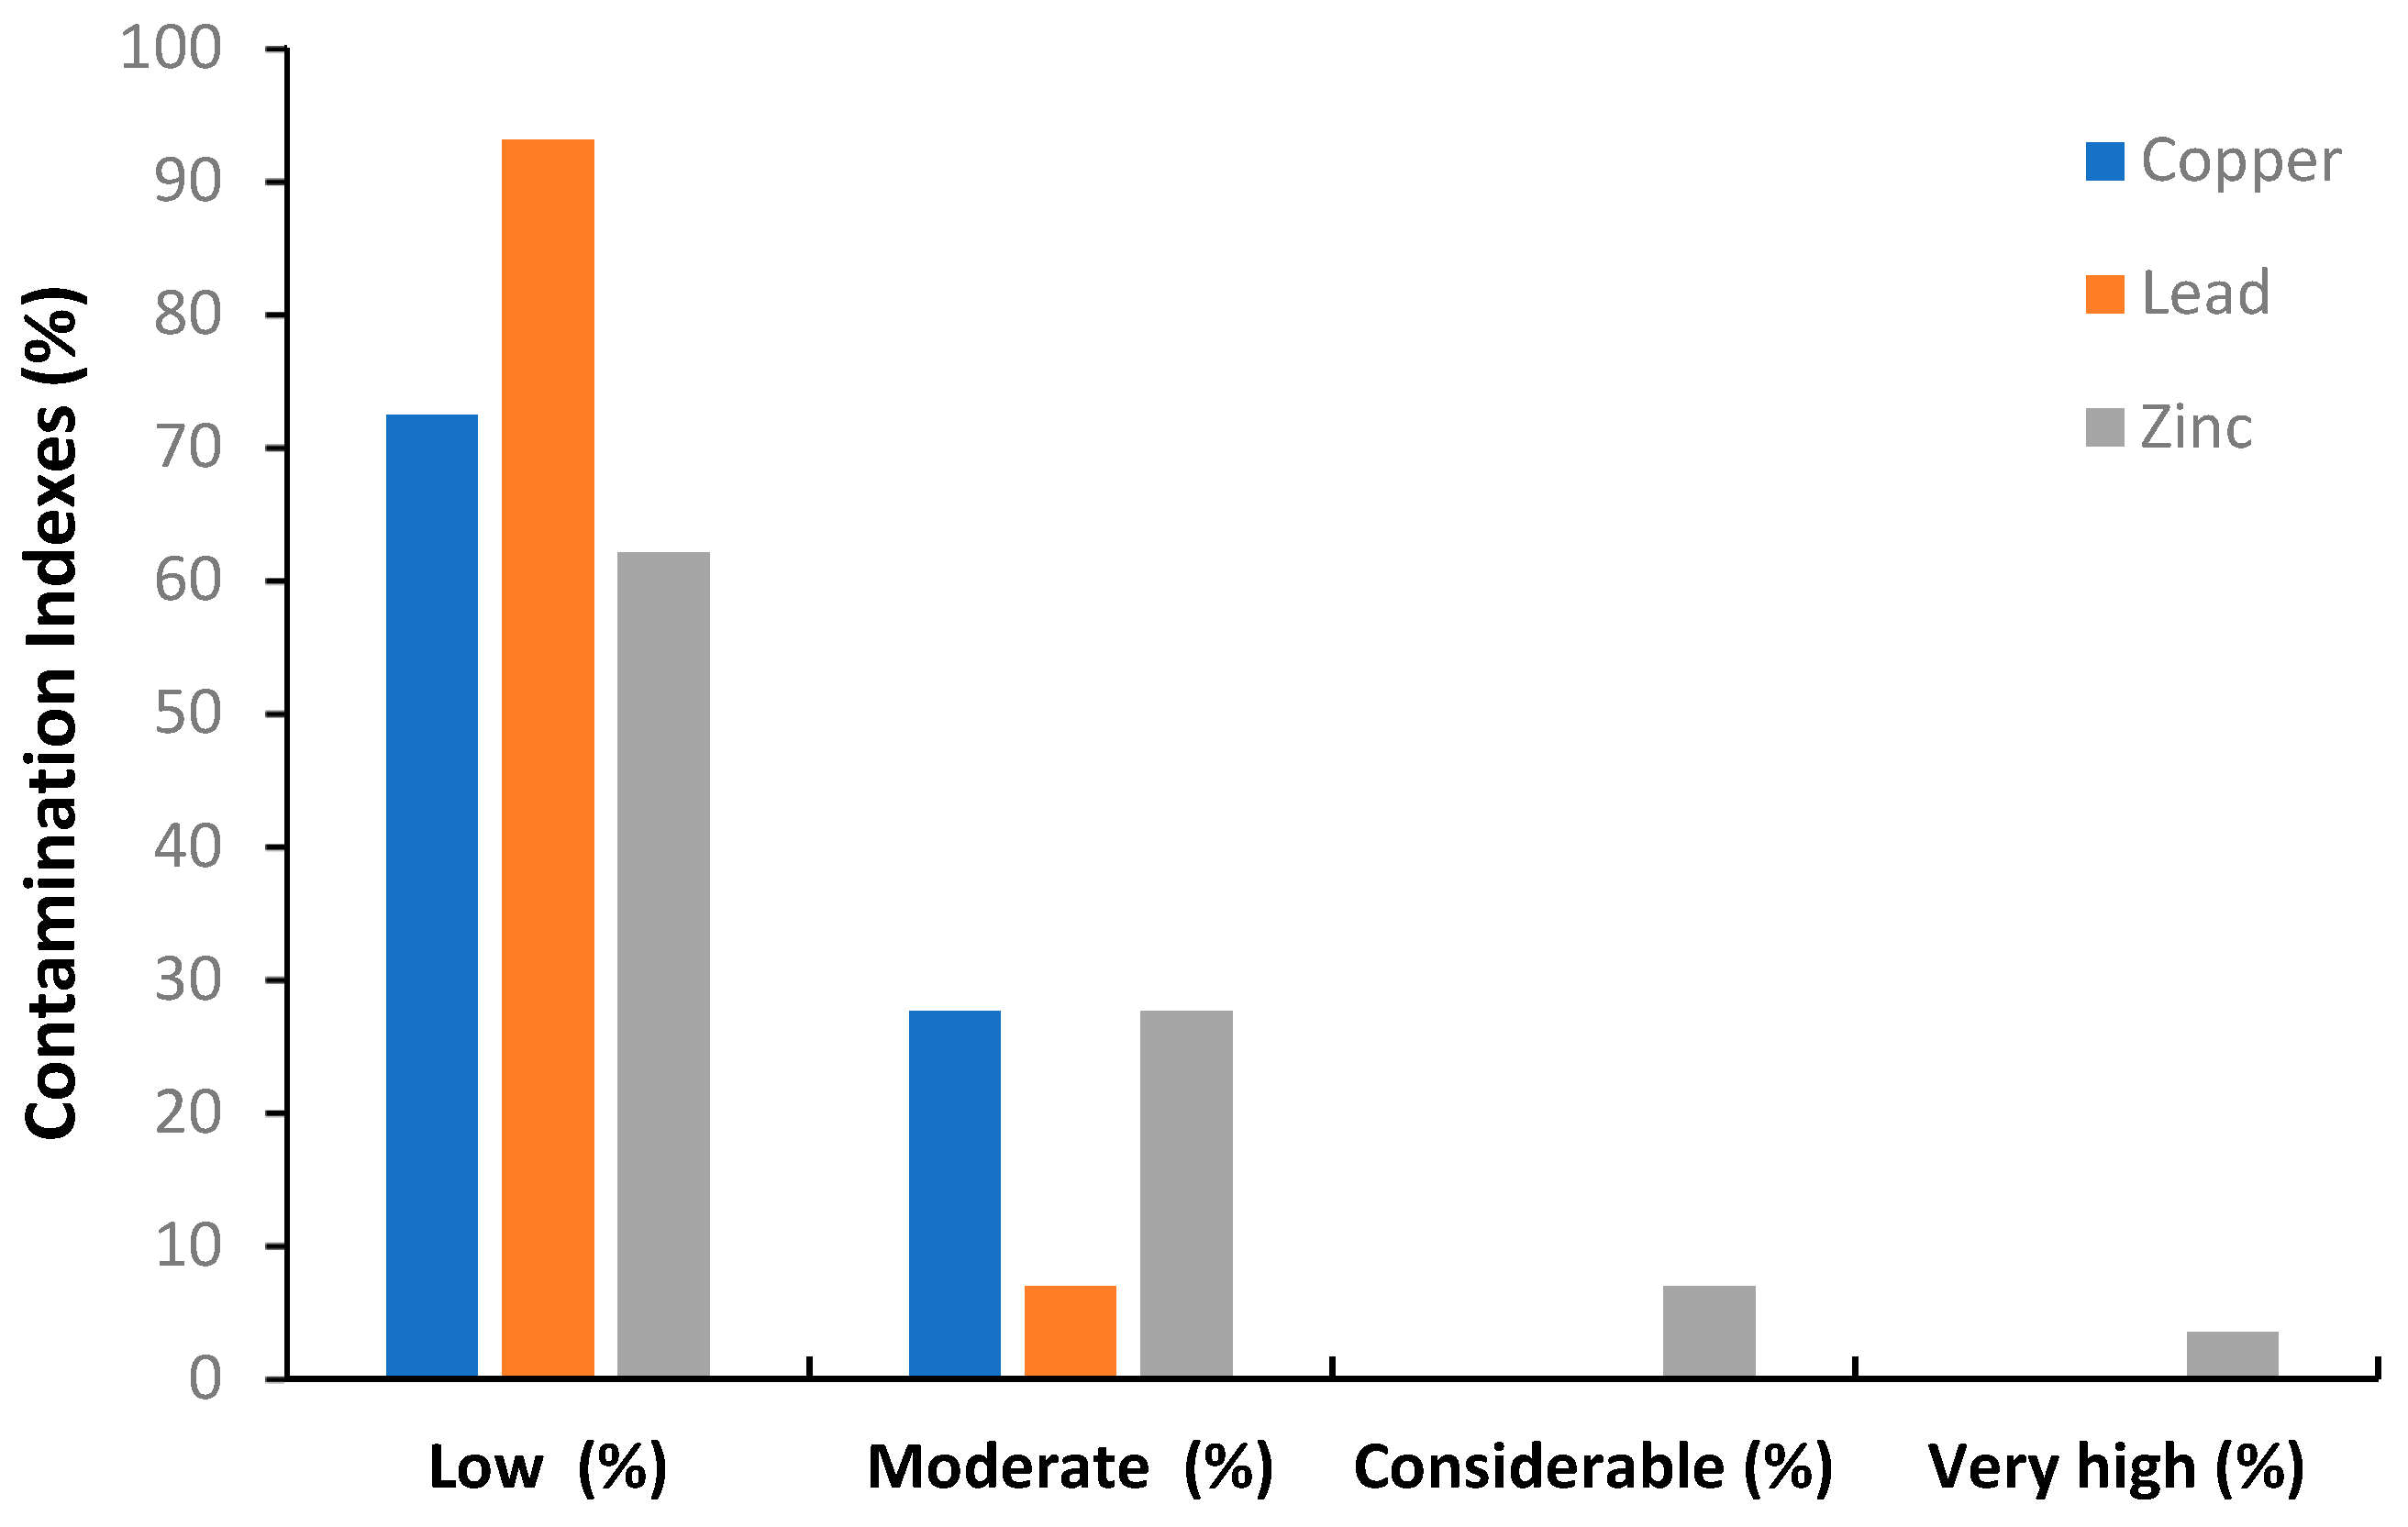
2.3.1. Contamination Factor
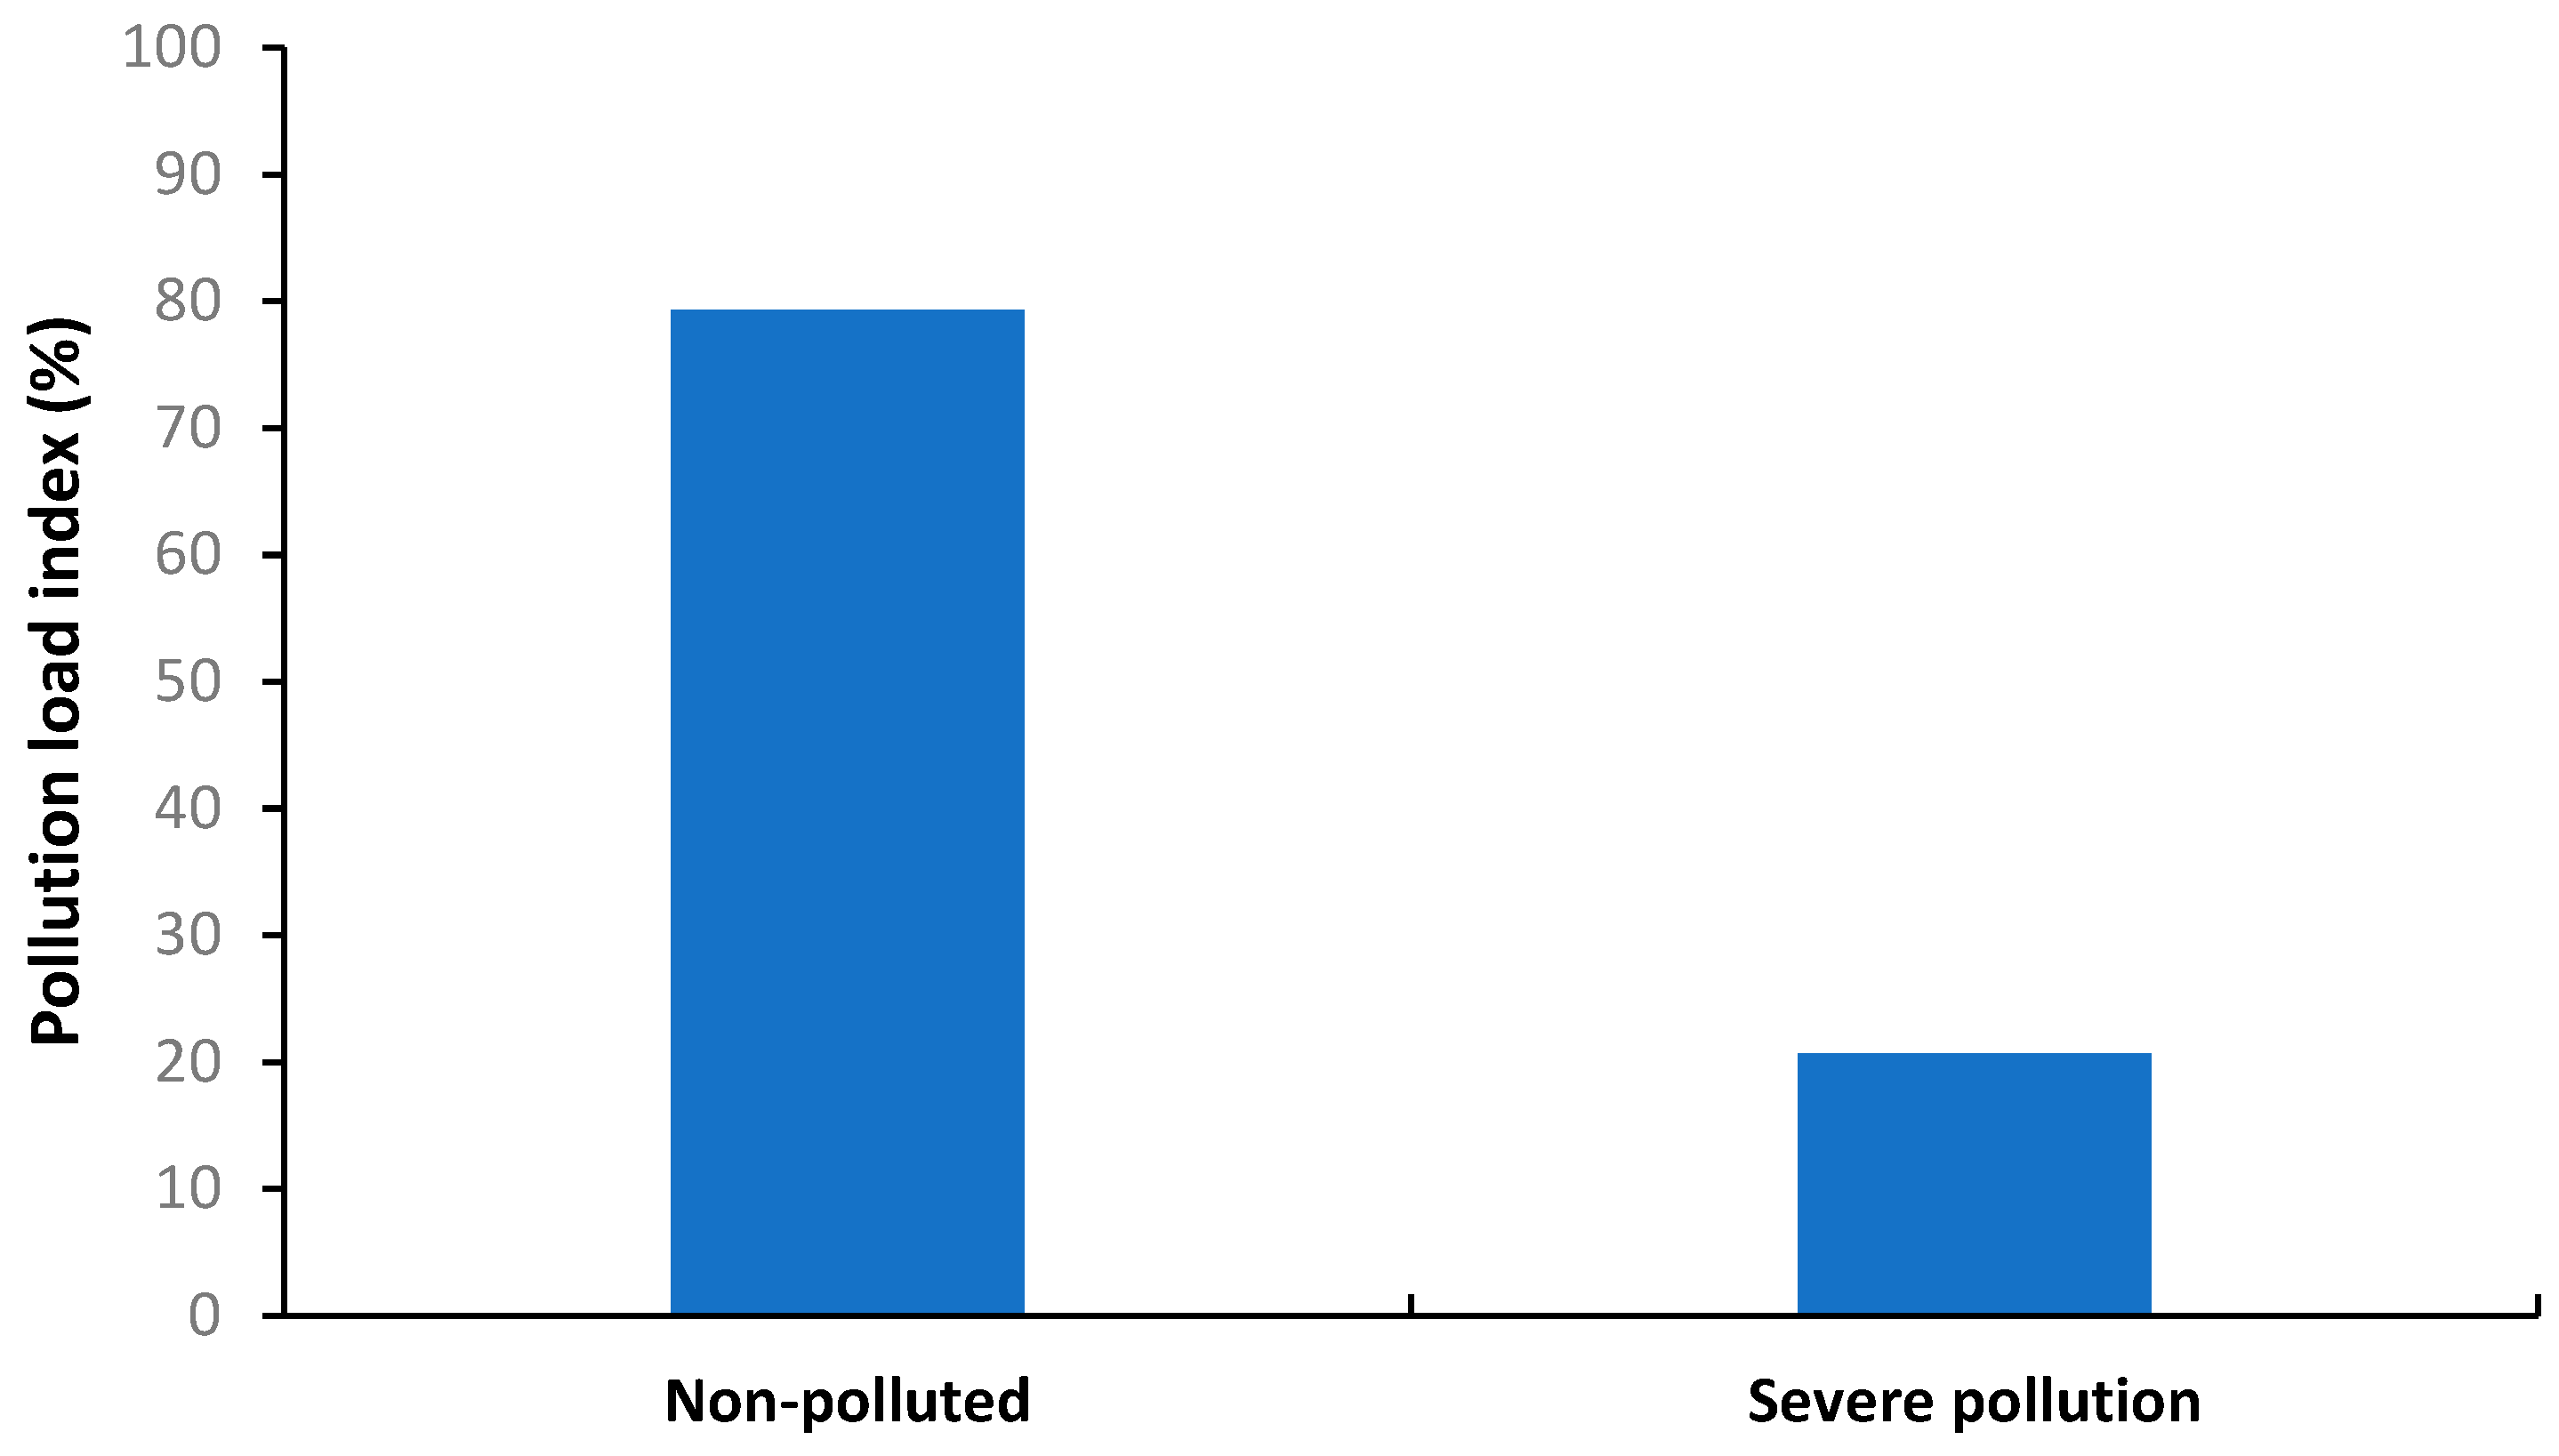
2.3.2. Soil Pollution Load Index
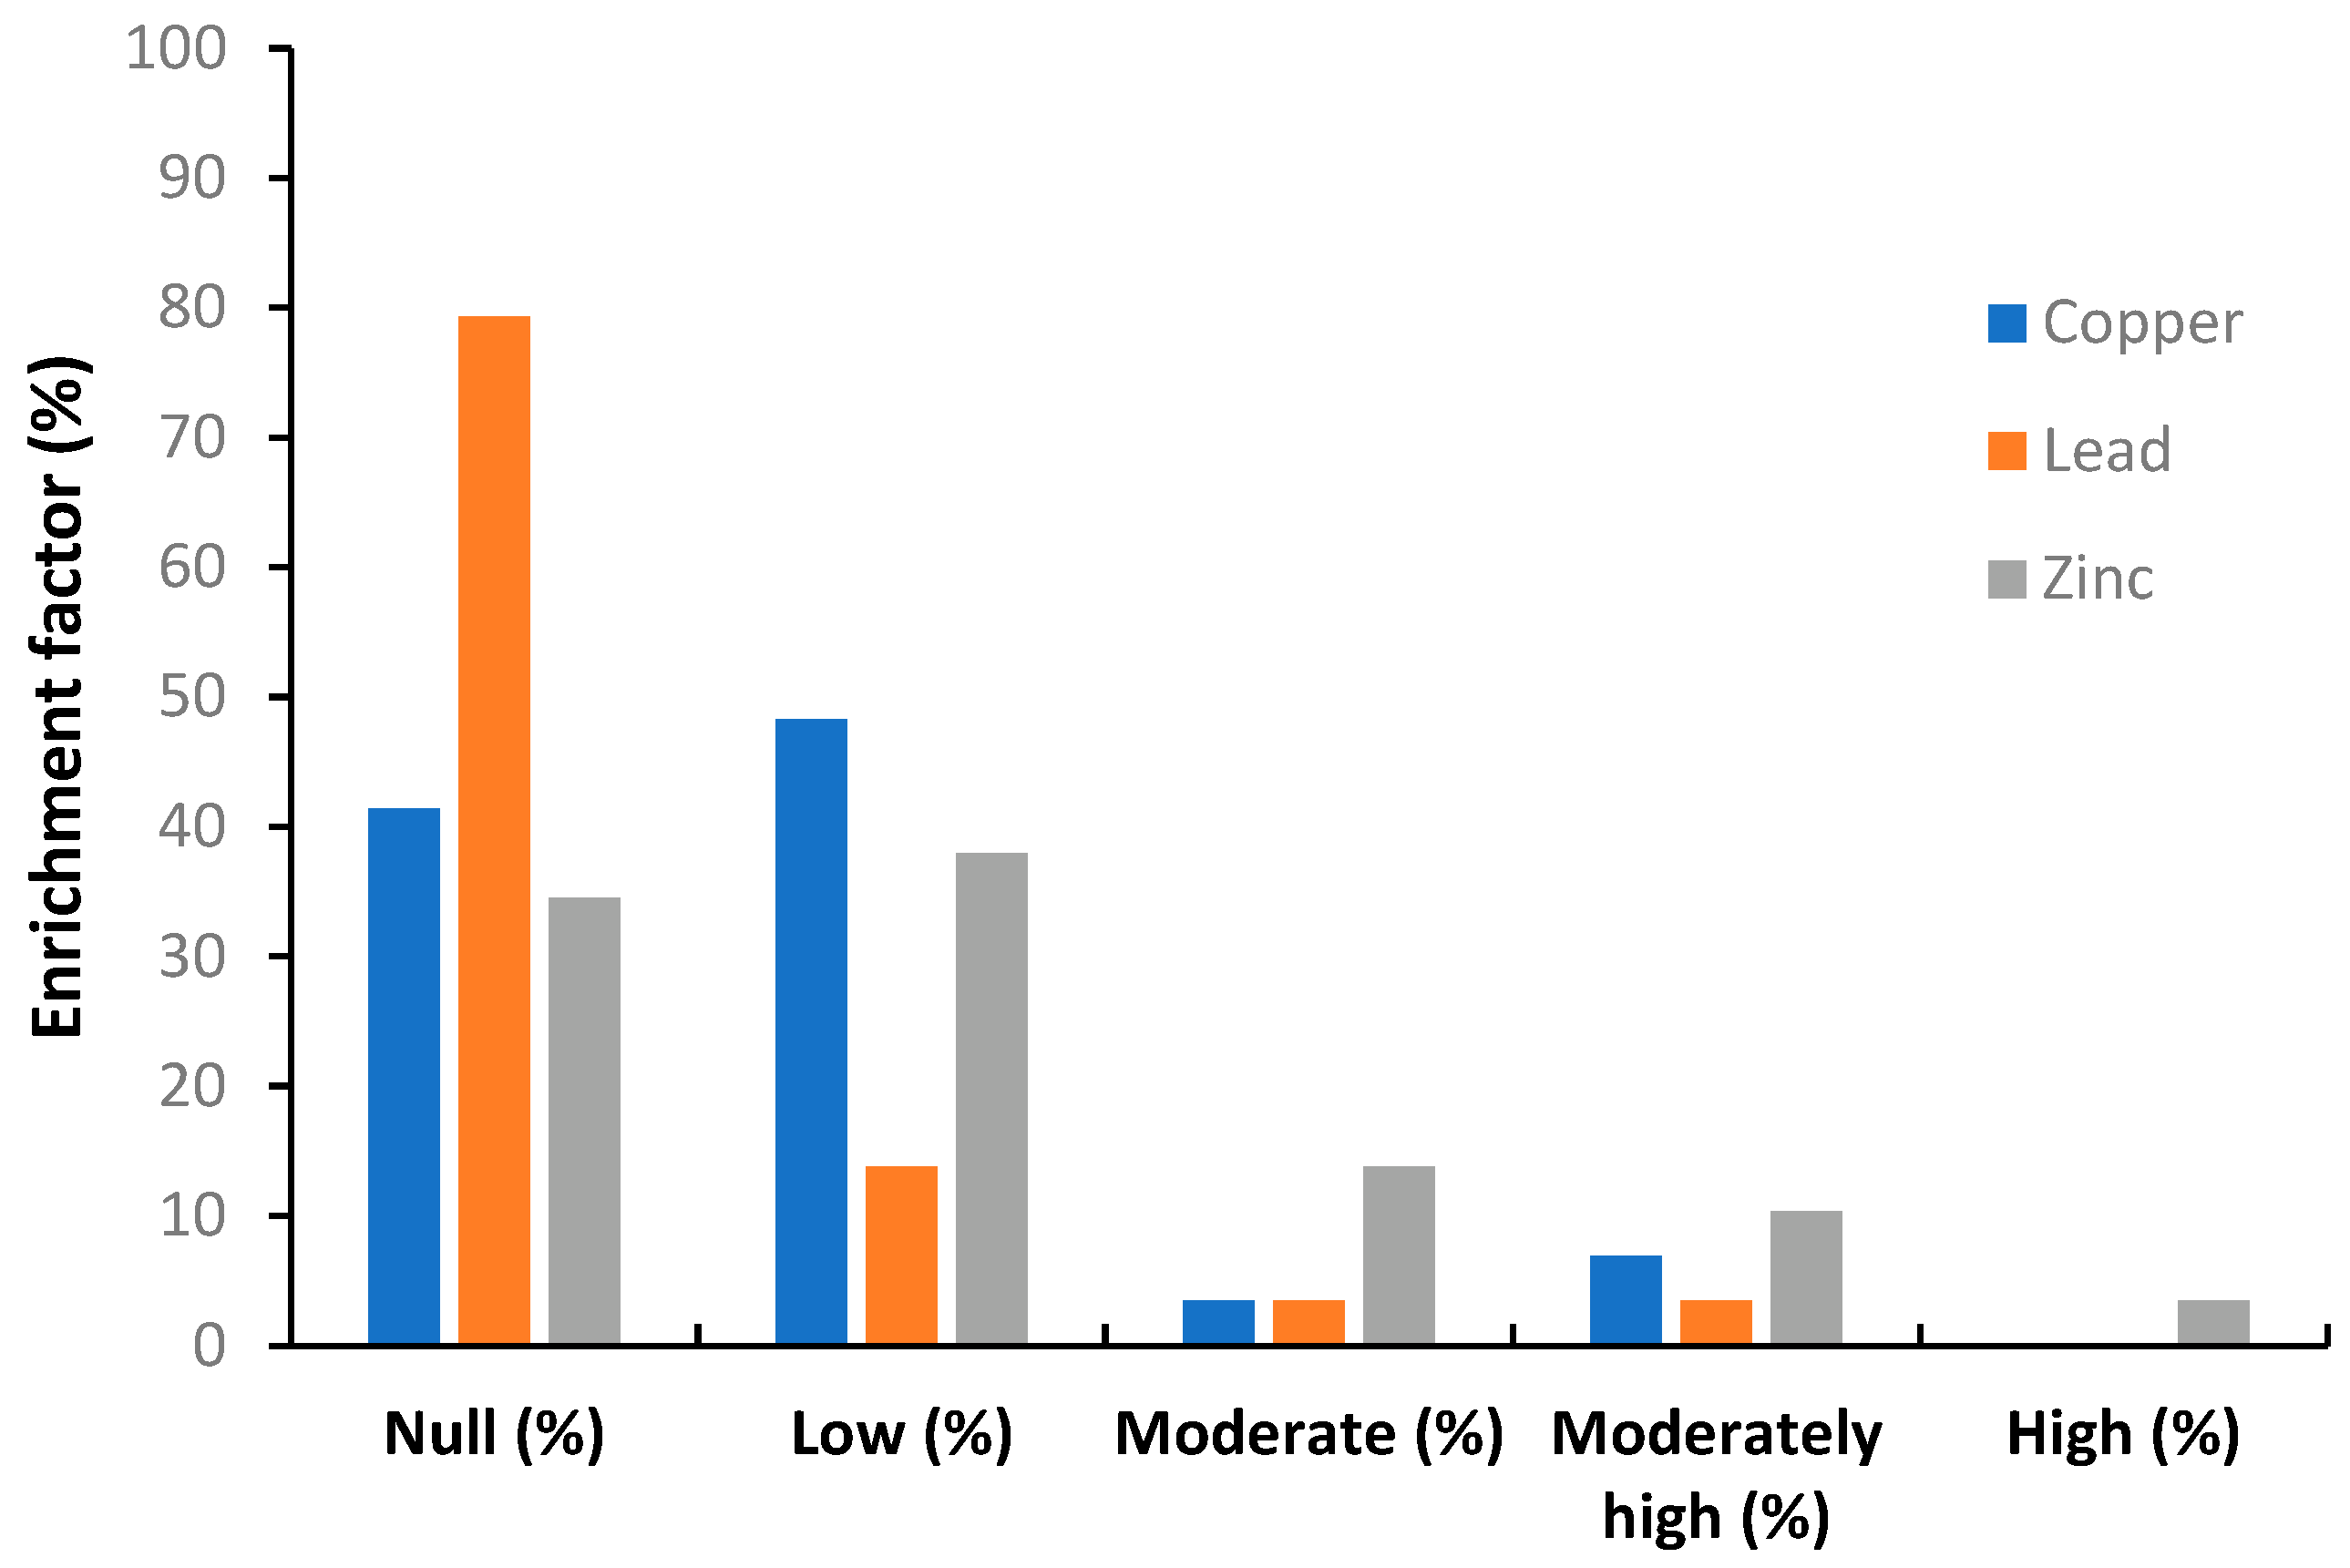
2.3.3. Enrichment Factor
2.4. Habit Description
2.5. Data Analyses
3. Results
3.1. Identification of the Market Gardens and Urban Markets of Lubumbashi
3.2. Characterisation of MTE-like Pollutants in Market Garden Soils, Waters and Vegetables
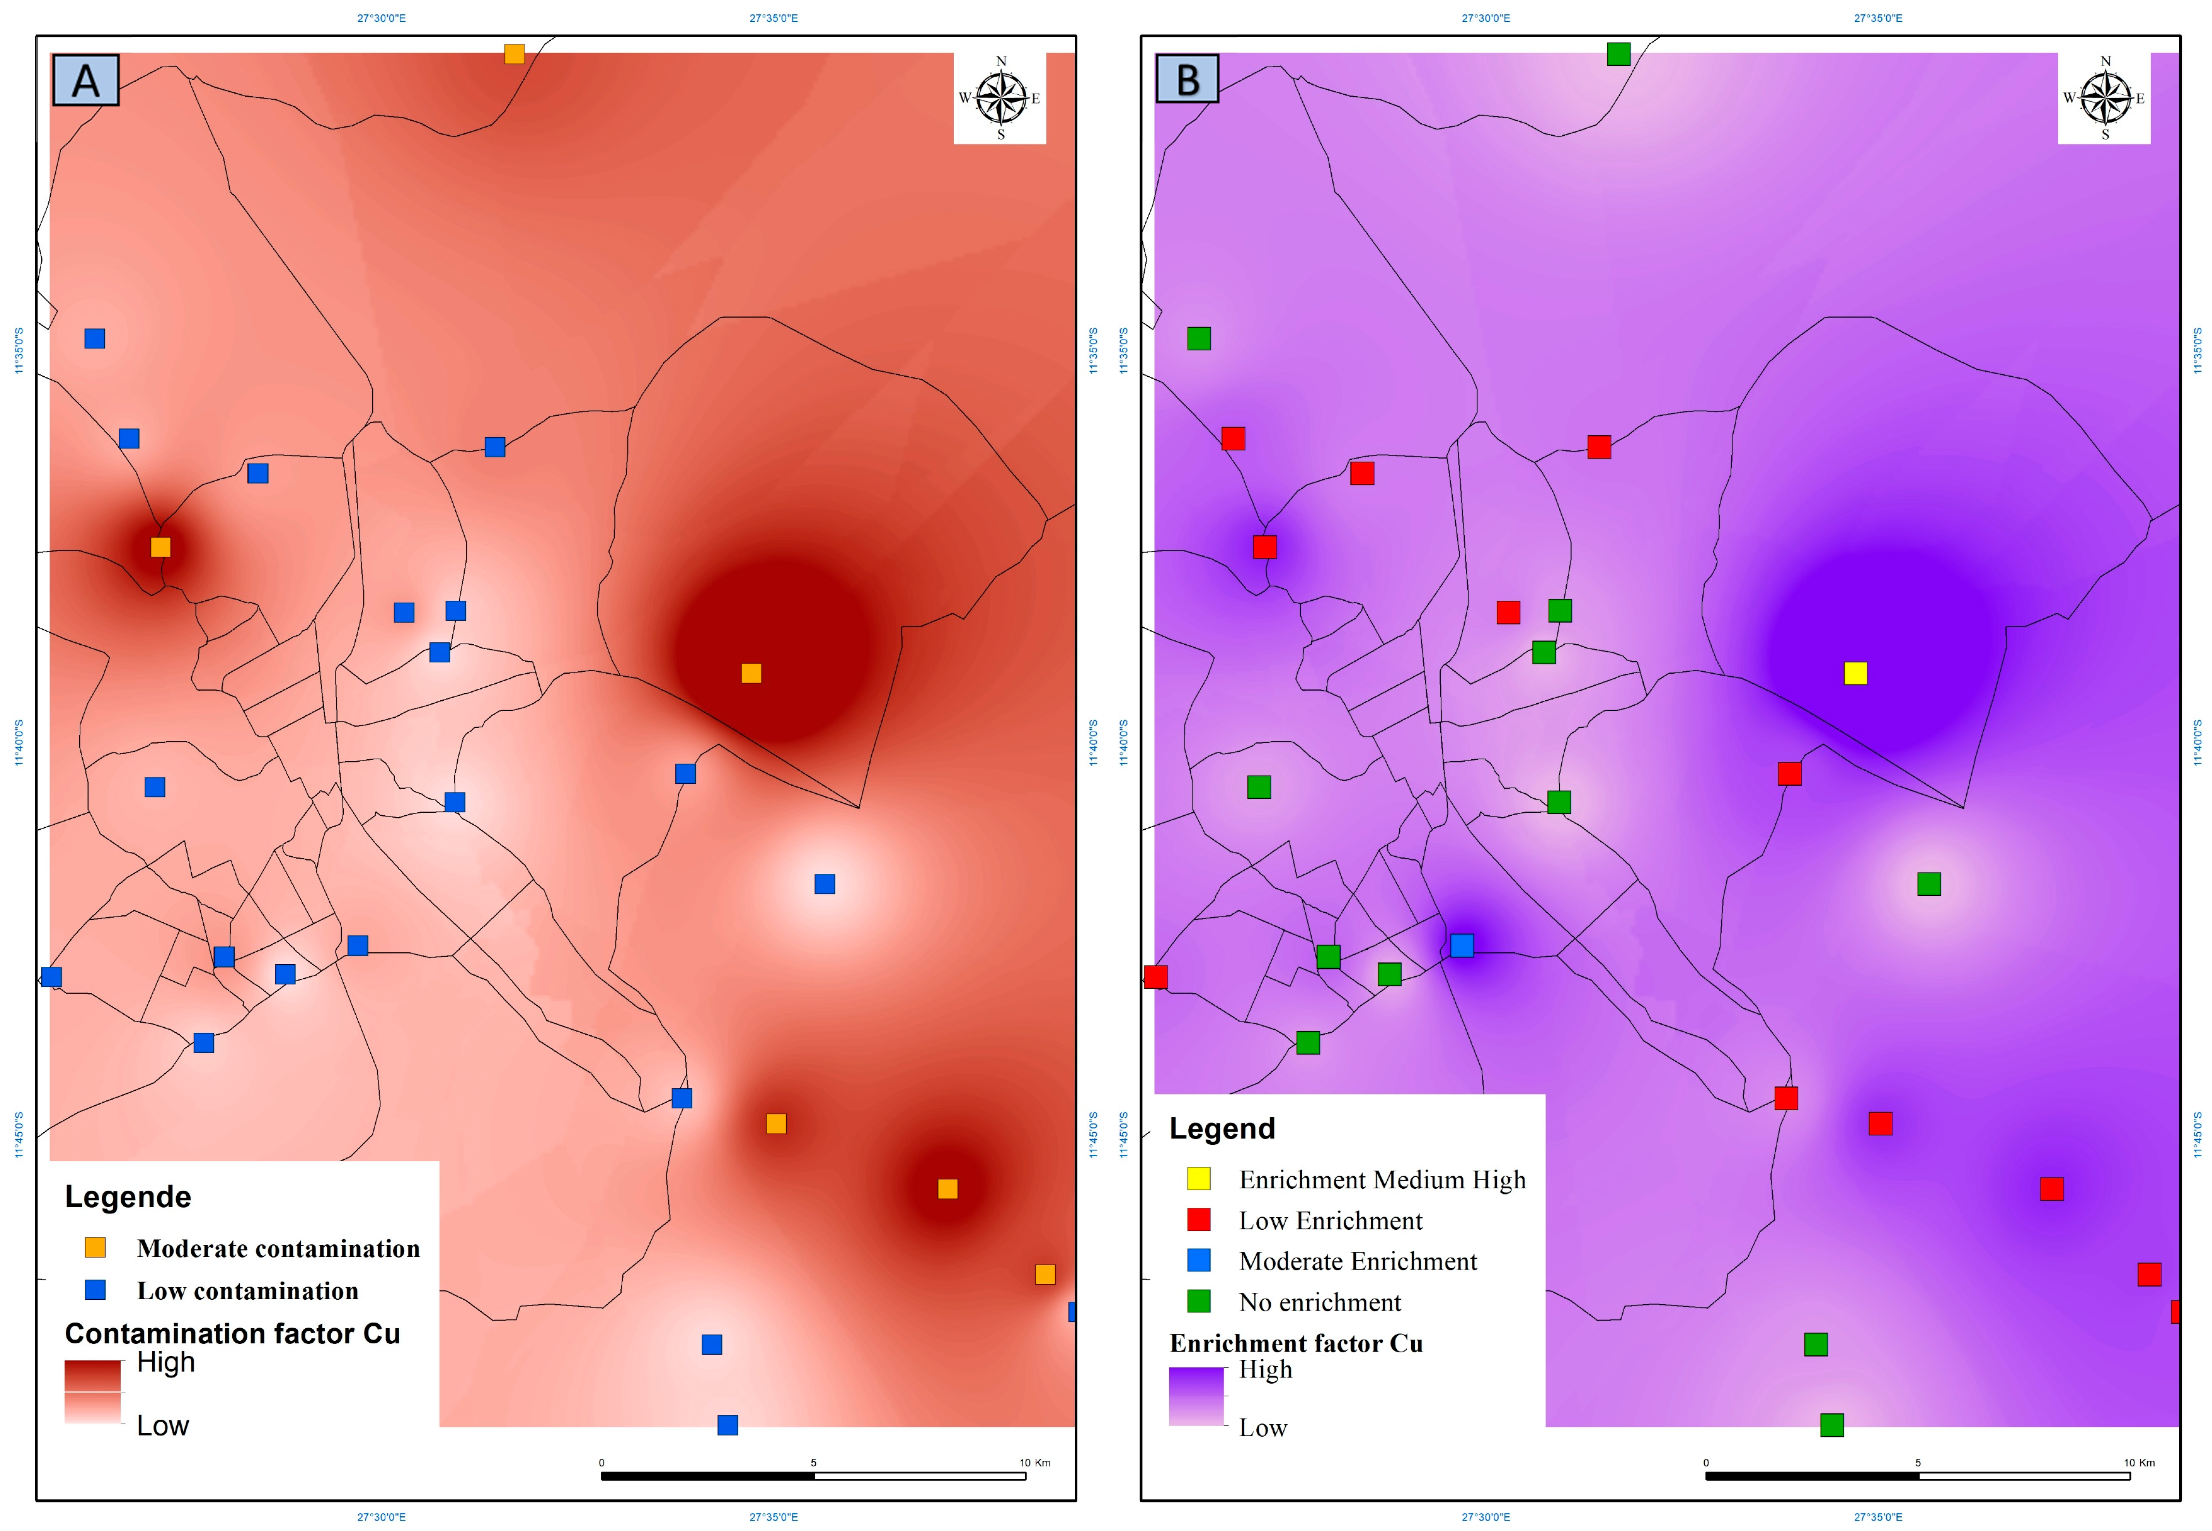
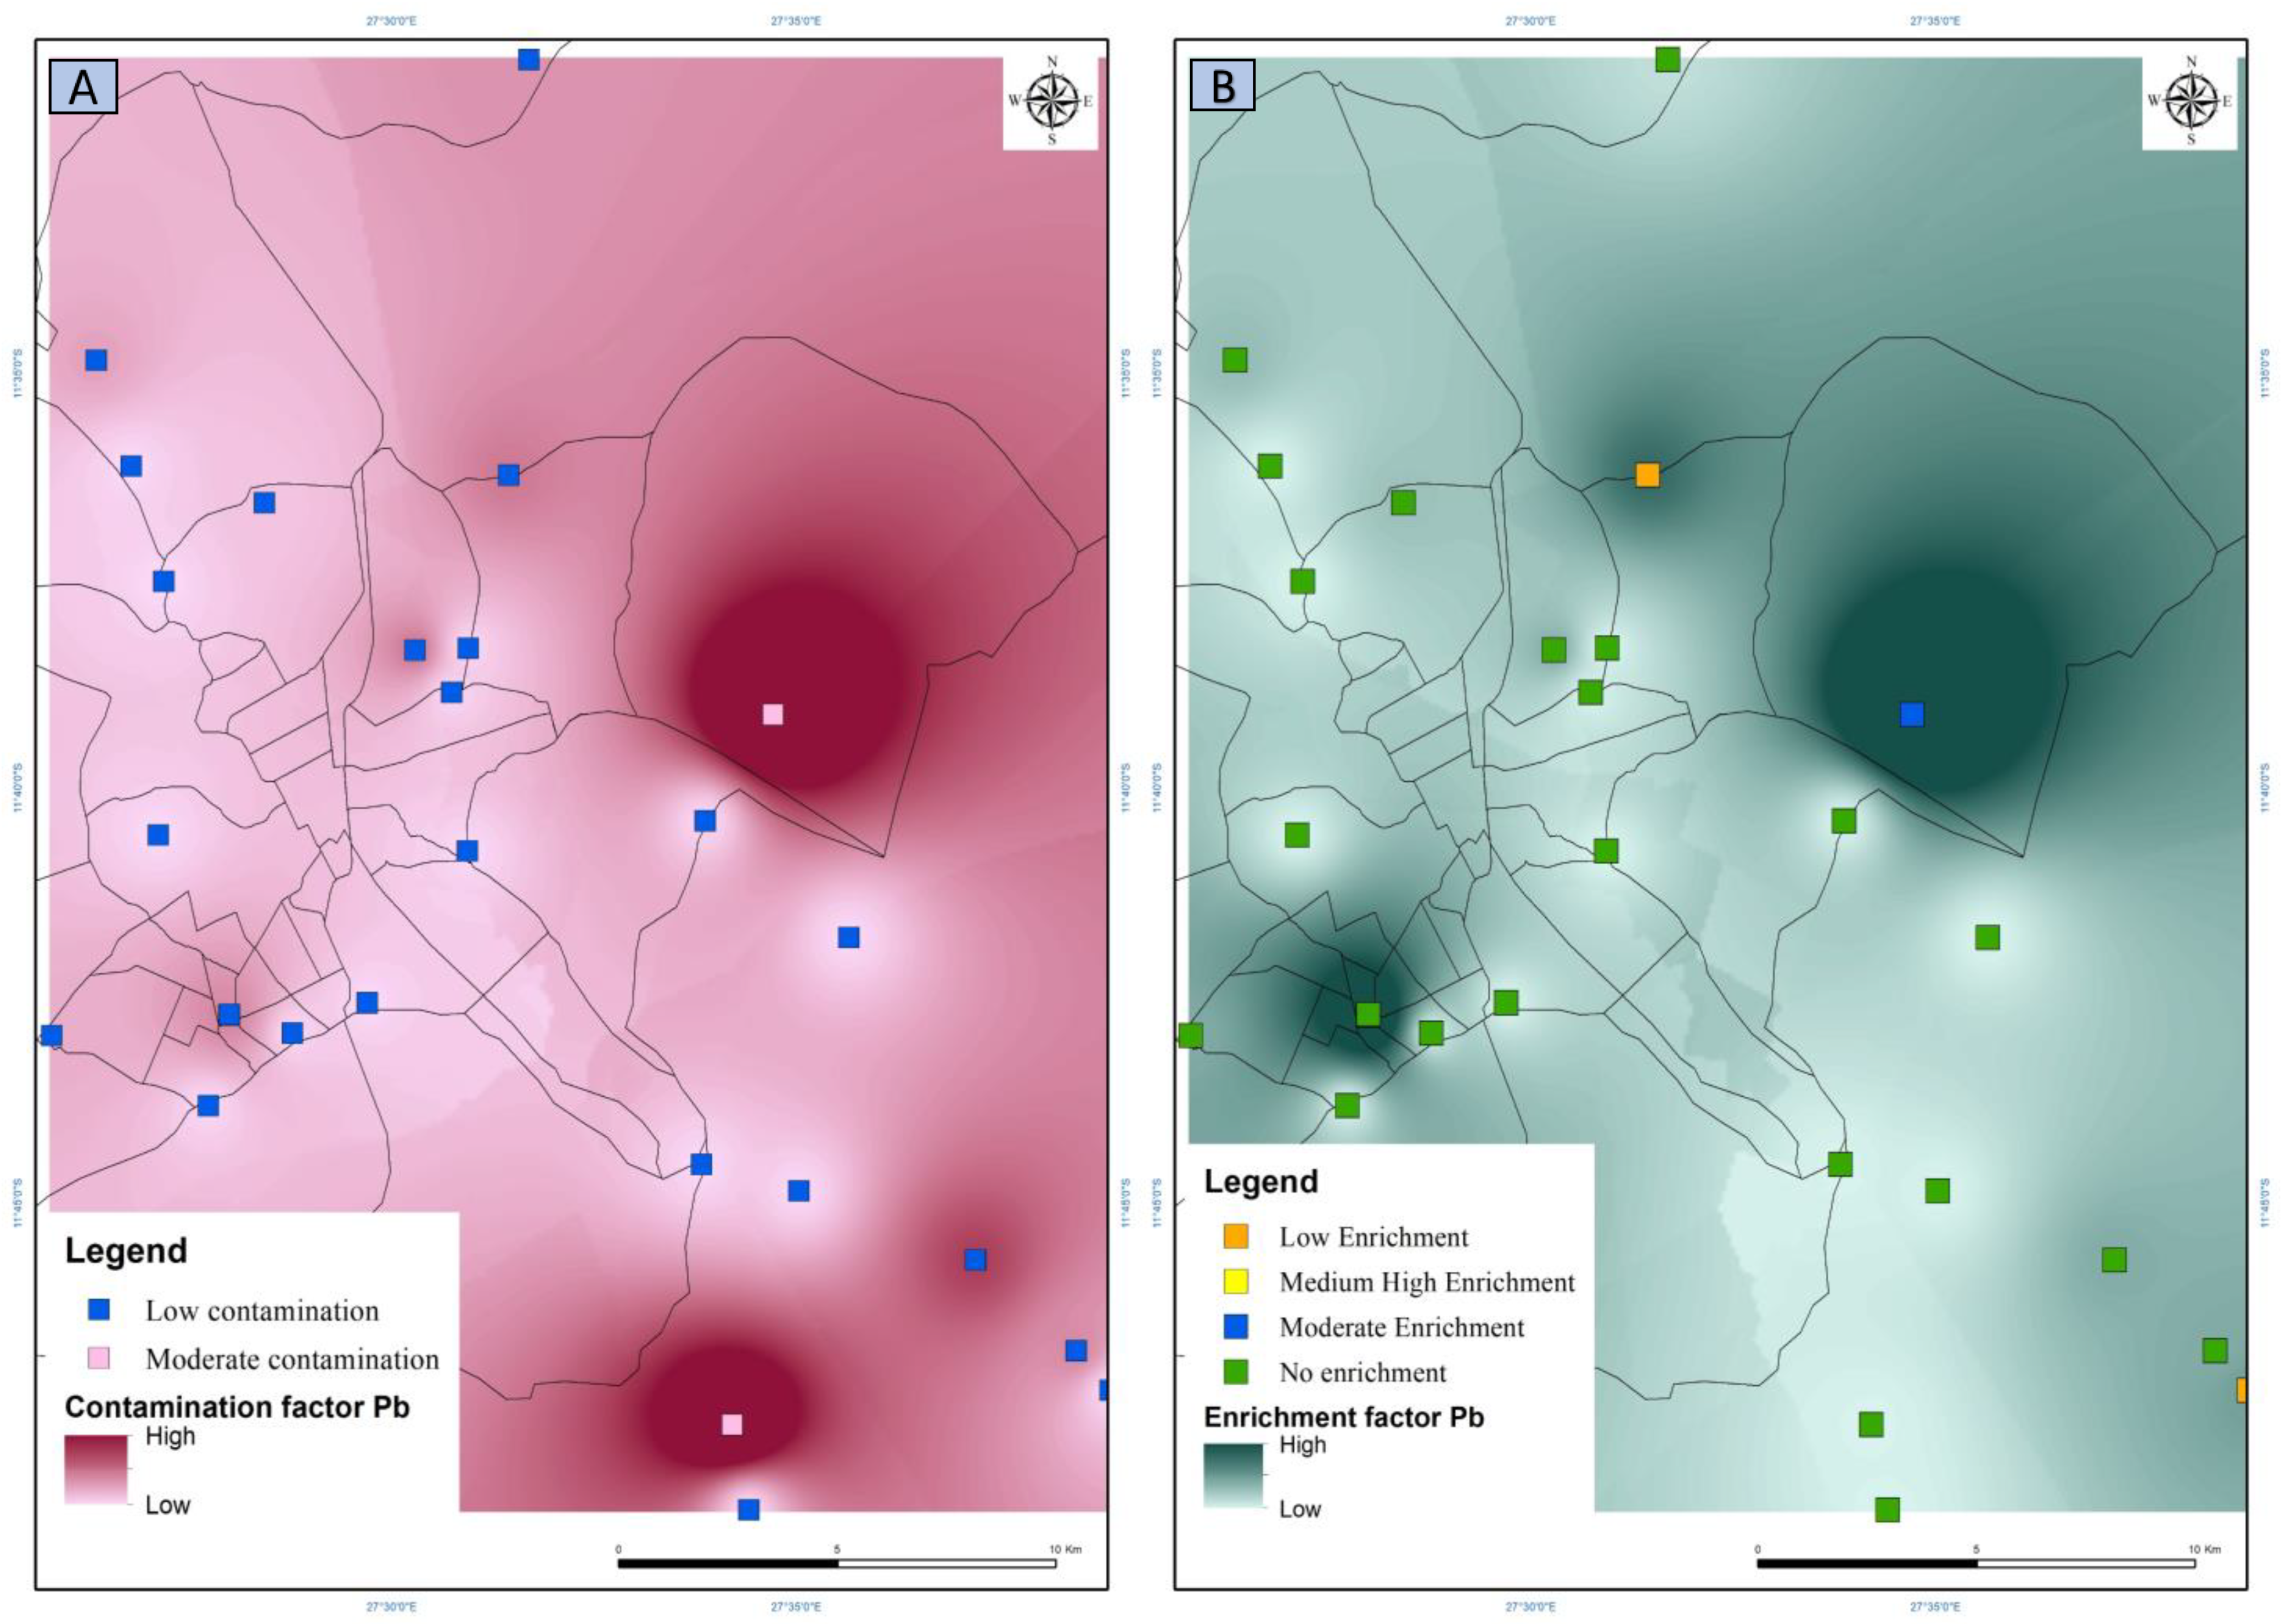
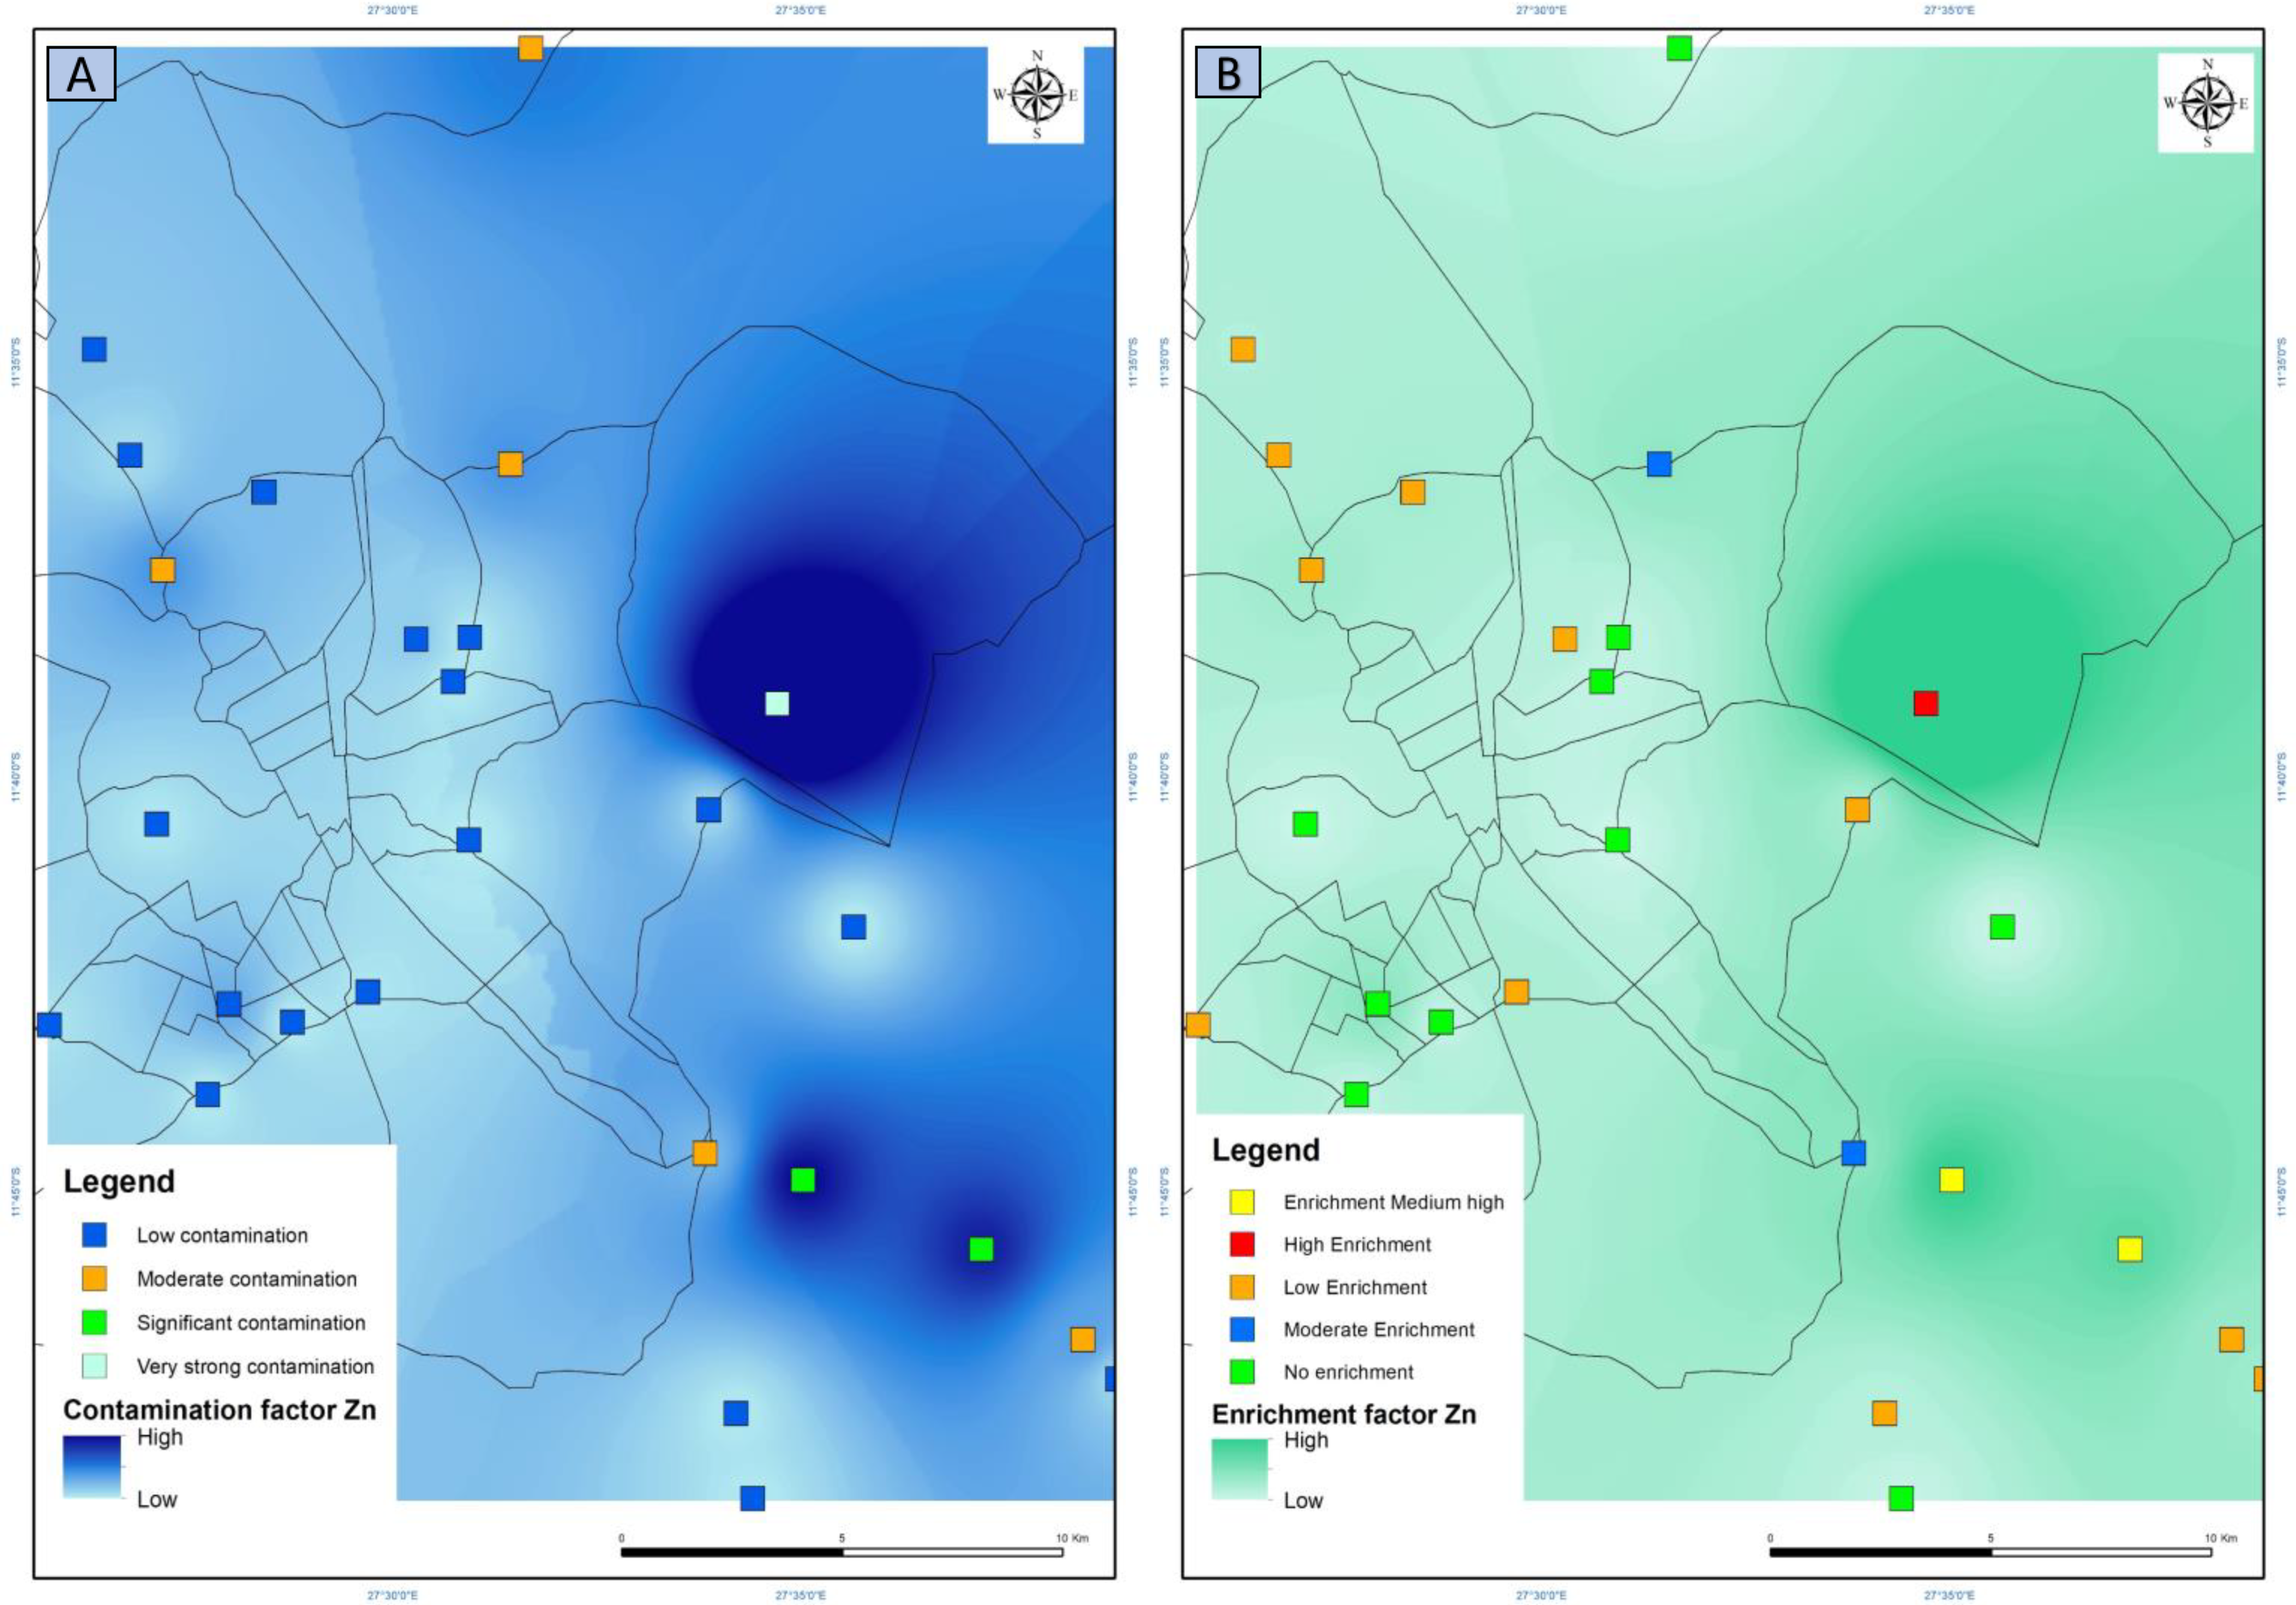
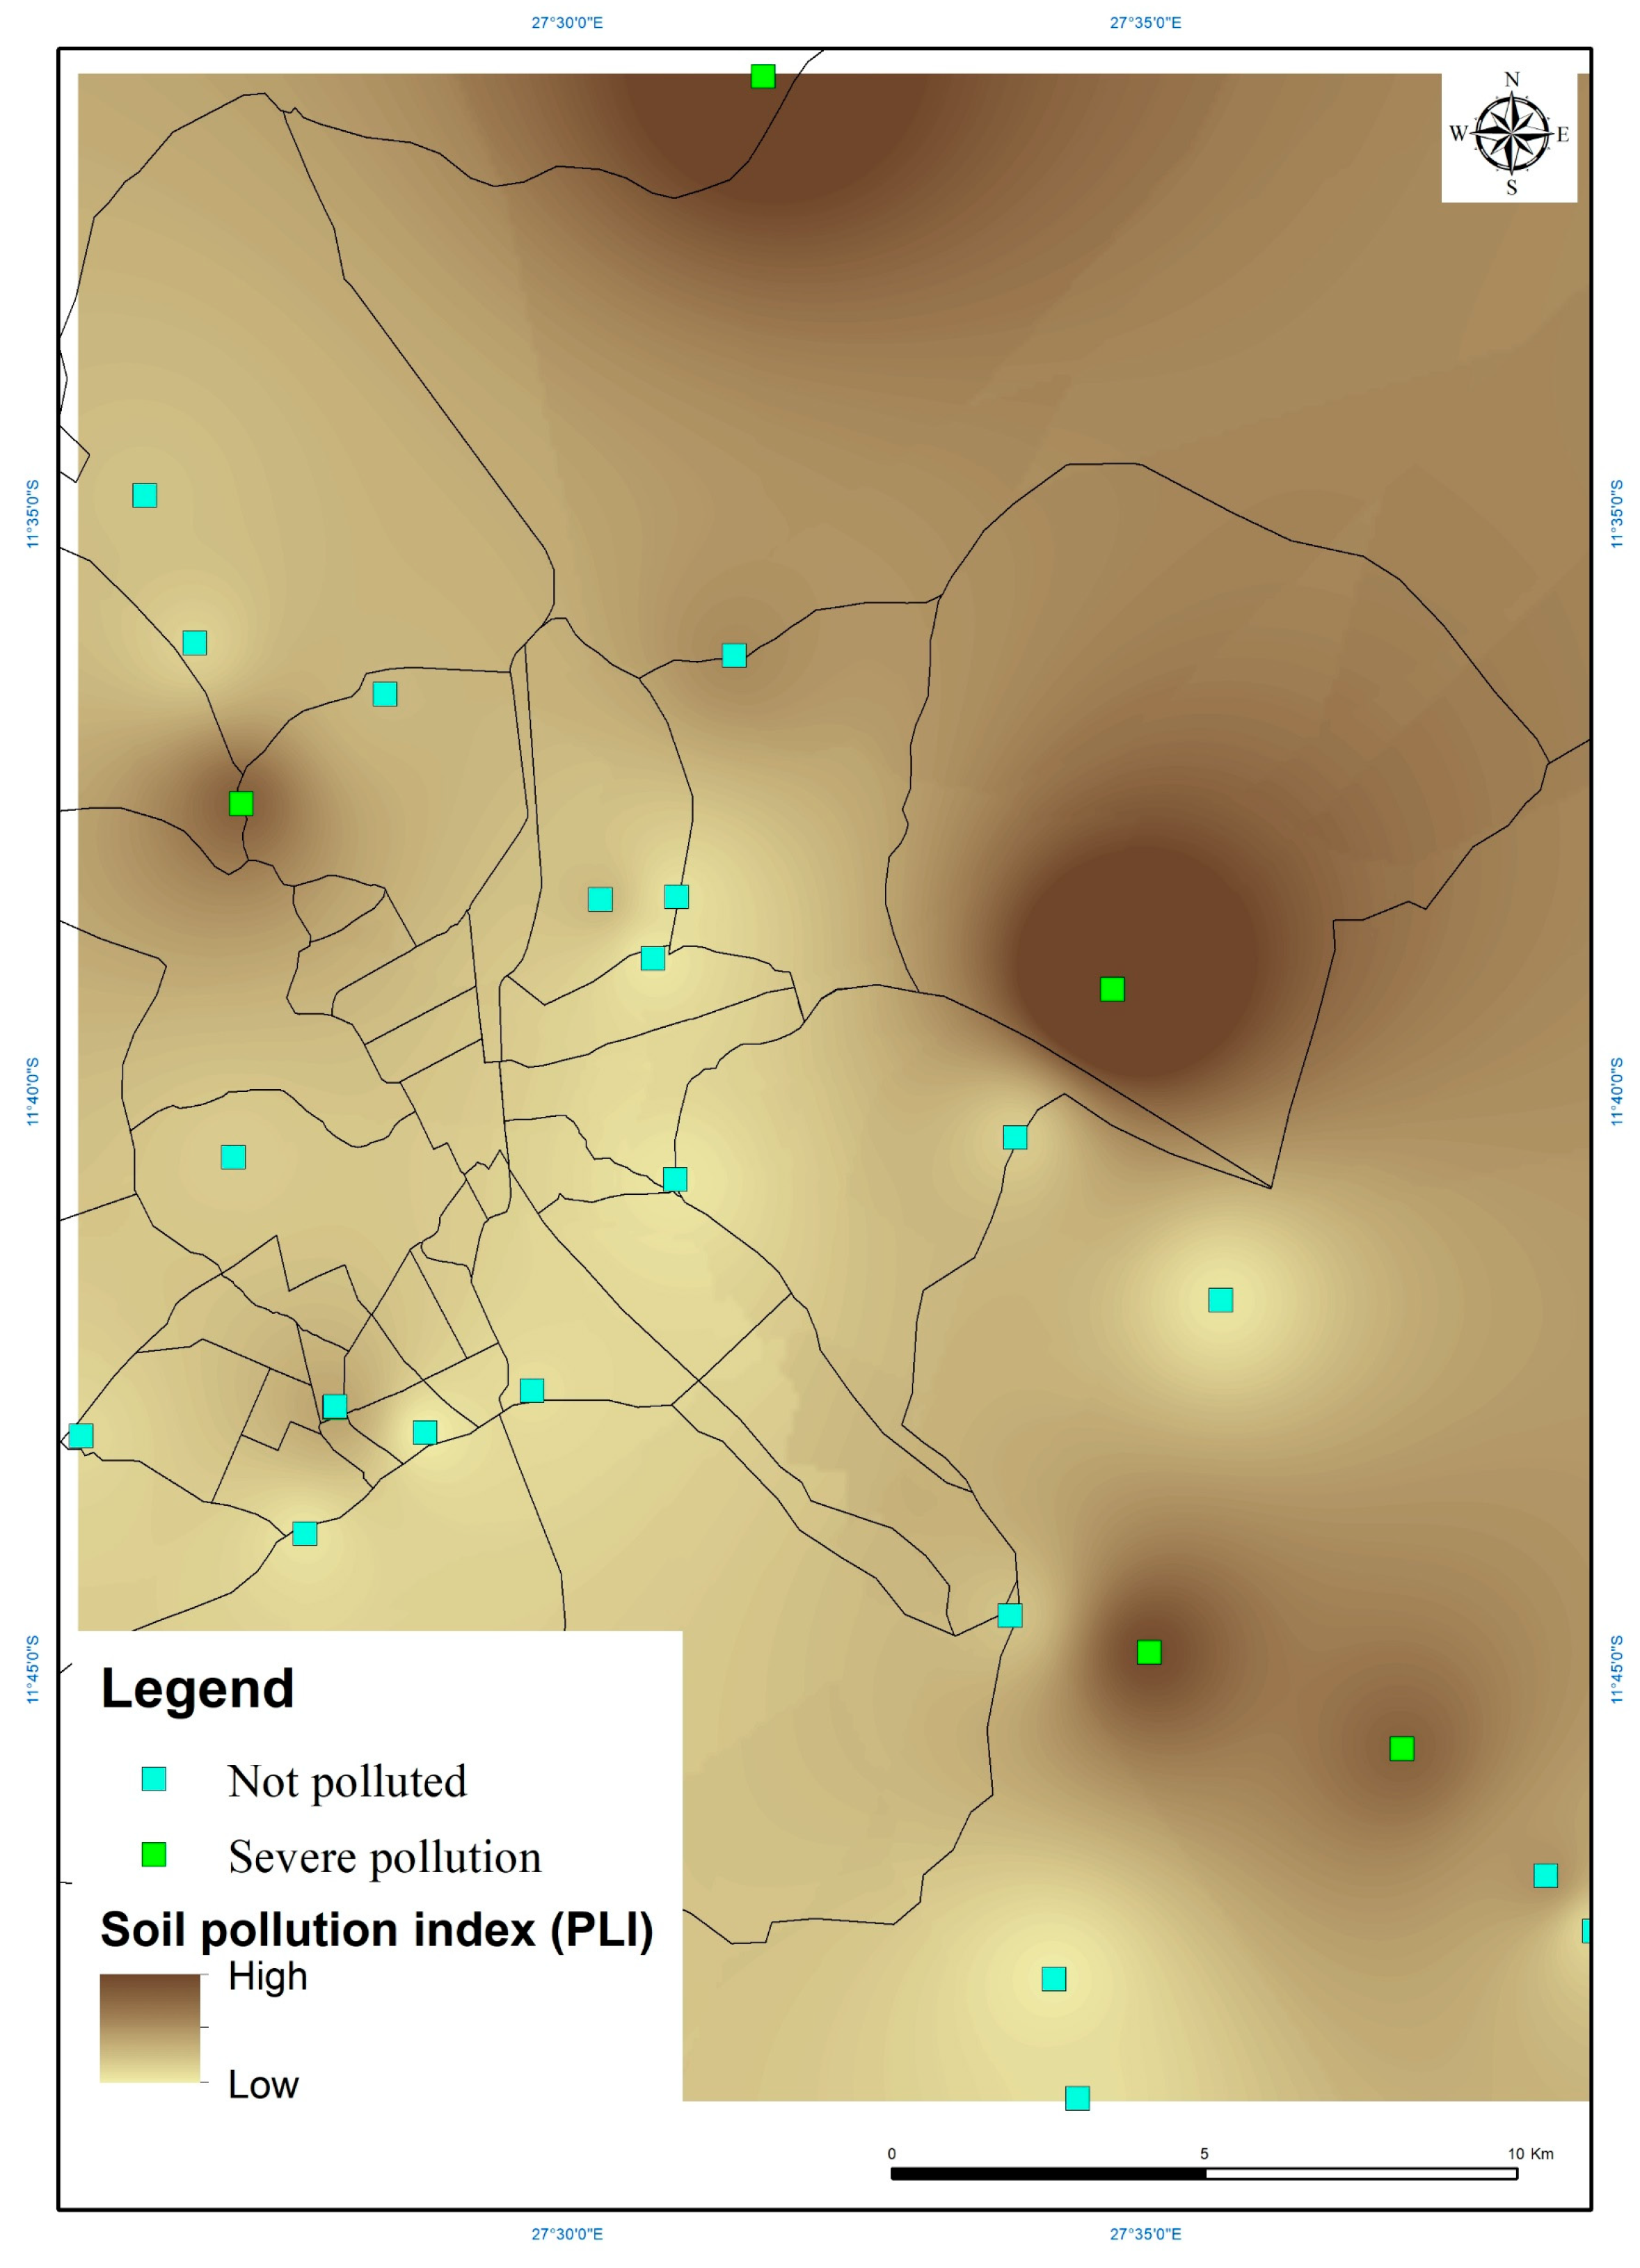
3.2.1. Contamination Factors, Enrichment Factors and Pollution Indices of the Soils
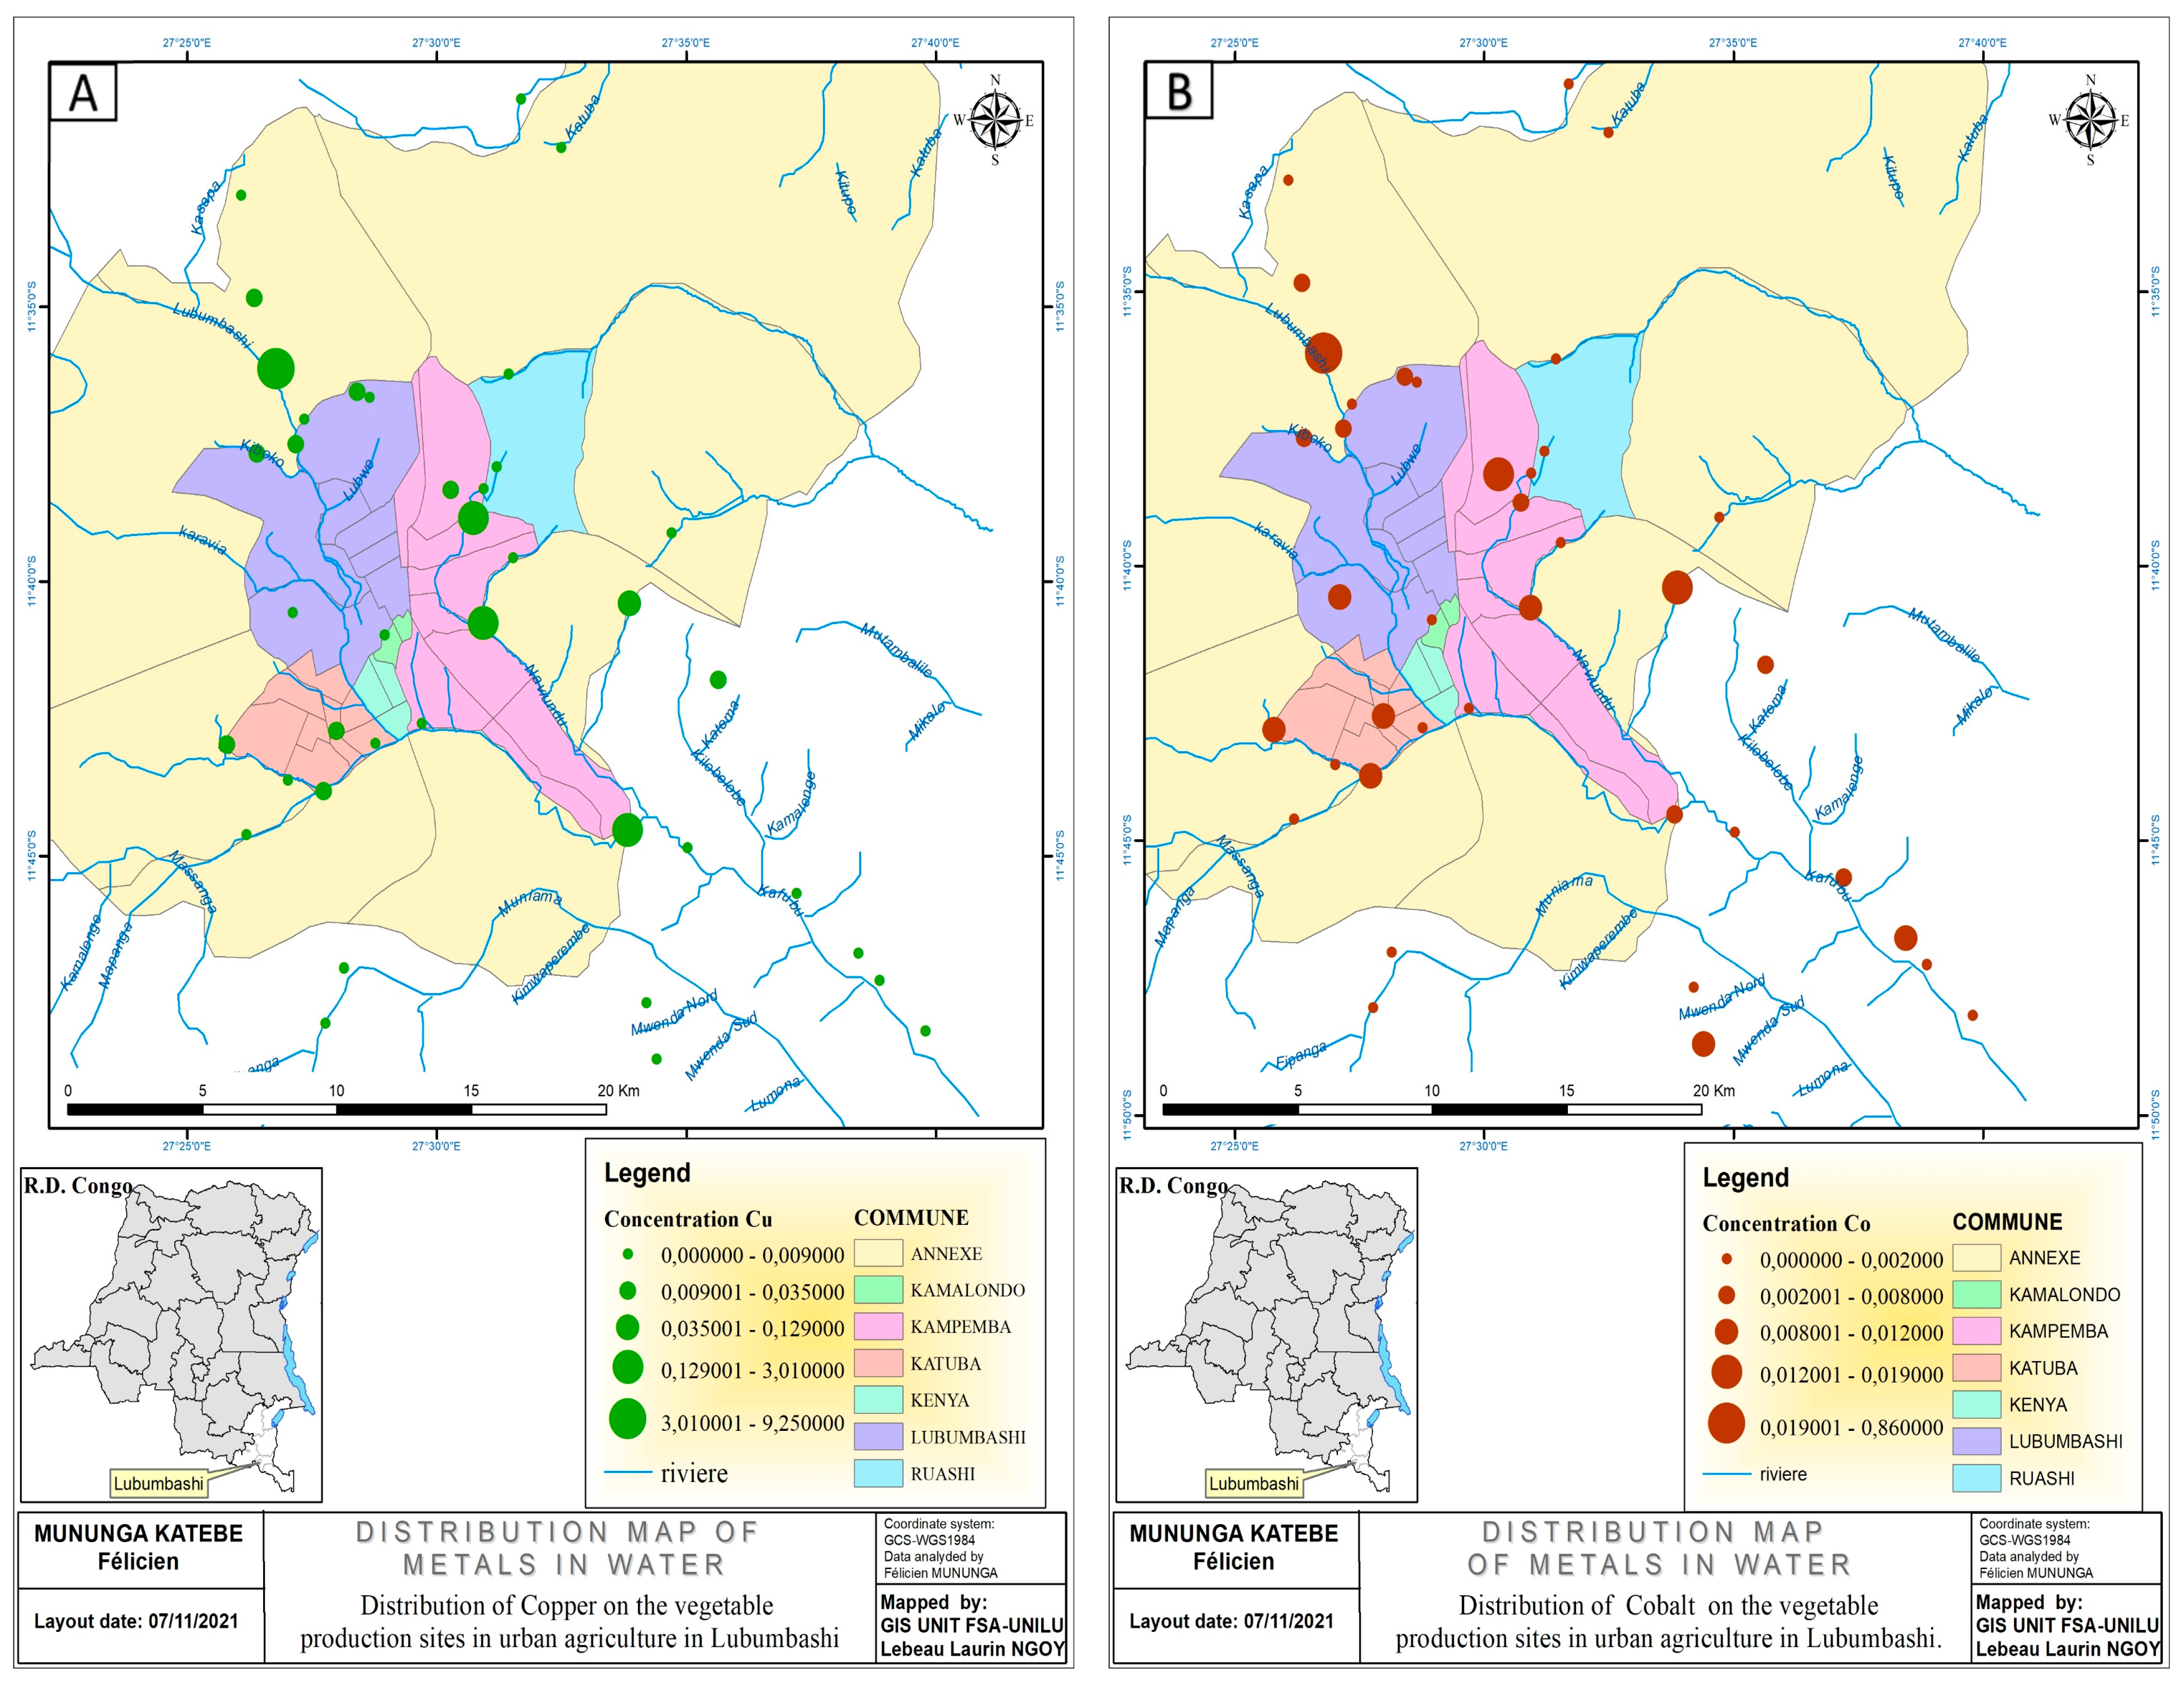
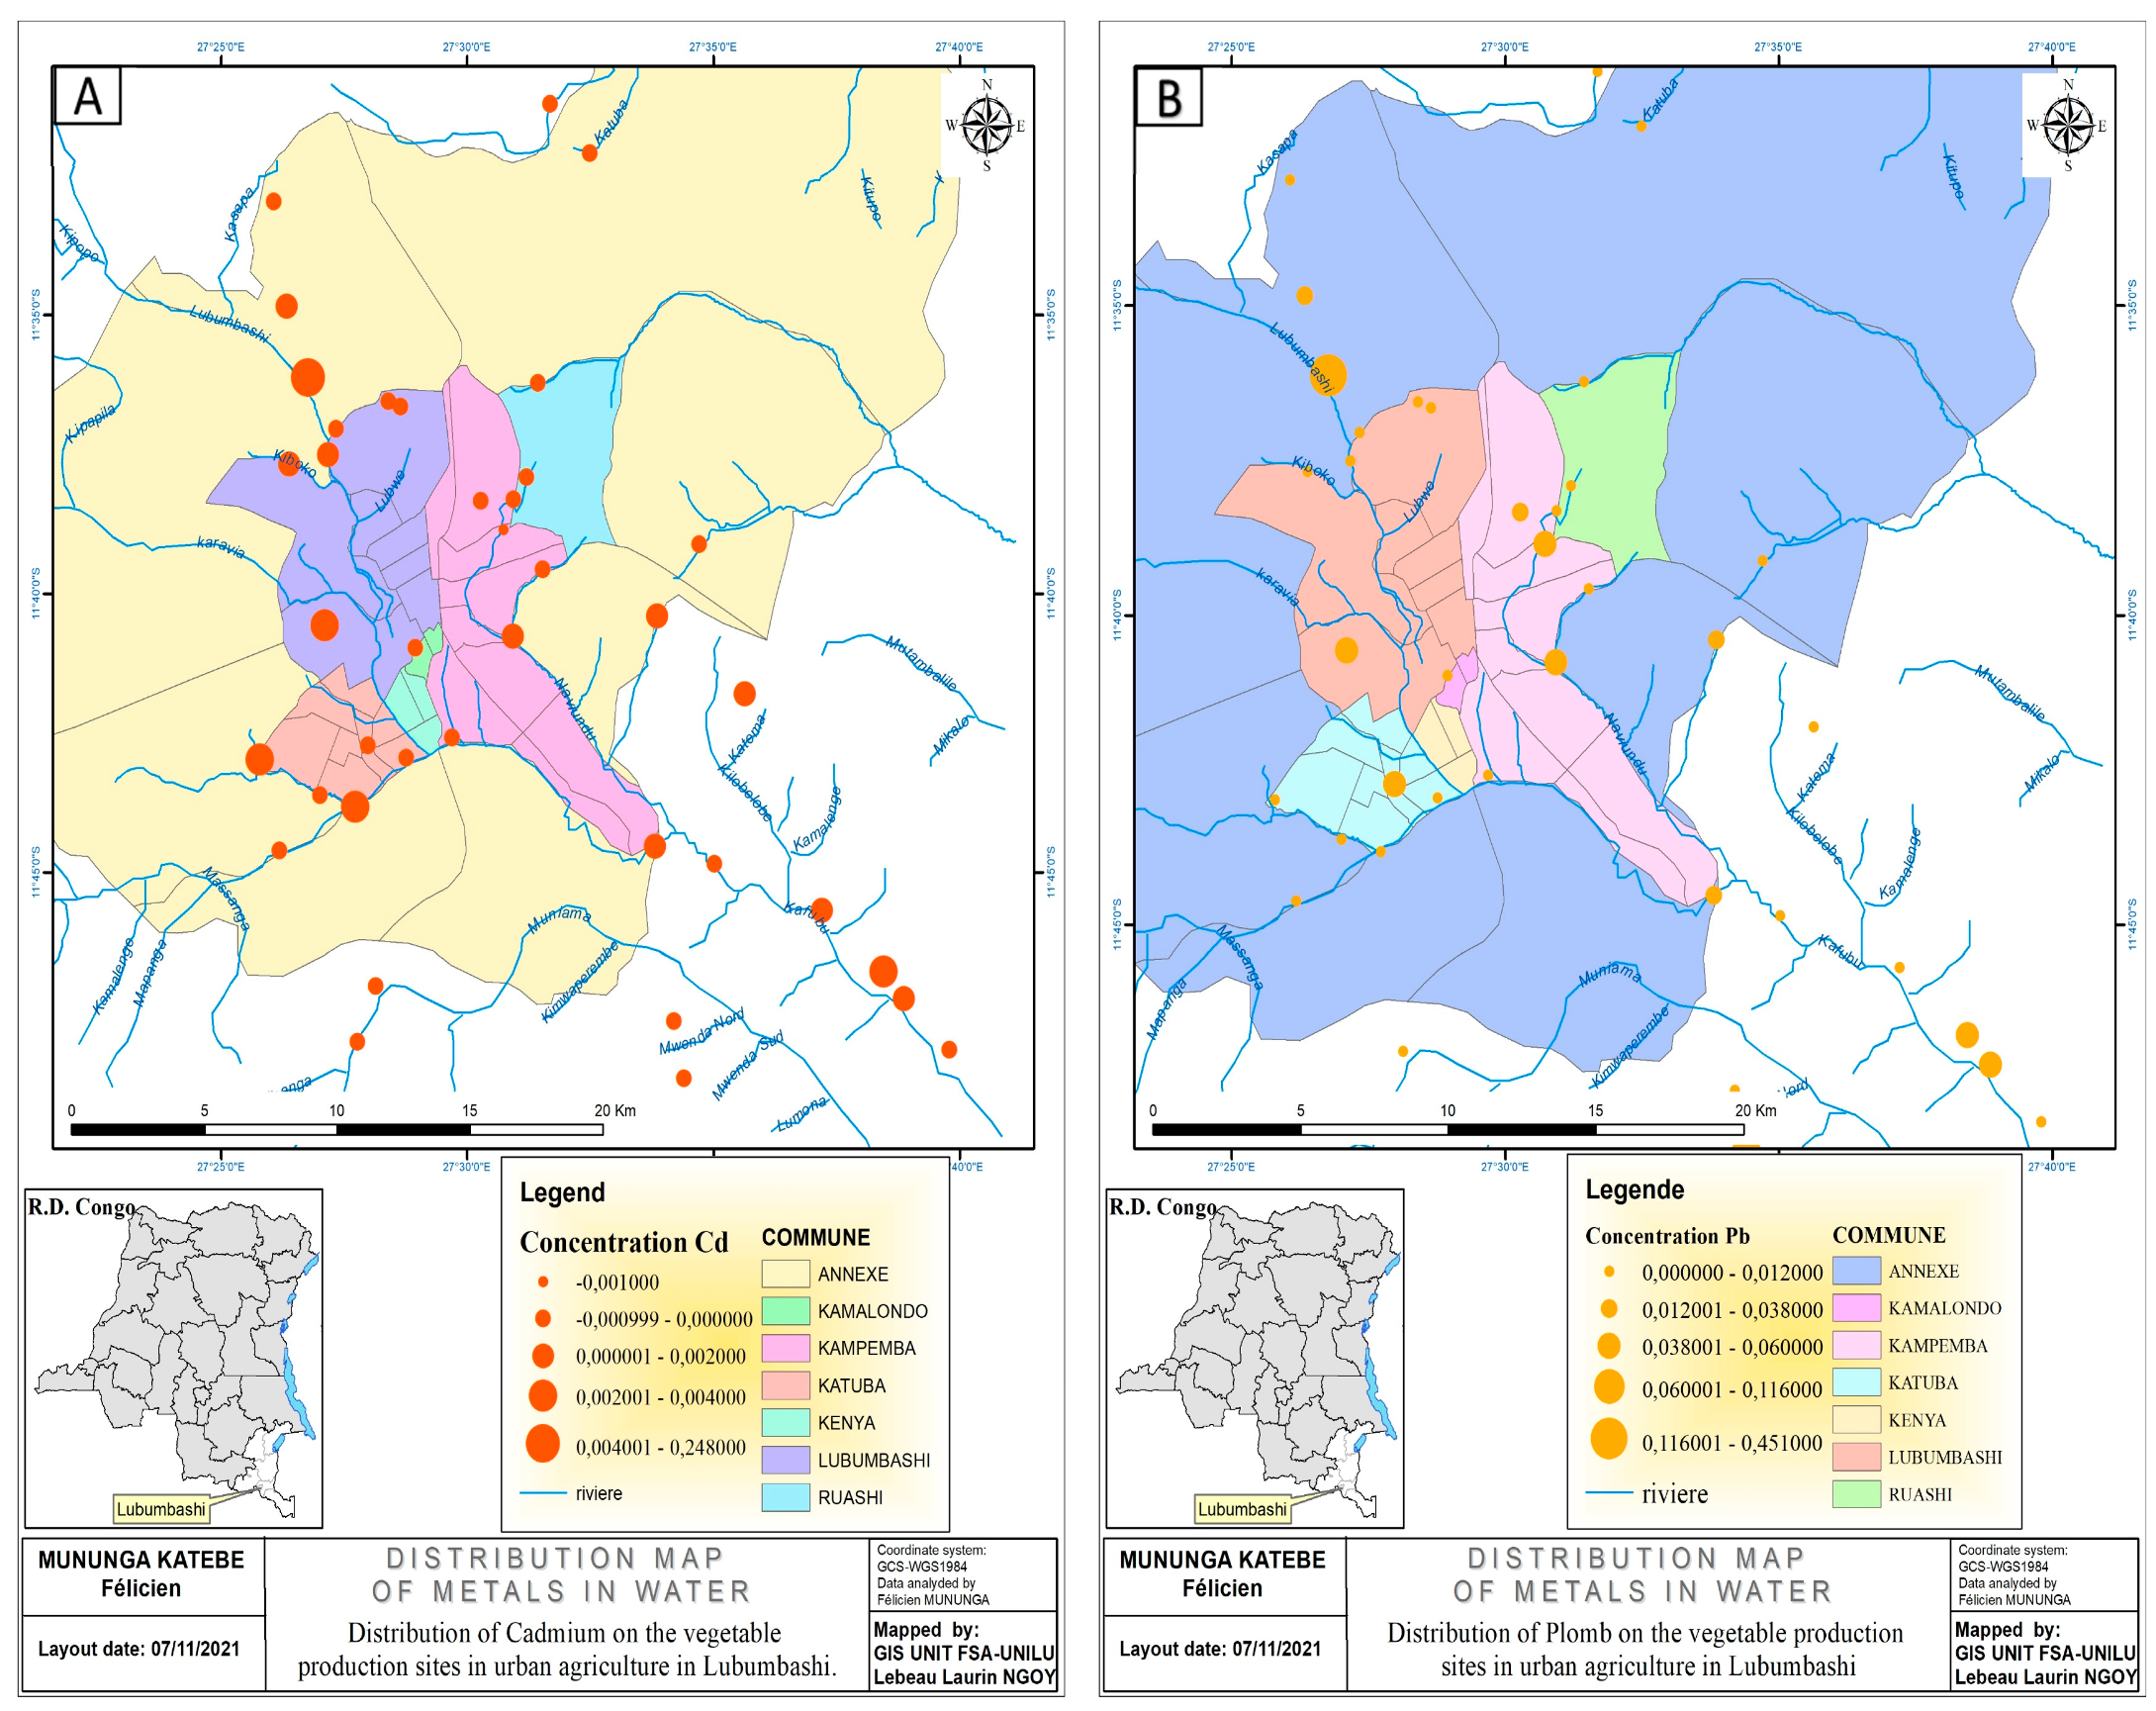
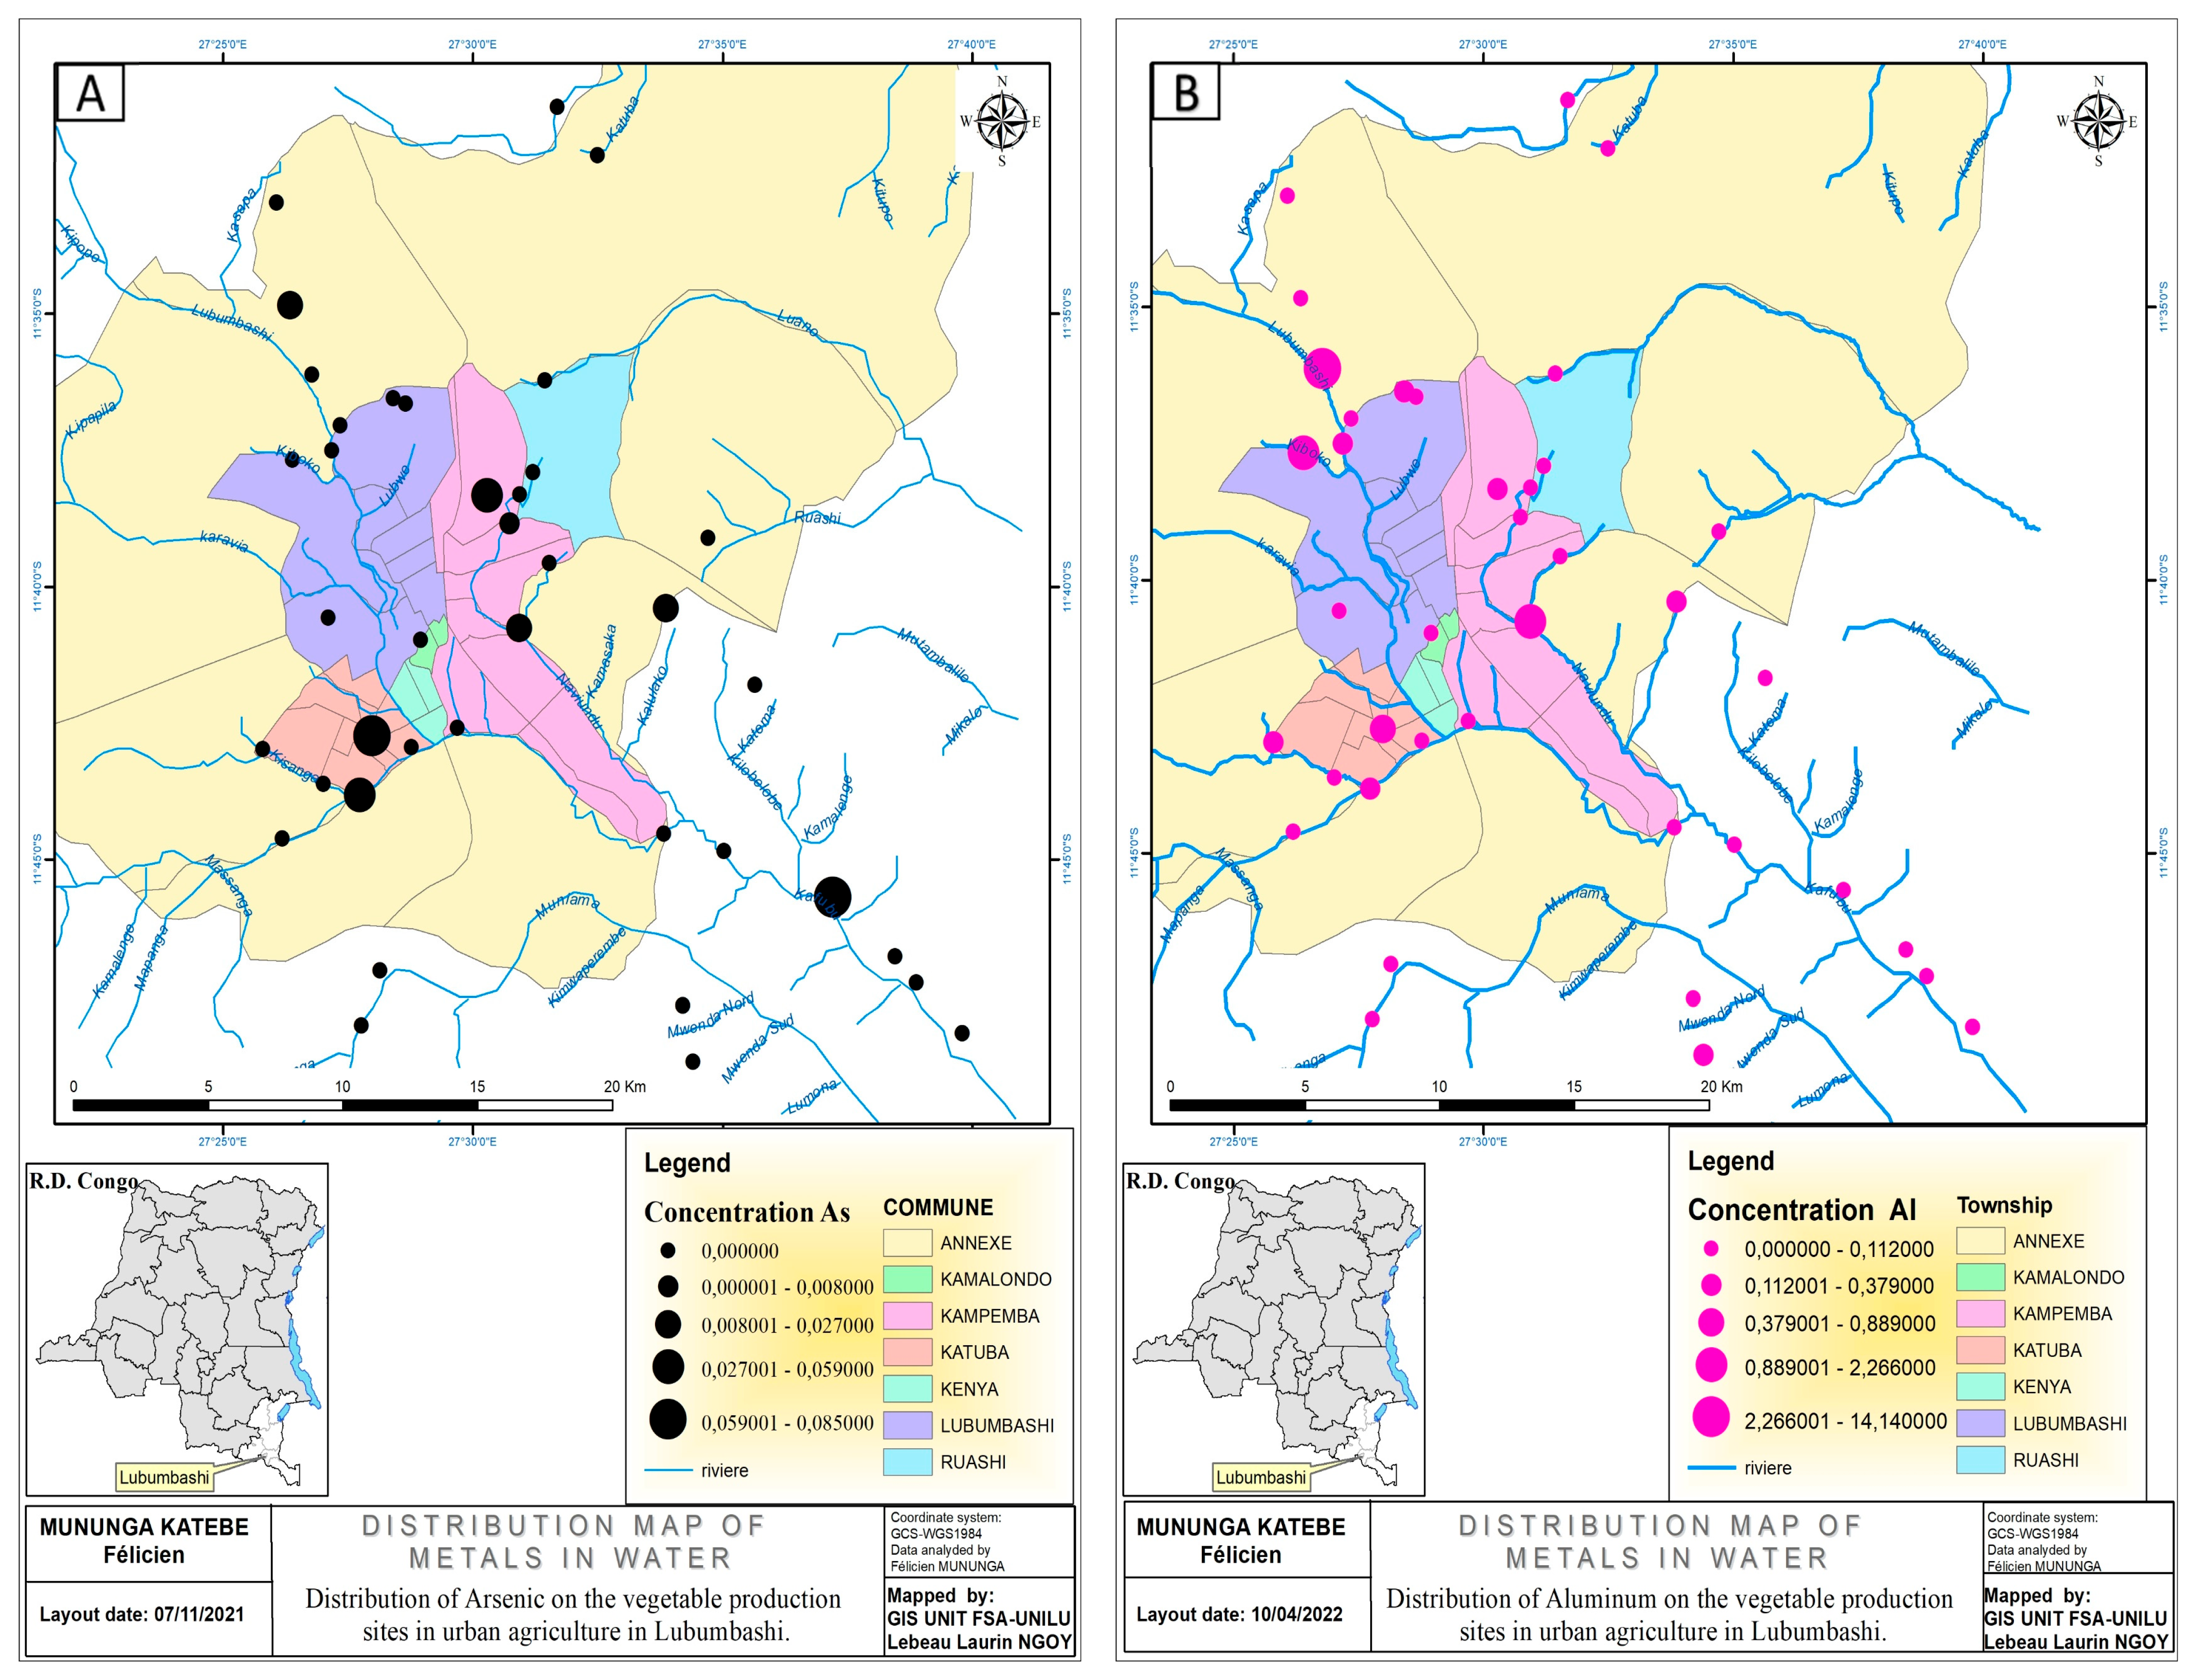
3.2.2. Quality of Crop Irrigation Water in the 21 Selected Market Gardens
3.2.3. Safety of the Vegetables Sold in the 33 Selected Markets of Lubumbashi
4. Discussion
4.1. Assessment of Pollution Indices, Contamination Factors and Soil Enrichment Factors in Market Gardens
4.2. Chemical Quality of the Irrigation Water of the Market Gardens
4.3. Safety of the Vegetables Sold in the 33 Selected Lubumbashi Markets
5. Conclusions
Author Contributions
Funding
Data Availability Statement
Acknowledgments
Conflicts of Interest
Appendix A
Appendix A.1. Names of the 40 Identified Urban Market Gardens of Lubumbashi

| Urban and Peri-Urban Market Gardens |
|---|
| Bombeki |
| Bongonga |
| Camps-assistant |
| Camps-scout |
| Campus-Unilu |
| Chem-chem |
| Daipen-Kisanga |
| Ferme konde |
| Ferme nkonde |
| Inera-Salongo |
| Kabetsha |
| Kafubu |
| Kakonkania |
| Kalebuka |
| Kalubwe |
| Kalulako |
| Kamakanga |
| Kamatete |
| Kamilombe |
| Kamisepe |
| Kantumbwi |
| Kasamba |
| Kashamata |
| Kashimbala |
| Kasungami |
| Katemo |
| Kawama |
| Kilobelobe |
| Kinsense |
| Kitanda |
| Luano |
| Maendeleo |
| Kinsevere/Manoah |
| Mwenda |
| Naviundu |
| Penga-penga |
| Sambwa |
| Tingi-Tingi |
| Tshamalale |
| Tshamilemba |
Appendix A.2. Names of the Markets of the City of Lubumbashi (Democratic Republic of the Congo)
| Market | Municipality |
|---|---|
| ANTENNE RUASHI | RUASHI |
| CAMP PREFABRIQUE | KAMPEMBA |
| DOUBLE POTEAU | LUBUMBASHI |
| EUREKA | LUBUMBASHI |
| KABULAMENSHI | LUBUMBASHI |
| KALEBUKA | ANNEXE |
| KAMATETE | ANNEXE |
| KANSOKO | ANNEXE |
| KARAVIA | ANNEXE |
| KASANGULU | LUBUMBASHI |
| KATUBA 1 | KATUBA |
| KATUBA 2 | KATUBA |
| KENYA (ZONE) | KENYA |
| KIGOMA | KAMPEMBA |
| KILOBELOBE | ANNEXE |
| KIMUTI | KAMPEMBA |
| LIDO | LUBUMBASHI |
| MANOAH NSOKO | RUASHI |
| MARCHE CINE | ANNEXE |
| MÉTÉO | ANNEXE |
| MIMBULU | KATUBA |
| MOISE | ANNEXE |
| MWIMBILA | KENYA |
| M’ZEE | LUBUMBASHI |
| NJANJA | KENYA |
| PANDE | KAMPEMBA |
| PEAGE KIMUTI | KATUBA |
| RADEM | KAMPEMBA |
| RAIL | KAMPEMBA |
| ROSE TSHAKWIZA | ANNEXE |
| TABAC | KAMPEMBA |
| TSHAMALALE | ANNEXE |
| ZAMBIA | RUASHI |
Appendix A.3. Contamination Levels of Urban and Peri-Urban Garden Soils according to the Contamination Factor
| Market Gardens | Fe Contamination Level | Cu Contamination Level | Pb Contamination Level | Zn Contamination Level |
| Bongonga | Low contamination | Low contamination | Low contamination | Low contamination |
| Chem-chem | Low contamination | Moderate contamination | Moderate contamination | Very strong contamination |
| Daipen/Kashamata | Low contamination | Low contamination | Low contamination | Low contamination |
| Kabetsha | Low contamination | Low contamination | Low contamination | Low contamination |
| Kafubu | Low contamination | Low contamination | Low contamination | Moderate contamination |
| Kalebuka | Low contamination | Low contamination | Low contamination | Low contamination |
| Kalubwe | Low contamination | Moderate contamination | Low contamination | Moderate contamination |
| Kalulako | Low contamination | Low contamination | Low contamination | Low contamination |
| Kamakanga | Low contamination | Low contamination | Low contamination | Low contamination |
| Kamatete | Low contamination | Low contamination | Low contamination | Low contamination |
| Kamilombe | Low contamination | Moderate contamination | Low contamination | Significant contamination |
| Kamisepe | Low contamination | Low contamination | Low contamination | Low contamination |
| Kantumbwi | Low contamination | Low contamination | Low contamination | Low contamination |
| Kasungami | Low contamination | Low contamination | Low contamination | Low contamination |
| Katemo | Low contamination | Low contamination | Low contamination | Low contamination |
| Kawama | Low contamination | Moderate contamination | Low contamination | Moderate contamination |
| Kilobelobe | Low contamination | Low contamination | Low contamination | Moderate contamination |
| Kinsense | Low contamination | Low contamination | Low contamination | Low contamination |
| Kinsevere-Manoah | Significant contamination | Moderate contamination | Low contamination | Moderate contamination |
| Kitanda | Low contamination | Moderate contamination | Low contamination | Significant contamination |
| Luano | Low contamination | Low contamination | Low contamination | Moderate contamination |
| Maendeleo | Low contamination | Moderate contamination | Low contamination | Moderate contamination |
| Mwenda | Low contamination | Low contamination | Moderate contamination | Low contamination |
| Penga-penga | Low contamination | Low contamination | Low contamination | Low contamination |
| Sambwa | Low contamination | Low contamination | Low contamination | Low contamination |
| Tingi-Tingi | Low contamination | Low contamination | Low contamination | Low contamination |
| Tshamalale | Low contamination | Low contamination | Low contamination | Low contamination |
| Tshamilemba | Low contamination | Low contamination | Low contamination | Low contamination |
Appendix A.4. Metal Enrichment Levels of the Urban and Peri-Urban Market Gardens of Lubumbashi
| Market Gardens | Cu | Pb | Zn |
| Bongonga | No enrichment | No enrichment | No enrichment |
| Chem-chem | Enrichment Medium High | Moderate Enrichment | High Enrichment |
| Daipen/Kashamata | Low Enrichment | No enrichment | Low Enrichment |
| Kabetsha | No enrichment | No enrichment | No enrichment |
| Kafubu | Low Enrichment | No enrichment | Moderate Enrichment |
| Kalebuka | Moderate Enrichment | No enrichment | Low Enrichment |
| Kalubwe | Low Enrichment | No enrichment | Low Enrichment |
| Kalulako | Low Enrichment | No enrichment | Low Enrichment |
| Kamakanga | No enrichment | No enrichment | No enrichment |
| Kamatete | No enrichment | No enrichment | Low Enrichment |
| Kamilombe | Low Enrichment | No enrichment | Enrichment Medium high |
| Kamisepe | Low Enrichment | No enrichment | Low Enrichment |
| Kantumbwi | No enrichment | No enrichment | No enrichment |
| Kasungami | No enrichment | No enrichment | No enrichment |
| Katemo | No enrichment | No enrichment | No enrichment |
| Kawama | Low Enrichment | No enrichment | Low Enrichment |
| Kilobelobe | Low Enrichment | Low Enrichment | Moderate Enrichment |
| Kinsense | Low Enrichment | No enrichment | Low Enrichment |
| Kinsevere-Manoah | No enrichment | No enrichment | No enrichment |
| Kitanda | Low Enrichment | No enrichment | Enrichment Medium high |
| Luano | Low Enrichment | Low Enrichment | Moderate Enrichment |
| Maendeleo | Low Enrichment | Medium High Enrichment | Enrichment Medium high |
| Mwenda | No enrichment | No enrichment | Low Enrichment |
| Penga-penga | No enrichment | No enrichment | No enrichment |
| Sambwa | Low Enrichment | Low Enrichment | Low Enrichment |
| Tingi-Tingi | Low Enrichment | No enrichment | Low Enrichment |
| Tshamalale | No enrichment | No enrichment | No enrichment |
| Tshamilemba | No enrichment | No enrichment | No enrichment |
Appendix A.5. Pollution Levels of the Urban and Peri-Urban Market Gardens of Lubumbashi
| Market Garden Name | Pollution Level |
| Bongonga | Not polluted |
| Chem-chem | Severe pollution |
| Daipen/Kashamata | Not polluted |
| Kabetsha | Not polluted |
| Kafubu | Not polluted |
| Kalebuka | Not polluted |
| Kalubwe | Severe pollution |
| Kalulako | Not polluted |
| Kamakanga | Not polluted |
| Kamatete | Not polluted |
| Kamilombe | Severe pollution |
| Kamisepe | Not polluted |
| Kantumbwi | Not polluted |
| Kasungami | Not polluted |
| Katemo | Not polluted |
| Kawama | Not polluted |
| Kilobelobe | Not polluted |
| Kinsense | Not polluted |
| Kinsevere-Manoah | Severe pollution |
| Kitanda | Severe pollution |
| Luano | Not polluted |
| Maendeleo | Severe pollution |
| Mwenda | Not polluted |
| Penga-penga | Not polluted |
| Sambwa | Not polluted |
| Tingi-Tingi | Not polluted |
| Tshamalale | Not polluted |
| Tshamilemba | Not polluted |
Appendix A.6. XRF Determination of Metals in 29 Urban and Peri-Urban Market Gardens of Lubumbashi (mg/kg). Limits of Quantification: 0.05 mg/kg
| Market Gardens | Fe | Cd | Cu | Pb | Cr | Zn |
| Bongonga | 3.31 | 0.05 | 59 | 0.05 | 0.05 | 30 |
| Chem-Chem | 4.08 | 45 | 1.355 | 221 | 67 | 1.47 |
| Daipen/Kashamata | 2.13 | 0.05 | 204 | 20 | 45 | 60 |
| Kabetsha | 2.19 | 0.05 | 113 | 0.05 | 45 | 42 |
| Kafubu | 2.34 | 236 | 146 | 0.05 | 0.05 | 181 |
| Kalebuka | 1.12 | 0.05 | 226 | 0.05 | 38 | 53 |
| Kalubwe | 4.97 | 40 | 850 | 0.05 | 58 | 301 |
| Kalulako | 1.84 | 0.05 | 239 | 0.05 | 0.05 | 85 |
| Kamakanga | 3.33 | 0.05 | 78 | 0.05 | 66 | 44 |
| Kamatete | 3.55 | 0.05 | 206 | 26 | 0.05 | 138 |
| Kamilombe | 4.23 | 56 | 656 | 0.05 | 69 | 716 |
| Kamisepe | 1.87 | 0.05 | 208 | 0.05 | 63 | 73 |
| Kantumbwi | 1.81 | 0.05 | 45 | 0.05 | 46 | 28 |
| Kasungami | 1.9 | 0.05 | 102 | 0.05 | 47 | 38 |
| Katemo | 3.23 | 19 | 56 | 0.05 | 0.05 | 35 |
| Kawama | 4.18 | 0.05 | 598 | 39 | 0.05 | 262 |
| Kikula/Sambwa | 1.57 | 0.05 | 201 | 18 | 45 | 88 |
| Kilobelobe | 3.71 | 0.05 | 344 | 48 | 75 | 284 |
| Kinsense | 3.7 | 0.05 | 270 | 34 | 51 | 136 |
| Kinsevere (Manoah) | 33.43 | 0.05 | 535 | 81 | 0.05 | 394 |
| Kitanda | 4.96 | 0.05 | 826 | 47 | 59 | 652 |
| Luano | 4.05 | 0.05 | 346 | 80 | 46 | 300 |
| Maendeleo | 2.7 | 0.05 | 493 | 184 | 57 | 409 |
| Mashimikila | 2.46 | 0.05 | 1.043 | 73 | 0.05 | 230 |
| Mwenda | 1.28 | 0.05 | 66 | 0.05 | 43 | 42 |
| Pengapenga | 4.31 | 0.05 | 183 | 0.05 | 49 | 50 |
| Tingi-Tingi | 2.57 | 0.05 | 160 | 0.05 | 45 | 66 |
| Tshamalale | 2.73 | 0.05 | 50 | 0.05 | 0.05 | 34 |
| Tshamilemba | 2.46 | 0.05 | 51 | 0.05 | 0.05 | 33 |
| Toxicity threshold (mg/kg) | NT | 2 | 100 | 100 | 150 | 300 |
References
- Kaninga, B.; Chishala, B.H.; Maseka, K.K.; Sakala, G.M.; Young, S.D.; Lark, R.M.; Tye, A.; Hamilton, E.M.; Gardner, A.; Watts, M.J. Do soil amendments used to improve agricultural productivity have consequences for soils contaminated with heavy metals? Heliyon 2020, 6, e05502. [Google Scholar] [CrossRef] [PubMed]
- Fahmy, H.M.; Mohamed, F.M.; Marzouq, M.H.; Mustafa, A.B.E.-D.; Alsoudi, A.M.; Ali, O.A.; Mohamed, M.A.; Mahmoud, F.A. Review of Green Methods of Iron Nanoparticles Synthesis and Applications. Bionanoscience 2018, 8, 491–503. [Google Scholar] [CrossRef]
- Dheri, G.S.; Brar, M.S.; Malhi, S.S. Heavy-metal concentration of sewage-contaminated water and its impact on underground water, soil, and crop plants in alluvial soils of northwestern India. Commun. Soil Sci. Plant Anal. 2007, 38, 1353–1370. [Google Scholar] [CrossRef]
- Lin, Y.-C.; Lee, W.-J.; Shih, Y.-J.; Jhang, S.-R.; Chien, S.-K. Levels and sources of heavy metals in soil, sediment, and food crop in the vicinity of electric arc furnace (EAF) steelmaking plant: A case study from Taiwan. J. Soils Sediments 2018, 18, 2562–2572. [Google Scholar] [CrossRef]
- Ma, L.; Sun, J.; Yang, Z.; Wang, L. Heavy metal contamination of agricultural soils affected by mining activities around the Ganxi River in Chenzhou, Southern China. Environ. Monit. Assess. 2015, 187, 208. [Google Scholar] [CrossRef]
- Xie, W.; Peng, C.; Wang, H.; Chen, W. Bioaccessibility and source identification of heavy metals in agricultural soils contaminated by mining activities. Environ. Earth Sci. 2018, 77, 606. [Google Scholar] [CrossRef]
- Khalid, S.; Shahid, M.; Natasha; Bibi, I.; Sarwar, T.; Shah, A.H.; Niazi, N.K. A review of environmental contamination and health risk assessment of wastewater use for crop irrigation with a focus on low and high-income countries. Int. J. Environ. Res. Public Health 2018, 15, 895. [Google Scholar] [CrossRef] [Green Version]
- Mlangeni, A.T.; Raab, A.; Kumambala, P.; Monjerezi, M.; Matumba, L.; Feldmann, J. Evaluation of Metal(loids) Concentrations in Soils of Selected Rice Paddy Fields in Malawi. Agronomy 2022, 12, 2349. [Google Scholar] [CrossRef]
- Vongdala, N.; Tran, H.-D.; Xuan, T.D.; Teschke, R.; Khanh, T.D. Heavy metal accumulation in water, soil, and plants of municipal solid waste landfill in Vientiane, Laos. Int. J. Environ. Res. Public Health 2019, 16, 22. [Google Scholar] [CrossRef] [Green Version]
- Atibu, E.K.; Devarajan, N.; Laffite, A.; Giuliani, G.; Salumu, J.A.; Muteb, R.C.; Mulaji, C.K.; Otamonga, J.-P.; Elongo, V.; Mpiana, P.T.; et al. Assessment of trace metal and rare earth elements contamination in rivers around abandoned and active mine areas. The case of Lubumbashi River and Tshamilemba Canal, Katanga, Democratic Republic of the Congo. Chem. Erde 2016, 76, 353–362. [Google Scholar] [CrossRef]
- Mubemba, M.M.; Sikuzani, Y.U.; Kimuni, L.N.; Colinet, G. Effets d’amendements carbonatés et organiques sur la culture de deux légumes sur sol contaminé à Lubumbashi (RD Congo). Biotechnol. Agron. Soc. Environ. 2014, 18, 367–375. [Google Scholar]
- Osaili, T.M.; Al Jamali, A.F.; Makhadmeh, I.M.; Taha, M.; Jarrar, S.K. Heavy metals in vegetables sold in the local market in Jordan. Food Addit. Contam. Part B Surveill. 2016, 9, 223–229. [Google Scholar] [CrossRef] [PubMed]
- Mulambi, M.M.; Yannick, U.S.; Theodore, M.M.; Guy, K.M.; Muyembe, M.; Kampanyi, I.; Ckeface, K.K.; Kalilo, K.; Luciens, N.K. Teneurs en éléments traces métalliques dans les sols de différents jardins potagers de la ville minière de Lubumbashi et risques de contamination des cultures potagères. J. Appl. Biosci. 2013, 66, 5106–5113. [Google Scholar]
- Sultana, M.; Mondol, M.; Mahir, A.; Sultana, R.; Elahi, S.; Afrose, N.; Chamon, A. Heavy metal concentration and health risk assessment in commonly sold vegetables in Dhaka city market. Bangladesh J. Sci. Ind. Res. 2019, 54, 357–366. [Google Scholar] [CrossRef] [Green Version]
- Matech, F.; Zaakour, F.; Chemsi, Z.; Moustarhfer, K.; Mohcine, H.; Marrakchi, C.S.N.; Saber, N. Effect of concentration increasing of cd, cr, cu, pb and zn in soils irrigated by waste waters of hassar river (region of mediouna-casablanca-morocco). Phys. Chem. News 2014, 71, 94–99. [Google Scholar]
- Ullah, N.; Rehman, M.U.; Ahmad, B.; Ali, I.; Younas, M.; Aslam, M.S.; Rahman, A.-U.; Taheri, E.; Fatehizadeh, A.; Rezakazemi, M. Assessment of heavy metals accumulation in agricultural soil, vegetables and associated health risks. PLoS ONE 2022, 17, e0267719. [Google Scholar] [CrossRef]
- Abuzaid, A.S.; Abdel-Salam, M.A.; Ahmad, A.F.; Fathy, H.A.; Fadl, M.E.; Scopa, A. Effect of Marginal-Quality Irrigation on Accumulation of some Heavy Metals (Mn, Pb, and Zn) in TypicTorripsamment Soils and Food Crops. Sustainability 2022, 14, 1067. [Google Scholar] [CrossRef]
- Muimba-Kankolongo, A.; Nkulu, C.B.L.; Mwitwa, J.; Kampemba, F.M.; Nabuyanda, M.M.; Haufroid, V.; Smolders, E.; Nemery, B. Contamination of water and food crops by trace elements in the African Copperbelt: A collaborative cross-border study in Zambia and the Democratic Republic of Congo. Environ. Adv. 2021, 6, 100103. [Google Scholar] [CrossRef]
- Massadeh, A.M.; Al-Massaedh, A.A.T. Determination of heavy metals in canned fruits and vegetables sold in Jordan market. Environ. Sci. Pollut. Res. 2018, 25, 1914–1920. [Google Scholar] [CrossRef]
- Mpinda, M.T.; Abass, O.K.; Bazirake, M.B.; Nsokimieno, E.M.; Mylor, N.S.; Kayembe, K.W.; Zakari, S.; Khonde, R. Towards the efficiency of municipal solid waste management in the democratic republic of congo (Drc): Case study of lubumbashi. Am. J. Environ. Sci. 2016, 12, 193–205. [Google Scholar] [CrossRef] [Green Version]
- Ciumasu, I.M.; Costica, M.; Costica, N.; Neamtu, M.; Dirtu, A.C.; de Alencastro, L.F.; Buzdugan, L.; Andriesa, R.; Iconomu, L.; Stratu, A.; et al. Complex Risks from Old Urban Waste Landfills: Sustainability Perspective from Iasi, Romania. J. Hazard. Toxic Radioact. Waste 2012, 16, 158–168. [Google Scholar] [CrossRef] [Green Version]
- Gola, D.; Malik, A.; Shaikh, Z.A.; Sreekrishnan, T.R. Impact of Heavy Metal Containing Wastewater on Agricultural Soil and Produce: Relevance of Biological Treatment. Environ. Process. 2016, 3, 1063–1080. [Google Scholar] [CrossRef]
- Bandara, J.M.R.S.; Senevirathna, D.M.A.N.; Dasanayake, D.M.R.S.B.; Herath, V.; Abeysekara, T.; Rajapaksha, K.H. Chronic renal failure among farm families in cascade irrigation systems in Sri Lanka associated with elevated dietary cadmium levels in rice and freshwater fish (Tilapia). Environ. Geochem. Health 2008, 30, 465–478. [Google Scholar] [CrossRef]
- Ilechukwu, I.; Osuji, L.C.; Okoli, C.P.; Onyema, M.O.; Ndukwe, G.I. Assessment of heavy metal pollution in soils and health risk consequences of human exposure within the vicinity of hot mix asphalt plants in Rivers State, Nigeria. Environ. Monit. Assess. 2021, 193, 461. [Google Scholar] [CrossRef] [PubMed]
- Song, Q.; Li, J. A review on human health consequences of metals exposure to e-waste in China. Environ. Pollut. 2015, 196, 450–461. [Google Scholar] [CrossRef] [PubMed]
- Scheen, A.J.; Giet, D. Rôle de l’environnement dans les maladies complexes: Pollution atmosphérique et contaminants alimentaires. Rev. Med. Liege 2012, 67, 226–233. [Google Scholar]
- Kayembe-Kitenge, T.; Lubala, T.K.; Obadia, P.M.; Chimusa, P.K.; Nawej, C.K.; Nkulu, C.B.L.; Devriendt, K.; Nemery, B. Holoprosencephaly: A case series from an area with high mining-related pollution. Birth Defects Res. 2019, 111, 1561–1563. [Google Scholar] [CrossRef]
- Mutshail, G. Aperçu Technologique Sur L’Horticulture Urbaine Et Périurbaine De La Rdc—Cas De La Ville De Lubumbashi. Acta Hortic. 2014, 1021, 243–257. [Google Scholar] [CrossRef]
- Mubemba, M.M.M.; Mununga, K.F.; Kaumbu, K.J.-M.; Mwilambwe, K.X.; Maloba, K.J.-P.; Banza, I.M.; Mukunto, K.I. Influence des sols contaminés en cuivre sur le développement de deux variétés (locale et améliorée) de légumes dans la région de Lubumbashi (RD. Congo). J. Appl. Biosci. 2017, 115, 11410. [Google Scholar] [CrossRef] [Green Version]
- Houba, V.; Lexmond, T.; Novozamsky, I.; van der Lee, J. State of the art and future developments in soil analysis for bioavailability assessment. Sci. Total Environ. 1996, 178, 21–28. [Google Scholar] [CrossRef]
- Hoet, P.; Jacquerye, C.; Deumer, G.; Lison, D.; Haufroid, V. Reference values and upper reference limits for 26 trace elements in the urine of adults living in Belgium. Clin. Chem. Lab. Med. 2013, 51, 839–849. [Google Scholar] [CrossRef]
- Adams, S.F.; Miller, T.A. Two-photon absorption laser-induced fluorescence of atomic nitrogen by an alternative excitation scheme. Chem. Phys. Lett. 1998, 295, 305–311. [Google Scholar] [CrossRef]
- Cabrera, F.; Clemente, L.; Barrientos, E.D.; López, R.; Murillo, J.M. Heavy metal pollution of soils affected by the Guadiamar toxic flood. Sci. Total Environ. 1999, 242, 117–129. [Google Scholar] [CrossRef] [PubMed] [Green Version]
- Yang, Q.W.; Lan, C.Y.; Wang, H.B.; Zhuang, P.; Shu, W.S. Cadmium in soil-rice system and health risk associated with the use of untreated mining wastewater for irrigation in Lechang, China. Agric. Water Manag. 2006, 84, 147–152. [Google Scholar] [CrossRef]
- Bogaert, J.; Colinet, G.; Mahy, G. Anthropisation des Paysages Katangais; Les Presses Universitaires de Liège: Gembloux, Belgium, 2018. [Google Scholar]
- Tomlinson, D.L.; Wilson, J.G.; Harris, C.R.; Jeffrey, D.W. Problems in the assessment of heavy-metal levels in estuaries and the formation of a pollution index. Helgoländer Meeresunters. 1980, 33, 566–575. [Google Scholar] [CrossRef] [Green Version]
- Chester, R.; Stoner, J.H. The distribution of zinc, nickel, manganese, cadmium, copper, and iron in some surface waters from the world ocean. Mar. Chem. 1974, 2, 17–32. [Google Scholar] [CrossRef]
- Balls, P.W.; Hull, S.; Miller, B.S.; Pirie, J.M.; Proctor, W. Trace Metal in Scottish Estuarine and Coastal Sediments. Mar. Pollut. Bull. 1997, 34, 42–50. [Google Scholar] [CrossRef]
- Rubio, B.; Nombela, M.A.; Vilas, F. Geochemistry of Major and Trace Elements in Sediments of the Ria de Vigo (NW Spain): An Assessment of Metal Pollution. Mar. Pollut. Bull. 2000, 40, 968–980. [Google Scholar] [CrossRef]
- Karim, Z.; Qureshi, B.A.; Mumtaz, M. Geochemical baseline determination and pollution assessment of heavy metals in urban soils of Karachi, Pakistan. Ecol. Indic. 2015, 48, 358–364. [Google Scholar] [CrossRef]
- Mucha, A.P.; Vasconcelos, M.T.S.D.; Bordalo, A.A. Macrobenthic community in the Douro estuary: Relations with trace metals and natural sediment characteristics. Environ. Pollut. 2003, 121, 169–180. [Google Scholar] [CrossRef]
- Abu-Rukah, H.A.G.Y.; Rosen, M.A. Application of geoaccumulation index and enrichment factor for assessing metal contamination in the sediments of Kafrain Dam, Jordan. Environ. Monit. Assess. 2011, 178, 95–109. [Google Scholar] [CrossRef]
- Marrugo-Negrete, J.; Marrugo-Madrid, S.; Pinedo-Hernández, J.; Durango-Hernández, J.; Díez, S. Screening of native plant species for phytoremediation potential at a Hg-contaminated mining site. Sci. Total Environ. 2016, 542, 809–816. [Google Scholar] [CrossRef] [PubMed]
- Mpinda, M.T.; Mujinya, B.B.; Mees, F.; Kasangij, P.K.; Van Ranst, E. Patterns and forms of copper and cobalt in Macrotermes falciger mounds of the Lubumbashi area, DR Congo. J. Geochem. Explor. 2022, 238, 107002. [Google Scholar] [CrossRef]
- De Haan, M.; Keuning, S.J. Taking the environment into account: The NAMEA approach. Rev. Income Wealth 1996, 42, 131–148. [Google Scholar] [CrossRef]
- Shutcha, M.N.; Faucon, M.-P.; Kissi, C.K.; Colinet, G.; Mahy, G.; Luhembwe, M.N.; Visser, M.; Meerts, P. Three years of phytostabilisation experiment of bare acidic soil extremely contaminated by copper smelting using plant biodiversity of metal-rich soils in tropical Africa (Katanga, DR Congo). Ecol. Eng. 2015, 82, 81–90. [Google Scholar] [CrossRef]
- Muyumba, D.K.; Pourret, O.; Liénard, A.; Bonhoure, J.; Mahy, G.; Luhembwe, M.N.; Colinet, G. Mobility of copper and cobalt in metalliferous ecosystems: Results of a lysimeter study in the Lubumbashi Region (Democratic Republic of Congo). J. Geochem. Explor. 2019, 196, 208–218. [Google Scholar] [CrossRef]
- Lange, B.; Faucon, M.P.; Meerts, P.; Shutcha, M.; Mahy, G.; Pourret, O. Prediction of the edaphic factors influence upon the copper and cobalt accumulation in two metallophytes using copper and cobalt speciation in soils. Plant Soil 2014, 379, 275–287. [Google Scholar] [CrossRef] [Green Version]
- Teng, M.; Zeng, L.; Xiao, W.; Huang, Z.; Zhou, Z.; Yan, Z.; Wang, P. Spatial variability of soil organic carbon in Three Gorges Reservoir area, China. Sci. Total Environ. 2017, 599–600, 1308–1316. [Google Scholar] [CrossRef]
- Iyama, W.A.; Okpara, K.; Techato, K. Assessment of heavy metals in agricultural soils and plant (Vernonia amygdalina delile) in port harcourt metropolis, Nigeria. Agriculture 2022, 12, 27. [Google Scholar] [CrossRef]
- Foli, G.; Nude, P.M. Concentration levels of some inorganic contaminants in streams and sediments in areas of pyrometallurgical and hydrometallurgical activities at the obuasi gold mine, Ghana. Environ. Earth Sci. 2012, 65, 753–763. [Google Scholar] [CrossRef]
- Thembachako, A.; Lancaster, S.T.; Raab, A.; Krupp, E.M.; Norton, G.J.; Feldmann, J. Science of the Total Environment Higher zero valent iron soil amendments dosages markedly inhibit accumulation of As in Faya and Kilombero cultivars compared to Cd. Sci. Total Environ. 2021, 794, 148735. [Google Scholar] [CrossRef]
- Smith, A.H.; Lingas, E.O.; Rahman, M. Contamination of drinking-water by arsenic in Bangladesh: A public health emergency. Bull. World Health Organ. 2000, 78, 1093–1103. [Google Scholar] [CrossRef]
- Wang, H.; Li, X.; Chen, Y.; Li, Z.; Hedding, D.W.; Nel, W.; Ji, J.; Chen, J. Geochemical behavior and potential health risk of heavy metals in basalt-derived agricultural soil and crops: A case study from Xuyi County, eastern China. Sci. Total Environ. 2020, 729, 139058. [Google Scholar] [CrossRef]
- Rai, U.N.; Pandey, K.; Sinha, S.; Singh, A.; Saxena, R.; Gupta, D.K. Revegetating fly ash landfills with Prosopis juliflora L.: Impact of different amendments and Rhizobium inoculation. Environ. Int. 2004, 30, 293–300. [Google Scholar] [CrossRef] [PubMed]
- Kao, T.; Mejahed, K.E.L.; Bouzidi, A. Evaluation de la pollution métallique dans les sols agricoles irrigués par les eaux usées de la ville de Settat (Maroc ). Bull. L’Inst. Sci. Rabat Sect. Sci. Vie 2007, 29, 89–92. [Google Scholar]
- Yang, J.; Lv, F.; Zhou, J.; Song, Y.; Li, F. Health risk assessment of vegetables grown on the contaminated soils in Daye City of Hubei Province, China. Sustainability 2017, 9, 2141. [Google Scholar] [CrossRef] [Green Version]
- Atibu, E.K.; Lacroix, P.; Sivalingam, P.; Ray, N.; Giuliani, G.; Mulaji, C.K.; Otamonga, J.-P.; Mpiana, P.T.; Slaveykova, V.; Poté, J. High contamination in the areas surrounding abandoned mines and mining activities: An impact assessment of the Dilala, Luilu and Mpingiri Rivers, Democratic Republic of the Congo. Chemosphere 2018, 191, 1008–1020. [Google Scholar] [CrossRef] [PubMed]
- Chen, T.; Liu, X.; Zhu, M.; Zhao, K.; Wu, J.; Xu, J.; Huang, P. Identification of trace element sources and associated risk assessment in vegetable soils of the urban-rural transitional area of Hangzhou, China. Environ. Pollut. 2008, 151, 67–78. [Google Scholar] [CrossRef]
- Yasuor, H.; Yermiyahu, U.; Ben-Gal, A. Consequences of irrigation and fertigation of vegetable crops with variable quality water: Israel as a case study. Agric. Water Manag. 2020, 242, 106362. [Google Scholar] [CrossRef]
- Kwon, S.-I.; Jang, Y.-A.; Owens, G.; Kim, M.-K.; Jung, G.-B.; Hong, S.-C.; Chae, M.-J.; Kim, K.-R. Long-term assessment of the environmental fate of heavy metals in agricultural soil after cessation of organic waste treatments. Environ. Geochem. Health 2014, 36, 409–419. [Google Scholar] [CrossRef]
- Akoto, O.; Bruce, T.N.; Darko, G. Heavy metals pollution profiles in streams serving the Owabi reservoir. Afr. J. Environ. Sci. Technol. 2008, 2, 354–359. [Google Scholar]
- Pekey, H. The distribution and sources of heavy metals in Izmit Bay surface sediments affected by a polluted stream. Mar. Pollut. Bull. 2006, 52, 1197–1208. [Google Scholar] [CrossRef]
- Oguntade, A.O.; Adetunji, M.T.; Arowolo, T.A.; Salako, F.K.; Azeez, J.O. Use of dye industry effluent for irrigation in Amaranthus cruentus L. production: Effect on growth, root morphology, heavy metal accumulation, and the safety concerns. Arch. Agron. Soil Sci. 2015, 61, 865–876. [Google Scholar] [CrossRef]
- Khalil, A.; Hanich, L.; Bannari, A.; Zouhri, L.; Pourret, O.; Hakkou, R. Assessment of soil contamination around an abandoned mine in a semi-arid environment using geochemistry and geostatistics: Pre-work of geochemical process modeling with numerical models. J. Geochem. Explor. 2013, 125, 117–129. [Google Scholar] [CrossRef]
- Abuzaid, M.M.; Elshami, W.; Tekin, H.; Issa, B. Assessment of the Willingness of Radiologists and Radiographers to Accept the Integration of Arti fi cial Intelligence Into Radiology Practice. Acad. Radiol. 2020, 29, 87–94. [Google Scholar] [CrossRef]
- Inyinbor, A.A.; Bello, O.S.; Oluyori, A.P.; Inyinbor, H.E.; Fadiji, A.E. Wastewater conservation and reuse in quality vegetable cultivation: Overview, challenges and future prospects. Food Control 2019, 98, 489–500. [Google Scholar] [CrossRef] [Green Version]
- Aboubakar, A.; El Hajjaji, S.; Douaik, A.; Mewouo, Y.C.M.; a Madong, R.C.B.; Dahchour, A.; Mabrouki, J.; Labjar, N. Heavy metal concentrations in soils and two vegetable crops (Corchorus olitorius and Solanum nigrum L.), their transfer from soil to vegetables and potential human health risks assessment at selected urban market gardens of Yaoundé, Cameroon. Int. J. Environ. Anal. Chem. 2021, 1–22. [Google Scholar] [CrossRef]
- Seid-Mohammadi, A.; Roshanaei, G.; Asgari, G. Heavy metals concentration in vegetables irrigated with contaminated and fresh water and estimation of their daily intakes in Suburb areas of Hamadan, Iran. J. Res. Health Sci. 2014, 14, 70–75. [Google Scholar]
- Cheyns, K.; Nkulu, C.B.L.; Ngombe, L.K.; Asosa, J.N.; Haufroid, V.; De Putter, T.; Nawrot, T.; Kimpanga, C.M.; Numbi, O.L.; Ilunga, B.K.; et al. Pathways of human exposure to cobalt in Katanga, a mining area of the D.R. Congo. Sci. Total Environ. 2014, 490, 313–321. [Google Scholar] [CrossRef]
- Arukwe, A.; Eggen, T.; Möder, M. Solid waste deposits as a significant source of contaminants of emerging concern to the aquatic and terrestrial environments—A developing country case study from Owerri, Nigeria. Sci. Total Environ. 2012, 438, 94–102. [Google Scholar] [CrossRef]
- Antoniadis, V.; Shaheen, S.M.; Boersch, J.; Frohne, T.; Laing, G.D.; Rinklebe, J. Bioavailability and risk assessment of potentially toxic elements in garden edible vegetables and soils around a highly contaminated former mining area in Germany. J. Environ. Manag. 2017, 186, 192–200. [Google Scholar] [CrossRef]
- Tahir, M.A.; Shaheen, H.; Rathinasabapathi, B. Health risk associated with heavy metal contamination of vegetables grown in agricultural soil of Siran valley, Mansehra, Pakistan—A case study. Environ. Monit. Assess. 2022, 194, 551. [Google Scholar] [CrossRef] [PubMed]
- Sharma, R.K.; Agrawal, M.; Marshall, F.M. Heavy metal (Cu, Zn, Cd and Pb) contamination of vegetables in urban India: A case study in Varanasi. Environ. Pollut. 2008, 154, 254–263. [Google Scholar] [CrossRef] [PubMed]


| Market Gardens | Habitat Description | Sources of Pollution in Gardens |
|---|---|---|
| Bongonga | Mining Effluents/Dump sites | Kafubu River Middle |
| Chem-chem | Mining effluents/MET-rich subsoil | Kafubu River Downstream |
| Daipen/Kashamata | Mining Effluents/Dumpsites | Kafubu River Upstream |
| Kabetsha | Mining Effluents/Dumpsites | Tshamilemba River |
| Kafubu | Mining effluents/MET-rich subsoil | Kafubu River Middle |
| Kalebuka | Mining Effluents/Dumpsites | Kafubu River Middle |
| Kalubwe | Mining Effluents/Dumpsites | Middle Lubumbashi River |
| Kalulako | Mining effluents/MET-rich subsoil | Kafubu River Downstream |
| Kamakanga | Metal-rich subsoil | Kafubu River Middle |
| Kamatete | TME-rich subsoil/Mining effluents | Lubumbashi River Upstream |
| Kamilombe | Mining effluents/MET-rich subsoil | Kafubu River Downstream |
| Kamisepe | Mining Effluents | Lubumbashi River Upstream |
| Kantumbwi | Mining Effluents/Dumpsites | Middle Lubumbashi River |
| Kasungami | Mining Effluents/Dumpsites | Kafubu River Upstream |
| Katemo | Effluents miniers/Metal-rich subsoil | Kafubu River Downstream |
| Kawama | MTE-rich subsoil | Kafubu River Downstream |
| Kikula/Sambwa | Metal-rich subsoil | Kafubu River Downstream |
| Kilobelobe | Mining Effluents/Dumpsites | Kafubu River Middle |
| Kinsense | Mining Effluents/Dumpsites | Tshamilemba River |
| Kinsevere (Manoah) | Effluents miniers/Metal-rich subsoil | Kiswishi River |
| Kitanda | TME-rich subsoil/Mining effluents | Kafubu River Downstream |
| Luano | MTE-rich subsoil | Luano River |
| Maendeleo | Dumpsites | Well |
| Mashimikila | Effluents/Metal-rich subsoil | Kafubu River Downstream |
| Mwenda | Metal-rich subsoil | Kafubu River Downstream |
| Penga-penga | Mining effluents/MET-rich subsoil | Régideso |
| Tingi-Tingi | Mining Effluents/Dumpsites | Tingitingi River |
| Tshamalale | Mining Effluents/Dumpsites | Lubumbashi River Upstream |
| Tshamilemba | Mining Effluents/Dumpsites | Tshamilemba River |
| Contamination Source Categories | Fe | Cd | Cu | Pb | Cr | Zn |
|---|---|---|---|---|---|---|
| Kafubu River Middle | 2.762 ± 0.94 a | 47.2 ± 94.40 a | 170.6 ± 104.66 a | 9.6 ± 19.20 a | 35.8 ± 31.68 a | 118.4 ± 98.96 a |
| Kafubu River Downstream | 3.092 ± 1.27 a | 13.33 ± 20.88 a | 293.82 ± 297.82 a | 44.22 ± 67.18 a | 31.44 ± 29.26 a | 234.61 ± 254.27 a |
| Kafubu River Upstream | 2.24 ± 0.33 a | 0.00 ± 0.00 a | 266.33 ± 165.59 a | 68.00 ± 82.43 a | 49.66 ± 5.24 a | 169.00 ± 169.94 a |
| Tshamilemba River | 2.78 ± 0.66 a | 0.00 ± 0.00 a | 144.66 ± 92.17 a | 11.33 ± 16.03 a | 32.00 ± 22.76 a | 70.33 ± 46.58 a |
| Middle Lubumbashi River | 3.69 ± 1.36 a | 13.33 ± 18.86 a | 359.33 ± 351.5 a | 0.00 ± 0.00 a | 51.00 ± 5.10 a | 126.33 ± 123.83 a |
| Lubumbashi River Upstream | 2.71 ± 0.69 a | 0.00 ± 0.00 a | 154.66 ± 74.02 a | 8.66 ± 12.26 a | 21.00 ± 29.70 a | 81.66 ± 42.90 a |
| Effects of sources of contamination (p-value) | 0.74 | 0.738 | 0.74 | 0.455 | 0.598 | 0.995 |
| Market Gardens | Contamination Factor | Enrichment Factor | Soil Pollution Index (PLI) | |||||
|---|---|---|---|---|---|---|---|---|
| Fe | Cu | Pb | Zn | Cu | Pb | Zn | ||
| Bongonga | 0.45 | 0.13 | 0 | 0.17 | 0.29 | 0 | 0.37 | 0.21 |
| Chem-Chem | 0.55 | 2.97 | 2.69 | 8.17 | 5.4 | 4.87 | 14.82 | 2.45 |
| Daipen/Kashamata | 0.29 | 0.45 | 0.24 | 0.33 | 1.56 | 0.84 | 1.16 | 0.32 |
| Kafubu | 0.32 | 0.32 | 0 | 1.01 | 1.01 | 0 | 3.18 | 0.47 |
| Kabetsha | 0.3 | 0.25 | 0 | 0.23 | 0.84 | 0 | 0.79 | 0.26 |
| Kalebuka | 0.15 | 0.5 | 0 | 0.29 | 3.28 | 0 | 1.95 | 0.28 |
| Kalubwe | 0.67 | 1.87 | 0 | 1.67 | 2.78 | 0 | 2.49 | 1.28 |
| Kalulako | 0.25 | 0.52 | 0 | 0.47 | 2.11 | 0 | 1.9 | 0.4 |
| Kamakanga | 0.45 | 0.17 | 0 | 0.24 | 0.38 | 0 | 0.54 | 0.27 |
| Kamatete | 0.37 | 0.11 | 0 | 0.19 | 2.52 | 0 | 6.96 | 1.49 |
| Kamilombe | 0.57 | 1.44 | 0 | 3.98 | 1.81 | 0 | 1.61 | 0.36 |
| Kamisepe | 0.25 | 0.46 | 0 | 0.41 | 0.4 | 0 | 0.64 | 0.16 |
| Kantumbwi | 0.24 | 0.1 | 0 | 0.16 | 0.87 | 0 | 0.82 | 0.23 |
| Kasungami | 0.26 | 0.22 | 0 | 0.21 | 0.28 | 0 | 0.45 | 0.22 |
| Katemo | 0.44 | 0.12 | 0 | 0.19 | 2.32 | 0.84 | 2.58 | 0.85 |
| Kawama | 0.56 | 1.31 | 0.47 | 1.46 | 2.08 | 1.03 | 2.31 | 0.32 |
| Kikula/Sambwa | 0.21 | 0.44 | 0.22 | 0.49 | 1.51 | 1.16 | 3.15 | 0.77 |
| Kilobelobe | 0.5 | 0.76 | 0.58 | 1.58 | 1.19 | 0.83 | 1.51 | 0.55 |
| Kinsense | 0.5 | 0.59 | 0.41 | 0.76 | 0.26 | 0.22 | 0.48 | 1.84 |
| Kinsevere (Manoah) | 4.52 | 1.17 | 0.98 | 2.19 | 2.71 | 0.85 | 5.41 | 1.26 |
| Kitanda | 0.67 | 1.81 | 0.57 | 3.62 | 1.39 | 1.78 | 3.05 | 0.91 |
| Luano | 0.55 | 0.76 | 0.97 | 1.67 | 2.97 | 6.13 | 6.23 | 1.19 |
| Maendeleo | 0.36 | 1.08 | 2.24 | 2.27 | 6.89 | 2.67 | 3.85 | 0.96 |
| Mashimikila | 0.33 | 2.29 | 0.89 | 1.28 | 0.84 | 0 | 1.35 | 0.18 |
| Mwenda | 0.17 | 0.14 | 0 | 0.23 | 0.69 | 0 | 0.48 | 0.4 |
| Pengapenga | 0.58 | 0.4 | 0 | 0.28 | 1.01 | 0 | 1.06 | 0.36 |
| Tingi-Tingi | 0.35 | 0.35 | 0 | 0.37 | 0.3 | 0 | 0.51 | 0.2 |
| Tshamalale | 0.48 | 0.45 | 0.32 | 0.77 | 0.94 | 0.66 | 1.6 | 0.48 |
| Tshamilemba | 0.33 | 0.11 | 0 | 0.18 | 0.34 | 0 | 0.55 | 0.19 |
| Market Gardens | Cd | Cu | Pb | Co | As | Fe | Zn |
|---|---|---|---|---|---|---|---|
| Daipen Kisanga | 0.003 | 0.012 | 0 | 0.012 | 0 | 0.316 | 0 |
| Kafubu | 0.001 | 3.01 | 0.028 | 0.006 | 0 | 0.381 | 0 |
| Kalanda | 0.002 | 2.51 | 0.049 | 0.012 | 0.02 | 1.175 | 0.002 |
| Kalebuka | 0.248 | 9.25 | 0.451 | 0.86 | 0 | 4.601 | 10.16 |
| Kalubwe | 0.002 | 0.019 | 0 | 0.007 | 0 | 0.782 | 0 |
| Kalulako | 0.001 | 0.129 | 0.038 | 0.018 | 0.027 | 0.185 | 0.065 |
| Kamakanga | 0 | 0.009 | 0.116 | 0.012 | 0 | 0.154 | 0 |
| Kamasaka | 0.002 | 0.014 | 0.017 | 0.007 | 0.022 | 0.144 | 0 |
| Kamisepe | 0.002 | 0.009 | 0.045 | 0.006 | 0.034 | 0.146 | 0 |
| Kasungami | 0.004 | 0.022 | 0.012 | 0.01 | 0.046 | 0.182 | 0.002 |
| Katemo | 0.002 | 0.011 | 0 | 0.008 | 0 | 0.097 | 0 |
| Kawama | 0.003 | 0.008 | 0.052 | 0.01 | 0 | 0.032 | 0 |
| Kinsense | 0 | 0.026 | 0.032 | 0.019 | 0.059 | 0.217 | 0.043 |
| Kitanda | 0.002 | 0.009 | 0 | 0.008 | 0.085 | 0.529 | 0.002 |
| Maendeleo | 0 | 0.019 | 0.043 | 0.011 | 0.07 | 0.242 | 0.028 |
| Mashimikila | 0.001 | 0.033 | 0.038 | 0.01 | 0 | 2.432 | 0.013 |
| Penga-Penga | 0.004 | 0.007 | 0.06 | 0.009 | 0 | 0 | 0 |
| Sambwa | 0.002 | 0.007 | 0.048 | 0.002 | 0 | 0.019 | 0 |
| Tingi-Tingi | 0 | 0.02 | 0 | 0.007 | 0 | 0.203 | 0.023 |
| Tshamalale | 0.002 | 0.035 | 0 | 0.005 | 0 | 1.238 | 0.017 |
| Tshamilemba | 0.001 | 2.031 | 0.048 | 0.005 | 0.008 | 0.011 | 0 |
| Toxicity threshold (mg/L) | 0.003 | 2 | 0.01 | 0.05 | 0.1 | 0.1 | 2 |
| Plant Species | Co | Cd | Pb | Cu |
|---|---|---|---|---|
| Amaranthus vulgarus | 4.41 ± 4.15 a | 3.11 ± 3.56 a | 1.27 ± 0.94 a | 51.94 ± 61.17 a |
| Brassica chinensis | 4.18 ± 2.65 a | 2.03 ± 1.86 a | 2.82 ± 2.94 a | 44.93 ± 31.03 a |
| Spinacia oleracea | 5.51 ± 11.48 a | 1.25 ± 1.53 a | 0.96 ± 1.22 a | 21.25 ± 26.62 a |
| Brassica carinata | 9.46 ± 18.33 a | 0.82 ± 0.79 a | 1.57 ± 2.49 a | 27.53 ± 33.28 a |
| Species effects (p-value) | 0.834 | 0.518 | 0.685 | 0.502 |
Disclaimer/Publisher’s Note: The statements, opinions and data contained in all publications are solely those of the individual author(s) and contributor(s) and not of MDPI and/or the editor(s). MDPI and/or the editor(s) disclaim responsibility for any injury to people or property resulting from any ideas, methods, instructions or products referred to in the content. |
© 2023 by the authors. Licensee MDPI, Basel, Switzerland. This article is an open access article distributed under the terms and conditions of the Creative Commons Attribution (CC BY) license (https://creativecommons.org/licenses/by/4.0/).
Share and Cite
Mununga Katebe, F.; Raulier, P.; Colinet, G.; Ngoy Shutcha, M.; Mpundu Mubemba, M.; Jijakli, M.H. Assessment of Heavy Metal Pollution of Agricultural Soil, Irrigation Water, and Vegetables in and Nearby the Cupriferous City of Lubumbashi, (Democratic Republic of the Congo). Agronomy 2023, 13, 357. https://doi.org/10.3390/agronomy13020357
Mununga Katebe F, Raulier P, Colinet G, Ngoy Shutcha M, Mpundu Mubemba M, Jijakli MH. Assessment of Heavy Metal Pollution of Agricultural Soil, Irrigation Water, and Vegetables in and Nearby the Cupriferous City of Lubumbashi, (Democratic Republic of the Congo). Agronomy. 2023; 13(2):357. https://doi.org/10.3390/agronomy13020357
Chicago/Turabian StyleMununga Katebe, Félicien, Pierre Raulier, Gilles Colinet, Mylor Ngoy Shutcha, Michel Mpundu Mubemba, and M. Haïssam Jijakli. 2023. "Assessment of Heavy Metal Pollution of Agricultural Soil, Irrigation Water, and Vegetables in and Nearby the Cupriferous City of Lubumbashi, (Democratic Republic of the Congo)" Agronomy 13, no. 2: 357. https://doi.org/10.3390/agronomy13020357