Article

Efficiency of Fungicide Application an Using an Unmanned Aerial Vehicle and Pneumatic Sprayer for Control of Hemileia vastatrix and Cercospora coffeicola in Mountain Coffee Crops

by
Edney Leandro da Vitória
1,2,*,
Cesar Abel Krohling
3,
Felipe Ruela Pereira Borges
4,
Luis Felipe Oliveira Ribeiro
1,
Maria Eduarda Audizio Ribeiro
1,2,
Pengchao Chen
5,
Yubin Lan
5,
Shizhou Wang
5,
Hugo Marcus Fialho e Moraes
6 and
Marconi Ribeiro Furtado Júnior
6
1
Department of Agricultural and Biological Sciences (DCAB), Federal University of Espirito Santo (UFES), São Mateus CEP 29932-510, ES, Brazil
2
Postgraduate Program in Tropical Agriculture (PPGAT), Federal University of Espirito Santo, São Mateus CEP 29932-510, ES, Brazil
3
Capixaba Research Institute Technical Assistance and Rural Extension (Incaper), Vitória CEP 29052-010, ES, Brazil
4
Syngenta Crop Protection, São Paulo CEP 04730-000, SP, Brazil
5
National Center for International Collaboration Research on Precision Agricultural Aviation Pesticides Spraying Technology, College of Electronic Engineering and Artificial Intelligence, South China Agricultural University, Guangzhou 510642, China
6
Department of Agricultural Engineering, Federal University of Viçosa, Viçosa CEP 36510-000, MG, Brazil
*
Author to whom correspondence should be addressed.
Agronomy 2023, 13(2), 340; https://doi.org/10.3390/agronomy13020340
Submission received: 15 December 2022 / Revised: 13 January 2023 / Accepted: 16 January 2023 / Published: 24 January 2023

Abstract

:
Coffee production and marketing is one of the main global commercial activities, but crop yields depend on several factors, among which plant health. The objective of this study was to evaluate the efficiency of spray droplet deposition in coffee crops grown in a mountain region, associated to the efficacy of the control of fungal diseases. The application efficiency, using an unmanned aerial vehicle (UAV), and the efficacy of the products applied were tested. Water-sensitive paper tags were used to analyze the application efficiency; agronomic efficiency, vegetative vigor, yield, and physiological parameters were used to determine the fungicide efficacy. Droplet coverage in the upper canopy layer using a pneumatic sprayer (28.70%) was 4.11-fold higher than that found in the same layer for application using a UAV (6.98%) at the rate of 15 L ha−1. The highest droplet depositions by using a UAV were found for the rate of 15 L ha−1: 1.60, 1.04, and 0.43 µL cm−2 in the upper, middle, and lower layers, respectively; the deposition in the upper layer with application using a pneumatic sprayer was 42.67 µL cm−2, and therefore, a 26.7-fold higher deposition. The results denote that the control of fungal diseases through fungicide applications using a UAV is efficient for mountain coffee crops.

1. Introduction

Coffee is one of the most important food commodities and is the second most marketed commodity in the world, after crude petroleum [1]. The global coffee production in the 2021/2022 crop season was approximately 167.5 million bags (60 kg), of which 77.9 million are Coffea canephora (robusta + conilon), with an estimated increase of 11% for the 2022/2023 crop season [2,3,4]. However, increasing coffee production to meet the increasing demand of the world market has been a challenge for coffee growers. The yield of coffee crops depends on several factors, such as climate changes, genetic and nutritional developments, water availability and use efficiency, and plant health protection. Regarding plant health protection, there were significant advances in the technological development of selectivity and efficacy of pesticides; however, the pesticide application technology connected to this development did not follow the same pace, and in the specific case of coffee crops, pesticide applications have usually been inefficient [5,6]. The pesticide application technology for coffee crops should be well managed to avoid losses of product to non-target areas; therefore, the target position, architecture of coffee plants, climate conditions, nozzle positioning, and regulation and calibration of sprayers should be considered [7,8].
A review study presented the main fungal diseases that occur in coffee crops worldwide [9,10,11], highlighting two main diseases reported in mountain coffee crops: leaf rust and cercosporiosis. Mountain coffee crops represents 80.0% of the world coffee crops. Although Brazil has the highest mechanized coffee area in the world, approximately 40.0% of the coffee crops, species Coffeea arabica and Coffeea canephora are produced in mountains [1,2]. In these regions, plant health protection is highly hindered by difficulties in traffic of machines and implements, which makes mechanized spray operations expensive or unviable. The methods commonly used for plant health protection in coffee crops include the use of backpack sprayers, atomizers, and hydro-pneumatic and pneumatic sprayers. The limitations of these options are scarcity of specialized workers, limited operational capacity, low application efficiency, and excessive application rates; these combined factors result in losses of product to the soil, and environmental and human contaminations [12,13].
The market of agrochemical application technology using an unmanned aerial vehicle (UAV) has strongly grown in the last five years in Latin America, mainly in Brazil, where approximately 2500 UAV sprayers are currently in operation, with an estimate of 10,000 UAV for 2028 [14]. Thus, the question to be answered is that whether UAV can be an alternative and economically viable technique for spraying pesticides on mountain coffee crops. The answer to this question depends on the investigation of operational parameters of UAV, such as the application rate, operational flight speed and height, and droplet positioning and distribution on the crop canopy. Experimental applications using a UAV for spraying pesticides on specific crops are found in scientific articles, with applications to grass crops, such as rice [15,16], wheat [17,18], maize [19], and sugarcane [20], and to shrub and arboreal crops, such as cotton [21], peach [22], apple [23], citrus [24,25], and coffee [5,8]. These experimental applications to coffee crops are limited to operational aspects, disregarding the efficacy of possible pesticides in the applications.
Therefore, these studies are a few examples of experimental research using a UAV as a sprayer. In this sense, other crops have potential for using a UAV, and those that are little researched show a need for studying different operational situations and crop characteristics, such as coffee crops. Studies on the efficiency of pesticide application using a UAV and on the efficacy of the products applied present advantages for the preventive control of pests and diseases [15,16,17,18,26]. The density and deposition of droplets on the lower layers of the plant canopy is equivalent to approximately one third of that deposited in the upper layer, regardless of the rate applied using a UAV [5,15,19,27]. In the case of fungal diseases in middle and upper canopy layers, applications using a UAV have an efficient effect on the control [15]; therefore, fungal diseases as coffee leaf rust and cercosporiosis can be controlled using the same application process. However, when the control of pests and diseases in lower canopy layers is required, the application efficiency and the product efficacy can be hindered due to the need for droplets of smaller diameters to obtain sufficient density and deposition [15].
Experimental studies on operational parameters of UAV sprayers and their effects on droplet coverage, density, diameter, deposition, and penetration have presented good progress. The most studied operational parameters of UAV sprayers are flight speed and height. Significant effects of UAV operational flight speed and height on deposition of droplets on canopies of rice, cotton, and coffee plants have been found [5,8,19,27]. The ideal operational parameters for applications using a UAV to sugarcane crops are a flight height of 3.0 m, flight speed of 4 m s−1, and application rate of 15 L ha−1; this combination of parameters resulted in the best mean droplet density, uniformity, and deposition [21]. The application rates affect coverage, density, deposition, and diameter of the droplets deposited; high rates increase the amount and quality of these parameters [21,27]. A study on the effects of plant canopy and architecture of different genotypes of Coffea canephora and flight height showed significant effects, and the mean height of 2.0 m above the crop canopy presented the best results to ensure a good droplet distribution on the canopy of coffee plants from different genotypes [5].
The lack of specific information on pesticide applications using a UAV to coffee crops denotes the need for testing the following hypotheses: (a) the efficacy of fungicide applications using a UAV to mountain coffee crops is dependent on the choice of an adequate application rate; (b) the distribution of spray droplets on the coffee plant canopy using a UAV is sufficient for efficiently controlling leaf rust and cercosporiosis. Therefore, the objective of this study was to evaluate the efficiency of spray droplet deposition in coffee crops grown in a mountain region, associated to efficacy of controlling the fungal diseases leaf rust and cercosporiosis.

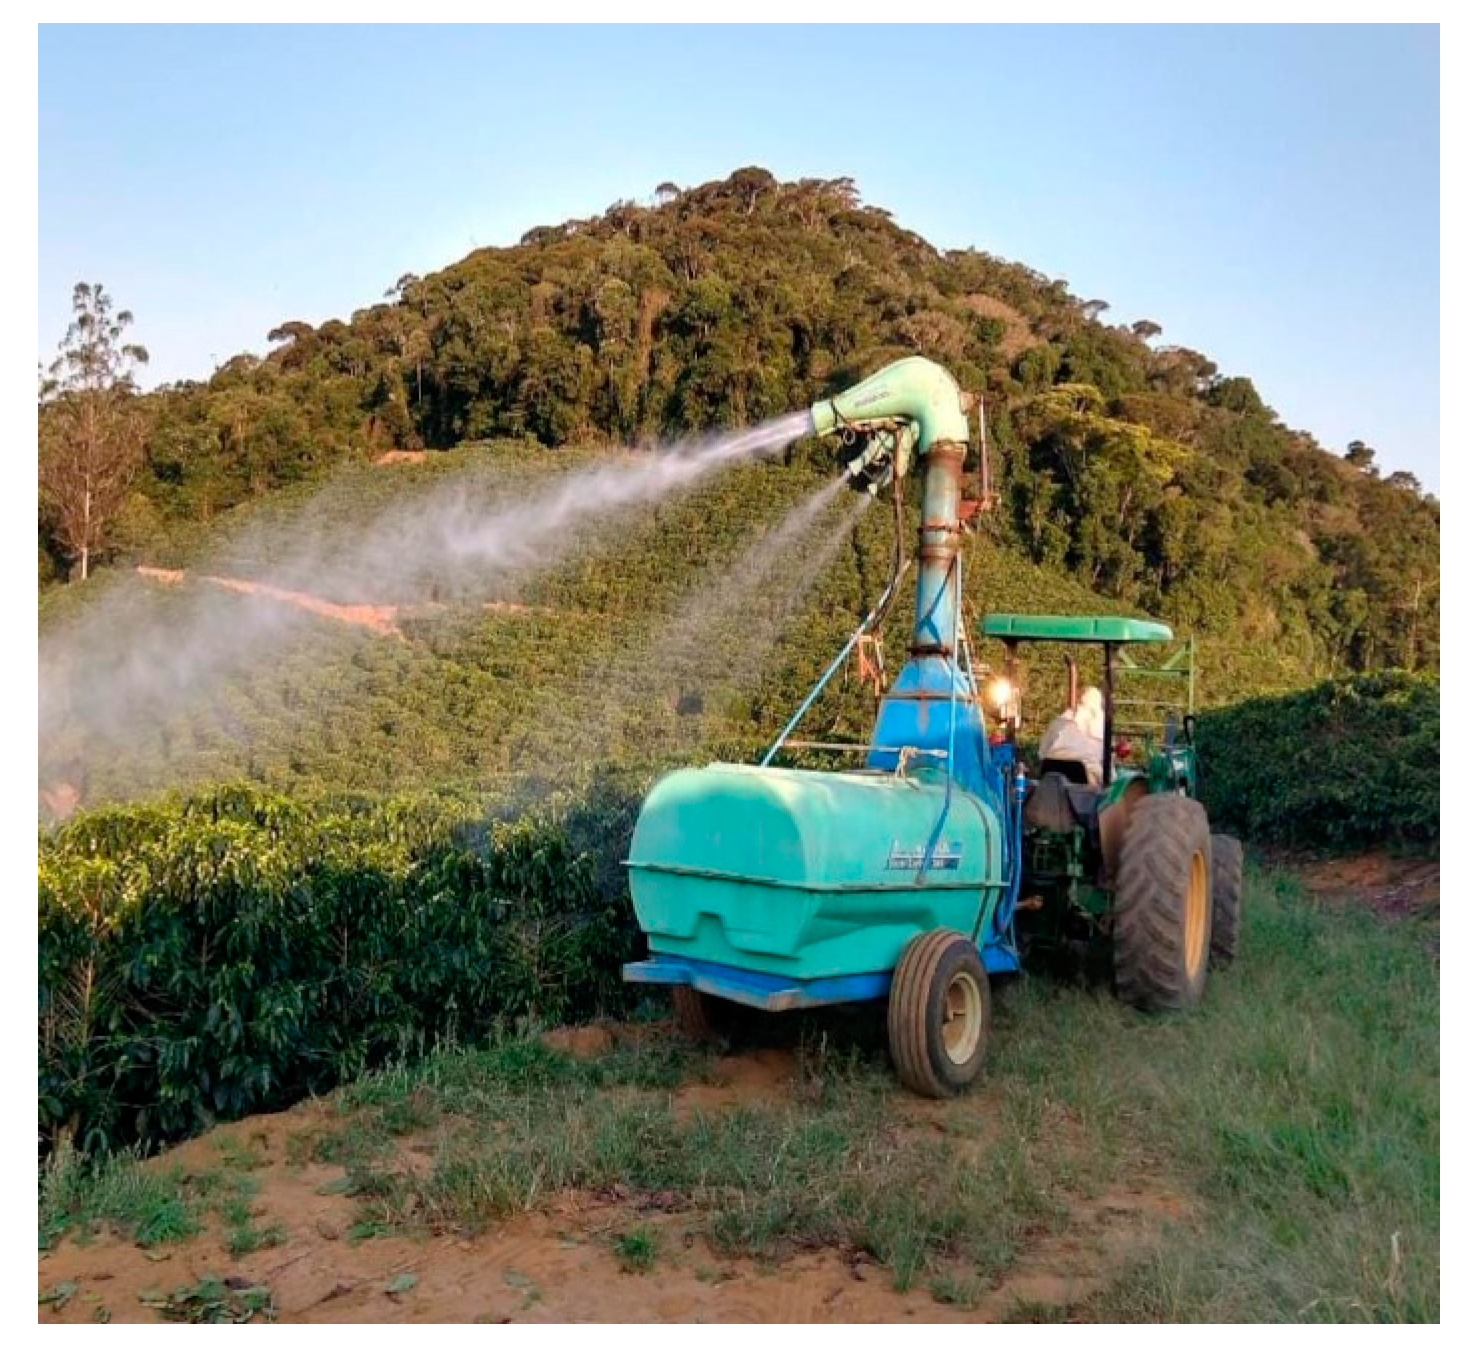
2. Materials and Methods

2.1. Characterization of the Area and the Experimental Crop

The experiment was implemented, conducted, and evaluated in a property in Marechal Floriano, state of Espirito Santo, Brazil, within the following UTM coordinates: 315,737.47 m latitude, 7,738,468.05 m longitude, and altitude of approximately 720 m. The property has been approved as an experimental area by the Brazilian Ministry of Agriculture, Livestock, and Food Supply (MAPA) for the development of research on coffee crops in mountain regions. The predominant climate in Marechal Floriano, a mountain region of the state of Espirito Santo, is temperate, according to the Köppen classification, with a mean temperature of 21.5 °C in the hottest month.
The experimental crop was composed of coffee arabica plants (Coffea arabica L.) of the cultivar Catuai Vermelho IAC-44, planted with spacing of 2.0 m between rows and 1.0 m between plants, totaling a stand of 5000 plants per hectare. The crop age at the time of the experiment was six years and the mean height of plants was 1.90 m. The crop was subjected to stumping in October, 2018, and the pruning system for production consisted of growth of two fully developed and healthy stems per plant.

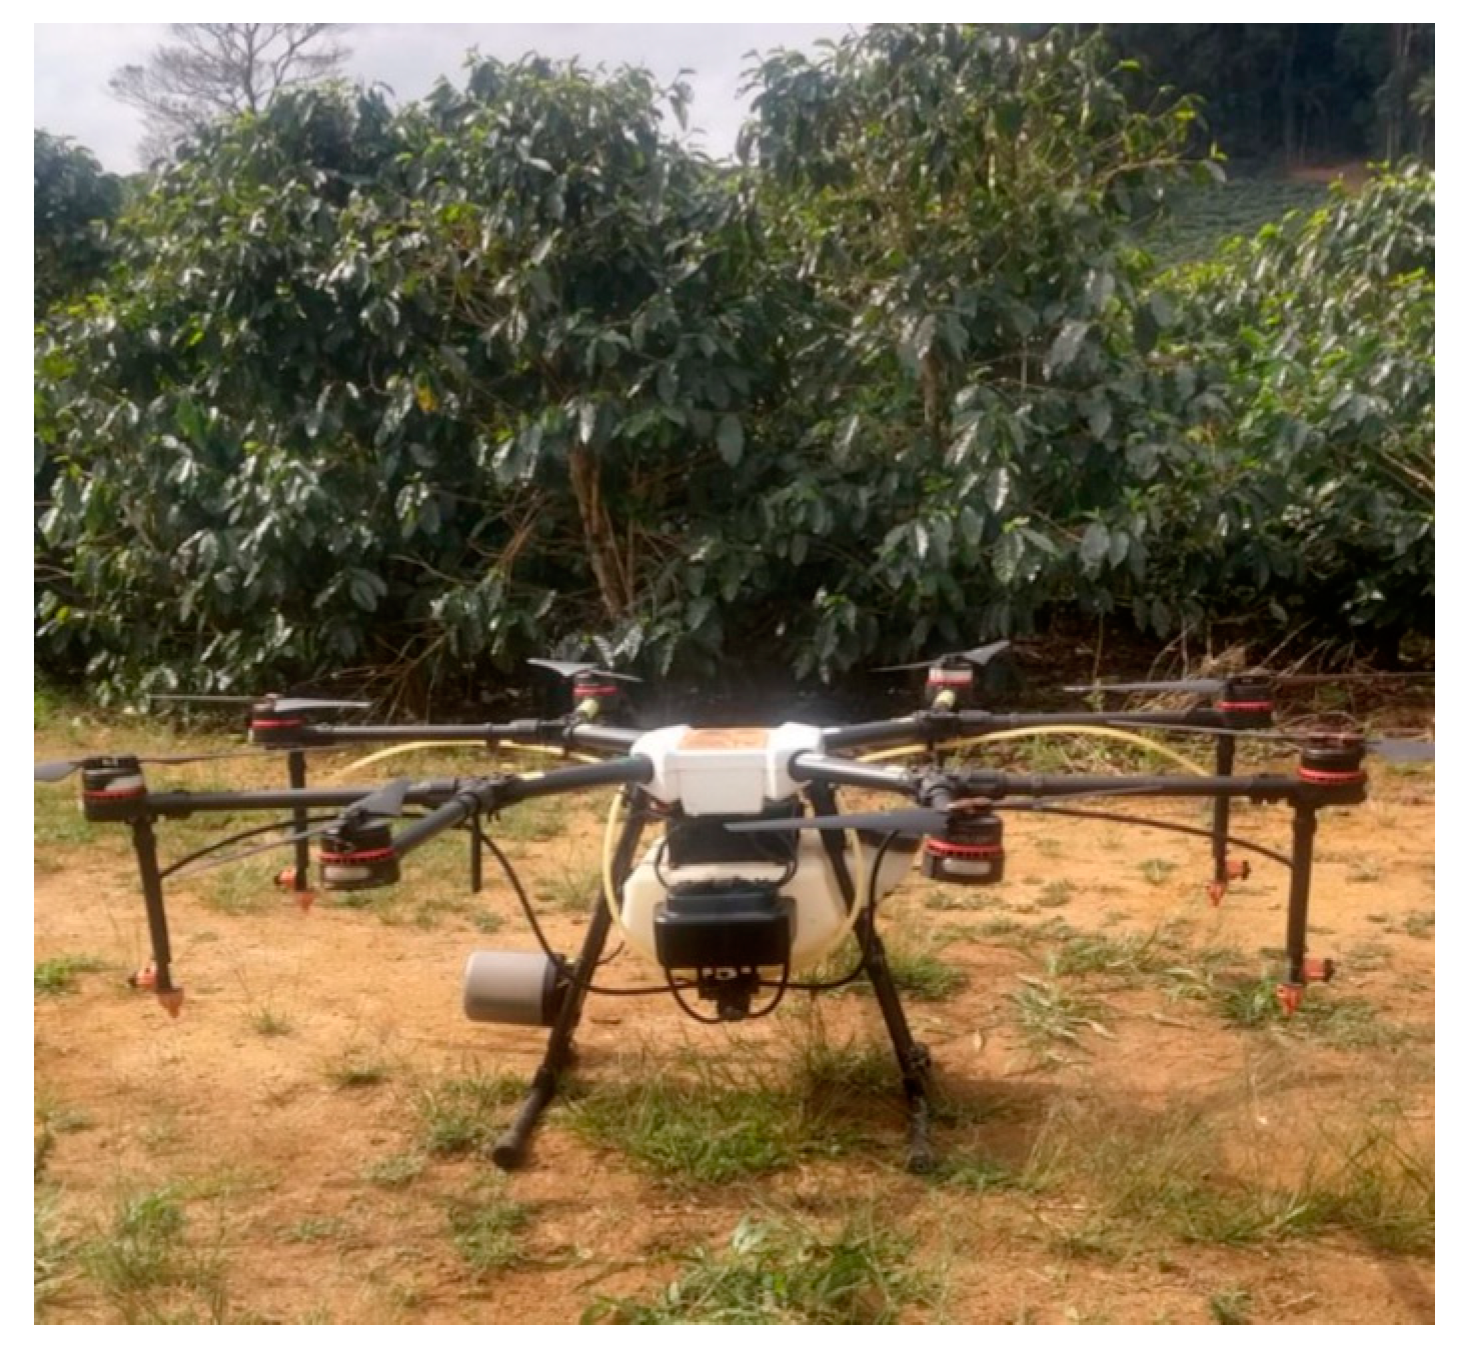
2.2. Characterization of the Unmanned Aerial Vehicle

The unmanned aerial vehicle (UAV) used was a model AGRAS MG-1P (DJI, SZ DJI Technology Co., Ltd., Shenzhen, China), with a 10-liter spray tank, adapted and regulated for spraying coffee crops (Figure 1).
In addition to the spray tank for the products, the UAV was equipped with a water pump, piping circuit for liquid circulation, flat fan spray nozzle with a mean flow of 0.379 L min−1 at 3.0 bar pressure (TeeJet Technologies, Springfield, IL, USA), electronic valve control, and other components. Four spray nozzles were distributed equidistantly and perpendicularly to the aircraft axis, spaced at 0.75 m. The main specifications are listed in Table 1.

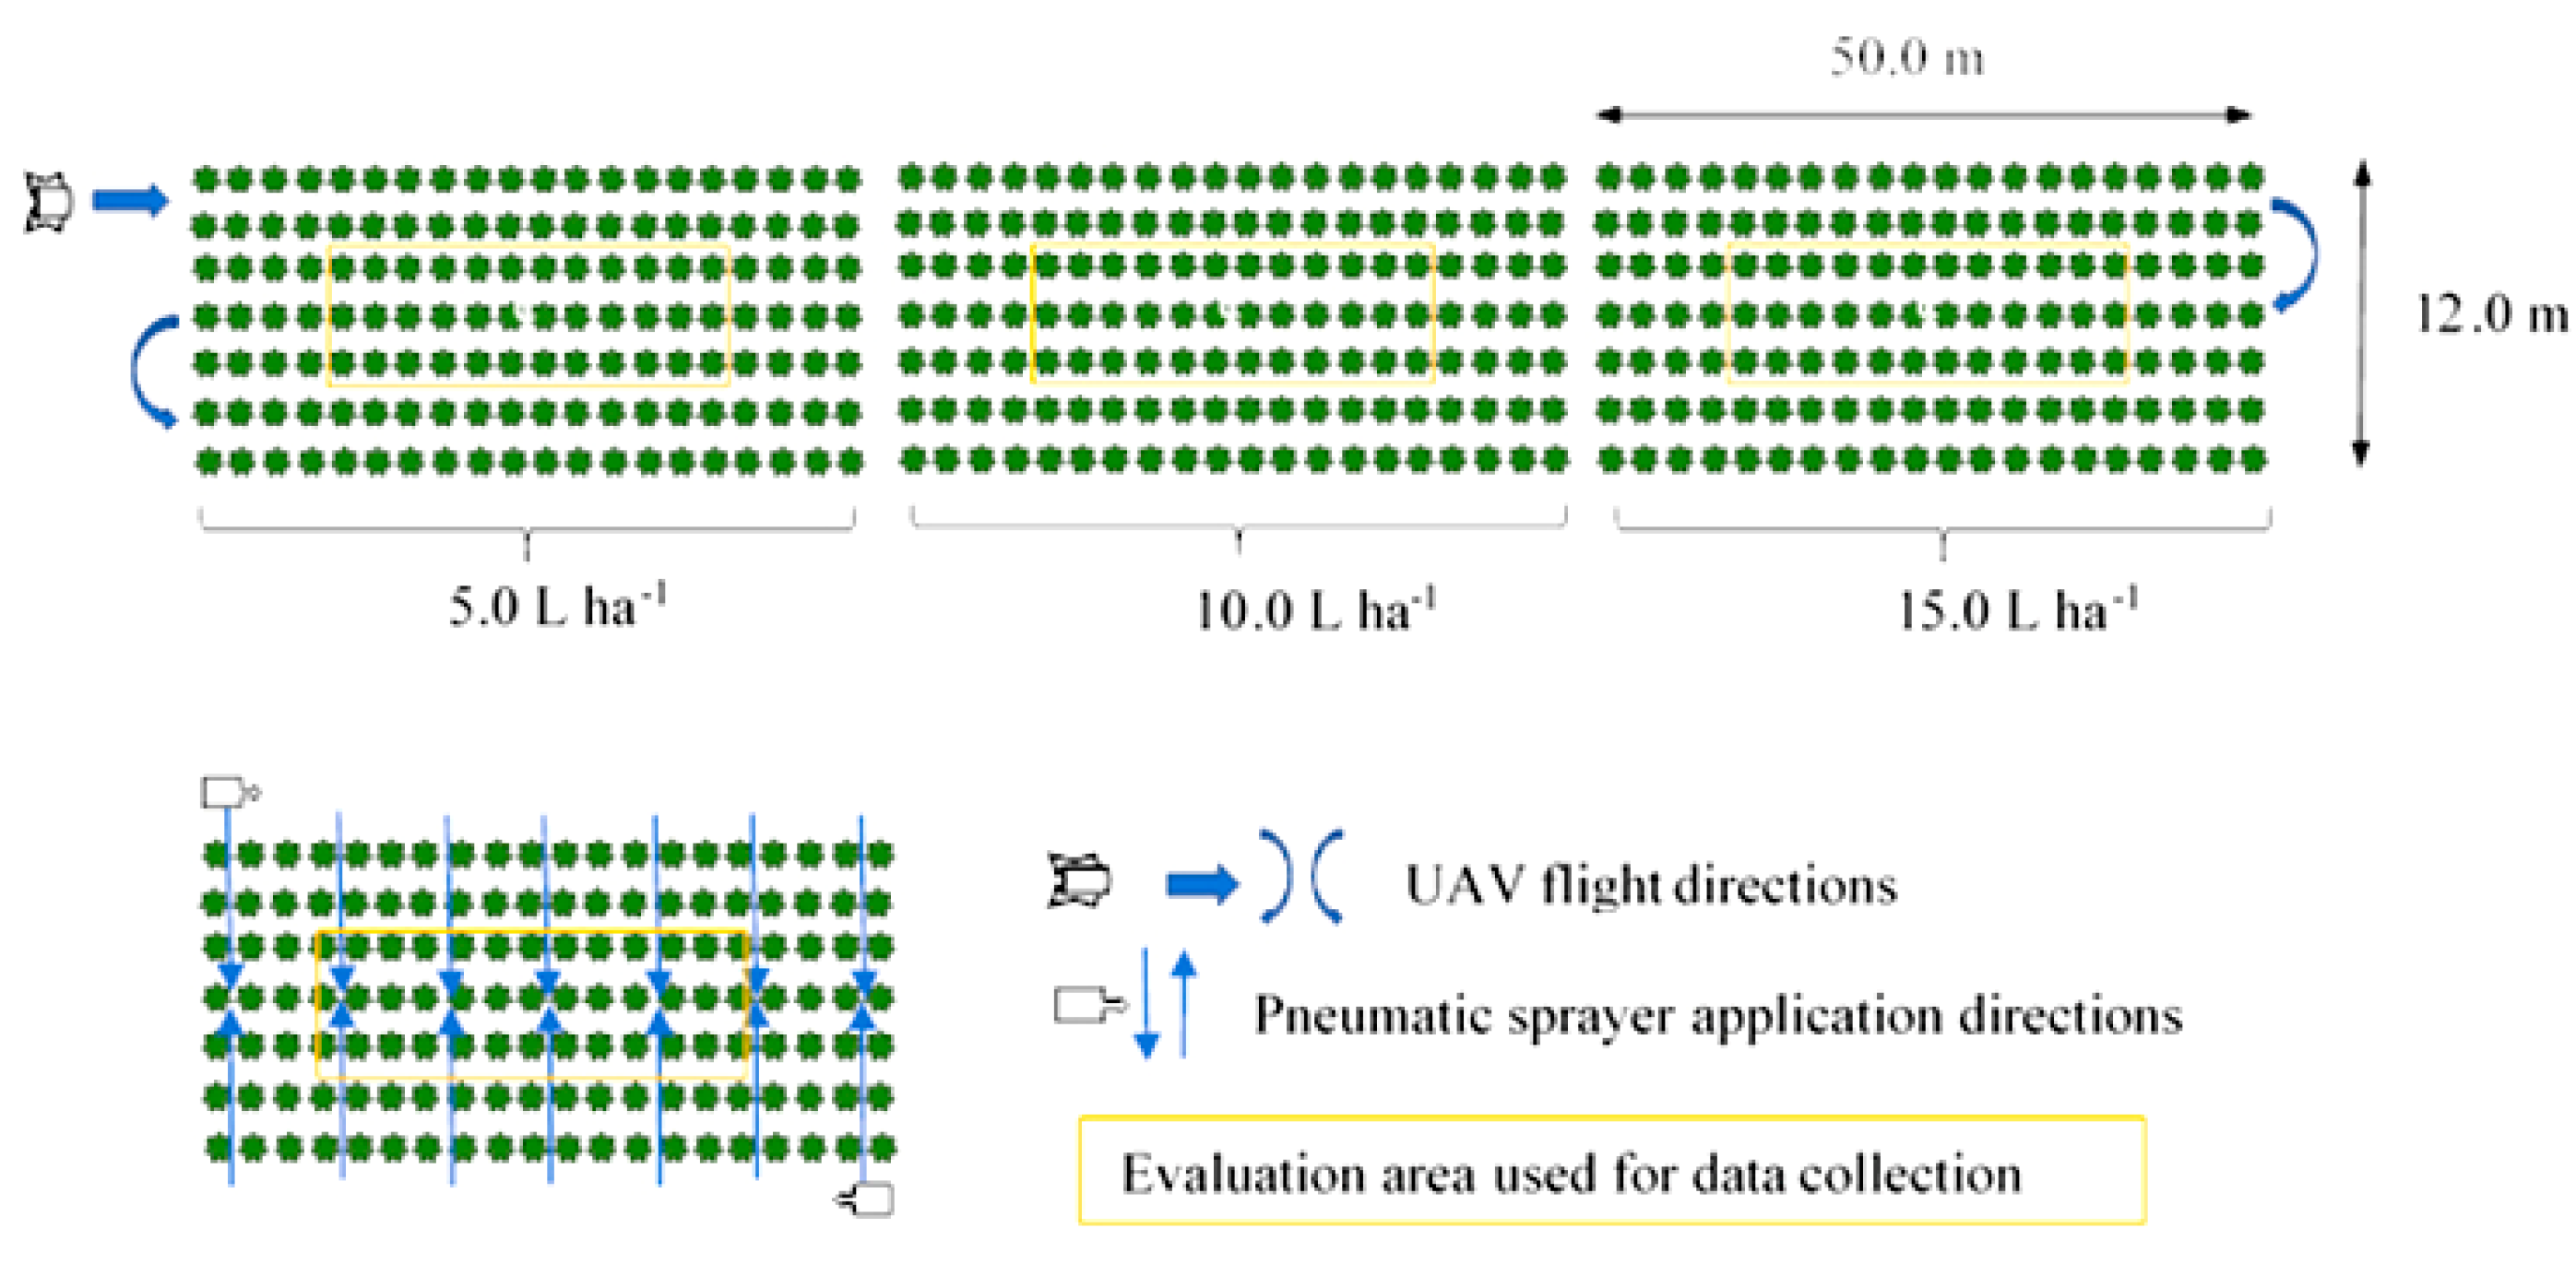
2.3. Experimental Design

Data of variables related to the application quality (droplet coverage, density, and deposition) were collected and statistically analyzed based on a randomized block experimental design, with treatments distributed into a 3 × 3 + 1 factorial arrangement, consisted of three application rates using a UAV (5, 10, and 15 L ha−1), three deposition heights on the canopy of plants (upper, middle, and lower layers), and an additional treatment (control) based on the local standard application using a pneumatic sprayer (Khun Montana, model AF 2000 CAFE, São Paulo, SP, Brazil), with a 2000-liter spray tank, commonly used by coffee growers for crops planted in mountain regions (Figure 2), usually with a mean application rate of 400 L ha−1. Each treatment was repeated eight times. The treatments are described in Table 2.
Variables related to pesticide efficacy, vegetative vigor, chlorophyll content, yield, and physiological evaluations were analyzed through data obtained from treatments arranged in a randomized block design, with eight replications for each treatment. The treatments for this experimental step were: application rates of 5 L ha−1 (T5), 10 L ha−1 (T10), and 15 L ha−1 (T5) using the UAV; a rate of 400 L ha−1 (T400) through ground-based application; and a control treatment with no addition of pesticides.
The experimental plots consisted of seven 50-meter coffee plant rows, considering the three central rows for evaluations, and two rows as borders. The operation modes of the UAV were fully autonomous to ensure the standardization of the test results, maintaining a flight height of 2.5 m above the crop canopy, an application range of 5.0 m, and an operating speed of 5 m s−1. The flight directions for application using a UAV were parallel to the planting rows; when using the pneumatic sprayer, the spray flow application was released perpendicularly to the planting rows and in two opposite directions to ensure the overlap of the application ranges (Figure 3).

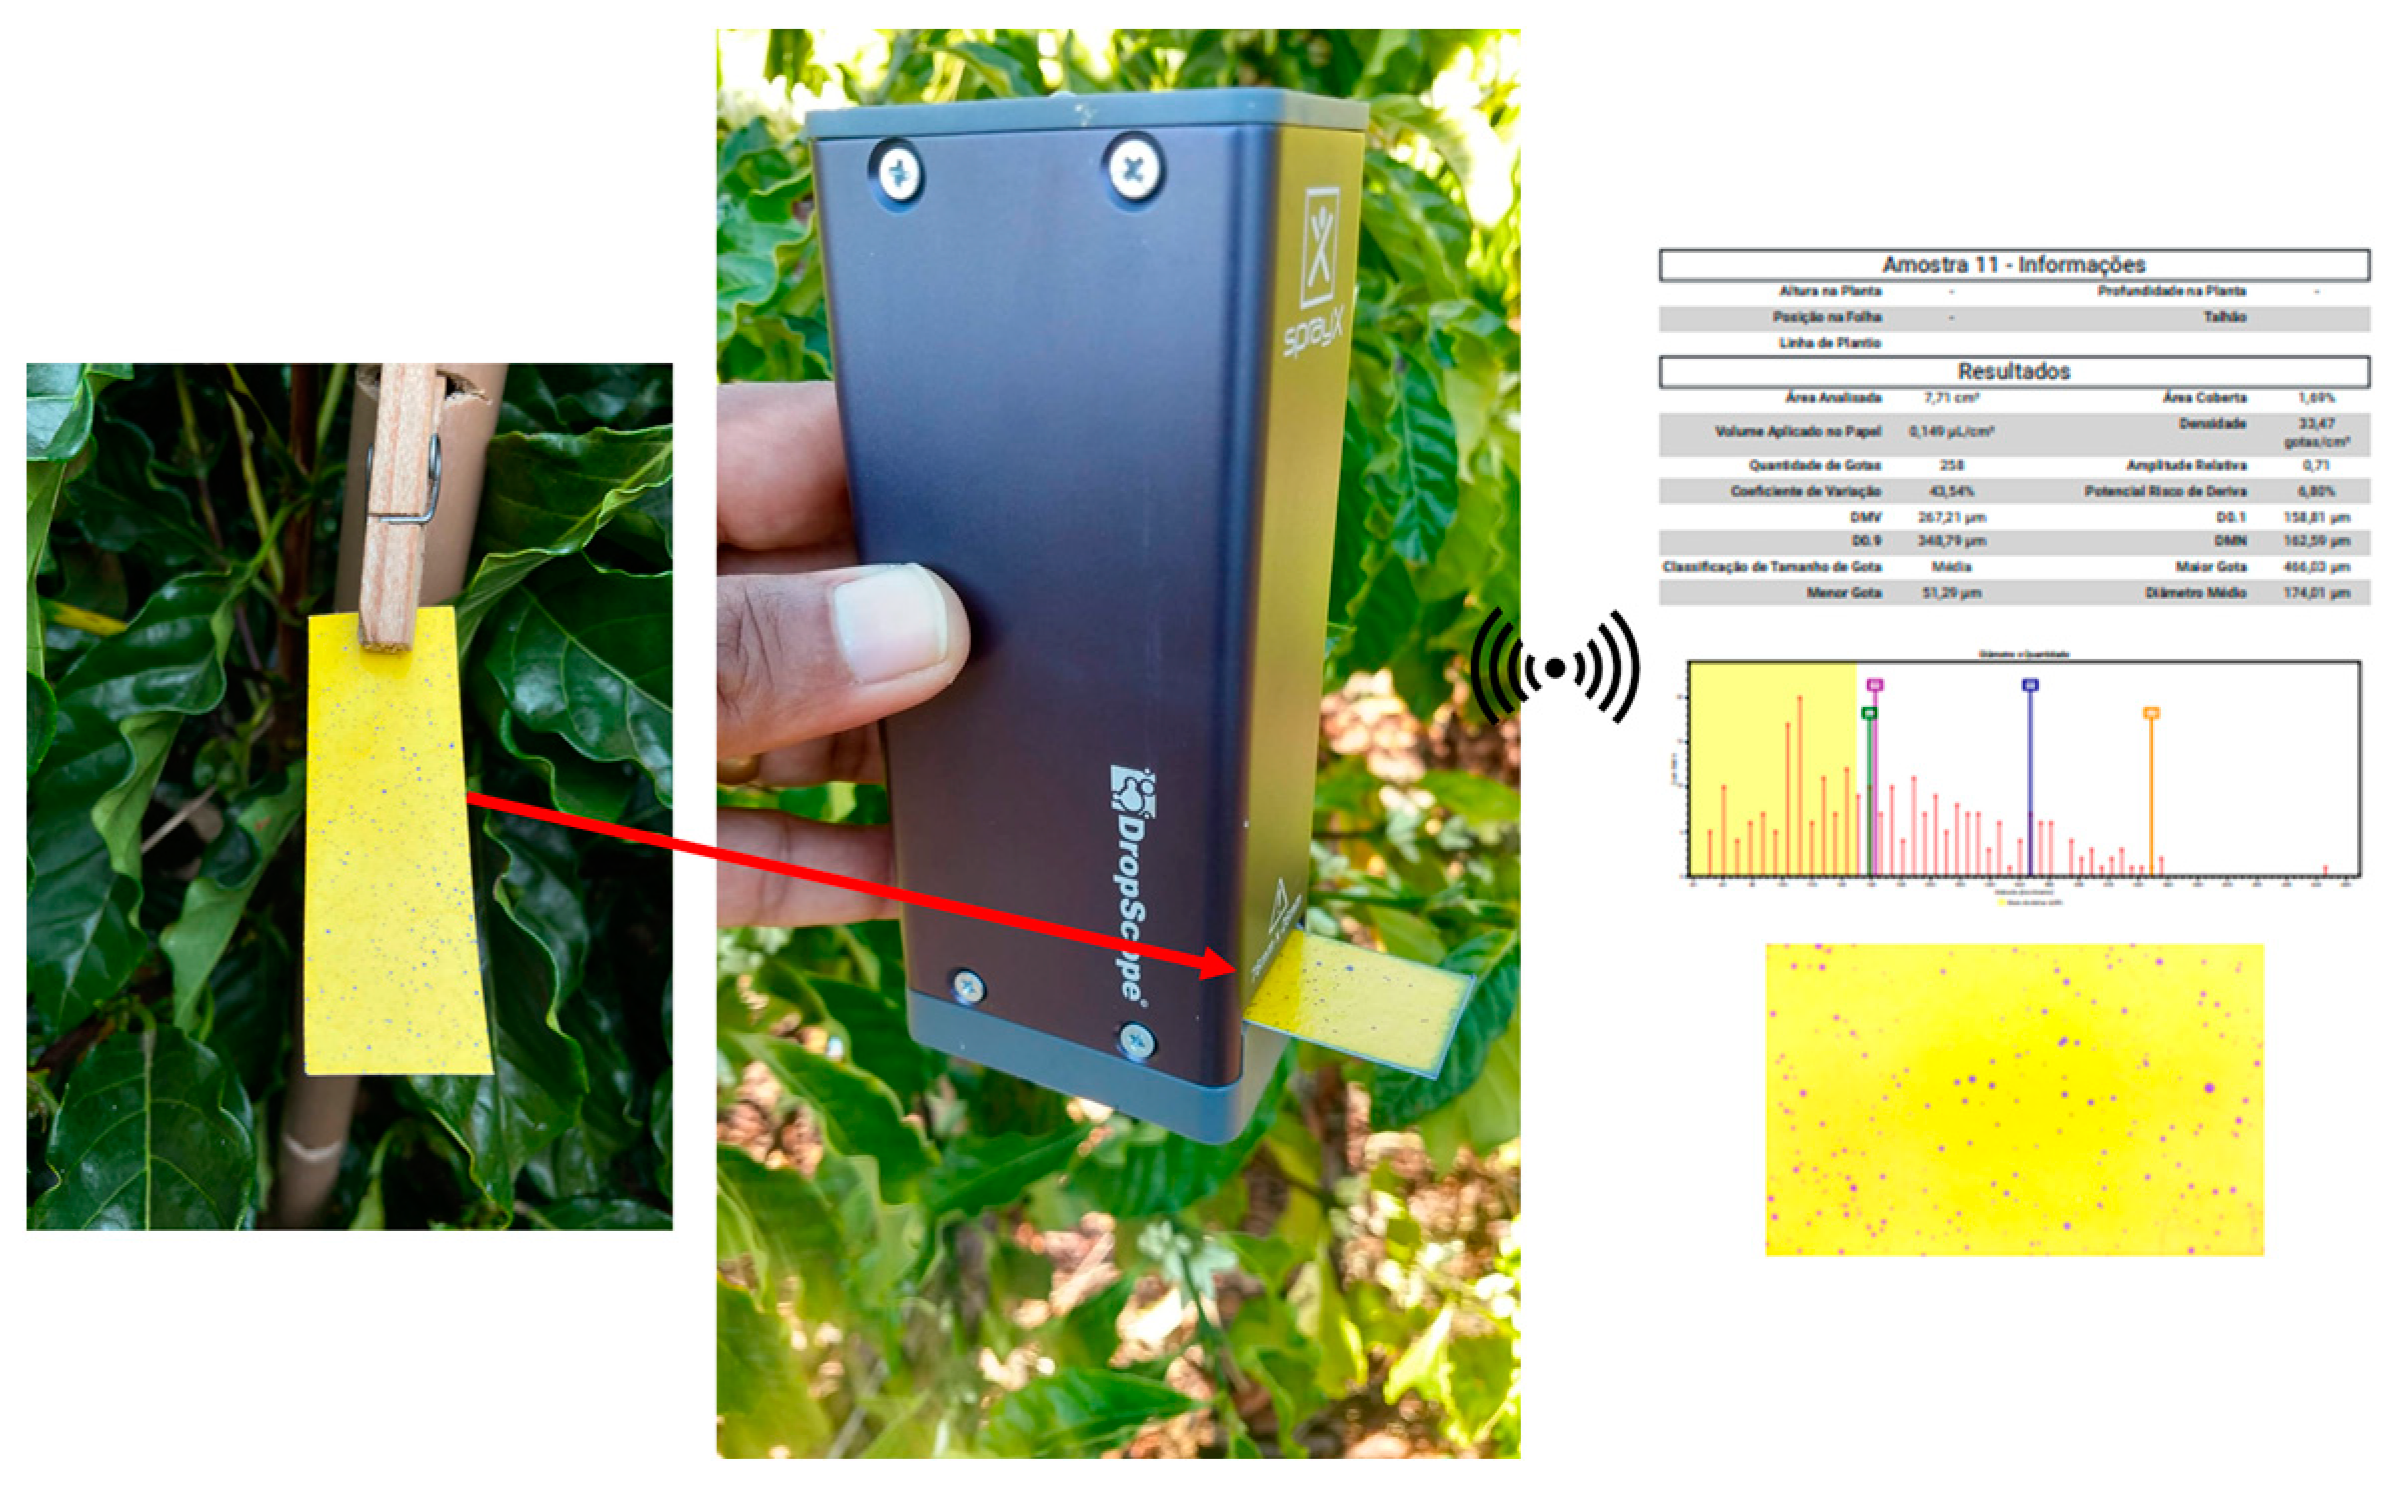
2.4. Determination of Variables Connected to Droplets Deposition Quality

Water-sensitive paper tags with dimensions of 76 × 26 mm were used to collect the spectrum of sprayed droplets; a polyvinyl chloride (PVC) template was used to fix the tags at the three different heights of the coffee plant canopies (Figure 4). The tags were fixed immediately before the application operations, according to the methodology described by [5].
The quantification and characterization of droplet impacts on each water-sensitive paper tag were carried out immediately after application of each treatment and drying the tags using a wireless DropletScope® system (SprayX Company, São Carlos, SP, Brazil), which is composed of programs and a wireless digital microscope with a digital sensor for images over 2500 dpi. This system estimates partially overlapping droplets from approximately 35 µm onwards (Figure 5). The following parameters were evaluated: droplet coverage (%) and droplet density (droplets cm−2).
Rhodamine B (tetra-ethyl-rhodamine, Sigma-Aldrich Company, São Paulo, SP, Brazil), a fluorescent dye used as a marker for measuring spray deposits of up to 800 mg ha−1, was added to the sprayer tank to estimate the deposition of the sprayed solution. Leaves of the third node of plagiotropic branches, close to the positions where the water-sensitive paper tags were fixed, were collected after the application of each treatment, totaling eight leaves per treatment: four leaves from each half of the plant canopy layers. The samples were labeled, placed in plastic bags, and stored in an expanded polystyrene box. A 50-mililiter sample of each application was collected for the preparation of calibration curves in a fluorimeter, in which the rhodamine concentrations were determined.
The leaves were washed with 25 mL of a distilled water and alkaline detergent solution (1% v/v) to remove dye tracer from the leaves. The weight balance generated by deposits of dye tracer on the samples in relation to the initial concentration was used to estimate the deposition on the leaves. A portable digital fluorimeter (HighMed Company, São Paulo, SP, Brazil) with a minimum detection of 0.02 ppb (parts per billion) of rhodamine was used. The area of the leaves was measured using a leaf area meter (Li-Color L1-3100, Lincoln, CA, USA).
The fluorimeter readings, calibration curve data, and leaf area were used to calculated the quantity of spray deposits per unit of area (μL cm−2).

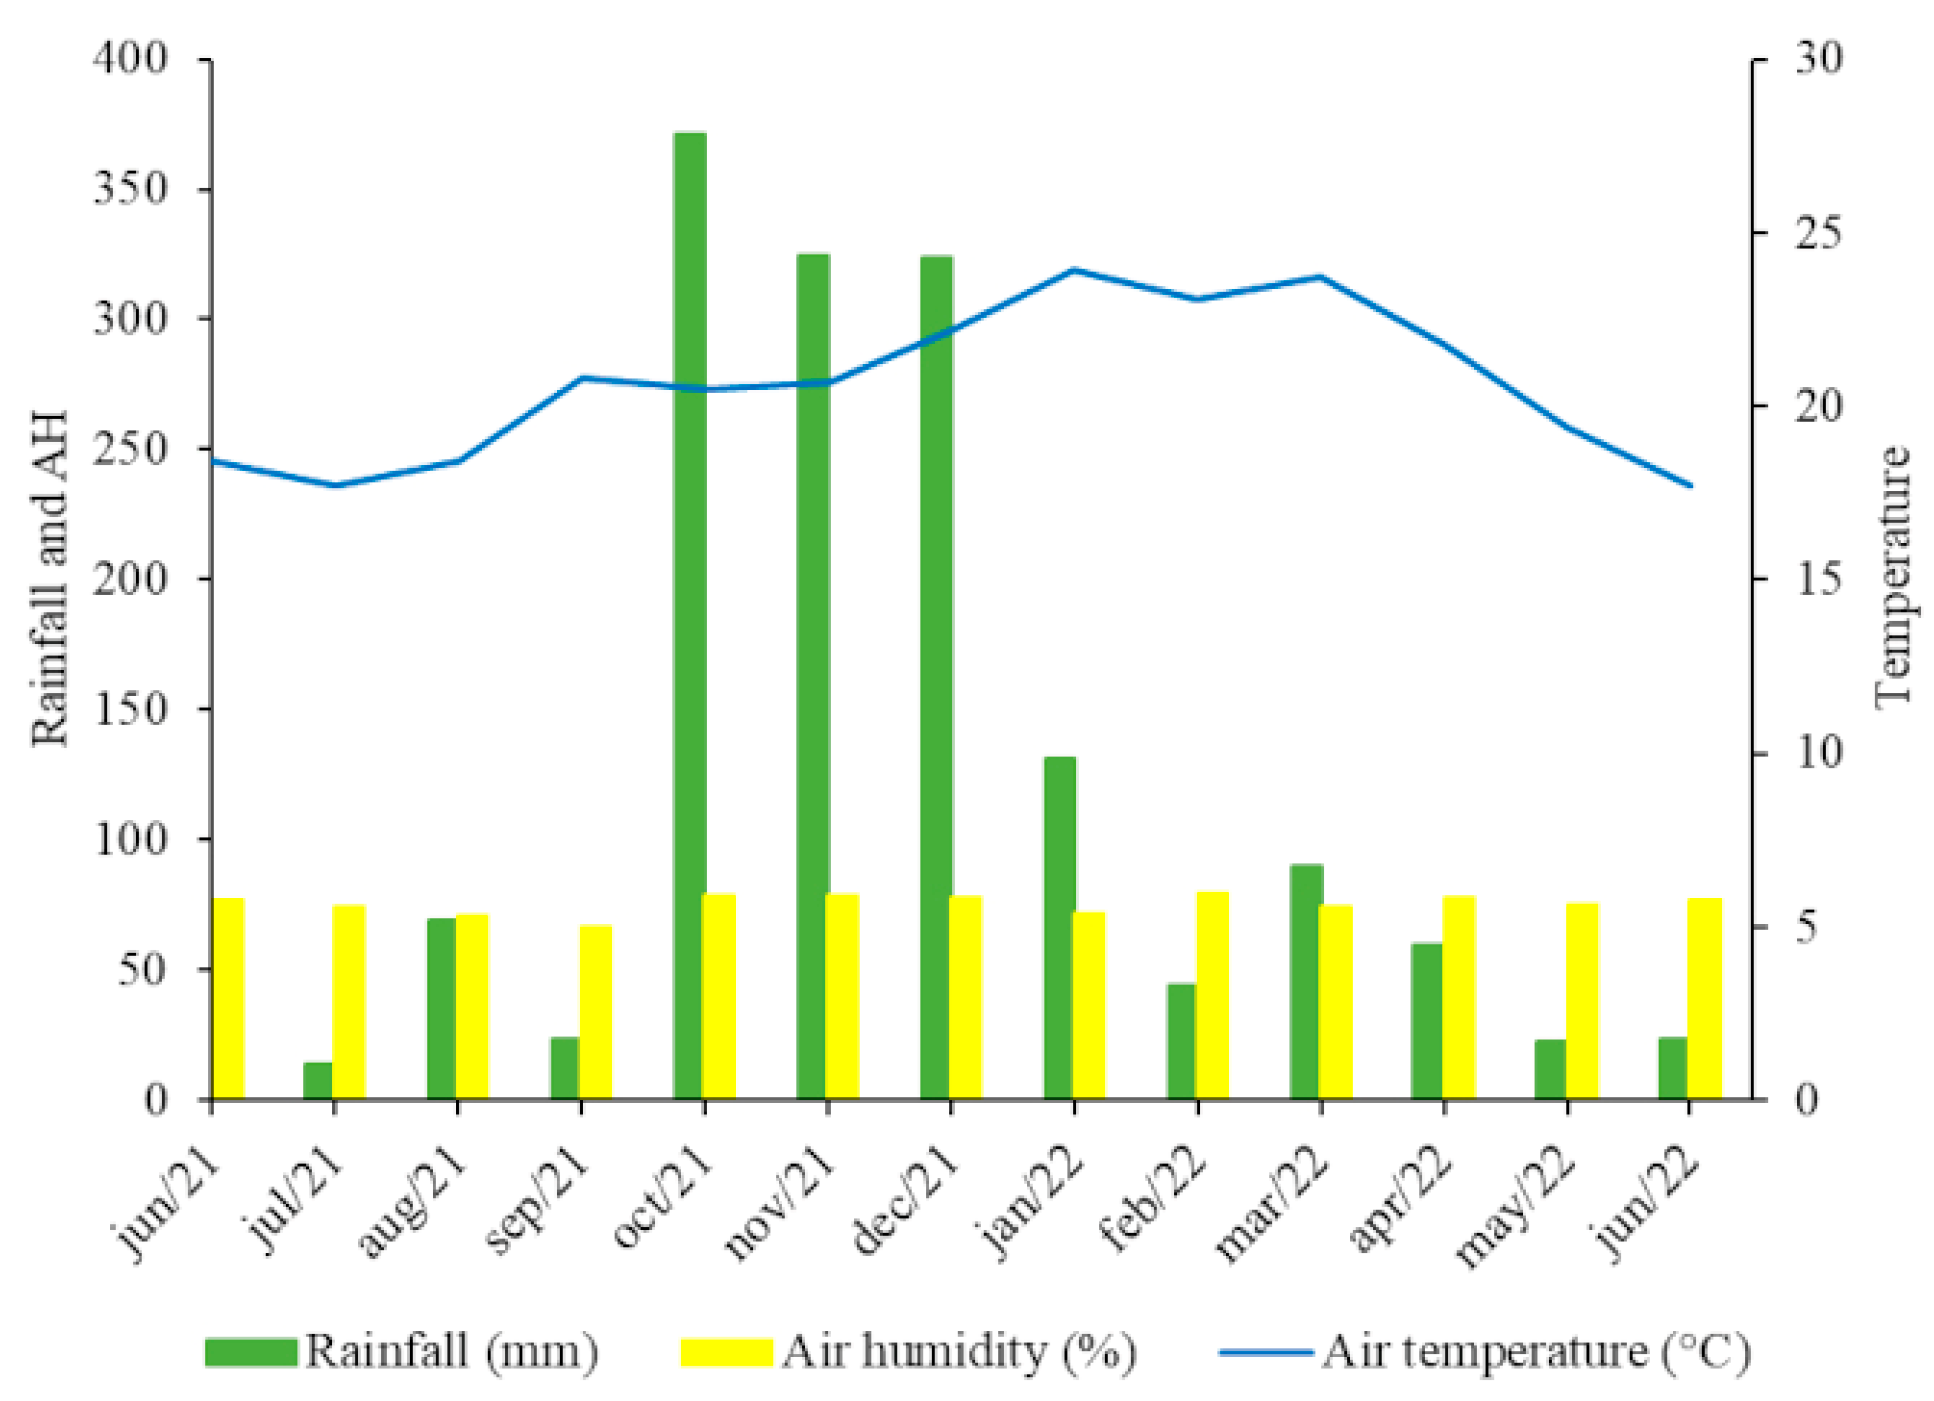
2.5. Monitoring of Climate Conditions

The experiment was conducted in the 2021/2022 crop season. The climate conditions were monitored and recorded through a meteorological station (Sigma Sensors®, model EMI-RX-500, Sigma Sensors, São José dos Campos, SP, Brazil). Figure 6 shows the data of mean monthly rainfall depth, relative air humidity, and temperature from June 2021 to June 2022. This monitoring is important because fungal diseases present higher incidence under favorable climate conditions, mainly under high rainfall depths and relative air humidity (AH).
Table 3 shows the climate conditions at the time of pesticide applications, considering the methodology described in the Norm 22866 of the International Organization for Standardization [28]. This norm establishes that temperature during the applications should be between 5 and 35 °C, a maximum of 10% of wind speed measurements below 1.0 m s−1, and wind direction within a limit of 90° ± 30° in relation to the application line.

2.6. Efficacy of Leaf Rust and Cercosporiosis Control in Coffee Plants

Table 4 shows the active ingredients recommended for leaf rust and cercosporiosis control in coffee plants, the application date, formulation, concentration, application rate, and application method.
The incidences of leaf rust and cercosporiosis were evaluated in eight plants of each experimental unit, recording the presence or absence of disease in plants from August to December, 2021. The data were transformed into percentages of incidence of the diseases. The mean results of incidence and severity of the diseases were used to calculate the area under the disease progress curve (AUDPC).
The agronomic efficiency (AE) of the treatments applied for prevention and control of leaf rust and cercosporiosis was calculated using the following equations:
A E ( % ) = ( P p ) P × 100
where P is the percentage of disease infection and p is the percentage of disease infection in the treatments.

2.7. Determination of Vegetative Vigor, Chlorophyll Content, Yield, and Physiological Analyses

Vegetative vigor was evaluated in the field at the time of harvest of the plots, using an arbitrary scale of grades from 1 to 10, in which 1 was attributed to plants poorly grown and 10 was attributed to plants with maximum vegetative vigor.
Physiological evaluations of chlorophyll contents were carried out in January and March 2022, using an electronic chlorophyll meter (Falker Company, Porto Alegre/RS, Brazil) on leaves from the third leaf pair, with 10 measurements on each side of eight plants per treatment. The chlorophyll contents were used to identify the crop status in a simple and direct form, as the results obtained are directly proportional to essential nutrients, such as nitrogen.
The coffee yield was evaluated by harvesting 10 plants per plot; the production was measured in liters per plant. Two-liter coffee samples were collected from each plot, dried until reaching 12.0% moisture, and weighed; they were then processed and weighed again, and the results were transformed into processed coffee bags (60 kg ha−1).
Variables related to chlorophyll fluorescence were measured in January and March 2022, using a Multispeq V2.0 device (PhotosynQ LLC, East Lansing, MI, USA). These variables were: maximum quantum efficiency of photosystem II (Fv/Fm) and proton conductivity of the thylakoid membrane (gH+), which describes the accumulation of protons in the thylakoids and their flow from the thylakoid lumen to the stroma.

2.8. Statistical Analyses

The assumptions of droplet density, coverage, and deposition data, and agronomic and physiological data were tested. The Shapiro–Wilk test was applied to assess the homogeneity and normality of residues. The data were transformed when needed and after analysis of variance, using the Tukey’s test for variables referring to the UAV application quality, the Dunnett test for comparison with the control treatment, and the Scott-Knott test for the efficacy of pesticides (agronomic efficiency), vegetative vigor, chlorophyll content, yield, and physiological evaluations.

3. Results

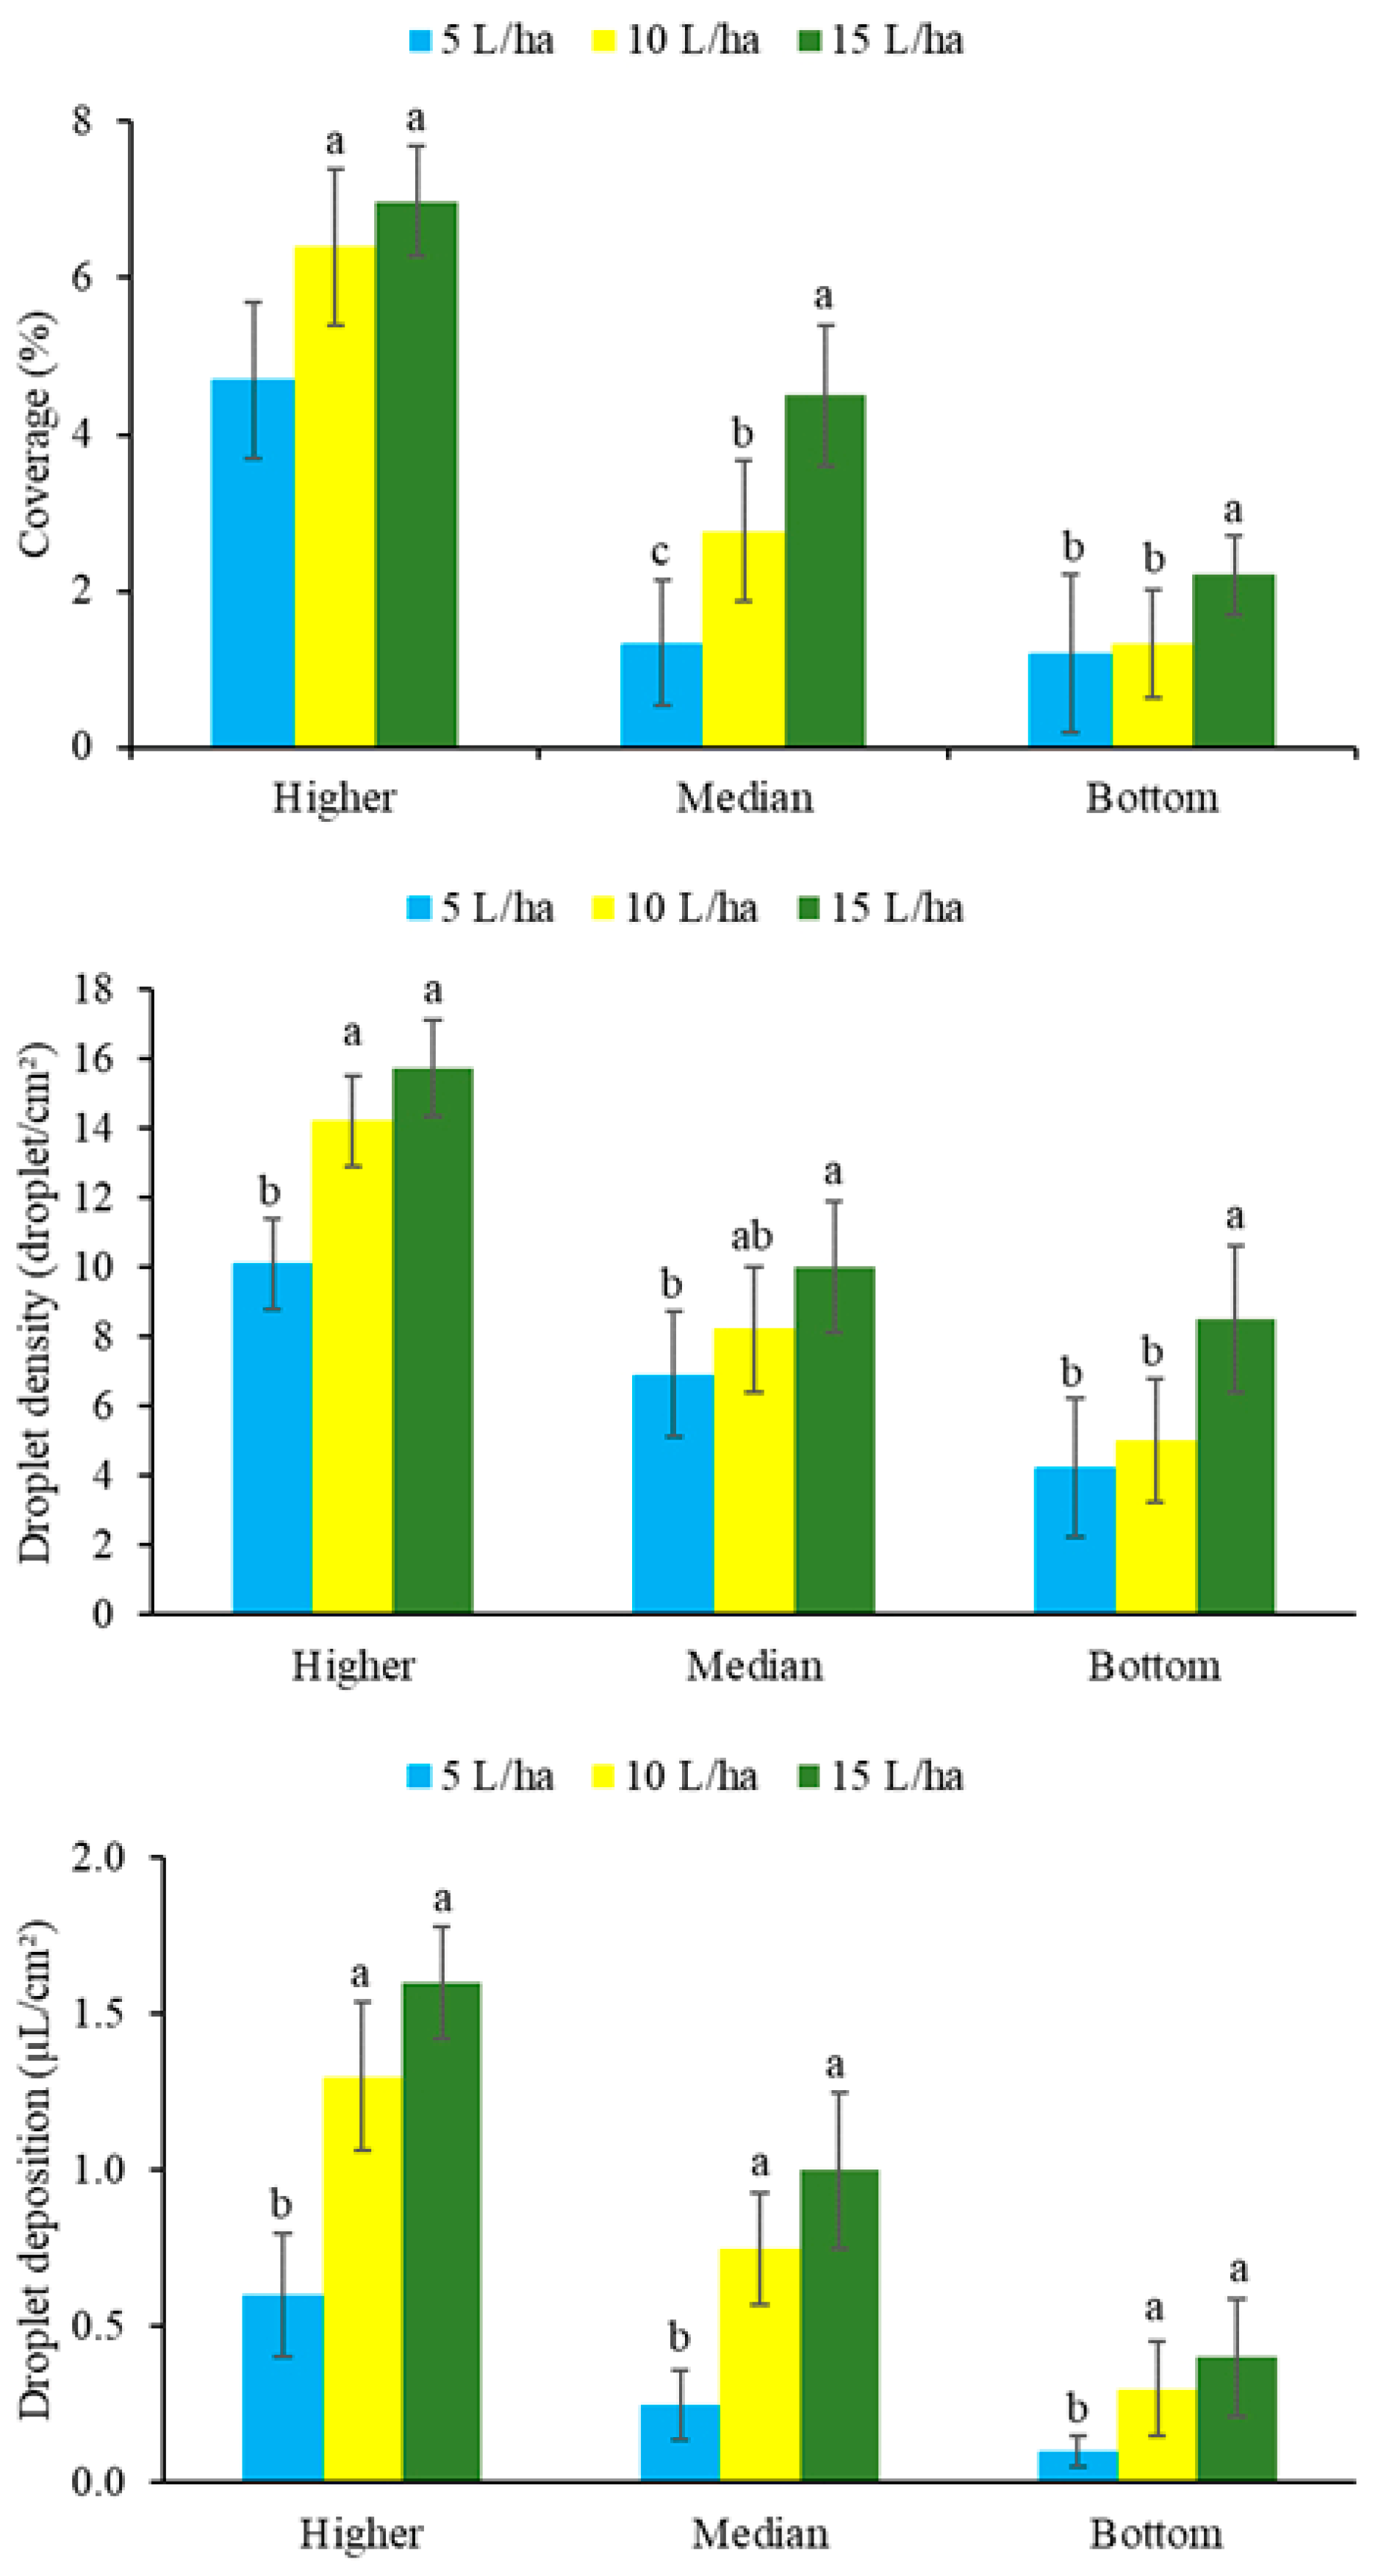
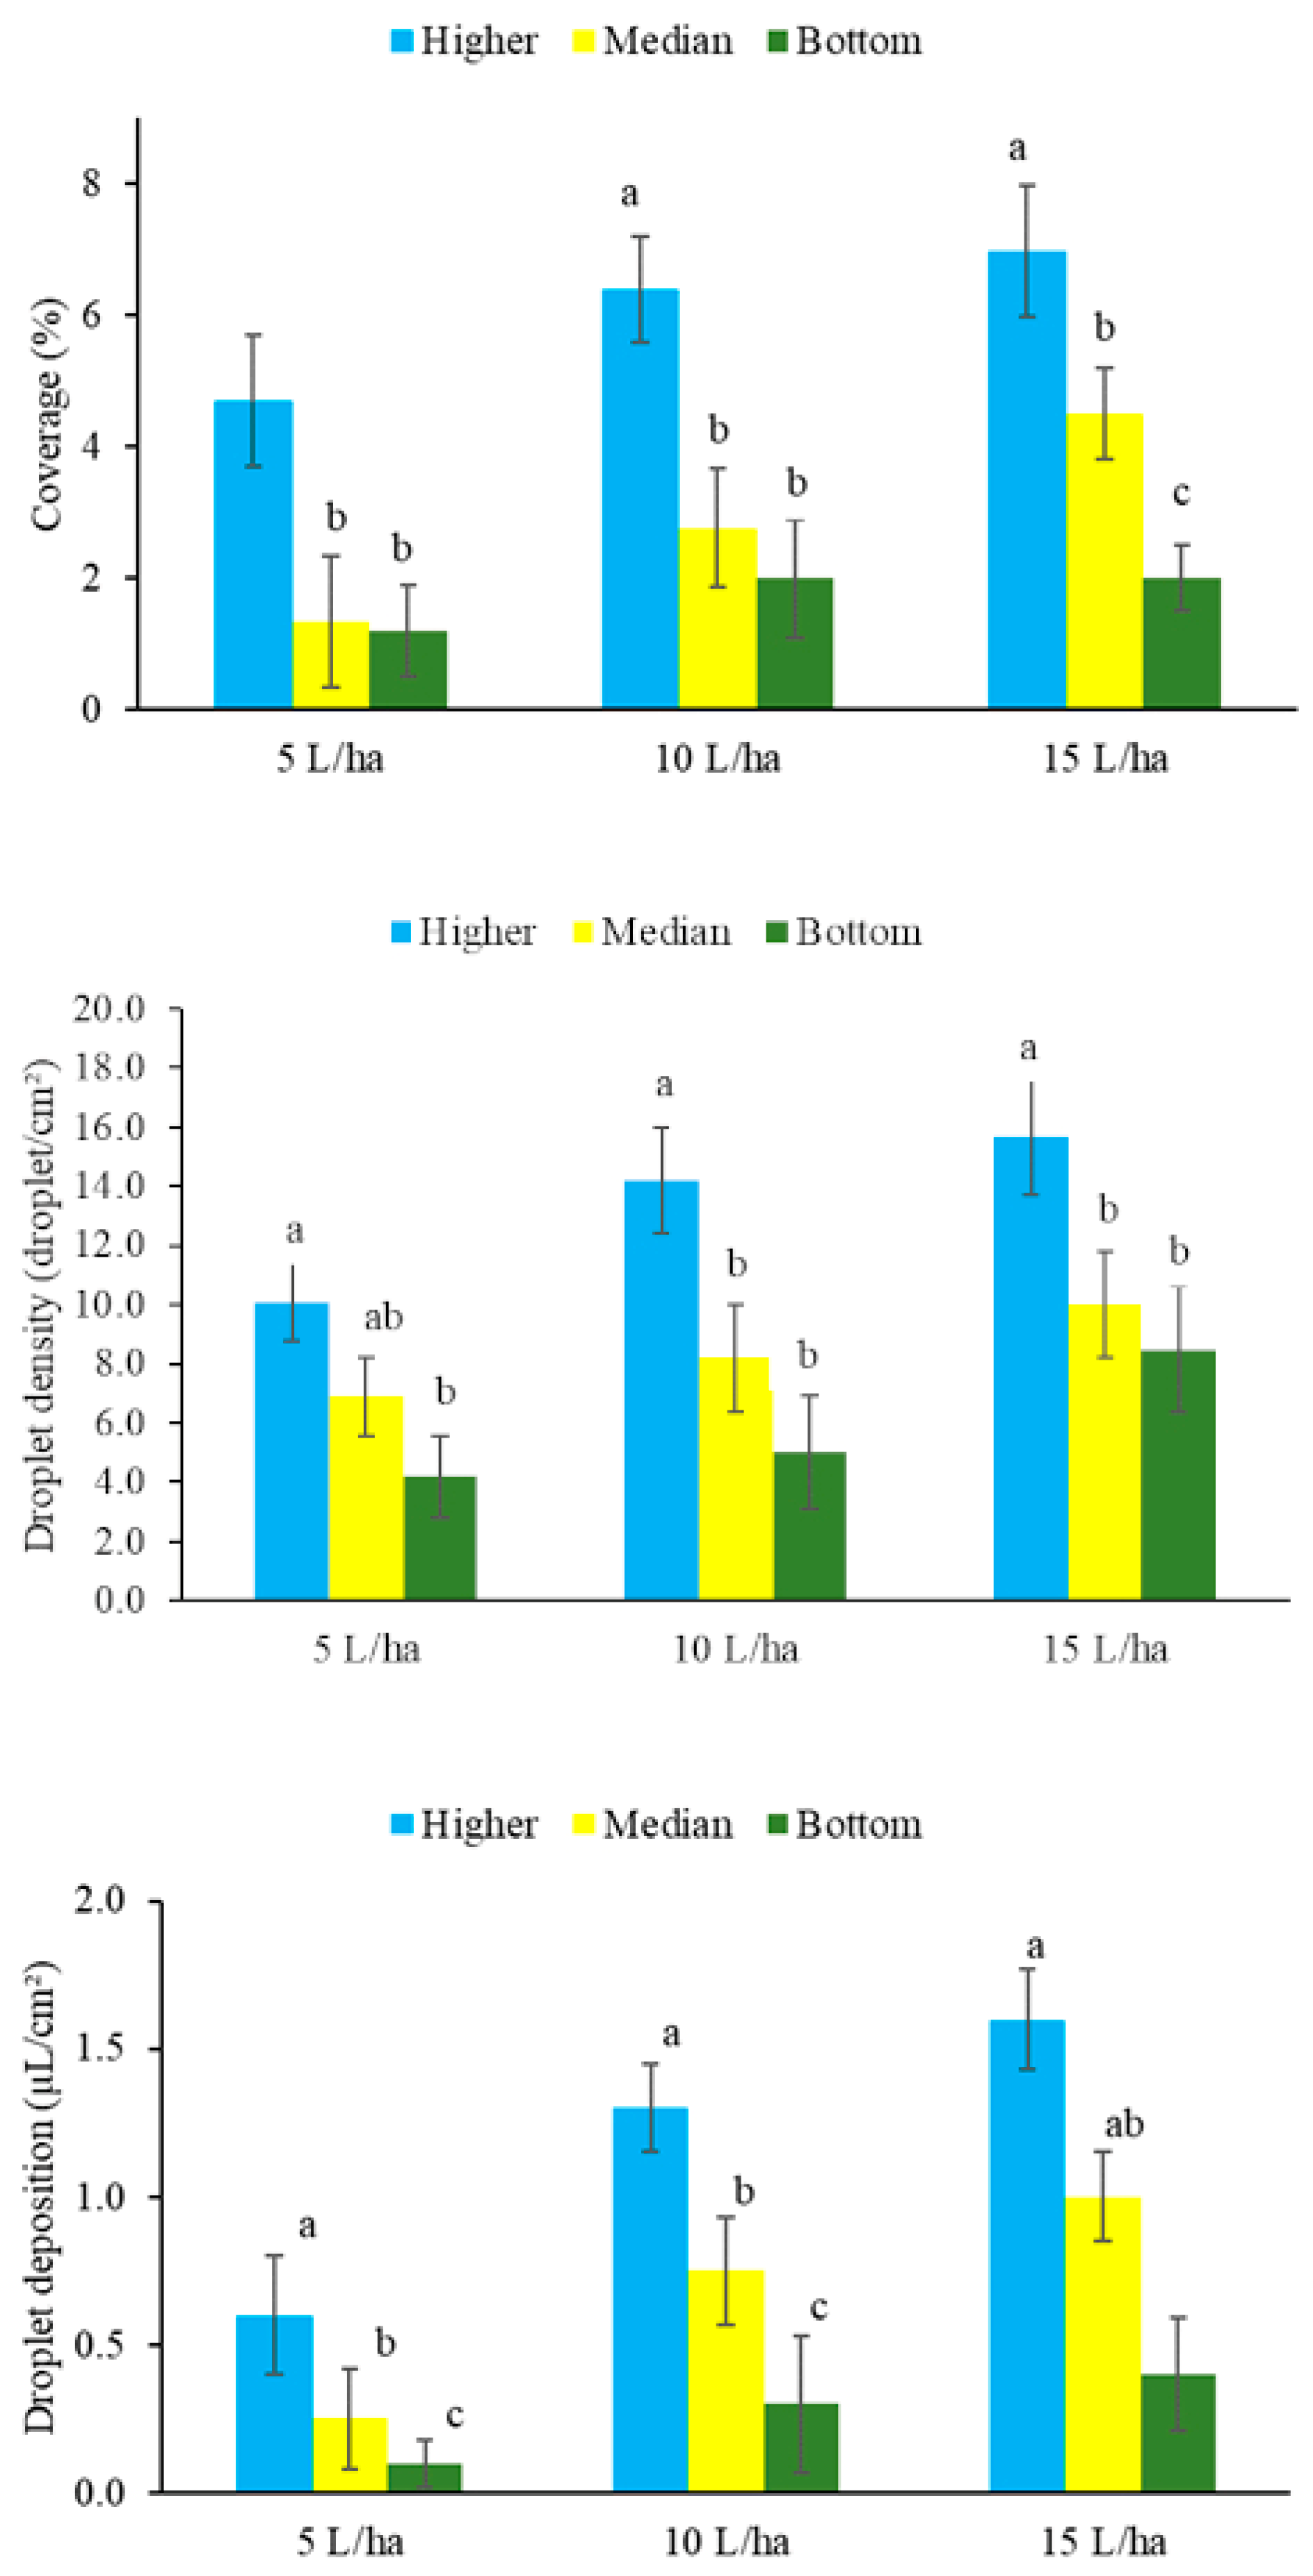
3.1. Effects of Application Rates and Canopy Layers

The analysis of variance (ANOVA) is shown in Table 5; the application rates and canopy layers of coffee plants had independent effects on the three response variables analyzed: droplet coverage, density, and deposition.
Droplet coverage, density, and deposition on coffee plants were significantly affected by the application rates, as shown in Figure 7.
The target coverage presented significant differences between treatments with the application rates of 15 L ha−1 (T3, T6, and T9) and 5 L ha−1 (T1, T4, and T7). When using 15 L ha−1, the maximum target coverage was found in the treatments T3, T6, and T9. The droplet coverage was 6.98% in T3, 4.50% in T6, and 2.21% in T9.
The increases in application rates increased the droplet density. The maximum density found was 15.7 droplets cm−2, approximately 3.73-fold higher than that found in T7 (4.20 droplets cm−2), with a rate of 5 L ha−1.
When using the application rate of 5 L ha−1, the droplet depositions were 0.61 µL cm−2 (T1), 0.25 µL cm−2 (T4), and 0.12 µL cm−2 (T7), which were lower than those found with the rate of 15 L ha−1: 1.60 µL cm−2 (T3), 1.04 µL cm−2 (T6), and 0.43 µL cm−2 (T9). The mean droplet deposition, as found for droplet density, increased as the application rate was increased.
Figure 8 shows the comparisons between the results found for coffee plant canopy layers. The results indicate that the droplet coverage (p < 0.001 **), density (p < 0.001 *), and deposition (p = 0.039) were significantly different in the three layers evaluated.
The highest droplet coverages in the upper canopy layer were 6.98% (T3), 6.41% (T2), and 4.70% (T1), whereas the highest coverages in the lower canopy layer were 2.08% (T9), 2.00% (T8), and 1.20% (T7). The highest mean coverage in the upper layer (6.98%) was approximately 3.4-fold higher than that found for the lower layer.
The comparison between the lower and upper canopy layers showed that the droplets reached the maximum density in the upper layer. Thus, the maximum droplet densities were 10.10, 14.21, and 15.67 droplets cm−2 in the treatments T1, T2 and T3, respectively.
The droplet deposition was higher in the upper canopy layers, where the maximum depositions found were 0.62 (T1), 1.33 (T2), and 1.62 µL cm−2 (T3). The difference between the highest deposition in the upper layer (1.62 µL cm−2) and the lowest deposition in the lower layer (0.11 µL cm−2) was 1.51 µL cm−2, which is equivalent to 93.2%.

3.2. Comparative Analysis of Application Quality Parameters of UAV and Pneumatic Sprayer

Table 6 shows the mean results found for the droplet coverage, density, and deposition obtained in the treatments using a UAV, compared to those found when applying 400 L ha−1 using a pneumatic sprayer (control treatment).
The control treatment presented droplet coverage, density, and deposition significantly higher when compared to any of the treatments using a UAV (p < 0.01 *).
The coverage in the upper layer using a pneumatic sprayer (28.70%) was 4.11-fold higher than that in the same layer (6.98%) using a UAV, at the rate of 15 L ha−1. In the middle and lower layers, the coverage using a pneumatic sprayer was 3.83- and 4.31-fold higher, respectively.
The droplet density found in the upper, middle, and lower layers for the application with pneumatic sprayer was 129.75, 113.74, and 91.28 droplets cm−2, respectively. The comparison of these results with those found for the application with UAV at the rate of 15 L ha−1 showed a decrease of 87.9% in the upper (15.70 droplets cm−2), 91.1% in the middle (10.07 droplets cm−2), and 90.6% in the lower canopy layer (90.6 droplets cm−2).
The highest depositions found for the applications using a UAV was at the rate of 15 L ha−1: 1.60, 1.04, and 0.43 µL cm−2 in the upper, middle, and lower layers, respectively. The droplet deposition in the upper using a pneumatic sprayer was 42.67 µL cm−2, representing a 26.7-fold higher deposition.

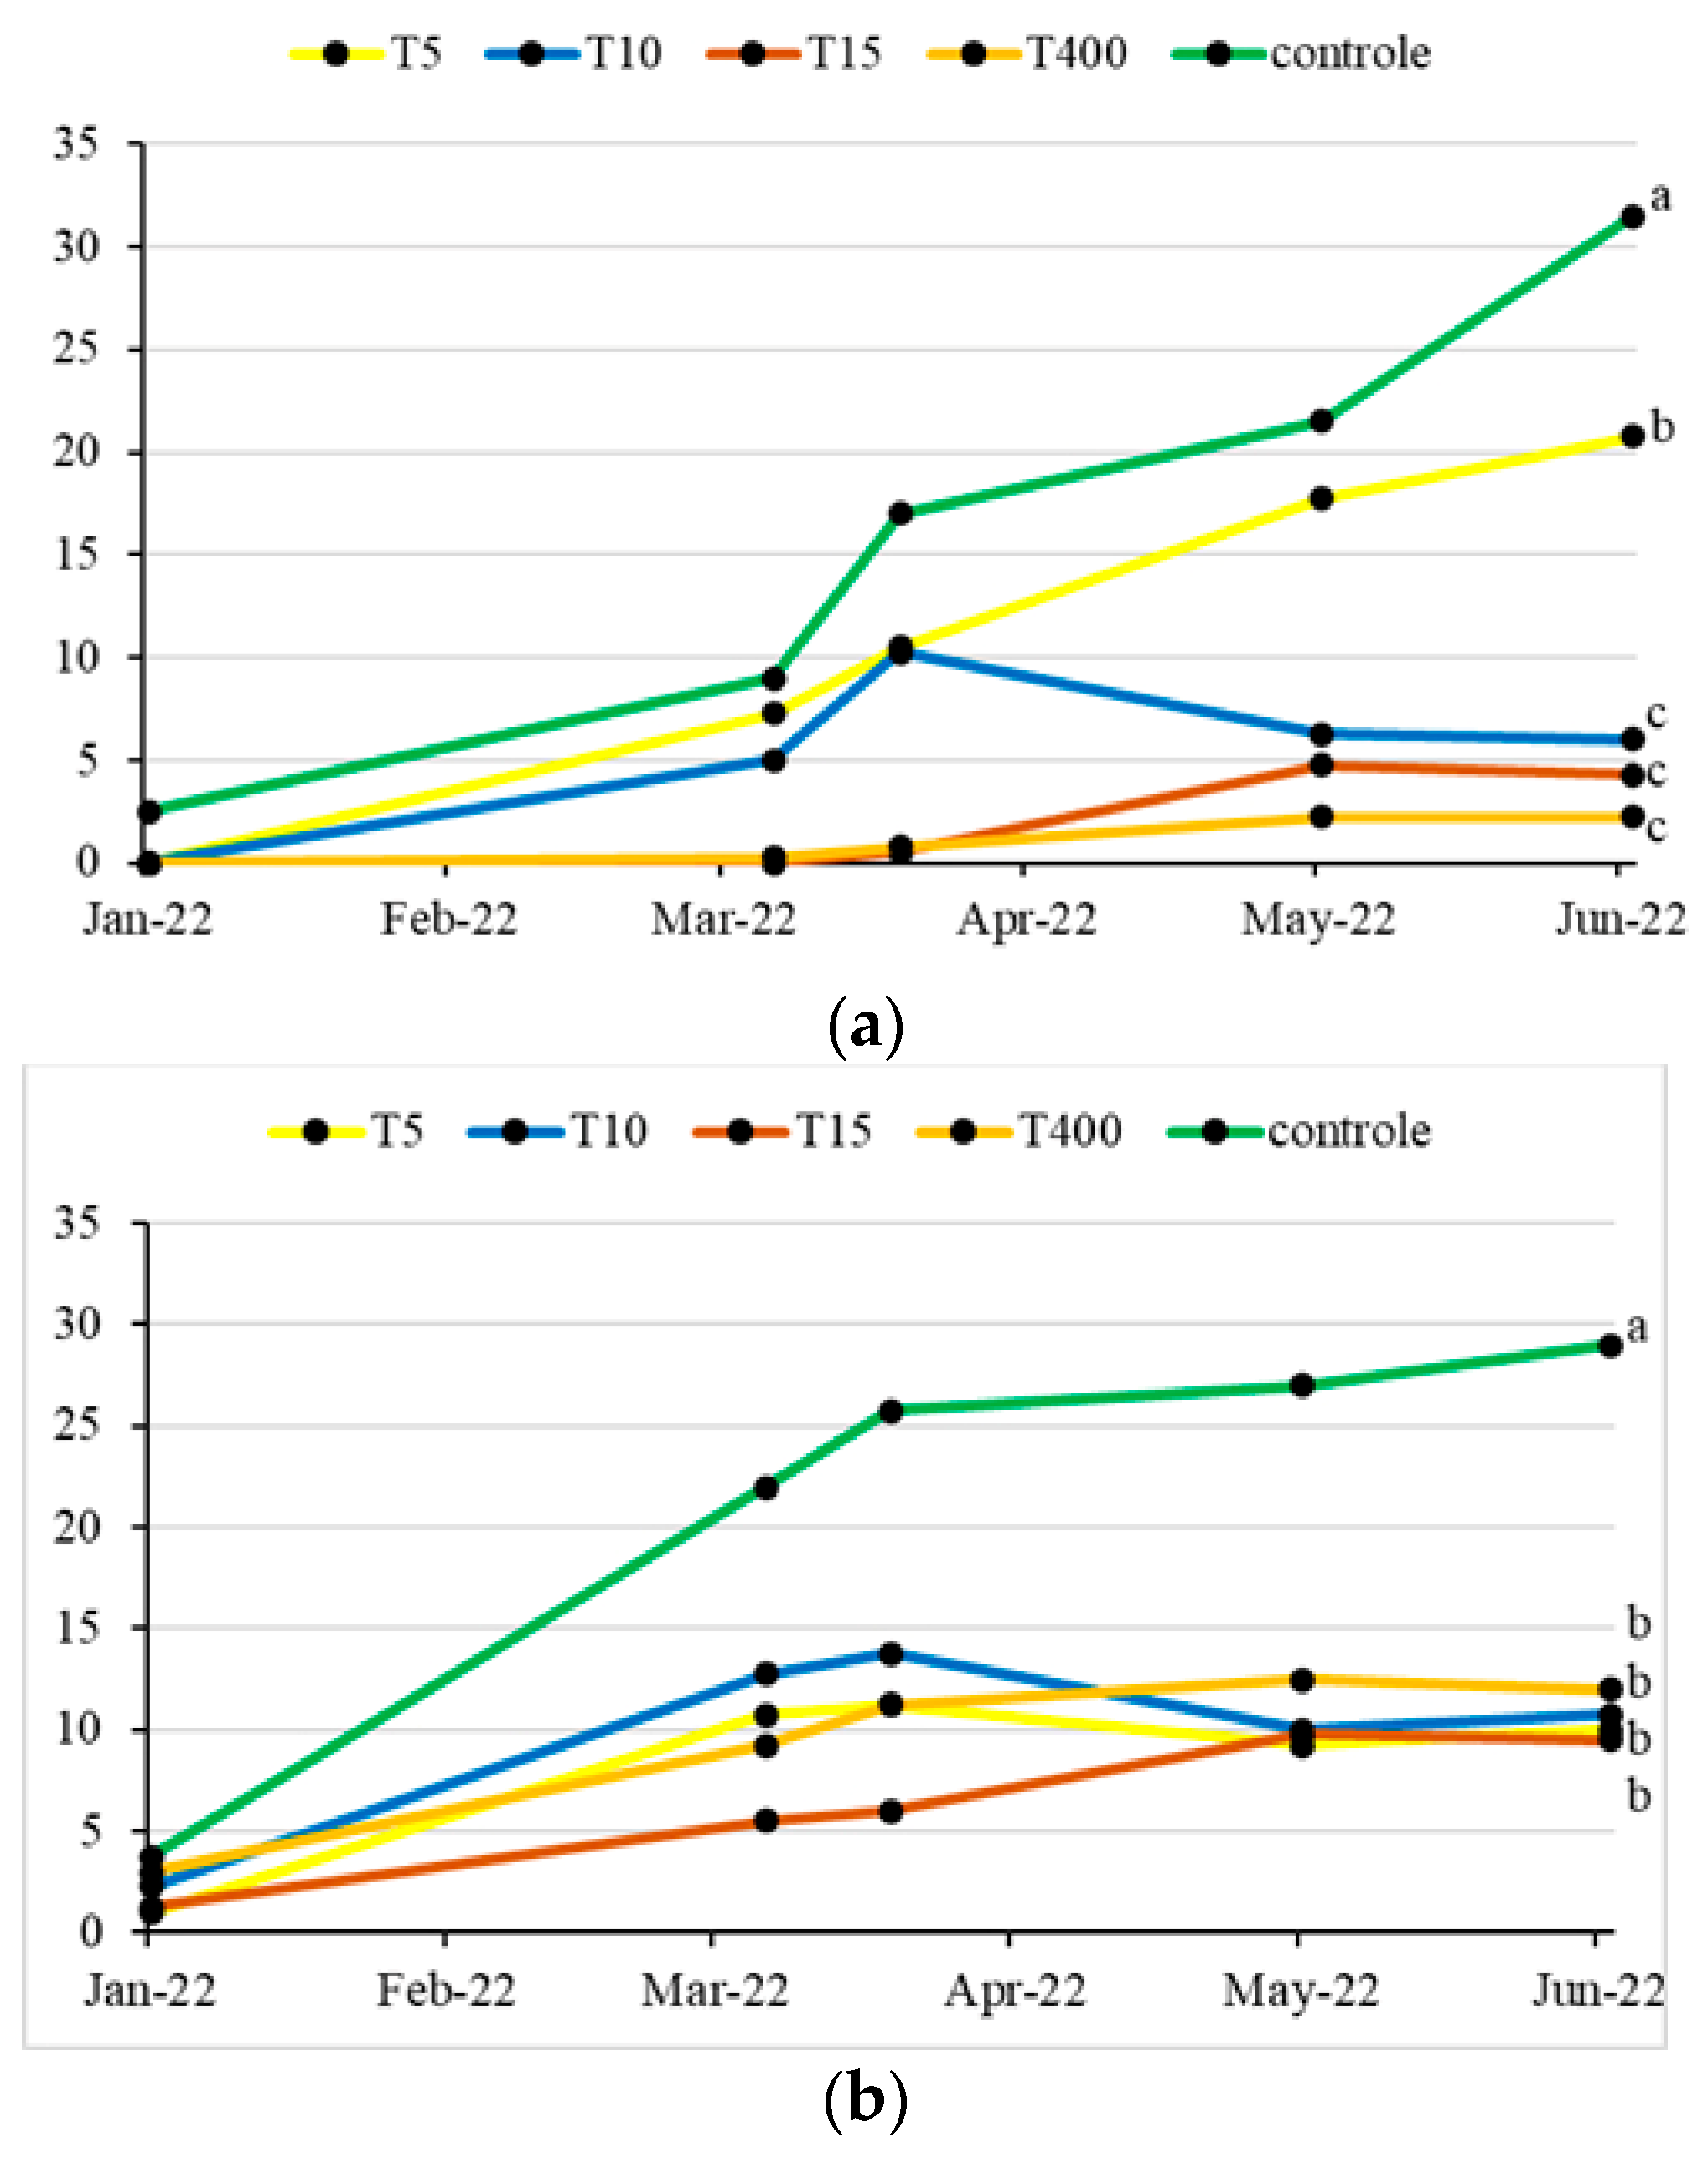
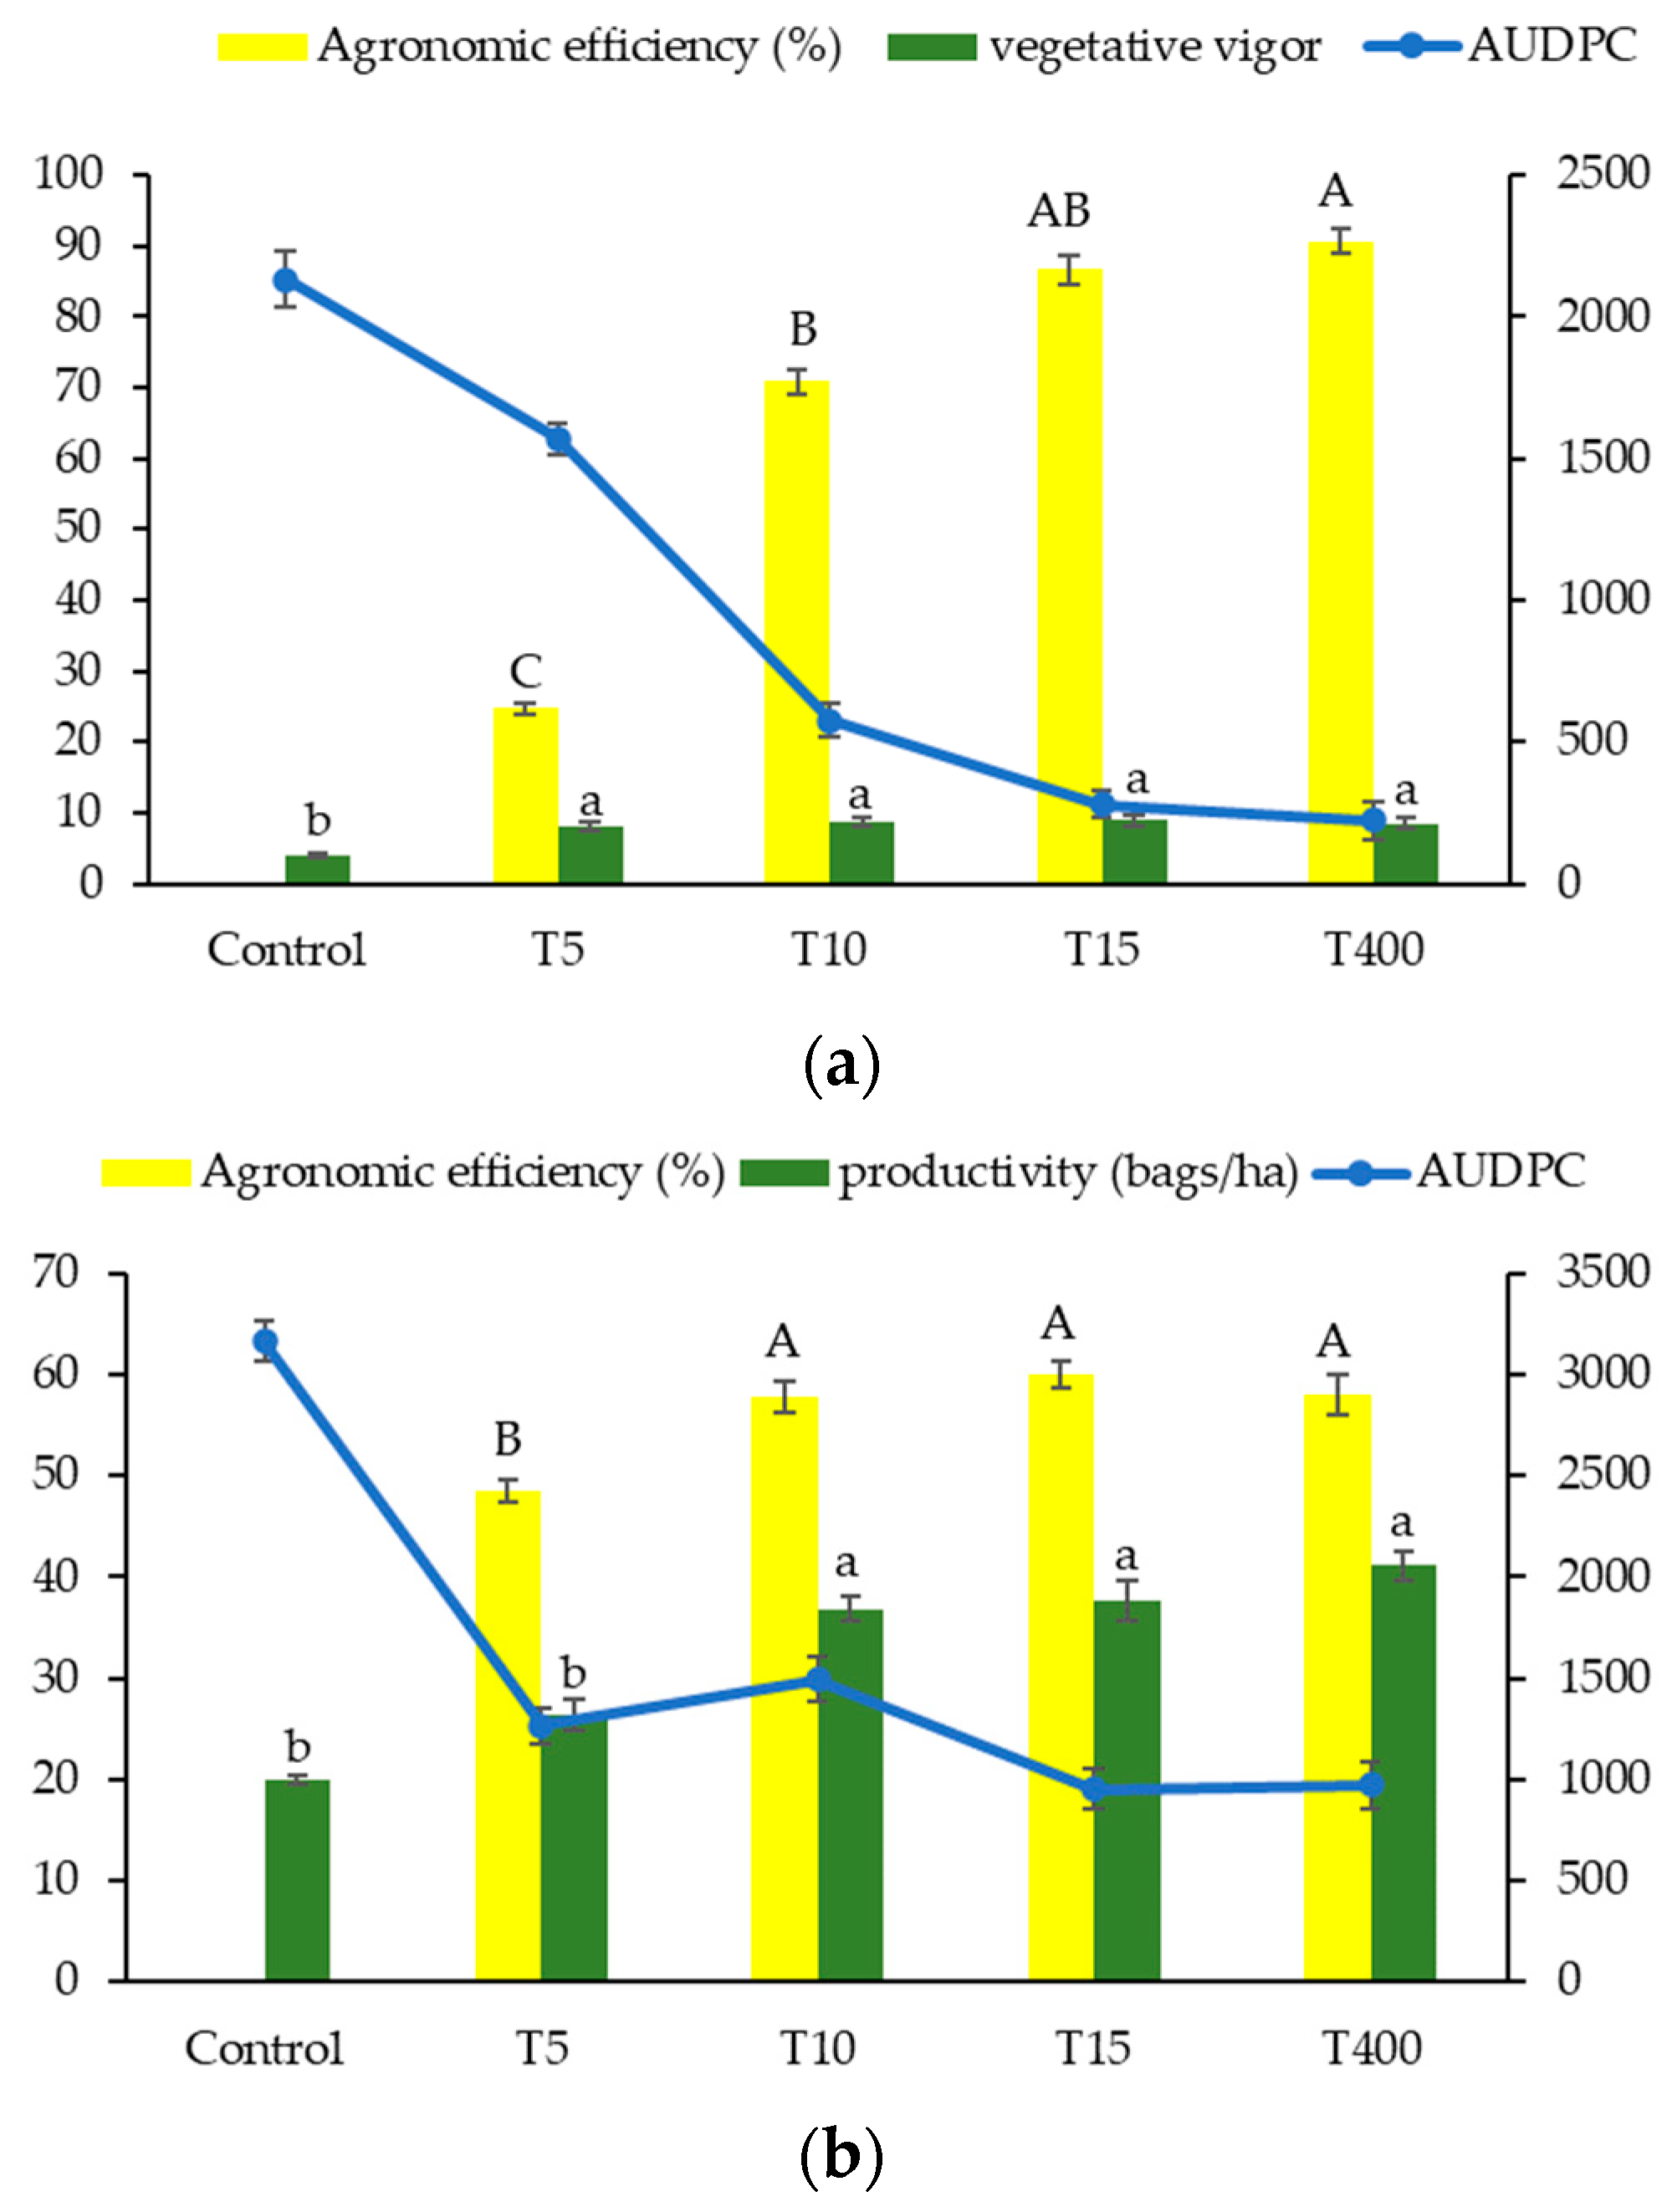
3.3. Incidence of Leaf Rust and Cercosporiosis, AUDPC, Agronomic Efficiency, and Vegetative Vigor

Figure 9 shows the disease progress curves for leaf rust and cercosporiosis in coffee plants in each treatment tested: application using a UAV with the application rates of 5 L ha−1 (T5), 10 L ha−1 (T10), and 15 L ha−1 (T15); ground-based application using a pneumatic sprayer at the rate of 400 L ha−1 (T400); and a control treatment with no pesticide applications.
The results showed an increase from 2.50% to 31.50% in leaf rust from the first (January 22) to the last evaluation (June 22), whereas cercosporiosis incidence increased from 3.75% to 29.0% in the same period in the control treatment.
The fungicide application using a UAV at an application rate of 5 L ha−1 (T5) resulted in an increase in leaf rust incidence from 0% (with no incidence in the first evaluation) to 20.75% in the last evaluation.
The initial evaluation presented no incidence of leaf rust in treatments with application of fungicide at rates of 10 L ha−1 (T10) and 15 L ha−1 using a UAV, and with the application rate of 400 L ha−1 through ground-based application using a pneumatic sprayer, but increased 6.00%, 4.25%, and 2.50%, respectively, in the last evaluation. These results were not different from each other and denoted a significant decrease in leaf rust when compared to the treatment T5 and the control treatment.
Cercosporiosis incidence increased from 3.50% in the first (22 January) to 29.00% in the last evaluation (22 June). T5, T10, T15, and T400 presented initial incidences of 1.00%, 2.25%, 1.25%, and 3.00%, respectively; and in the last evaluation, they presented incidences of 10.00%, 10.75%, 9.50%, and 12.00%, respectively. The incidences in the last evaluation were not statistically different between treatments; however, they were significantly lower than that found in the control treatment (29.00%).
Figure 10 shows the results of agronomic efficiency, yield, vegetative vigor, and area under the disease progress curve (AUDPC) for fungicide applications in T5, T10, T15, T400, and control treatment.
The leaf rust incidences in the area under the disease progress curve (AUDPC) found for the fungicide treatments T400 and T15 were significantly different from the other treatments, presenting the lowest values: 222.25 and 280.75, respectively. The cercosporiosis incidences presented the same trend, with the lowest values found for T400 (970.88) and T15 (953.38).
The agronomic efficiency of the fungicide applications to control the incidence of leaf rust in the treatments T400 and T15 was significantly different from that found in the other treatments: 90.62% and 86.62%, respectively. The agronomic efficiency to control the incidence of cercosporiosis in T400, T15, and T10 (57.75%, 59.98%, and 58.00%, respectively) was significantly different from that found in T5 and in the control treatment.
The mean vegetative vigor found (Figure 8) showed no significant difference between the treatments T5 (8.0), T10 (8.75), T15 (9.0), and T400 (9.5); however, the difference was significantly higher when compared to the control treatment (4.0). The highest coffee yield was found in T400 (41.1 bags ha−1); however, it was not significantly higher than those found in T15 (36.83) and T10 (37.70 bags ha−1). Moreover, a significant increase was found when compared to the control (20.00 bags ha−1), with yields 2.06-fold higher in T400 and 1.89- and 1.84-fold higher in T15 and T10, respectively.

3.4. Physiological Evaluations

Table 7 shows the mean total chlorophyll contents and other physiological parameters connected to the treatments tested.
The total chlorophyll contents found showed significant differences between the control (56.72%) and the other treatments. The highest total of chlorophyll content was found in the treatment with the application of fungicide at a rate of 15 L ha−1 using a UAV (T15); the difference from the control was 6.22 percentage points.
The maximum quantum efficiency of photosystem II (Fv/Fm) showed no significant difference between the treatments T5, T10, T15, and T400; however, they showed significant differences when compared to the control. The highest Fv/Fm was found in T15 (0.826), denoting that 82.60% of the incident solar light was used for photosynthesis; this result was significantly higher when compared to the control (74.5%).
The proton conductivity of the thylakoid membrane (gH+) showed no significant differences between the treatments, presenting a value of 140.19 in the control, and mean of 188.76 for the fungicide treatments.
The amount of light used by the plant for photosynthesis (Φ²) showed no significant difference between the fungicide treatments applied using a UAV (T5, T10, and T15), whose values were, on average, 10.65% higher than that of the treatment T400 and 24.07% higher than that of the control.
The electron flow from the antenna complex of photosystem II showed a significant difference between the treatments evaluated. The highest values were found in the treatments T10 (20.35) and T15 (25.24).

4. Discussion

The results found denoted that the application rate used for applying fungicide to coffee arabica crops through UAV has a significant effect on the droplet distribution in the different coffee plant canopy layers. The mean coverage, density, and deposition of droplets significantly increase as the application rate is increased. Similar results were found in similar experimental studies on conilon coffee [5], arabica coffee [6], citrus [24,25], apple [2,3], wheat [17], and rice [16] crops. Two aspects are considered important for fungicide application to coffee arabica crops using a UAV: the first is the low operational capacity due to the limited tank load and low battery charge duration [15,29] and the second is the characteristic place of infestation of most fungal diseases in conilon coffee crops, which is usually in the middle and upper canopy layers [30,31]; the results indicate the use of an application rate of 10 L ha−1. The droplet coverage, density, and deposition were higher with an application rate of 15 L ha−1; however, the mean values were not significantly different from the rate indicated in the present work (10 L ha−1) for the middle and upper canopy layers. The use of this rate (10 L ha−1) resulted in a higher operational capacity when compared to the rate of 15 L ha−1, maximizing the battery use; in addition, there was a significant droplet distribution in the coffee plants layers with higher incidence of fungal diseases. However, the choice of the most adequate application rate depends on the developmental stage and age of coffee plants; older plants with a canopy volume that increases the leaf density between rows may require higher application rates.
There was evidence of downwash effect contributing to droplet penetration and distribution in the crop canopy, i.e., the air flow generated by the multi-rotors agitates the leaves on the plant canopy, facilitating the deposition process, mainly in the lower layer [31,32,33,34]. In this sense, there was a significant difference in droplet coverage, density, and deposition in the canopy lower layer of coffee plants when compared to the upper and middle layers. For example, the droplet deposition was up to 95% higher in the upper layer than in the lower canopy layer when using application rates of 10 and 15 L ha−1. The droplet coverage, density, and deposition over the canopy was lower at the rate of 5 L ha−1, which denotes the need for criteria to choose the most adequate application rate, considering the age and developmental stage of coffee plants. The results of droplet coverage, density, and deposition were significantly higher in all coffee plant canopy layers when applying the rate of 400 L ha−1 using a pneumatic sprayer, compared to the rates applied using a UAV. However, these higher values resulted in runoff of the sprayed solution on leaves in many points of the coffee plants, denoting an excessive application rate [35]. An experiment with different application rates to coffee crops showed that the applications using a pneumatic sprayer was more homogeneous when using solution volumes 50% and 75% lower when compared to that applied by a hydraulic sprayer [36]. Thus, the application solution volumes for coffee crops can be low when using a pneumatic sprayer device.
Pneumatic sprayer is the most used device for control of fungal diseases in coffee crops in mountain regions because it presents high operational capacity due to its application range; although it has low application efficiency when using high application rates, which causes runoff of the solution sprayed on the leaves, consequently, to the soil. An alternative is the use of manual or electromechanical backpack sprayers, which are more efficient sprayers regarding the droplet shape and deposition, when correctly adjusted and calibrated; however, they present two major problems: the first is the increasingly scarcity of workers for this type of work, which is laborious for the operator, and the second is its limited operational capacity.
In this sense, the present work highlights the spraying of fungicides using a UAV. The leaf rust and cercosporiosis progress curves denoted an effectively significant control, with no difference in the diseases’ progress between the treatments using a pneumatic sprayer and those using a UAV, at application rates of 10 and 15 L ha−1. The coffee leaf rust starts in the middle canopy layer towards the upper layer, and cercosporiosis occurs predominantly in the upper canopy layer. The application rate of 5 L ha−1 can be recommended when fungicide application is needed to control only cercosporiosis. However, in most cases, the application of mixtures of products is needed to reach different targets on the plant. The means found for agronomic efficiency and vegetative vigor presented no significant differences; it denotes the efficacy of the fungicides to control leaf rust and cercosporiosis when applied at the rates of 10 and 15 L ha−1 using a pneumatic sprayer and UAV. These results were reflected on coffee yield, which was not affected by the application method. The choice of the application method should consider application efficiency, operational capacity, and availability of workers. In this sense, the use of new technologies in crops, such as UAV, allows for a higher precision in the application, decreasing the use of chemical products and, consequently, environmental and human contaminations, without compromising the efficacy of pest and disease controls [37].
Considering the effects of the application method and rate on application efficiency and pesticide efficacy, a high application rate, as in the case of that applied (400 L ha−1) using a pneumatic sprayer in this work, has a direct effect on droplet diameter. The higher the application rate, the larger the droplet diameter generated and the lower the droplet density [38,39]. However, in contrast to the common knowledge that a higher liquid volume results in a better application quality, a more correct procedure is the use of a low volume, but producing the highest possible quantity of droplets, mainly in crops with a high leaf density, as is the case of coffee plants. This information reinforces the recommendation for using a UAV in coffee crops.
The high chlorophyll content in plants treated with fungicides explains their high vegetative vigor, regardless of the fungicide application method used (UAV or pneumatic sprayer). Strobilurin fungicides decrease the chlorophyll loss, which results in an effect in the field called the “green effect”, which was also found in the present study. This physiological effect is the result of increases in net photosynthesis, causing decreases in respiration and carbon loss of plants and increases in energy gain (ATP) and yield [40,41,42]. The maximum quantum efficiency of photosystem II (Fv/Fm) and proton conductivity of the thylakoid membrane (gH+) presented no significant differences between treatments related to the application method or rate. However, these variables presented significant increases when compared to the control treatment. Therefore, there was no negative effect on the activities of the photosynthetic apparatus of coffee leaves when using a UAV or pneumatic sprayer. Similar results were found for olive [43] and wheat [44] crops.
Although the results of the present study were significant for the use of UAV to control leaf rust and cercosporiosis in coffee crops grown in mountain regions, other experiments are needed to elucidate some issues regarding type of application tips, use of centrifugal distributor for application, operational flight speed and height, and monitoring of the effectiveness of the tested applications to control other pests and diseases.

5. Conclusions

An unmanned aerial vehicle (UAV) sprayer and a pneumatic sprayer were used for applications of fungicides to control leaf rust and cercosporiosis in coffee crops of the cultivar Catuai Vermelho IAC-44 grown in the mountain region of the state of Espirito Santo, Brazil. The droplet coverage, density, and deposition data were used to analyze the application efficiency; agronomic efficiency, vegetative vigor, physiological parameters, and yield were used to determine the efficacy of the fungicides applied. The main conclusions were:
(1)
The fungicide application using a UAV results in a low fungicide droplet coverage, density, and deposition, mainly in the lower canopy layer of coffee plants, regardless of the application rate. The highest droplet deposition was 1.60 µL cm−2, with an application of a rate of 15 L ha−1, which was less than 4.0% of the droplet deposition found for the application using a pneumatic sprayer;
(2)
Although variables related to UAV application efficiency showed lower results than those found for the pneumatic sprayer, variables connected to the fungicide efficacy presented similar results to those of the control. The agronomic efficiency found for control of cercosporiosis and leaf rust was 59.98 and 82.62%, respectively, when using a UAV (rate of 15 L ha−1), and 58.00% and 90.62% when using a pneumatic sprayer, respectively;
(3)
Under the experimental conditions, the control of fungal diseases through fungicide applications using a UAV did not interfere with vegetative vigor and yield of coffee plants;
(4)
The results found that the control of fungal diseases through fungicide applications using a UAV can be efficient for mountain coffee crops;
(5)
Further studies should be conducted to elucidate some issues regarding uniformity of distribution and penetration of droplets applied using a UAV, and determine the possibility of controlling a wider spectrum of pests and diseases in mountain coffee crops.

Author Contributions

Conceptualization, E.L.d.V., C.A.K. and F.R.P.B.; methodology, E.L.d.V., C.A.K. and F.R.P.B.; software, E.L.d.V.; validation, E.L.d.V. and C.A.K.; formal analysis, E.L.d.V. and C.A.K.; investigation, E.L.d.V. and C.A.K.; resources, E.L.d.V., L.F.O.R. and M.E.A.R.; data curation, E.L.d.V.; writing—original draft preparation, E.L.d.V., H.M.F.e.M. and M.R.F.J.; writing—review and editing, E.L.d.V., P.C., Y.L. and S.W.; visualization, E.L.d.V., P.C., Y.L. and S.W.; supervision, E.L.d.V.; project administration, E.L.d.V., C.A.K. and F.R.P.B.; funding acquisition, E.L.d.V. and F.R.P.B. All authors have read and agreed to the published version of the manuscript.

Funding

This study was financed in part by the Coordenação de Aperfeiçoamento de Pessoal de Nível Superior—Brasil (CAPES 18/2020) and Fundação de Amparo a Pesquisa do Espírito Santo (FAPES 140/2021)—Brazil. CAPES/FAPES Cooperation—Postgraduate Development Program—PDPG.

Data Availability Statement

Not applicable.

Conflicts of Interest

The authors declare no conflict of interest.

References

  1. International Coffee Organization (ICO). Statistics from the International Coffee Organization. 2022. Available online: https://www.ico.org/pt/about_statistics_p.asp?section=estat%edstica (accessed on 17 October 2022).
  2. United State Departament of Agriculture (USDA). Coffee: World Markets and Trade. 2022. Available online: https://www.fas.usda.gov/commodities/coffee (accessed on 17 October 2022).
  3. Company Nacional Supply (CONAB). Brazilian Coffee Crop. 2022. Available online: https://www.conab.gov.br/info-agro/safras/cafe (accessed on 17 October 2022).
  4. Kittichotsatsawat, Y.; Tippayawong, N.; Tippayawong, K.Y. Prediction of arabica coffee production using artificial neural network and multiple linear regression techniques. Sci. Rep. 2022, 12, 114. [Google Scholar] [CrossRef] [PubMed]
  5. Vitória, E.L.; Oliveira, R.F.; Crause, D.H.; Ribeiro, L.F.O. Effect of flight operative height and genotypes on conilon coffee spraying using an unmanned aerial vehicle. Coffee Sci. 2022, 17, 2003. [Google Scholar] [CrossRef]
  6. Souza, F.G.; Portes, M.F.; Silva, M.V.; Teixeira, M.M.; Furtado Júnior, M.R. Impact of sprayer drone flight height on droplet spectrum in mountainous coffee plantation. Rev. Bras Eng. Agric. E Ambient. 2022, 26, 901–906. [Google Scholar] [CrossRef]
  7. Palma, R.P.; Cunha, J.P.A.R.; Guimarães, E.C.; Santana, D.G.; Assunção, H.H.T. Multivariate analysis applied to spray deposition in ground application of phytosanitary products in coffee plants. Eng. Agr. 2021, 41, 458–467. [Google Scholar] [CrossRef]
  8. Alves, T.C.; Cunha, J.P.A.R.; Alves, G.S.; Silva, S.M.; Lemes, E.M. Canopy volume and application rate interaction on spray deposition for different phenological stages of coffee crop. Coffee Sci. 2020, 15, 1–14. [Google Scholar] [CrossRef]
  9. Lu, L.; Tibpromma, S.; Karunarathna, S.C. Comprehensive Review of Fungi on Coffee. Pathogens 2022, 11, 411. [Google Scholar] [CrossRef] [PubMed]
  10. Reichel, T.; Resende, M.L.V.; Monteiro, A.C.A.; Freitas, N.C.; Santos Botelho, D.M. Constitutive Defense Strategy of Coffee Under Field Conditions: A Comparative Assessment of Resistant and Susceptible Cultivars to Rust. Mol. Biotechnol. 2022, 64, 263–277. [Google Scholar] [CrossRef]
  11. Le, C.T.M.; Okane, I.; Ono, Y.; Tsuda, Y.; Yamaoka, Y. Incidence of Coffee Leaf Rust in Vietnam, Possible Original Sources and Subsequent Pathways of Migration. Front. Plant Sci. 2022, 13, 872877. [Google Scholar] [CrossRef]
  12. Andrade, C.C.L.; Vicentin, R.P.; Costa, J.R.; Perina, F.J.; Resende, M.L.V.; Alves, E. Alterations in antioxidant metabolism in coffee leaves infected by Cercospora coffeicola. Ciência. Rural. 2016, 46, 1764–1770. [Google Scholar] [CrossRef] [Green Version]
  13. Neto, J.G.; Cunha, J.P.A.R.; Marques, R.S.; Lasmar, O.; Borges, E.B. Spray deposition promoted by different sprayers on the mountain coffee crop. Coffee Sci. 2016, 11, 267–275. [Google Scholar]
  14. Confederation of Agriculture and Livestock of Brazil (CNA). Drone Spraying Makes the Sky the Next Agricultural Frontier for agro. 2022. Available online: https://cnabrasil.org.br/cna (accessed on 17 October 2022).
  15. Chen, P.; Lan, Y.; Huang, X.; Qi, H.; Wang, G.; Wang, J.; Wang, L.; Xiao, H. Droplet deposition and control of planthoppers of different nozzles in two-stage rice with a quadrotor unmanned aerial vehicle. Agronomy 2020, 10, 303. [Google Scholar] [CrossRef] [Green Version]
  16. Cao, Y.; Yu, F.; Xu, T.; Du, W.; Guo, Z.; Zhang, H. Effects of plant protection UAV-based spraying on the vertical distribution of droplet deposition on japonica rice plants in Northeast China. Int. J. Agric. Biol. Eng. 2021, 14, 27–34. [Google Scholar] [CrossRef]
  17. Zhang, S.; Qiu, B.; Xue, X.; Sun, T.; Gu, W.; Zhou, F.; Sun, X. Effects of crop protection unmanned aerial system flight speed, height on effective spraying width, droplet deposition and penetration rate, and control effect analysis on wheat aphids, powdery mildew, and head blight. Appl. Sci. 2021, 11, 712. [Google Scholar] [CrossRef]
  18. Qin, W.; Xue, X.; Zhang, S.; Gu, W.; Wang, B. Droplet deposition and efficiency of fungicides sprayed with small UAV against wheat powdery mildew. Int. J. Agric. Biol. Eng. 2018, 11, 27–32. [Google Scholar] [CrossRef] [Green Version]
  19. Meng, Y.; Zhong, W.; Liu, C.; Su, J.; Su, J.; Lan, Y.; Wang, Z.; Wabg, M. UAV spraying on citrus crop: Impact of tank-mix adjuvant on the contact angle and droplet distribution. PeerJ 2022, 10, e13064. [Google Scholar] [CrossRef] [PubMed]
  20. Zhang, X.Q.; Song, X.P.; Liang, Y.J.; Qin, Z.Q.; Zhang, B.Q.; Wei, J.J.; Li, Y.R.; Wu, J.M. Effects of Spray Parameters of Drone on the Droplet Deposition in Sugarcane Canopy. Sugar Tech. 2020, 22, 583–588. [Google Scholar] [CrossRef]
  21. Chen, P.; Lan, Y.; Douzals, J.P.; Ouyang, F.; Wang, J.; Xu, W. Droplet distribution of Unmanned Aerial Vehicle under several spray volumes and canopy heights in the cotton canopy. Int. J. Precis. Agric. Aviat. 2018, 1, 74–79. [Google Scholar] [CrossRef]
  22. Meng, Y.; Su, J.; Song, J.; Chen, W.H.; Lan, Y. Experimental evaluation of UAV spraying for peach trees of different shapes: Effects of operational parameters on droplet distribution. Comput. Electron. Agric. 2020, 170, 105282. [Google Scholar] [CrossRef]
  23. Wang, C.; Liu, Y.; Zhang, Z.; Han, L.; Li, Y.; Zhang, H.; Wongsuk, S.; Li, Y.; Wu, X.; He, X. Spray performance evaluation of a six-rotor unmanned aerial vehicle sprayer for pesticide application using an orchard operation mode in apple orchards. Pest Manag. Sci. 2022, 78, 2449–2466. [Google Scholar] [CrossRef]
  24. Nascimento, V.P.; Vitória, E.L. Spraying quality using unmanned aerial vehicle in citrus. Rev. Eng. Agric. 2022, 30, 214–221. [Google Scholar] [CrossRef]
  25. Meng, Y.; Zhong, W.; Liu, Y.; Wang, M.; Lan, Y. Droplet Distribution of an Autonomous UAV-based Sprayer in Citrus Tree Canopy. J. Phys. Conf. Ser. 2022, 1, 2203. [Google Scholar] [CrossRef]
  26. Xiao, Q.; Du, R.; Yang, L.; Han, X.; Zhao, S.; Zhang, G.; Fu, W.; Wang, G.; Lan, Y. Comparison of droplet deposition control efficacy on phytophthora capsica and aphids in the processing pepper field of the unmanned aerial vehicle and knapsack sprayer. Agronomy 2020, 10, 215. [Google Scholar] [CrossRef] [Green Version]
  27. Wang, G.; Li, X.; Andaloro, J.; Chen, P.; Song, C.; Shan, C.; Lan, Y. Deposition and biological efficacy of UAV-based low-volume application in rice fields. Int. J. Precis. Agric. Aviat. 2018, 1, 65–72. [Google Scholar] [CrossRef]
  28. ISO22866; I. S. O. Equipment for Crop Protection-Methods for Field Measurements of Spray Drift. International Organization for Standardization: Geneva, Switzerland, 2005; pp. 1–17.
  29. Wang, C.; Zeng, A.; He, X.; Song, J.; Herbst, A.; Gao, W. Spray drift characteristics test of unmanned aerial vehicle spray unit under wind tunnel conditions. Int. J. Agric. Biol. Eng. 2020, 13, 13–21. [Google Scholar] [CrossRef]
  30. Suparyanto, T.; Firmansyah, E.; Wawan, C.T.; Sudigyo, D.; Pardamean, B. Detecting Hemileia vastatrix using Vision AI as Supporting to Food Security for Smallholder Coffee Commodities. IOP Conf. Ser. Earth Environ. Sci. 2022, 998, 012044. [Google Scholar] [CrossRef]
  31. Rodrigues, A.S.B.; Silva, D.N.; Várzea, V.; Paulo, O.S.; Batista, D. Worldwide Population Structure of the Coffee Rust Fungus Hemileia vastatrix Is Strongly Shaped by Local Adaptation and Breeding History. Phytopathology 2022, 112, 1998–2011. [Google Scholar] [CrossRef]
  32. Tang, Q.; Zhang, R.; Chen, L.; Deng, W.; Xu, M.; Xu, G.; Li, l.; Hewitt, A. Numerical simulation of the downwash flow field and droplet movement from an unmanned helicopter for crop spraying. Comput. Electron. Agric. 2020, 174, 105468. [Google Scholar] [CrossRef]
  33. Coombes, M.; Newton, S.; Knowles, J.; Garmory, A. The influence of rotor downwash on spray distribution under a quadrotor unmanned aerial system. Comput. Electron. Agric. 2022, 196, 106807. [Google Scholar] [CrossRef]
  34. Li, H.; Zhu, H.; Jiang, Z.; Lan, Y. Performance characterization on downwash flow and spray drift of multirotor unmanned agricultural aircraft system based on CFD. Int. J. Agric. Biol. Eng. 2022, 15, 1–8. [Google Scholar] [CrossRef]
  35. Lan, Y.; Qian, S.; Chen, S.; Zhao, Y.; Deng, X.; Wang, G.; Zang, Y.; Wang, J.; Qiu, X. Influence of the downwash wind field of plant protection UAV on droplet deposition distribution characteristics at different flight heights. Agronomy 2021, 11, 2399. [Google Scholar] [CrossRef]
  36. Orrico, A.C.A.; Orrico Junior, M.A.P.; Lucas Junior, J.; Fernandes, R.A.M.; Sunada, S.; Rodrigues, J.P. Spray equipments associated at different volume rates and assessed by artificial targets on coffee tree. Rev. Agrar. 2011, 4, 222–227. [Google Scholar]
  37. Giles, D.K.; Billing, R.C. Deployment and performance of a uav for crop spraying. Chem. Eng. Trans. 2015, 44, 307–312. [Google Scholar] [CrossRef]
  38. Martinez-Guanter, J.; Agüera, P.; Agüera, J.; Pérez-Ruiz, M. Spray and economics assessment of a UAV-based ultra-low-volume application in olive and citrus orchards. Precis. Agric. 2020, 21, 226–243. [Google Scholar] [CrossRef]
  39. Zhang, P.; Deng, L.; Lyu, Q.; Shaolan, H.; Shilai, Y.; Yande, L.; Yongxu, Y.; Haiyang, P. Effects of citrus tree-shape and spraying height of small unmanned aerial vehicle on droplet distribution. Int. J. Agric. Biol. Eng. 2016, 9, 45–52. [Google Scholar] [CrossRef]
  40. Lima, J.D.; Silva, M.W.; Silva, S.H.M.G. Respostas fisiológicas em mudas de bananeira tratadas com estrobilurinas. Semin. Agrar. 2012, 33, 77–86. [Google Scholar] [CrossRef] [Green Version]
  41. Honorato Júnior, J.; Zambolim, L.; Aucique-Pérez, C.E.; Resende, R.S.; Rodrigues, F.A. Photosynthetic and antioxidative alterations in coffee leaves caused by epoxiconazole and pyraclostrobin sprays and Hemileia vastatrix infection. Pestic. Biochem. Physiol. 2015, 123, 31–39. [Google Scholar] [CrossRef]
  42. Carmona, M.; Gally, M.; Sautua, F.; Abello, A.; Lopez, P. Uso de mezclas de azoxistrobina y triazoles para controlar enfermedades de fin de ciclo de la soja. Summa Phytopathol. 2011, 37, 134–139. [Google Scholar] [CrossRef] [Green Version]
  43. Korzin, V.; Tsiupka, S.; Plugatar, Y.; Tsiupka, V.; Shoferistov, E.; Korzh, D. International Society for Horticultural Science. ISHS Acta Hortic. 2022, 1339, 377–382. [Google Scholar] [CrossRef]
  44. Rodrigues, F.A.; Rios, J.A.; Debona, D.; Aucique-Pérez, C.E. Pyricularia oryzae-wheat interaction: Physiological changes and disease management using mineral nutrition and fungicides. Trop Plant Pathol. 2017, 42, 223–229. [Google Scholar] [CrossRef]
Figure 1. Multirotor unmanned aerial vehicle used for spraying in the experiment.
Agronomy 13 00340 g001
Figure 2. Pneumatic sprayer used for application in the control treatment.
Agronomy 13 00340 g002
Figure 3. Experimental design.
Agronomy 13 00340 g003
Figure 4. Arrangement of water-sensitive paper tags using PVC templates.
Agronomy 13 00340 g004
Figure 5. Wireless DropletScope® System.
Agronomy 13 00340 g005
Figure 6. Climate conditions monitored during the study, considering rainfall depth (mm), relative air humidity (%), and temperature (°C), shown as biweekly means, based on daily data from June 2021 to June 2022, in Marechal Floriano, ES, Brazil.
Agronomy 13 00340 g006
Figure 7. Droplet distribution in coffee layers using different application rates. Bars represent the treatments: T1, T2, T3, T4, T5, T6, T7, T8, and T9, from left to right. Means followed by the same lowercase letter between layers do not differ at 0.05 level of significance by Tukey’s test.
Agronomy 13 00340 g007
Figure 8. Droplet distribution in coffee plant canopy layers using different application rates. Bars represent the treatments: T1, T2, T3, T4, T5, T6, T7, T8, and T9, from left to right. Means followed by the same lower-case letter between application rates do not differ at 0.05 level of significance by Tukey’s test.
Agronomy 13 00340 g008
Figure 9. Disease progress curves for leaf rust (a) and cercosporiosis (b) in the treatments tested. Curves followed by the same letter are not different from each other by Tukey’s test at a 5% significance level.
Agronomy 13 00340 g009
Figure 10. Agronomic efficiency, yield, vegetative vigor, and area under the disease progress curve (AUDPC) for leaf rust (a) and cercosporiosis (b) in the treatments tested. Bars with the same uppercase letter comparing agronomic efficiency, or lowercase letter comparing yield and vegetative vigor, are not different from each other by Tukey’s test at 5% significance.
Agronomy 13 00340 g010
Table 1. Specifications of the UAV DJI Agras MG-1P.
Number of rotors6
Flight speed0 to 12 m s−1
Operating speed0 to 8 m s−1
Tank capacity10 L
Flight time capacity10 to 25 min
Spray nozzle typeFlat fan
Number of nozzles4
Distribution of nozzlesBelow 4 rotors in sequence
Table 2. Experimental treatments for analysis of application quality variables.
TreatmentApplication Rate
(L ha−1)
Collection Height in the Canopy
(Layer)
Flight Height
(above the Crop Canopy)
T15.0Upper2.5
T210.0Upper2.5
T315.0Upper2.5
T45.0Middle2.5
T510.0Middle2.5
T615.0Middle2.5
T75.0Lower2.5
T810.0Lower2.5
T915.0Lower2.5
Control400Upper, middle, and lower-
Table 3. Climate conditions during the pesticide applications.
Application DateApplication Rate
(L ha−1)
Temperature
(°C)
Relative Air Humidity
(%)
Wind Speed
(m s−1)
minmaxminmaxminmax
8 September 2021522.424.062.067.00.82.1
1022.724.063.067.00.72.2
1523.024.160.066.01.12.7
40023.124.061.064.00.92.4
14 January 2022524.125.867700.61.1
1024.225.566690.51.1
1524.526.066700.81.2
40025.027.567681.01.2
Table 4. Active ingredients for the prevention and control of leaf rust and cercosporiosis in coffee plants, application date, concentration, application rate, and application method.
Application DateActive Ingredient + AdjuvantConcentrationApplication RateApplication Method
8 September 2021Cyproconazole, soluble concentrate (Priori Xtra, Syngenta®) + adjuvant Alkyl ester phosphate, emulsifiable concentrate (Ochima, Syngenta®) at a rate of 400 mL ha−1100 g a.i. ha−15 L ha−1UAV
10 L ha−1
15 L ha−1
400 L ha−1Pneumatic sprayer
14 January 2022Azoxystrobin/cyproconazole, concentrate suspension ((Priori Xtra, Syngenta®) + adjuvant Alkyl ester phosphate, emulsifiable concentrate (Ochima, Syngenta® at a rate of 400 mL ha−1280 g a.i. ha−15 L ha−1UAV
10 L ha−1
15 L ha−1
400 L ha−1Pneumatic sprayer
Table 5. Analysis of variance (ANOVA) for the effects of the application rates and canopy layers of coffee plants.
Source of VariationDegrees of FreedomDroplet CoverageDroplet DensityDroplet Deposition
Meanp-ValueMeanp-ValueMeanp-Value
Rate (R)22.8030.034 *347.1810.047 *0.5890.040 *
Layer (L)26.126<0.001 **792.401<0.001 **0.2510.039 *
R × L40.1240.744 ns34.1350.719 ns0.0250.842 ns
Error630.255-65.100-0.074-
* sigficant p-valor < 0.05; ** sigficant p-valor < 0.01; ns non-significant.
Table 6. Mean droplet coverage (CO, %), density (DN, droplets cm−2), and deposition (DP, µL cm−2) in the upper (UP), middle (MD), and lower (LW) layers of coffee plant canopies by treatments using a UAV, compared to the control treatment.
Application with Pneumatic Sprayer at 400 L ha−1 (Control)
Upper LayerMiddle LayerLower Layer
CO28.7017.429.53
DN129.75113.7491.28
DP42.6727.7211.47
UAV 5 L ha−1UAV 10 L ha−1UAV 15 L ha−1
UPMDLWUPMDLWUPMDLW
CO4.69 **1.33 **1.21 **6.37 **2.81 **1.29 **6.98 **4.54 **2.21 **
DN10.11 **6.92 **4.19 **14.21 **8.19 **5.01 **15.70 **10.07 **8.58 **
DP0.61 **0.25 **0.12 **1.33 **0.26 **0.33 **1.60 **1.04 **0.43 **
** means significantly different from the control treatment by the Dunnett test (p < 0.01).
Table 7. Physiological parameters in coffee arabica (cultivar Catuai Vermelho IAC-44) under fungicide treatments for prevention of diseases, applied using a UAV and pneumatic sprayers, Marechal Floriano, ES, Brazil, 2021/2022 crop season.
Physiological
Parameters
Treatments
ControlT5T10T15T400
TCC (%)56.72 b62.32 a62.14 a62.94 a62.87 a
Fv/Fm0.745 b0.807 a0.801 a0.826 a0.793 a
gH+140.19 a225.59 a215.71 a156.33 a157.81 a
TCC = total chlorophyll contents; gH+ = proton conductivity of the thylakoid membrane; Fv/Fm = maximum quantum efficiency of photosystem II. Means followed by the same lower-case letter in the row do not differ at 0.05 level of significance by Tukey’s test.
Disclaimer/Publisher’s Note: The statements, opinions and data contained in all publications are solely those of the individual author(s) and contributor(s) and not of MDPI and/or the editor(s). MDPI and/or the editor(s) disclaim responsibility for any injury to people or property resulting from any ideas, methods, instructions or products referred to in the content.

