1. Introduction
In view of the growing world population, meeting the demand for food and improving the sustainability of agriculture are major challenges [
1,
2]. Farmers are being encouraged to increase agricultural production in response to climate change, and researchers are being encouraged to develop innovative products and technologies that can increase crop yield and quality while reducing their carbon footprint [
3].
Biostimulants are ecological and cost-effective alternatives to synthetic products, fertilizers, plant protection products, and plant growth regulators [
4]. Biostimulants are products that, when used in low doses on seeds, crops, or soil, regulate and enhance the physiological processes of crops [
5]. Biostimulants affect plant physiology in a variety of ways, improving crop growth, yield, quality, nutrient uptake, tolerance to abiotic stress, and the shelf life of harvested products [
6]. Biofertilizers are products that contain live microorganisms or natural substances that can improve the chemical and biological soil properties, promoting plant growth and restoring soil fertility [
7].
Agricultural activities must be sustainable, be environmentally friendly, and produce quality products that consumers want to buy. Legislators must also pay special attention to the side-effects related to the use of conventional synthetic substances (fertilizers, pesticides, etc.), including risks to consumers (residues in products) and the environment (biodegradability problem, threat to bees). This might encourage the use of modern bio-based products in agriculture, some of which may be safe substitutes, while others may complement products currently used in agriculture [
8].
Bio-based products can play an important part in soil physical and chemical processes [
9,
10].
For example, researchers have suggested a high-carbon product produced by burning high-temperature, oxygen-free agricultural or other organic waste (by pyrolysis). Researchers claim that this product will improve soil pH and that it may affect the abundance of microorganisms due to its special structure and nutrients, or indirectly affect the physicochemical soil properties [
11,
12,
13,
14,
15].
Agroecosystems, which usually have a well-defined system for their use, often control inputs that directly affect the soil [
16]. Other researchers argue that there is a need to think about the future, i.e., whether it is worthwhile to replace some synthetic substances used in agriculture with organic products, as crop production schemes are currently based on the use of fertilizers and the chemical protection of plants [
17]. Farming systems are more sustainable when using different types of biological fertilizers. Biofertilizers have been found to be very effective in areas with low yields and low soil organic carbon (SOC) [
18].
Soil microbes may fix or dissolve plant nutrients, produce plant growth hormones, decompose agricultural waste, increase soil carbon sequestration, act as biocontrol agents for pests and diseases, and decompose toxic residues of agrochemicals in agricultural soil [
19,
20,
21,
22,
23].
The pace of the green revolution is slowing, while the stocks of human food and raw biomass are deteriorating. A possible sustainable way to address these problems is to use products of biological origin to maintain the soil biological activity. The use of products of biological origin can improve the nutritional and energy efficiency of crops, or the production of raw biomass. These natural measures will help to absorb the biomass of catch crops more efficiently, improve their impact on soil properties, reduce nutrient leaching and GHG emissions, improve the development of key products, and have a positive impact on the quantity and quality of crops [
24].
Experimental studies have revealed that tillage increases soil CO
2 emissions and that discrepancies may be due to differences in soil and environmental characteristics, climate, and soil structure, which affect the differences between tillage and no-till (NT) soil CO
2 emissions [
25]. Soil CO
2 also depends on a number of properties, such as moisture, temperature, and chemical and biological properties [
26]. Tillage ensures that the soil is turned over and the residues are fully incorporated into the soil, while no-till (NT) is a management practice that does not require tillage operations. There is no consensus in the literature on the impact of tillage practices on soil CO
2 emissions. Non-tillage and minimum tillage have been reported to reduce soil CO
2 emissions (CP) in short-term tillage systems compared to conventional tillage [
27,
28].
We hypothesized that appropriate soil tillage using biostimulants and mixtures of them together could have a positive influence on increasing soil carbon and nitrogen content and on the intensity of soil CO2 emission.
The aim of this work was to assess the soil CO2 emissions, soil carbon, soil nitrogen, humus, and humic substances using two different soil tillage management methods (no till—wheat straw left on the soil surface; and reduced till—soil incorporation of the wheat straw) and different biostimulants or nitrogen fertilization.
2. Materials and Methods
2.1. Experimental Site and Management
The field experiment was performed at the Experimental Station of Vytautas Magnus University Agriculture Academy in Lithuania from 2018 to 2020. The soil researched was (IDg4-k) (LVg-n-w-cc)—carbonate deeper gleyic leachate (Calc(ar)i-Endohypogleyic Luvisol). The granulometric composition of the soil was sand 35.6%, clay 19.0%, and silt 45.4%. The soil medium was close to neutral at pH 6.0–6.7, and it had high and very high phosphorus content with an average of 285.8 mg kg−1, and high potassium content at 240.0 mg kg−1. The content of organic carbon (Corg) in the fields of the experiment ranged from 1.11 to 1.28%, and the total nitrogen (Ntotal) content was from 0.009% to 0.110%.
The investigation where spring and winter wheat was applied was carried out in 2018–2020. The soil biostimulants and their mixtures using different tillage technologies were investigated in a two-factor field experiment. In the no-till soil tillage treatment, white mustard was grown as a catch crop.
Experimental treatments:
Factor A: soil tillage technology.
Factor B: measures to encourage the decomposition of plant residues and to improve and maintain soil fertility (biostimulants, their mixtures, and their rates)
N8—compensatory nitrogen at 8 kg per ton of straw, without biological preparations;
R 1.0 L ha−1;
P 0.2 L ha−1;
A 1.0 L ha−1;
R l.0 ha−1 + P 0.2 L ha−1;
R 1.0 L ha−1 + A 0.5 L ha−1;
P 0.2 L ha−1 + A 1.0 L ha−1;
R 1.0 L ha−1 + P 0.2 L ha−1 + A 0.5 L ha−1.
The following soil biostimulants were used in the experiment:
Ruinex (1 L ha−1): biological preparation intended to activate the decomposition and mineralization of plant residues. This preparation contains the fungus Trichoderma sp., which has an antibacterial effect, secreting antibiotic substances that protect plants from pathogens and reduce their activity. This preparation is suitable for all types of soils and restores their natural properties. It is enriched with phytohormones which, when introduced into a plant, regulate cellular processes and stimulate plant growth and development. Due to the abovementioned properties of the preparation, the productivity of field plants increases. This biostimulant can be used in mixtures with other biological preparations and with glyphosates.
Penergetic (0.2 L ha
−1): improves the mineralization and humification processes of plant residues and supports natural soil fertility. It is a soil- and plant-growth biostimulant produced from bentonite clay under the action of electric and magnetic fields; the manufacturer does not disclose its detailed composition [
29]. To accelerate straw mineralization, the preparation can be used in combination with azobacterial preparations. Such a combination promotes the destruction and transformation of straw into more complex compounds.
Penergetic can also be used to stimulate aerobic processes in compost and manure and to reduce nutrient leaching. This preparation is used in compost and manure storage areas, and it is also recommended to use it in barns after each scraping.
Azofix (1 L ha−1): Azotobacter sp. bacteria in the preparation act by breaking down organic matter, fixing atmospheric nitrogen, making it available to plants, increasing the amount of nitrogen in the soil, and improving soil structure.
In the location chosen for the experiment, spring wheat was grown in 2018, winter wheat was grown in 2019, and spring wheat was grown in 2020. After the harvest, the straw was shredded and spread over the stubble in the entire experimental area. The stubble was left 20–25 cm high. Such agroecosystems are called unstable because their sustainability decreases every year, but the three years of seeding and high stubble will make it possible to highlight the effectiveness of the measures studied (soil biostimulants) more quickly. According to the experimental scheme, the stubble was sprayed with different soil biostimulants and their mixtures: N8 – at 8 kg per ton of straw, R – 1.0 L ha−1; P – 0.2 l ha−1; A – 1.0 L ha−1; R + P – l.0 + 0.2 L ha−1; R + A – 1.0 + 0.5 L ha−1; P + A – 0.2 +1.0 L ha−1; R + P + A – 1.0 + L 0.2 + 0.5 L ha−1. The experimental plots were of the same size in terms of both gross plot (72 m2) and net plot (60 m2). The treatments were arranged randomly in four replication blocks and 72 plots in total. In half of the experimental area (in cases of cloudy weather), the plant residues were immediately (within 1 h) incorporated into the soil at a depth of 5–7 cm with a Cartier CR 300 (Vaderstad) disc cultivator (reduced-tillage treatment). The other half of the area was left untilled (no-till treatment). In the spring, spraying of biostimulants and their mixtures was repeated.
In the spring wheat sowing of 2018, the crops were fertilized with azofoska N15P15K15 300 kg ha−1. In the autumn of 2018, “Seilor” winter wheat was sown and fertilized with azofoska N8P20K30 350 kg ha−1. No additional nitrogen fertilizers were used. In 2019, at the beginning of the winter wheat vegetation period in the spring, the wheat was additionally fertilized with nitrate at 300 kg ha−1.
In 2019, in the crop under the no-till treatment, white mustard was sown at 16 kg ha−1. The reduced-tillage treatments were disked to a depth of 5–7 cm, and the crop of white mustard was left to overwinter.
In 2020, before sowing, the soil under reduced tillage was disked one more time and fertilized locally with a complex fertilizer N16P16K16, 270 kg ha−1. Spring wheat “Wicki” was sown at 320 kg ha−1 at a depth of 4–5 cm. At the beginning of the vegetation period, 120 kg ha−1 of ammonium nitrate was spread. On May 4th, the wheat was sprayed with the herbicides Elegant 0.4 L ha−1 (active substance: florasulam 6.25 g L−1 + 2,4-D 300 g L−1) and Trimmer 10 g ha−1 (active substance: tribenuron-methyl 500 g kg−1). Fungicides were not used in the experiment.
2.2. Meteorological Conditions
The spring of 2018 was early, with the average temperature rising to 10.2 °C, while the long-term average was 6.9 °C (
Table 1). The average precipitation in April 2018 was 64.8 mm, which was 23.5 mm higher than the long-term average (
Table 2). The vegetation period was favorable for the growth and development of spring cereals. In April 2020, the average air temperature corresponded to the long-term averages, but the average precipitation was only 4.0 mm—10 times less than the long-term average for this month of 41.0 mm. It was very hard for the wheat sown to germinate, and the first seedlings only appeared a month later. The average temperature in May was 3 °C lower than the long-term average, but the average precipitation was 1.3 times higher. During this period, the intensive formation of productive elements of plants usually takes place. In July, when the cereals were maturing, the average air temperature was 3.5 °C lower and the average precipitation was 36.2 mm lower than the long-term average. At the end of July and in August, the conditions for harvesting were favorable.
2.3. Sampling and Analysis
Soil sampling for the evaluation of humus before the experiment was set up (2017); total N and SOC in the soil was carried out in the autumn after harvesting after the application of the investigated measures (2018 and 2020). Soil samples were taken in each plot at a 0–10 cm depth of the plow layer from 10 spots in each plot. Visible roots and plant residues were removed from the soil samples by hand. Air-dried soil samples were crushed, sieved through a 2 mm sieve, and homogeneously mixed. Humus and carbon contents (%) were measured using a Heraeus analyzer. The contents of SOC, mobile humic acids, and extracted humic substances were determined using the photometric method at a wavelength of 590 nm using the UV-VIS spectrophotometer Cary 50 (“Varian”, Palo Alto, CA, USA) [
30].
2.4. Estimation and Computation of CO2 Emission
Soil CO
2 emissions were measured using an infrared gas analyzer, obtaining measurements of the soil surface soil CO
2 efflux (μmoL m
−2 s
−1). The investigation was only carried out in the first and third years of the research. A portable, automated soil gas flux LI-8100A system with an 8100-103 chamber analyzer (LI-COR Inc. Lincoln, NE, U.S.A) was used. In each experimental plot, in spring, rings of 20 cm in diameter were installed in the soil, with three measurements made in each plot [
31,
32]. Soil CO
2 efflux measurement was carried out three times during the vegetation period, at the same time of day (from 10 a.m. to 5 p.m.) and at fixed locations in the plot. At the start of a measurement, the LI-8100 chamber was held open above the soil collar and the system measured the ambient soil CO
2 concentration
(Cc(0)). When the chamber was closed on the soil collar, the soil CO
2 concentration in the chamber
(Cc(t)) began to rise. Ignoring the dilution effect of water vapor, the rate of change in chamber soil CO
2 concentration with time
(∂Cc/∂t) is given by:
where
Cs is the soil CO
2 concentration (µmol mol
−1) in the soil surface layers and A (s
−1) is a rate constant that is proportional to the CO
2 conductance at the soil surface and the surface-to-volume ratio of the chamber. If
A and
Cs are constant, then integration with respect to time gives:
In the LI-8100 system, the chamber soil CO2 concentrations Cc(t) versus time data were fitted with an exponential function of the form given in Equation (2), yielding values for the parameters A and Cs. Soil CO2 flux was then obtained by calculating the initial slope (∂Cc(t))/∂t from equation (1) at time zero when the chamber touched down and Cc(0) = ambient. A complete description of the equations used in the LI-8100 system, including details of the dilution corrections due to water vapor, is given in the LI-8100 Instruction Manual.
2.5. Statistical Analysis
The research data were statistically evaluated using a two-way analysis of variance (ANOVA) of quantitative traits using the computer program package SPSS, and the LSD test was applied. The Kruskal–Wallis test (p < 0.05) was applied to the data that did not correspond to a normal distribution (e.g., soil CO2 emissions).
3. Results
The influence of the two factors and their interactions (the soil biostimulants and their mixtures using different tillage technologies) was investigated using a two-way ANOVA (
Table 3), which showed that significant results (
p < 0.01 and
p < 0.001) occurred for the values of each individual factor and their combinations.
3.1. Variation in Humus Content
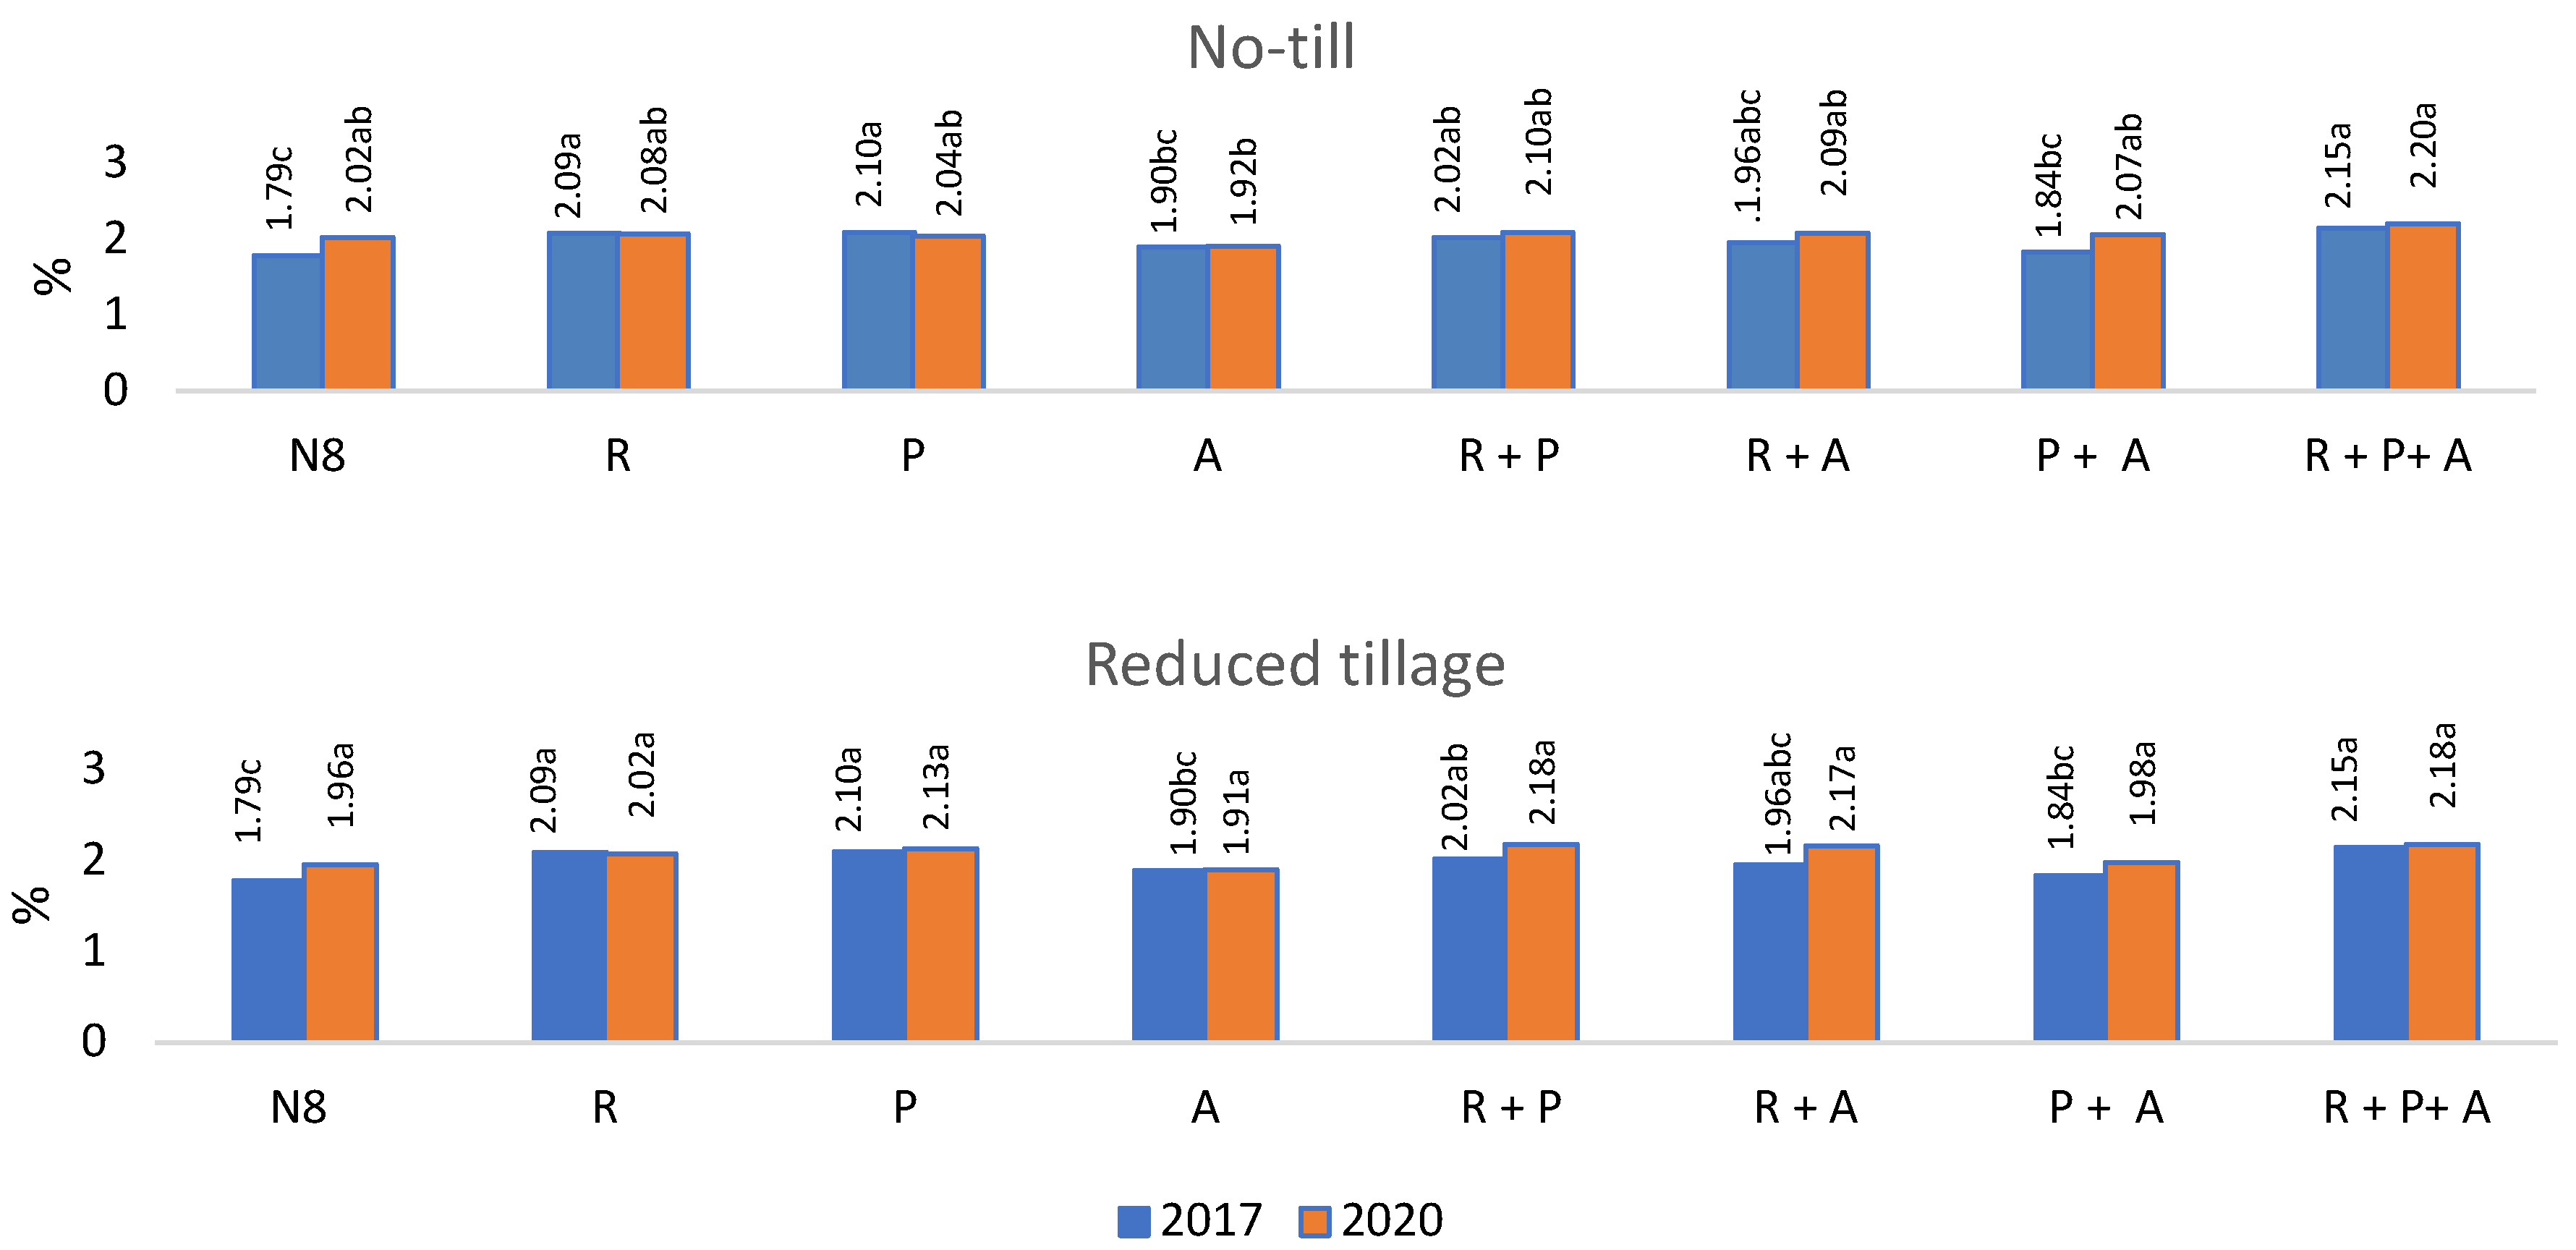
If cereals make up a significant part of a crop rotation the humus content decreases more intensively. Intensive movement of the soil promotes the breakdown of humus as well. Reduced tillage and no-till were applied in the experiment, but tillage treatment did not have a significant effect on the humus content. After three years of seeding cereals, an insignificant decrease in humus stocks was observed with the use of the biostimulant P, and little change was noted with the use of R and A, in both tillage backgrounds. The use of nitrogen fertilizers to stimulate mineralization and biostimulant mixtures increased humus stocks under both tillage technologies. The use of compensatory nitrogen and mixtures of biostimulants, namely R + P, R + A, and P + A, had a positive effect on humus growth under both tillage technologies (
Figure 1). Not all differences were significant, but a tendency to higher humus content was observed in the mentioned treatments. Humus stocks increased with the use of a mixture of all three soil biostimulants (R + P + A), but not as well as with mixtures of two biostimulants. It can be assumed that the use of the soil biostimulant A, both alone and in mixtures, does not reduce the humus content of R + P in the soil and it remains sufficiently stable. The use of compensatory nitrogen did not reduce the humus content. The use of three biostimulants in the mixture had less of an effect on humus changes but did not reduce its stocks.
3.2. Nitrogen and Organic Carbon and Their Ratio in the Soil
The carbon content decreased during the two-year study period, but no significant impact of tillage technology was identified. Under reduced tillage, the carbon content in the soil changed more slowly compared to no-till technology: under the no-till treatment, C
org increased from 5.5% to 15.6%, and under reduced tillage, it increased from 2.3% to 13.6% (
Table 4).
When nitrogen fertilizer was used to promote straw decomposition, the Corg content did not change. There was little change in the background with no-till when using a mixture of preparations of P + A, and under reduced tillage when using R + P and R + A. The lowest Corg content was found with the use of preparation A, but the largest decrease was observed with the use of preparation P under no-till technology. When the stubble was sprayed with a mixture of all three preparations, the content of Corg decreased by 13.5% in two years under both technologies. The catch crop of white mustard sown after the winter wheat harvest may have had a significant effect on the reduction in carbon content in the crop under no-till.
In 2018, tillage treatment had a small impact on nitrogen depletion. In our experiment, wheat was seeded for three years, and no additional nitrogen was added in the first year of the process. In 2020, after the spring wheat harvest, a decrease in mineral nitrogen was found compared to the same period in 2017 (before the experiment was set up). N content changed the least with the use of reduced-tillage technology and the use of soil biostimulant P and a mixture of R + P; with biostimulant R containing the fungus Trichoderma sp., which exhibits antibacterial activity and also promotes the decomposition of plant residues, the total nitrogen content decreased. Using a non-mixed preparation, biostimulant A containing Azotobacter sp. bacteria, these bacteria fixed atmospheric nitrogen by decomposing organic matter, and the total nitrogen content also decreased by 0.02%. It can be assumed that biostimulants A and P and the mixture R + P improved the availability of nitrogen to plants so that less of it remained in the soil sorbed complex after harvest. The soil bio-activator R released nitrogen better when used in a mixture with P (R + P), and the effect of other biostimulants and their mixtures on the changes in total nitrogen was similar.
Straw is high in carbon and low in nitrogen, and so without the addition of nitrogen, microorganisms will use the nitrogen in the soil to break it down. The optimal ratio of carbon to nitrogen is 18:1–25:1. When straw is added to the soil, it gradually decomposes and replenishes the soil’s carbon, humus, and nutrient stocks. At the beginning of our experiment and after two years, the C:N ratio changed little, but tended to decrease (
Table 3).
To encourage straw mineralization, 8–10 kg of nitrogen active substance per ton of straw should be added. After the soil studies in 2018, it was thought that it is better to use biostimulator A and mixtures containing it to increase the organic carbon in the soil, as its effect was slower and more stable than that of nitrogen fertilizers. The concentration of nitrogen fertilizer increases significantly immediately after spreading, and a sudden increase has a negative effect on the organic carbon content in the soil. Its content did not change during the two years of the experiment, and a decrease was observed after three years. Soil studies in 2020 revealed that the organic carbon content changed less with the use of biostimulator A in a mixture with R and P (R + A and P + A), as well as a mixture of the latter (R + P).
3.3. The Soil Content of Water-Soluble Carbon and Mobile Humic Substances and Acids
An increase in water-soluble carbon was observed during the two-year study period (
Table 5). In the no-till soil, water-soluble carbon increased by an average of 9.0%, compared to only 2.3% under reduced tillage. In the no-till stubble, in 2019, a catch crop of white mustard was sown. Therefore, it can be assumed that the cultivation of the intercrop promoted the release of low-molecular-weight C in the soil. All biological preparations promoted an increase in soluble C in the soil compared to the use of nitrogen fertilizers, especially when all three biostimulants were used in a mixture (R + P + A). The effect of the mixtures of two biostimulants was also stronger compared to using them outside the mixture. A reduction in soluble carbon was observed under reduced-tillage technology and when using nitrogen fertilizers, as well as single-component biostimulants R and A. The use of biostimulants in the mixtures also increased the stocks of water-soluble carbon in the soil, but not as intensively (1.6 times less on average) as under no-till. The largest increase was obtained by spraying the stubble with a mixture of three biostimulants, R + P + A, and two biostimulants, P + A.
This study, carried out two years ago, found that the water-soluble soil carbon content was higher when using mixtures of two biostimulants (R + P, R + A, and P + A). The same trend was observed in both tillage backgrounds: soluble carbon increased from 2.9 to 12.2% after only stubble spreading, and from 1.4 to 10.3% after the incorporation of mixtures of preparations. The combination of the three preparations increased the water-soluble soil carbon content by 2.4% when only applying reduced-tillage technology.
Mobile humic substances and mobile humic acids act as soil improvers and plant biostimulants. Humic acids, compared to other organic substances, particularly promote the growth of plant biomass and soil fertility. Another very important advantage is that humic acids have a long duration of action, as they are not degraded as quickly as other organic fertilizers and improve the soil for up to 2–3 years.
Two years later, an assessment of the changes in the content of mobile humic substances (MHSs) and mobile humic acids (MHAs) in the soil showed that the use of nitrogen fertilizers to stimulate straw mineralization reduces the content of these substances in the soil (
Table 4). MHA decreased in the no-till stubble with the use of biostimulant A and a mixture of R + P, and in the case of reduced tillage after using R. The MHA content increased with the use of other measures. In addition to the tillage background in the soil, all biostimulants increased the MHS content, especially the mixtures of P + A and R + P + A. In the reduced-tillage crop, the application of R reduced the MHA content in the soil, while other biological measures increased the content of these substances, in many cases more than their application with no-till technology.
In the crop under reduced-tillage technology, the influence of soil biostimulants was insignificant, and in the crop in the no-till treatment significantly higher soil CO2 emissions were found in the stubble when using P + A and R + P + A compared to single-component P and A and a mixture of R + A. The use of nitrogen fertilizers did not contribute to soil CO2 emissions but did not differ significantly from the use of other bioproducts in the crops of the two technologies.
3.4. The Influence of Biostimulants and Their Mixtures on Soil CO2 Emission Intensity
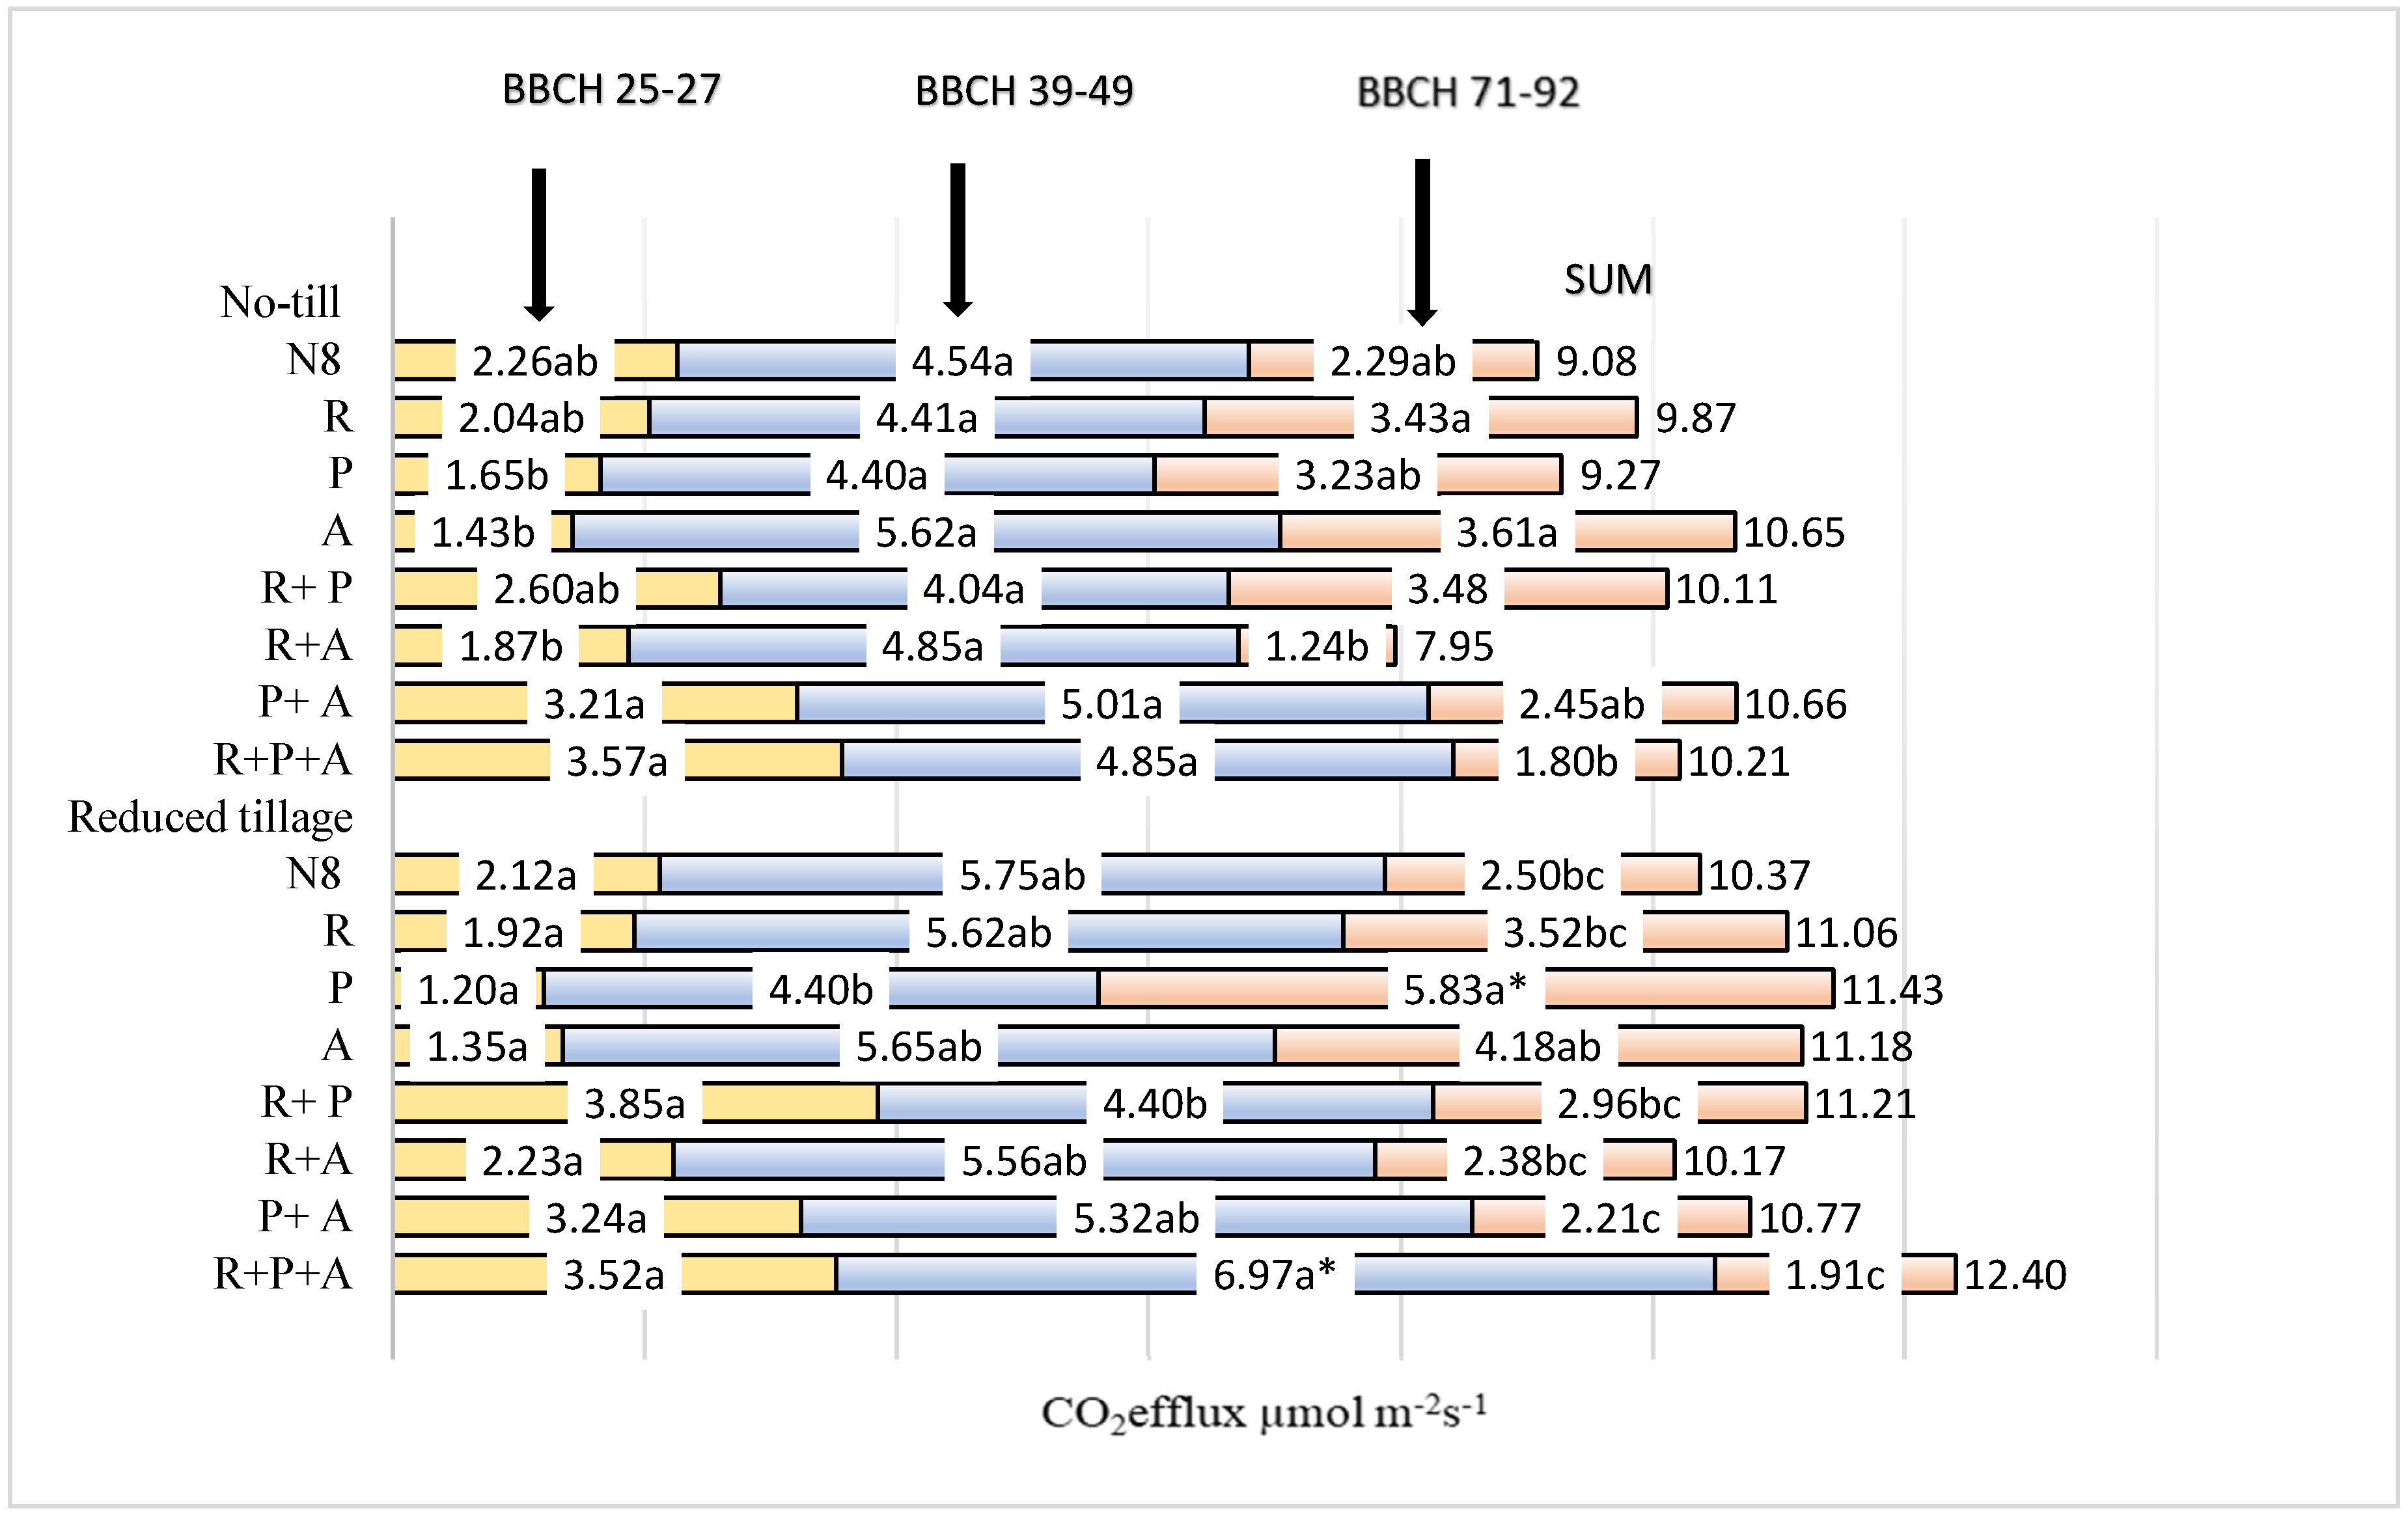
At the beginning of the vegetation period (BBCH 25–27) in 2018, the effect of tillage on soil CO
2 emissions was insignificant. However, the use of the biostimulant mixtures R + P, P + A, and R + P + A caused emissions to be more intensive under both tillage technologies (
Figure 2).
In the middle of the vegetation period (BBCH 39–49), soil respiration under reduced tillage was, on average, 15.9% more intensive compared to no-till technology. However, a more significant effect of tillage on soil respiration was found only with the use of a mixture of three biostimulants, R + P + A—emissions were 43.7% more intense in the crop under reduced-tillage technology. The impact of the use of biostimulants and nitrogen fertilizers to improve mineralization on soil CO2 emissions was not established in the crop under no-till technology. Reduced-tillage technology resulted in significantly lower soil CO2 emissions with preparation P and a mixture R + P, but only compared to the use of all three preparations in a mixture (R + P + A). The effects of other biostimulants, their mixtures, and nitrogen fertilizers on soil respiration were similar.
At the end of the vegetation period (BBCH 71–92), soil CO2 emissions were still more intense, averaging 20.4% under reduced tillage, but was significantly higher with the biostimulant P at 80.5% compared to the stubble under no-till technology. At the end of the vegetation period in the no-till crop, soil CO2 emissions were promoted more by the single-component biostimulants R and A and a mixture of R + P, but a significant difference was only found in comparison with the use of all three measures (R + P + A) in the mixture. In the crop under reduced tillage, soil CO2 emissions were particularly promoted by biostimulants P and A. In this crop, all three biostimulants (R + P + A) did not promote soil CO2 emissions at the end of the vegetation period, and lower emissions were also observed when using the two-component biostimulants, as well as nitrogen fertilizers.
Such results may have been influenced by the activity of microorganisms, which was more pronounced in cultivated soil (reduced-tillage treatment). At the end of the vegetation period, it was observed that soil CO2 emissions started to decrease with the use of mixtures of biostimulants, but became more active when using pure biostimulants.
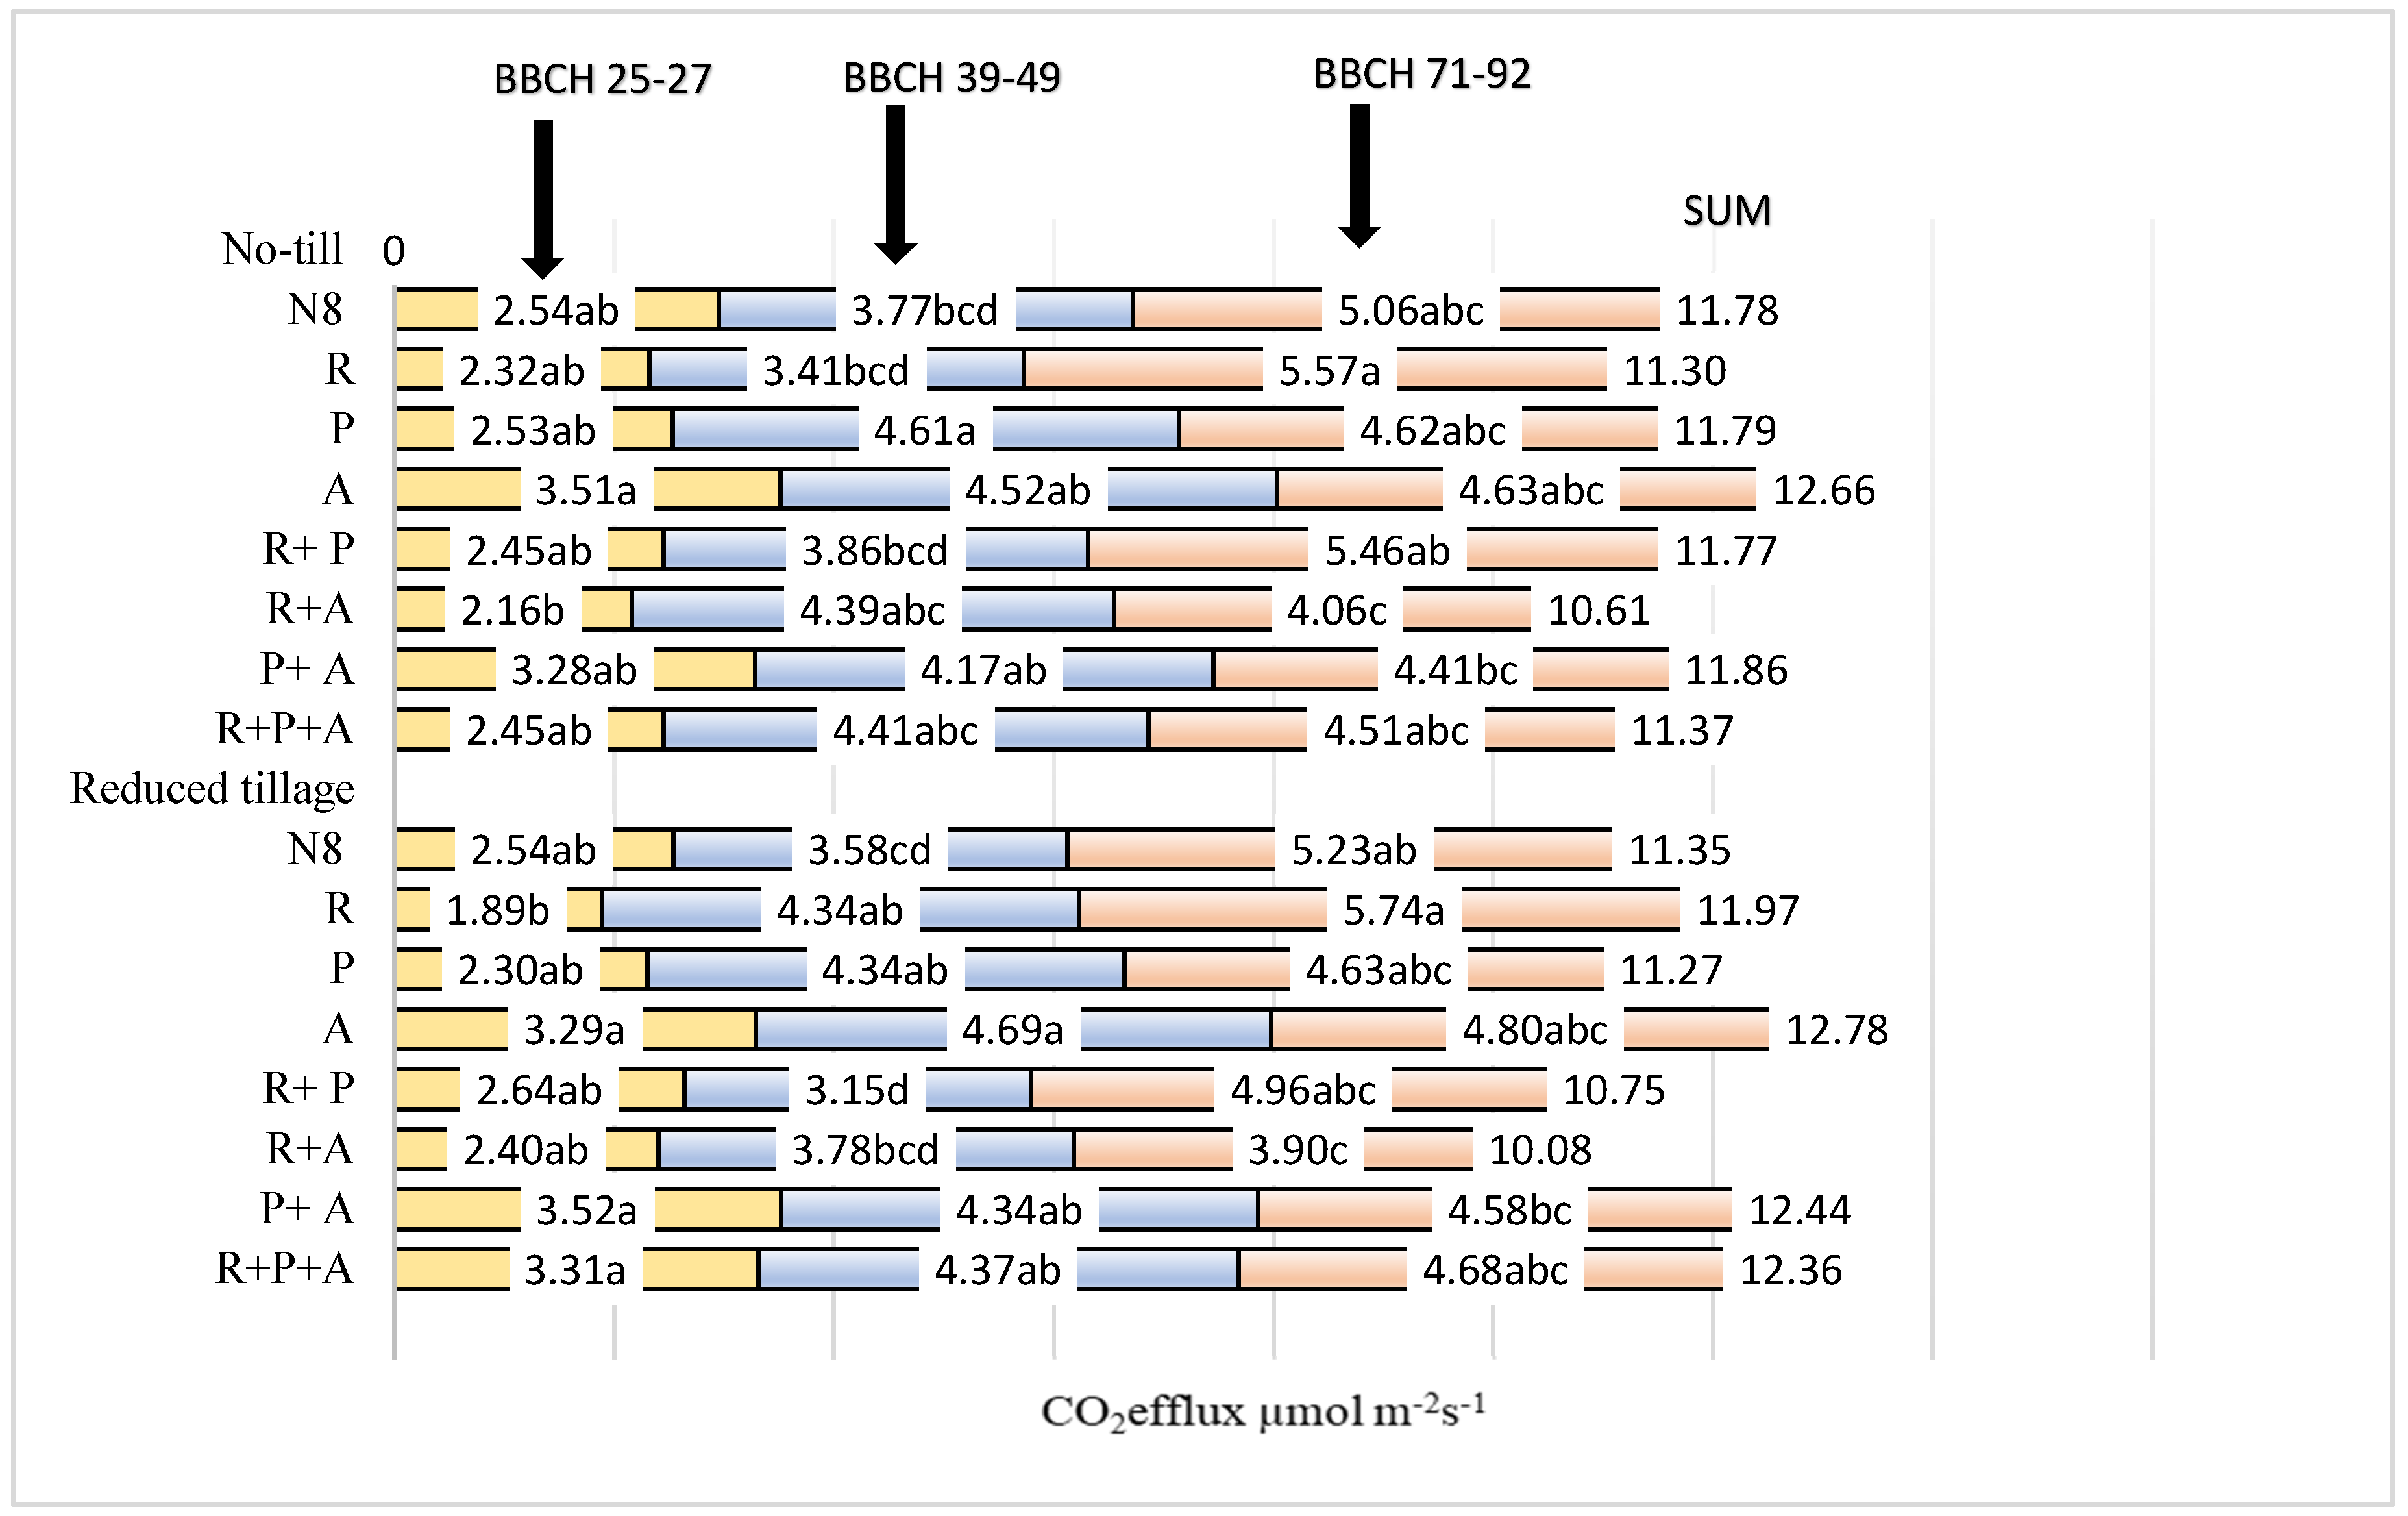
At the beginning of the vegetation period (BBCH 25–27) in 2020, the effect of tillage treatment on the intensity of soil CO
2 emissions was not determined. The beginning of the vegetation period was particularly arid—precipitation in April was only 4 mm, which is ten times less than this month’s long-term average. In March, precipitation was in line with the long-term average, but all precipitation fell by the middle of the month. In the middle of April, when the wheat started to germinate, during the first soil CO
2 measurement (
Figure 3), the soil moisture in all crops ranged from 5.0 to 6.5% and the temperature was 13–16 °C. Therefore, the intensity of soil CO
2 emissions in both tillage technologies was weak, averaging 2.7 efflux µmol m
−2s
−1. Environmental conditions inhibited soil CO
2 emissions, but the use of a single-component biostimulant A and a mixture of P + A resulted in more intensive soil respiration than with the other measures studied, and this was typical for both tillage technologies.
Even light precipitation greatly activates CO
2 emissions from the soil. These emissions decrease during drought with soil drying [
33]. In the middle of the vegetation period (BBCH 39–49), with an increase in precipitation, an increase in soil CO
2 emissions was observed (
Figure 3). Soil respiration that was 6.0% more intensive was observed in the no-till treatment, but the difference between the tillage treatments was insignificant. In both background crops, soil CO
2 emissions were promoted by the single-component biostimulants P and A and the mixtures P + A and R + P + A. In the no-till crop, soil CO
2 emissions were also stimulated by nitrogen fertilizers and a mixture of biostimulants R + A, and in the reduced-tillage treatment by the biostimulator R.
At the end of the vegetation period (BBCH 71–92), tillage technology also had no effect on soil respiration The biostimulant R and the mixture R + P had a significant effect on soil CO
2 emissions in both treatments, while the effects of other biological measures were similar (
Figure 3). At the end of the vegetation period, the use of nitrogen fertilizers for straw mineralization also contributed to soil CO
2 emissions.
4. Discussion
Only in the presence of organic matter, the most important component of the soil, is humus formed. In our experiment, the main organic matter was plant residues—straw after winter wheat, and in half of the experimental area, in the no-till tillage area, a catch crop of white mustard. It should also be mentioned that cultivated plants have different effects on the soil, especially the humus [
34]. Researchers studying the effect of maize residues on soil humus composition and changes found that the best results were obtained when plant residues were incorporated into the soil at a depth of up to 20 cm, compared to leaving them on the surface as mulch or inserting them into the soil at a depth of up to 10 cm [
35]. However, research has shown that in the case of wheat cultivation, three years of soil treatment with biological preparations with effective microorganisms causes changes in soil properties and a decrease in humus content [
36].
When we used the biostimulant Azofix, both alone and in mixtures with Ruinex and Penergetic, the humus content in the soil did not decline and remained sufficiently stable (
Figure 1). Ruinex and Penergetic slightly reduced the humus content when used alone and in a mixture. Azofix and Penergetic and a mixture of Ruinex + Penergetic improved the availability of nitrogen to plants, so that less of it remained in the soil sorption complex after harvest. Ruinex released nitrogen better when used in a mixture with Penergetic.
Soil fertility depends on the organic carbon content left in the soil and its rate of oxidation. These processes are caused by different biological properties of plants, their chemical composition, genetic soil type, and physical, chemical, biological, meteorological, and agrotechnical conditions. Long-term research on carbon conservation with natural perennial vegetation and agricultural crops has shown that growing wheat and straw in the 0–30 cm soil layer on average increased carbon stocks by 0.60 t ha
−1, while keeping soil fallow increased the stocks by only 0.23 t ha
−1. With the abandonment of plowing, the carbon content increased by 0.14 t ha
−1 under no-till technology [
37]. Three years after the beginning of the experiment, a decrease in organic carbon was observed. Organic carbon changed less when Azofix was used in mixtures with Ruinex and Penergetic, as well as in a mixture of these biological preparations (
Table 4). The ratio of carbon to nitrogen did not change greatly during the experiment, but a downward trend was observed. Researchers studying the effects of biological preparations also found that biological preparations containing several different components have synergistic effects. They argued that different groups of preparations, depending on their use (soil, leaves), the material from which they are made (plant, animal), or the process by which they are made (hydrolysis, fermentation, extraction) may lead to the development of useful soil organisms that degrade plant residues. The use of natural, environmentally friendly preparations is particularly important in view of the progressive processes of soil degradation and atmospheric pollution [
38,
39]. Crop residues are considered a vital resource to protect and maintain soil and crop productivity. The use of crop residues is beneficial for maintaining or improving soil organic matter [
4]. However, they are rapidly degraded and become a source of nutrients for plants, but do not increase the stocks of C
org. Organic carbon mineralization is a common function that is involved in the degradation of many microorganisms [
40]. The results obtained by other researchers using soil biostimulants to elucidate the changes in microorganisms and C
org in the soil have also confirmed that a seaweed- and amino-acid-based biostimulator used to accelerate the mineralization of plant residues and nutrient excretion increased the abundance of degraders of active microorganisms but was not related to higher rates of organic carbon mineralization from plant residues [
41]. In the dry year 2018, nitrogen stocks migrated less from the soil, and it is likely that they were available to the wheat. Researchers have tested strains of
Trichoderma harzianum and
Azotobacter chroococcum and found that their use could improve wheat productivity with reduced water and nitrogen levels, a critical scenario predicted by global warming and rising production costs [
42,
43]. The fungus
Trichoderma spp. in the biostimulant R may have various and often unknown interactions with the plant [
44]. However, research has shown a positive effect of
Trichoderma spp. in response to environmental stresses [
45].
Trichoderma spp. produces more than 250 metabolites, including peptides, secondary metabolites, and other proteins that can enhance plant growth and development during stress [
46,
47]. Other researchers argue similarly that the use of biostimulants has helped to overcome drought stress in wheat crops [
48]. Sustainable tillage systems cause significant losses of CO
2 and C
org in the soil after rain [
49]. Researchers studied the water-soluble soil carbon content and its change in the soil and found that the highest content in the soil was in the experimental fields fertilized with a by-product of biogas production. The lowest content occurredwhen fertilizing with mineral fertilizers. The most intensive processes of soil carbon transformation took place in the upper soil layer (0–10 cm), which led to the largest accumulation of C
org in individual years [
50]. Water-soluble (labile) soil carbon is particularly rapidly changing and is included in low-molecular-weight organic compounds that are easily and rapidly degraded by soil microorganisms. Some studies have shown a close relationship between soluble C and soil microbiological activity, as well as between water-soluble C and clay particles in the soil, with clay minerals actively sorbing dissolved organic compounds [
51]. Concentrations of water-soluble carbon depend on the genesis of the soil, its horizon (layer), the vegetation period, and fertilization [
52]. Tillage technologies had a significant impact on the content of water-soluble carbon. Under no-till technology, carbon content increased by an average of 9.0%, and under reduced tillage, carbon content only increased by 2.3%. It is likely that the combination of no-till with catch crops increased the stock of soluble C in the soil (
Table 5). Compared with the use of compensatory nitrogen, this indicator was improved with all biostimulants, especially when using all three preparations in a mixture (R + P + A).
It is likely that the plants did not consume all of the dissolved nutrients; some of them remained in the soil sorbed complex. The results show that the use of bio-activators promoted the degradation of mobile humic substances (MHSs) and mobile humic acids (MHAs) compared to the use of compensatory nitrogen, thus providing the plants with better available nutrients, and not depleting them in the soil. Soil biostimulants increased the humus content more than the addition of straw with compensatory nitrogen. Relaxed compounds of MHS and MHA, if not absorbed by plants, tended to leach at high humidity. Researchers studying the persistence of mobile leachable humic substances stated that the amount of organic matter and the rate of decomposition determine the formation of a stable structure and leaching of nutrients. They claim that tillage and leaching of mobile humic substances reduce the levels of stable soil aggregates and C in the soil [
53]. Correlation regression analysis of our results showed a strong relationship between the variables investigated with the application of non-arable tillage technology: N content and C
org content (y = 0.339 + 8.51x; r = 0.87;
p ˂ 0.01), and mobile humic acid (MHA) and mobile humic substance (MHS) content in the soil (y = 0.126 + 1.142x; r = 0.87;
p ˂ 0.01). Using reduced soil tillage, significant linear regressions between the examined indexes were found: soluble organic carbon and mobile humic acid (MHA) content (y = −0.099 + 1.222x; r = 0.75;
p ˂ 0.05), mobile humic acid (MHA) and mobile humic substance (MHS) content in the soil (y = 0.109 + 1.329x; r = 0.84;
p ˂0.01), and N content and C
org content in the soil (y = 0.106 + 10.750x; r = 0.77;
p ˂ 0.05). The effect of the two-preparation mixtures was also better than that of a single component (
Table 4). The results after three years revealed that biostimulants promote the release of mobile humic substances and mobile humic acids better than compensatory nitrogen for straw decomposition. The effect was the same for the humus content.
Researchers studying microbiological activity in the soil and soil CO
2 emissions from the soil point to meteorological conditions as a key factor in the activity of these processes [
54]. Researchers have argued that proper application of tillage technology can help to compensate for increased atmospheric soil CO
2 concentrations and improve soil quality and productivity [
55,
56]. Summarizing the results, it can be stated that soil CO
2 emissions are significantly influenced by meteorological conditions, on which the microbiological activity of the soil depends. However, by using soil biostimulants of natural origin, we hope that they will help to regenerate soil microbiocenosis. Most research on soil improvers of biological origin confirms our results: these products increase the microbiological activity of the soil, as evidenced by the intensity of soil CO
2 emissions, and do not reduce the humus and mobile humic substance content [
57,
58]. Correlation and regression analysis of the data confirms the conclusions of these researchers. Significant relationships were found between the variables investigated under no-till technology: between soil CO
2 emission in spring and humus content in the soil (y = 0.234 + 0.03x; r = 0.73;
p < 0.05) and between N content and humus content (y = 0.676 + 13.75x; r = 0.85;
p < 0.01).
Throughout the experiment, soil CO2 emissions were stimulated by a single-component biostimulant Azofix. Its influence was particularly pronounced in the middle of the vegetation period. The influence of Ruinex and Penergetic preparations often occurred in the later stages, in the middle or at the end of the vegetation period, but not every year. Using mixtures of the studied biostimulants, the intensity of soil CO2 emissions was higher at the beginning and in the middle of the vegetation period, and it leveled off at the end.
In the first year of the experiment (2018), the effect of mixtures of biostimulants on soil CO
2 emissions at the beginning of the vegetation period was particularly pronounced due to the repeated spraying of crops with biological agents, even in the spring (
Figure 2). At the time of measuring soil CO
2 emissions, the conditions for microorganisms were favorable: soil moisture content was 10% and the temperature was 16.7 °C. Researchers have long observed that favorable meteorological conditions stimulate microbiological activity and activate soil CO
2 emissions from the soil [
59,
60]. In respect of other measurements, it was observed that the intensity of soil CO
2 emissions was higher when using single-component biostimulants A and R, as well as mixtures containing them. The influence of P became apparent only during the last measurement. Nitrogen fertilizers were activated to stimulate soil CO
2 emissions in the middle of the vegetation period, the next year, and at the end of the vegetation period. While observing soil CO
2 emissions in arid conditions, a team of researchers found that N fertilization for 5 of the 35 observation days increased soil CO
2 fluxes when using sustainable tillage systems. In addition, it caused significant losses of soil CO
2 and C in the soil after rain [
61].
The significant effects of soil biostimulants or plant biostimulants on both plant development and soil quality have been reported in the literature [
33,
62]. However, the modes of action of biostimulants are largely unknown, in part due to the wide variety of raw materials used in the manufacture of each product [
63]. Depending on the raw materials involved, several categories of biostimulants have been described: humic and fulvic acids, hydrolysates of animal or vegetable proteins, N-containing compounds or amino acids, seaweed extracts, plants (seeds, leaves, roots, root exudates) or fruits, chitin and chitosan, and microbial inoculants. All these categories differ in their effects and, when used together, complement each other and have a synergistic effect [
64]. In our experiment, we also observed that the use of biostimulants in mixtures had a greater impact on the study results compared to their separate use. Carbon sequestration is a process that involves long-term capturing and binding of atmospheric soil CO
2 into the soil through crop debris and other organic solids to enhance the concentration of C in soil. Therefore, awareness should be created regarding the role of soil as a storehouse of C and other nutrients and its effects on climate change [
65,
66].


 ,
, 


