Article

Zeolite as a Tool to Recycle Nitrogen and Phosphorus in Paddy Fields under Straw Returning Conditions

1
College of Agricultural Science and Engineering, Hohai University, Nanjing 211100, China
2
State Key Laboratory of Hydrology-Water Resources and Hydraulic Engineering, Hohai University, Nanjing 210098, China
3
Cooperative Innovation Center for Water Safety& Hydro Science, Hohai University, Nanjing 210098, China
4
College of Mechanical and Electronic Engineering, Nanjing Forestry University, Nanjing 210037, China
*
Author to whom correspondence should be addressed.
Agronomy 2023, 13(2), 327; https://doi.org/10.3390/agronomy13020327
Submission received: 17 December 2022 / Revised: 18 January 2023 / Accepted: 18 January 2023 / Published: 21 January 2023
(This article belongs to the Special Issue Land and Water Resources for Food and Agriculture)

Abstract

:
Excess nitrogen (N) caused by straw returning to paddy fields undergoing flooding irrigation deteriorates the water quality. The purpose of this research was to use both simulated field and pot experiments to explore a new approach using zeolite to recycle this excess N. The results from simulated field experiments in stagnant water showed N adsorption with different zeolite applications (25, 50, 75, 100, 125, and 150 g L−1). Pot experiments revealed how straw and reused zeolite applications affected the concentrations of ammonia N (NH4+-N), nitrate N (NO3-N), total N (TN), and total phosphorus (TP) in the surface water and soil layers of the paddy field. Zeolite showed a strong ability to adsorb NH4+-N in wastewater, even in a simulated drainage ditch (100 g L−1 zeolite adsorbed 74% NH4+-N). The zeolite recycled from the drainage ditch was still able to reduce N concentration caused by straw decomposition in the surface water. Zeolite adsorption reduced the peak values of NH4+-N, TN, and TP by 30%, 19%, and 5%, respectively. Based on these findings and conventional field designs, the use of 20 t ha−1 zeolite in the field is effective for recycling N and P. This research provides a sustainable development method to mitigate the water quality deterioration caused by straw returning to the field.

1. Introduction

As an agricultural country, China is extremely rich in straw resources, with an annual yield of 800 million t and an average annual growth rate of 1.3% [1]. More than half of the products produced by photosynthesis are stored as straw, which is indispensable in the global energy structure. Therefore, straw is recognized as one of the most important biomass resources worldwide [2,3]. Straw recycling not only provides an effective use for straw, but also reduces air pollution caused by traditional straw burning [4].
There are many forms of straw utilization, such as fuel, fertilizer, and fodder, but straw incorporation is the main form in China [5]. In some farmlands, soil carbon (C), phosphorus (P), and nitrogen (N) of straw returning soil may be 47%, 14%, and 37% higher, respectively, than those of soil without straw [6]. When the straw was buried in the soil for more than 40 days, 70–90% of the added C from the straw was released through microbial respiration as CO2 [7]. Under straw incorporation, soil nutrients such as organic matter, N, P, potassium (K), and trace elements would be increased when the straw degraded [8], which could not only promote the soil material circulation, but also effectively improve the physical [3] and chemical properties of the soil [9]. Moreover, straw combined with chemical fertilizer can also increase the accumulation of soil organic matter and soil fertility [10]. Furthermore, the diversity of soil fungi would be increased, and the degradation of refractory organic carbon could be promoted after long-term straw returning [11,12].
However, there are some negative effects of straw returning. It could increase the emission of greenhouse gases such as methane (CH4), carbon dioxide (CO2), and nitrous oxide (N2O) [13]. Additionally, excess straw in the soil could result in poor root–soil contact and ultimately affect roots’ taking ability and crop survival [14,15]. Moreover, N, P, K, and organic matter produced by straw decomposition will diffuse with water flow, resulting in non-point source pollution [16]. For example, the decomposition of wheat straw under flooded conditions will aggravate the agricultural non-point source pollution in the Yangtze River agricultural regions, where rice–wheat rotation is the dominant farming system [17,18].
Meanwhile, elements such as N and P, which cause non-point source pollution, are also required nutrients for rice growth. Therefore, determining the optimal balance to recycle the nutrients produced by straw decomposition and the pollutants diffused in the water is also a challenge. The existing chemical recovery methods are cumbersome, costly, and unsuitable for agriculture [19,20,21].
Zeolite is a kind of natural molecular sieve, and is recommended for wastewater treatment because of its good internal pore structure [22] and excellent screening and adsorption properties [23]. These properties give zeolite a larger cation exchange capacity (CEC) than most clay minerals [24]. Because of the high CEC, zeolite can retain ammonium (NH4+), potassium (K+), and other cations selectively, and can even reduce chemical oxygen demand (COD) [25,26,27,28]. These cations can be stored and released depending on crop demand [29,30], and can even decrease seasonal cumulative CH4 emissions. [31] In addition, zeolite can also increase the drought resistance of rice [11], promote corn growth, and improve crop yield [32]. Based on these characteristics, zeolite is not only regarded as a soil amendment for farmlands [33,34,35], but is also used in wastewater purification in drainage ditches [36,37,38].
Previous studies on the effect of zeolite in the field have primarily been separately focused on either wastewater purification or soil amendment [39,40]. There is a scarcity of research studying the use of zeolite to recycle the excess N and P from wastewater discharged from farmland under straw incorporation conditions; moreover, the adsorption of N in the drainage ditch with stagnant water is especially unclear. The purpose of this study is to determine whether zeolite can be used as a tool, first for the sorption of N and P from wastewater, and subsequently as a fertilizer releaser in the paddy field. This study will provide a new method to effectively reduce excess N and P, achieve cleaner production, and allow for sustainable agricultural development.

2. Materials and Methods

2.1. Site Description

The experiments were conducted from July to November 2020, in the Water-Saving Park Facility Agriculture and Environment Test Field of Hohai University (31°54′ N and 118°46′ E), Nanjing, Jiangsu Province, in China. The region is characterized by a subtropical monsoon climate with mean annual temperature, evaporation, and precipitation of 15.4 °C, 900 mm, and 1106.5 mm, respectively, and 237 frost-free days annually. The temperature and precipitation during the growing season are shown in Figure 1. The experimental field soil type is silty, sandy loam. The main soil properties were as follows: total N (TN), 0.83 g kg−1; total P (TP), 0.35 g kg−1; available N, 47.40 mg kg−1; available P, 10.37 mg kg−1; and available K, 90.00 mg kg−1. The natural zeolite used in this experiment was clinoptilolite zeolite produced in Chengde (40°12′ N and 115°54′ E), Hebei Province, China. The physicochemical properties and chemical composition of the zeolite are shown in Table 1.

2.2. Experimental Design and Sampling

This study comprised three experiments (Figure 2). The aim of Experiment 1 was to determine the profitable particle size and application for Experiment 2 by verifying the N adsorption kinetics of zeolite with different particle sizes and applications. The focus of Experiment 2 was primarily to assess the ammonia N (NH4+-N) adsorption effect of zeolite in the drainage ditch as well as the optimum method to modify the zeolite. Finally, based on the results from Experiment 2 and the conventional design standards for drainage engineering of farmland in China, the aim of Experiment 3 was to use pot experiments to verify the ideal scheme for recycling the excess N and P caused by straw incorporation in the paddy field by evaluating the changes in NH4+-N, nitrate N (NO3-N), TN, and TP in the surface water and various soil solutions.

2.2.1. Experimental Design of N Adsorption Kinetics

Experiment 1 (Figure 2) was divided into two parts: The aim of Part 1 was to determine the profitable particle size to be applied, and the aim of Part 2 was to confirm the profitable application of zeolite for adsorption. The adsorption rate is inversely related to the zeolite size, such that the N adsorption increases as the zeolite particle size decreases [11]. A zeolite powder with particle size <0.5 mm was widely used in the previous wastewater treatment experiment [41]. However, in farmlands, zeolite powder with small particle sizes would be washed away, and, therefore, would be unable to achieve long-term utilization. For these reasons, zeolite with 0.5–5.0 mm particle sizes was selected for testing.
Part 1 was designed with three treatments using different zeolite particle sizes: (i) blank control with no zeolite (CK1), (ii) 0.5–3 mm zeolite (Z3mm), and (iii) 3–5 mm zeolite (Z5mm). Part 2 was subsequently designed with seven treatments using different applications: (i) blank control with no zeolite (CK2), (ii) 25 g L−1 zeolite (Z25), (iii) 50 g L−1 zeolite (Z50), (iv) 75 g L−1 zeolite (Z75), (v) 100 g L−1 zeolite (Z100), (vi) 125 g L−1 zeolite (Z125), and (vii) 150 g L−1 zeolite (Z150). All treatments in both parts were arranged in a completely randomized design with three replicates and placed into 250 mL conical flasks containing 100 mL ammonium chloride (NH4Cl) solution (100 mg L−1) at 25 °C. The pH of the solution was adjusted to 7.0 ± 0.1, and the target pH value of the working solutions were set using a 0.1 M HCl/NaOH solution, which was then agitated at 200 rpm in a shaker at constant temperature. The above suspensions were withdrawn by pipette at 0, 10, 30, 60, 120, 180, 240, and 300 min for determination of the residual NH4+-N concentrations.

2.2.2. Experimental Design of NH4+-N Adsorption in Drainage Ditch Simulations

The experiments (Experiment 2, Figure 2) for simulating the NH4+-N adsorption of different adsorbents in a drainage ditch were conducted in 500 mL beakers containing 400 mL NH4Cl solution (100 mg L−1). Experiment 2 was designed with four groups using different zeolite drying treatments: (i) blank control with no zeolite (CK3), (ii) 40 g heat-dried zeolite (Zd), (iii) 40 g air-dried zeolite (Zad), and (iv) 100 g heat-dried soil with no zeolite (Sd). For the Zd treatment, the zeolite was rinsed with distilled water and dried in the oven at 105 °C. For the Zad treatment, the zeolite was rinsed with distilled water and air-dried. For the Sd treatment, the soil was dried in the oven at 105 °C, crushed, and sieved. There were three replicates for each treatment. The above suspensions were withdrawn by pipette at 0, 1, 8, 21, 60, 108, and 132 h to determine the remaining NH4+-N concentrations.

2.2.3. Pot Experimental Design of Excess N Recycling Using Zeolite

According to Smith [42], zeolite can adsorb or resolve pollutants according to the concentration of solute in the solution. To study the effect of zeolite on paddy field water quality under straw incorporation conditions, Experiment 3 (Figure 2) was designed as a pot experiment with three treatments: (i) no straw returning (CK4), (ii) 7 t ha−1 straw returning (ST), and (iii) 7 t ha−1 straw returning combined with zeolite (SZ). The particle size, application, and treatment of the zeolite were determined by Experiments 1 and 2.
All treatments were arranged in a completely randomized design with three replicates, resulting in a total of nine pots (0.52 m diameter, 0.70 m height). The pots were filled with air-dried soil obtained from the experimental field at 0–20 cm soil depth and divided into five layers. The surface water, soil, and inverted layers were utilized in all treatments. However, the ST treatment included an additional layer—called the “straw incorporation layer”—in which the wheat straw (air-dried and chopped to 4–6 cm length, with TN, TP, and total K of 3.80 g kg−1, 0.66 g kg−1, and 2.07 g kg−1, respectively) was evenly mixed with the surface soil layer (0–20 cm) before the flood period. Furthermore, the SZ treatment also included an additional layer—called the “zeolite layer”—in which the zeolite from Experiment 2 was evenly applied in the water layer before the flood period. Each pot had five hills with three rice seedings per hill. The japonica rice cultivar Nanjing 9108 was sown beginning on 30th May and transplanted on 7th July. The pots were regularly hand-weeded, and pesticides were applied to prevent insect and pest damage. No noticeable crop damage was observed during the experimental period. The management practices for the stages of rice growth were performed according to the local conventional production practices, and traditional flooded irrigation was adopted during the rice growth period. The specific fertilization scheme is shown in Table 2.
For water sample collection, soil solution samplers were embedded in each pot at the 0–10 cm, 10–20 cm, 20–40 cm, and 40–50 cm layers before rice transplanting. Additionally, an inverted layer and a drainpipe were placed at the bottom to simulate leakage (3 mm d−1). Before obtaining soil solution samples, the residual water in the soil solution samplers was drained, and the samplers were evacuated with a vacuum pump. The solution bottle on the vacuum pump was rinsed with distilled water before sampling the next block. Samples were taken every 2 d from the first day after each fertilization, then every 5 or 7 d until the next fertilization. The sampling time was maintained at approximately 8:00 a.m., and each plot contained approximately 50 mL of the soil solution. The collected samples were stored in an ice box and immediately taken back to the laboratory for analysis of NH4+-N, NO3-N, TN, and TP.

2.3. Analytical Methods

2.3.1. Parameter Analysis

The collected samples were filtered through filter paper for chemical analysis. The NH4+-N content was measured using the Nessler’s reagent colorimetric method, the NO3-N content was determined by ultraviolet spectrophotometry, and the TN and TP contents were determined by alkaline potassium persulfate digestion ultraviolet spectrophotometry and calorimetry spectrometry [16].

2.3.2. Application Analysis

The application of zeolite was divided into two phases. The first phase took place in the drainage ditch simulation, in which the zeolite was used to adsorb the N, and then the appropriate application of zeolite (mditch) was determined by Experiment 2. The second phase took place in the paddy field. At this stage, the zeolite was recovered from the ditch by crowder, rinsed and dried, and then applied to the fields with basic fertilizer by a fertilizer applicator. Therefore, the application of zeolite (mfield) in the paddy field was determined by the first phase and the drainage engineering layout (Figure 3).
According to the traditional drainage engineering pattern of the Middle-Lower Yangtze Plain in China, an irrigation and drainage pattern with alternating channels was adopted. A drainage ditch and its confluence of fields are regarded as a unit, and the application of zeolite could be calculated as followed:
m f i e l d = m d i t c h × V A ,
V = ( a + h × n ) × 2 × h × l ,
A = b × l ,
where mfield is the application of zeolite in the paddy field (t ha−1), mditch is the application of zeolite in the drainage ditch (kg L−1), V is the volume of the drainage ditch (m3), A is the cross-sectional area of the drain (m2), a is the bottom width of the ditch (m), h is the depth of the drainage ditch (m), n is the slope of the ditch, and l is the length of each drainage ditch (m).

2.3.3. Statistical Analysis and Calculation

Excel 2021 was used to calculate and analyze the data. The measurement data were expressed as the mean ± standard deviation of three sample replicates. The fitting of the pseudo-first-order kinetic model and the pseudo-second-order model was accomplished using the linear fitting function of OriginPro 2022b.

3. Results

3.1. N Adsorption Kinetics

In Experiment 1, Part 1 (Figure 2), the adsorption kinetic processes of the two zeolite particle sizes revealed that the unit adsorption of various particle sizes steadily increased with reaction time until an adsorption equilibrium was attained (Figure 4A). Furthermore, the adsorption capacity of the 3 mm zeolite was larger than that of the 5 mm zeolite. The adsorption rates of the two zeolites were steadily reduced during the NH4+-N adsorption process. During the initial 200 min, both sizes of zeolites demonstrated rapid adsorption, since many adsorbates were available for adsorption and the initial adsorbate concentration in solution was high. The adsorbate concentration in the liquid membranes on the adsorbent’s outer surface was lower than in the solution. Therefore, the ions were only able to continue moving through the adsorbent and not from the solution to the liquid membrane on the surface of the zeolite. Over time, the adsorption rate decreased as the zeolite gradually became saturated. Therefore, the migration of NH4+ in the solution was promoted to the liquid membrane on the zeolite surface, and further migration only occurred within the adsorbent. In the later stages, the zeolite gradually reached saturation and the adsorption rate was low.
To further explain the adsorption kinetics, two other kinetic models, pseudo-first-order and pseudo-second-order, were employed. The linear forms of these models, with boundary conditions of q = 0 at t = 0 and qe = qt at t = te, are as follows:
The pseudo-first-order kinetic model is expressed in Equation (4):
ln ( q e q t ) = ln q e k 1 t ,
where qe and qt (mg g−1) are the quantities of N adsorbed on adsorbents at equilibrium and contact time t (min), respectively, and k1 is the rate constant of the model (min−1). The values of qe and k1 can be obtained from the slope and intercept of the linear plots of ln ( q e q t ) versus t, as shown in Figure 4B.
The pseudo-second-order model is represented as Equation (5):
t q t = 1 k 2 q e 2 + t q e ,   h = k 2 q e 2 ,
where k 2 (g mg−1·min) is the rate constant for adsorption, and h gives the rate of adsorption (mg g−1 min). Therefore, the values of k 2 and qe can be obtained from the slope and intercept of the plot t/qt versus t (Figure 4C).
Notably, the determination coefficient R2 values (0.9899, 0.9677) of the pseudo-second-order model are higher than those of the pseudo-first-order model (0.8216, 0.8549), which indicates that the pseudo-second-order kinetic model is more suitable for determining the adsorption of N (Table 3).
The fitness of the intraparticle diffusion model was also assessed using the following Morris–Weber equation with the experimental adsorption kinetic data:
q t = k d i f t 0.5 + C ,
where k dif is the coefficient of intraparticle diffusion (mg g−1 min0.5).
Adsorption is divided into two processes: surface adsorption of zeolite and slow diffusion of pores. As the fit curve clearly does not pass through the origin (Figure 4D), the intraparticle diffusion is not the only rate-limiting step in the adsorption stage; rather, it includes both the liquid film and the intraparticle diffusion.
The impact of varying applications of zeolite on NH4+-N adsorption at 20 °C was investigated in Experiment 1, Part 2 (Figure 2), using the 3 mm zeolite from the results of Experiment 1, Part 1. Initially, the NH4+-N adsorption rate was shown to be high, followed by a steady decrease (Figure 5). The adsorption of NH4+-N achieved equilibrium at various zeolite concentrations, ranging from 44.29 mg L−1 (25 g L−1 zeolite) to 83.5 mg L−1 (150 g L−1 zeolite), as well as 55.00 mg L−1 (50 g L−1 zeolite), 64.48 mg L−1 (75 g L−1 zeolite), 74.23 mg L−1 (100 g L−1 zeolite), and 80.68 mg L−1 (125 g L−1 zeolite). Generally, the amount of adsorbed NH4+-N increased as the applied zeolite concentration increased. The initial rapid rise in adsorption capacity may have been due to the steep gradient of solute concentration and the fact that the adsorbent surface was fully vacant. However, the adsorption of NH4+-N clearly diminished as the contact duration increased, and this was associated with a reduction in the amount of vacancies on the zeolite surface. Additionally, the repulsive contact between solute molecules in the bulk phase and those on the solid surface make it increasingly challenging to fill the remaining unoccupied surface sites over time.

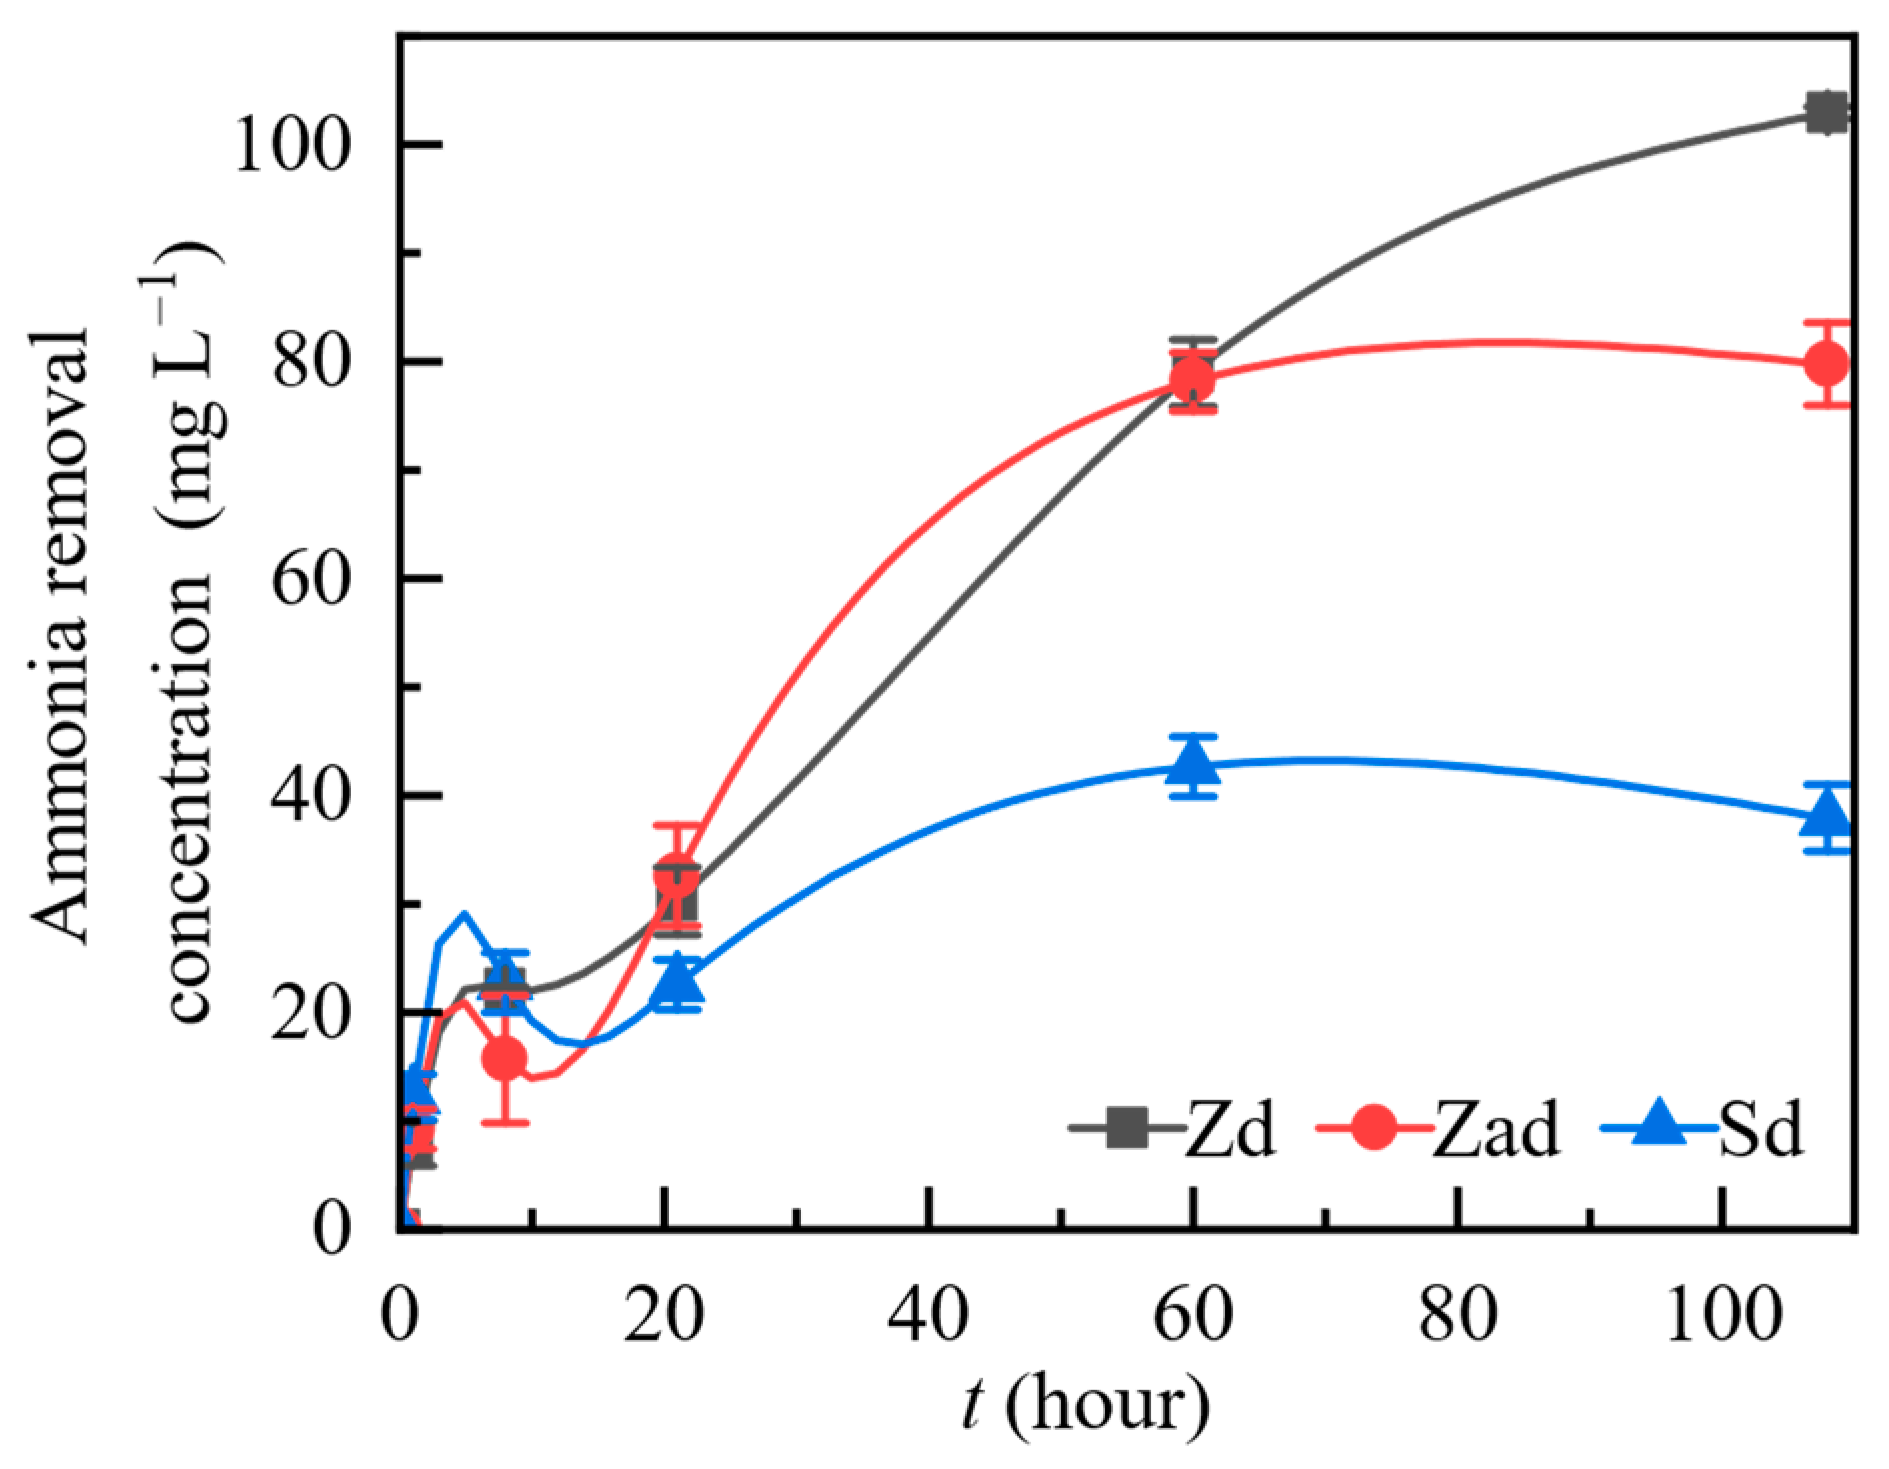
3.2. NH4+-N Adsorption in Drainage Ditch Simulations Using Zeolite

Based on the results from Experiment 1, 100 g L−1 of 3 mm zeolite was used for subsequent experiments. In Experiment 2 (Figure 2), the changes in NH4+-N adsorption under different zeolite treatments—Zd, Zad, and Sd—are shown in Figure 6. In all three groups, the overall trend of NH4+-N removal was essentially the same over time. The rate of NH4+-N removal initially increased rapidly, subsequently decreased, and ultimately stabilized. The rapid decrease in NH4+-N concentration in the solution in the early stages of the experiment was a result of adsorption and ion exchange. However, the stabilized NH4+-N concentration in later stages was due to the progressive saturation of zeolite and low solution concentration.
In the early stages of the experiment, the NH4+-N removal efficiency for the different treatment groups showed Sd > Zad > Zd, which was due to the dominant role of adsorption at this stage. Because the soil particles were much smaller than the zeolite particles, the NH4+-N removal effect of soil in the early stages was better than that of zeolite. Subsequently, the NH4+-N removal capacity of Sd flattened, while the removal capacity for the Zad and Zd groups remained higher. Once the concentration of NH4+-N around the particles and the concentration of NH4+-N in the solution equalized, the adsorption effect of the soil tended to be balanced until the surface charge of the zeolite flattened. The NH4+-N removal capacity of the Zad group peaked at 79.76 mg L−1 at 60 h and then flattened. Similarly, the Sd group peaked at 60 h at 42.64 mg L−1, but then decreased, because the diffusion rate of solute from the surface of adsorbent was greater than the adsorption rate.
However, the NH4+-N removal capacity of the Zd group continued to increase until 108 h, with a peak of 102.94 mg L−1 and almost complete adsorption. Zd, Zad, and Sd had final removal rates of 96.98%, 74.32%, and 34.78%, respectively. The comparison between Zd and Zad demonstrates that, while the structure and adsorption of zeolite was not greatly changed by calcination during the drying process, the final NH4+-N removal effect of zeolite was improved due to the removal of pore impurities. Therefore, subsequent experiments solely utilized the heat-dried zeolite.

3.3. Paddy Field Water Quality Changes

3.3.1. NH4+-N

Based on the results from Experiment 3 (Figure 2), the changes in surface water and soil NH4+-N concentration were greatly affected by fertilization (Figure 7). On the first day following each fertilization, the NH4+-N levels in the paddy soil reached their peak values at the surface water, 0–10 cm layer, and 10–20 cm layer solutions, followed by a rapid decline. Furthermore, the peak at each fertilization step was higher than the peak from the previous fertilization step. The NH4+-N content tended to flatten from Day 34 to the time of panicle fertilizer application, and then it increased after 29th August.
At each post-fertilization peak in the surface water, 0–10 cm layer, and 10–20 cm layer of the paddy soil solutions, the ST group’s NH4+-N content was greater than that of the CK4 group, indicating that the concentration of NH4+-N in these layers increased after straw returned to the field due to the continued decomposition of straw and the occurrence of nitrification. However, the addition of zeolite improved this result. Although the second fertilization used the most N, the peak value of the third application was twice as high as that of second application. This phenomenon indicated that N was released into the water layer because of the continuous straw decomposition. Additionally, the increased nitrification intensity relative to denitrification intensity was also due to the straw decomposition, which increased oxygen consumption and gradually lowered the amount of dissolved oxygen in the water. Although no additional N was applied, following the third fertilization, the N content of water increased and the NH4+-N content was higher than in the previous treatments.
The NH4+-N contents of the surface water, 0–10 cm layer, and 10–20 cm layer solutions of the SZ group were lower than those of the CK4 and ST groups on the second day following the third fertilization, indicating that the NH4+-N content of the water had been effectively reduced as a result of the zeolite adsorption and ion exchange, which helped to withdraw the excess N from the farmland. Additionally, the NH4+-N contents in the 20–40 cm layer and 40–50 cm layer solutions of the SZ groups were lower than that of the ST group, which indicated that the zeolite could effectively fix the N in the 0–10 cm and 10–20 cm soil layers and reduce N leaching.
After field drying, the NH4+-N concentration marginally increased for all three groups, with the NH4+-N concentration of the SZ group being higher than that of the other two groups. This result illustrated that the NH4+-N in the zeolite began to diffuse outward since the NH4+-N concentration in the field water was lower than that around the zeolite, which is consistent with the findings of the laboratory tests. However, the difference was not immediately apparent, indicating that it would not cause excess N in farmland.

3.3.2. NO3-N

The changes in NO3-N concentration in the surface water and paddy soil solutions of each treatment were slightly different than those of NH4+-N (Figure 8). The NO3-N concentration of each treatment reached its peak in the early stages of re-greening. Since the paddy field had been under flooding conditions for an extended period of time, the dissolved oxygen content was low. Therefore, except for the short period after fertilization, the NO3-N concentration in the surface water and soil solutions was generally low, far lower than China’s first-level surface water environmental limit of 10 mg L−1. As a result, the NO3-N concentration in the field water did not exceed the acceptable limit within the appropriate fertilization range.
The peak value of NH4+-N appeared on the first day after fertilization—Days 6, 19, and 30 after the beginning of the experiment—whereas the peak value of NO3-N appeared on Days 6 and 23, with only a small upward fluctuation on Day 30. The discrepancy in these results is due to the formation of NH4+-N from organic N under the ammonification of ammoniating bacteria. During nitrification, NH4+-N is further converted into NO3-N and NO2-N under aerobic conditions. However, NO2-N cannot be retained as an intermediate product before being converted into NO3-N. Therefore, this process caused the peak value of NO3-N to be delayed relative to NH4+-N. On Day 30, the NH4+-N content showed a large peak, whereas the NO3-N content showed only a minor variation. This finding is due to the continued straw decomposition, which caused the amount of oxygen in the field water and soil solution to gradually decrease. Low oxygen content in the water stimulates denitrification, thereby converting NO3-N and NO2-N in the water into NH4+-N. Since the oxygen content in the solution was low on Day 30, at the late stage of decomposition, not only was nitrification prevented from taking place as it should, but denitrification was also caused, thereby converting NO3-N into NH4+-N.

3.3.3. TN

The trend for TN content was similar to the other indicators; however, its peak appeared on the first day after fertilization (Figure 9), which indicates that the amount of fertilizer applied was the main factor influencing the change in TN in water quality.
Notably, the amount of N applied in the second fertilizer application was almost twice as much as that in the third application; however, the TN in the water did not double, indicating that the straw decomposition added N into the water. As shown by the peak values of the three groups (ST (233.47 mg L−1) > CK4 (206.96 mg L−1) > SZ (158.63 mg L−1)), the addition of zeolite had an effect on the peak value of TN, and its adsorption effect on N caused an even lower peak value than that of the blank control. Meanwhile, the decline rate of TN in the SZ group was much slower after each peak than it was in the other groups, indicating that the zeolite had a strong impact on the balancing and sustained release of N, which are related to the functionality of zeolite itself.
During the later period, the TN of the SZ group showed an obvious upward trend compared with the other groups. This may be due to the lower TN content in water relative to the surface of the zeolite particles causing the N adsorbed by the zeolites to migrate to the water. This finding may also be related to the low concentration of dissolved oxygen in the water, which could lead to anoxic conditions and promote the release of N from the zeolites over time.

3.3.4. TP

The TP was mainly concentrated in the surface water and the 0–10 cm soil solution layer in contact with the straw (Figure 10). The TP concentration reached its maximum after the basic fertilizer application, followed by the reviving fertilizer and the tillering fertilizer applications. This pattern is because soluble P is generated in response to adsorbed P during the transformation of P fertilizer in the soil, which mainly includes the adsorption and precipitation processes. Both processes can rapidly combine P with Fe, Al, and Ca in the soil to form insoluble Fe-P, Al-P, and Ca-P; since the content of organic–inorganic colloidal particles in the surface soil is high, this process has a significant adsorption and fixing impact on P fertilizer. Therefore, it is difficult for TP to transport in the soil solutions. As the P fertilizer was only applied once, the TP content exhibited a sudden increase only after the basic fertilizer application, followed by a decrease and decline in volatility. Therefore, the highest TP value abruptly rose on Day 6, with ST (14.26 mg L−1) > SZ (11.70 mg L−1) > CK4 (9.48 mg L−1) as the combined value for all layers. However, since the zeolite itself had little effect on P removal in the surface water, the differences between the groups with straw were not significant. On Day 28, the TP accumulation value of each group increased sharply, which may be related to the peak value of straw decomposition that day.
The TP concentration of the SZ group decreased more slowly in the surface water than in the other two groups, which may be attributed to the ion exchange property of zeolite. In part, the adsorption of NH4+-N by zeolite was due to the stronger exchange of Al3+ than of NH4+ in zeolite. While NH4+ was adsorbed by the zeolite, Al3+ was released, which led to a higher Al-P content in the SZ group as well as increased TP after each fertilization in the surface water of the SZ group, relative to the other two groups.

4. Discussion

4.1. Adsorption of NH4+-N by Zeolite in the Drainage Ditch

Zeolite has a strong NH4+-N adsorption capacity, and previous research has shown that it can be used to purify wastewater [43]. As the results shown in Figure 4 demonstrate, the adsorption capacity of 3 mm zeolite was larger than that of 5 mm zeolite, which is consistent with previous findings [44]. Additionally, we found the pseudo-second-order kinetic model to be more suitable for determining N adsorption, which is consistent with Zhang’s research [45]. We also found that the initial adsorption was generally rapid when a surface reaction mechanism was involved. Then, as the adsorption quantity decreased, the effective adsorption sites gradually decreased, which is also consistent with previous results [46].
However, as shown in Figure 5, after final equilibrium was reached, it was found that zeolite applications <100 g L−1 differed between groups, with differences in adsorption exceeding 20 mg L−1. Furthermore, the difference in ultimate adsorption capacity shrank to less than 10 mg L−1 between groups, with zeolite applications >100 g L−1. Therefore, 100 g L−1 zeolite was selected as the application value for subsequent tests; furthermore, this application was found to remove 74.23% of NH4+-N in wastewater.
When the concentration of NH4+-N around the particles and the concentration of NH4+-N in the solution reached a balance, the adsorption effect of the soil also equilibrated, allowing the ion exchange ability of zeolite to become important [47] until the zeolite surface charge flattened.

4.2. Effect of Zeolite Reuse on Water Quality under Straw Return Conditions

Existing research on straw return in paddy fields has mainly focused on the physicochemical processes of soil and crop productivity [3]. Straw incorporation represents a viable strategy to improve the subsoil’s physical, chemical, and biological processes, and resulting crop productivity, in wheat–maize rotation systems [9,18]. Additionally, the ability of zeolite to effectively alleviate water quality deterioration, particularly regarding ammonia removal, has been generally confirmed. For example, He et al. [20] showed that ammonia removal in the presence of zeolite was significantly intensified. Moussavi et al. [48] reported that the maximum experimental adsorption capacities of ammonia and humic acid as binary components were 49.7 and 10.5 mg g−1, respectively. Campisi et al. [32] evaluated a water-saving NH4+-charged zeolite (produced by a new prototype) for minimizing NO3-N leaching from soil. However, there is little research on the coupling of these two methods—straw incorporation combined with zeolite—to influence the water quality in paddy fields. In this study, the application of 20 t ha−1 zeolite reduced the peak NH4+-N concentration in the paddy field by 30%, the TN concentration by 19%, and the TP concentration by 5%, which is consistent with these published studies. Nevertheless, this study found that at the lowest N and P concentrations in the CK4 and ST groups, the N and P concentrations in the SZ group slightly increased. This result may be ascribed to the NH4+-N desorption capacity of zeolite [21]. Since the concentration of NH4+-N in the surface water was lower than that in the liquid membranes on the zeolite’s outer surface, the ions desorbed from zeolite to the solution. This phenomenon also explains why zeolite can increase the grain of a crop even while it adsorbs the N and P. Sun et al. [34] found that the zeolite amendment significantly increased the highest and final tiller number, with no effect on the ineffective tiller number. However, Wang et al. [8] found that P removal rates of zeolite-amended soil have a weak interception capacity of runoff P pollutant, which is contrary to the results of this study.

4.3. Suitable Zeolite Application

Based on the results from Experiment 1 and Experiment 2, a recommended application of 100 g L−1 of zeolite can be utilized in the drainage ditch to reduce excess N, even with stagnant water. According to the Chinese “Design Standards for Irrigation and Drainage Engineering,” the depth of the final fixed drains should be 1.3–1.5 m, with a distance between drains in light loam and sandy loam of 70–100 m (Figure 3). To control the farmland water table, the drainage water level of the drainage ditch should be lower than the depth of the groundwater required by the farmland, and generally not less than 1–1.5 m from the surface. To ensure the drainage capacity, the designed hydrology of the drainage ditch should be no less than 0.2 m below the surface. Therefore, the drainage ditch depth was set at 1.5 m, its bottom section size at 0.5 m, and its slope at 1:1. Based on our calculations, the application of zeolite to the field in the SZ group of Experiment 3 was approximately 20 t ha−1, because the maximum capacity of the drainage ditch was 180 cm3. According to the results of Experiment 3, 20 t ha−1 zeolite reduced excess N in paddy fields caused by straw incorporation and then released it as needed, confirming that zeolite can be used to recycle N and P.

5. Conclusions

This study supports the argument that zeolite can be used to alleviate excess N caused by straw returning to the field, as well as to recycle N and P. In summary, this study has demonstrated the following:
(i)
A quantity of 100 g L−1 of 3 mm heat-dried zeolite is appropriate for treating water in the drainage ditch, removing 74.23% of NH4+-N.
(ii)
Straw returning releases more N and P than it returns to the field. Zeolite adsorbs N and P to improve water quality during straw decomposition, then gradually releases them for reuse. The peak NH4+-N, TN, and TP values in the group with zeolite decreased by 30%, 19%, and 5%, respectively, relative to straw returning without zeolite.
(iii)
Combining all experimental results with conventional field layouts, 20 t ha−1 zeolite is the ideal application for recycling N and P.
These findings suggest that reusing zeolite can not only alleviate excess N, but can also recycle N and P for improved crop growth. This study provides a new and more economical scheme for alleviating the pollution caused by straw returning. However, the limitations of this study design include the use of indoor simulations and pot experiments. Therefore, future experiments should expand this study to detect soil and physiological growth indicators.

Author Contributions

Conceptualization, W.H. and J.L.; methodology, X.J.; software, H.J.; validation, W.H., J.L. and X.J.; formal analysis, W.H.; investigation, W.H.; resources, X.J.; data curation, H.J.; writing—original draft preparation, W.H.; writing—review and editing, W.H.; visualization, W.H.; supervision, J.L. and X.J.; project administration, X.J.; funding acquisition, X.J. All authors have read and agreed to the published version of the manuscript.

Funding

This research was funded by the Sub project of the National Key R&D Program of China (No. 2021YFD1700803-02) and the Natural Science Foundation of Jiangsu Province (No. BK20200524).

Data Availability Statement

Not applicable.

Acknowledgments

We thank Yong Liu and Yanchuan Pan of Hohai University for their help with sample collection and measurements.

Conflicts of Interest

The authors declare no conflict of interest.

References

  1. Yang, X.; Cheng, L.; Huang, X.; Zhang, Y.; Yin, C.; Lebailly, P. Incentive mechanism to promote corn stalk return sustainably in Henan, China. Sci. Total Environ. 2020, 738, 139775. [Google Scholar] [CrossRef] [PubMed]
  2. McKendry, P. Energy production from biomass (part 1): Overview of biomass. Bioresour. Technol. 2002, 83, 37–46. [Google Scholar] [CrossRef]
  3. Wu, G.; Ling, J.; Zhao, D.-Q.; Xu, Y.-P.; Liu, Z.-X.; Wen, Y.; Zhou, S.-L. Deep-injected straw incorporation improves subsoil fertility and crop productivity in a wheat-maize rotation system in the North China Plain. Field Crops Res. 2022, 286, 108612. [Google Scholar] [CrossRef]
  4. Chen, J.; Li, C.; Ristovski, Z.; Milic, A.; Gu, Y.; Islam, M.S.; Wang, S.; Hao, J.; Zhang, H.; He, C.; et al. A review of biomass burning: Emissions and impacts on air quality, health and climate in China. Sci. Total Environ. 2017, 579, 1000–1034. [Google Scholar] [CrossRef] [PubMed] [Green Version]
  5. Cao, H.; Zhu, X.Q.; Heijman, W.; Zhao, K. The impact of land transfer and farmers’ knowledge of farmland protection policy on pro-environmental agricultural practices: The case of straw return to fields in Ningxia, China. J. Clean. Prod. 2020, 277, 123701. [Google Scholar] [CrossRef]
  6. Liu, T. Effects of Crop Residues Returning on Greenhouse Gas Emissions from Brown Red Soil. Master’s Thesis, Huazhong Agricultural University, Huazhong, China, 2013. [Google Scholar]
  7. Nyberg, G.; Ekblad, A.; Buresh, R.; Högberg, P. Short-term patterns of carbon and nitrogen mineralisation in a fallow field amended with green manures from agroforestry trees. Biol. Fertil. Soils 2002, 36, 18–25. [Google Scholar] [CrossRef]
  8. Wang, J.F.; Chen, J.G.; Jin, Z.X.; Guo, J.Y.; Yang, H.Q.; Zeng, Y.; Liu, Y. Simultaneous removal of phosphate and ammonium nitrogen from agricultural runoff by amending soil in lakeside zone of Karst area, Southern China. Agric. Ecosyst. Environ. 2020, 289, 106745. [Google Scholar] [CrossRef]
  9. Yang, H.S.; Zhou, J.J.; Feng, J.X.; Zhai, S.L.; Chen, W.P.; Liu, J.; Bian, X.M. Ditch-buried straw return: A novel tillage practice combined with tillage rotation and deep ploughing in rice-wheat rotation systems. Adv. Agron. 2019, 154, 257–290. [Google Scholar]
  10. Wang, X.H.; Yang, H.S.; Liu, J.; Wu, J.S.; Chen, W.P.; Wu, J.; Zhu, L.Q.; Bian, X.M. Effects of ditch-buried straw return on soil organic carbon and rice yields in a rice-wheat rotation system. Catena 2015, 127, 56–63. [Google Scholar] [CrossRef]
  11. Wu, Q.; Chi, D.C.; Xia, G.M.; Chen, T.T.; Sun, Y.D.; Song, Y.H. Effects of Zeolite on Drought Resistance and Water-Nitrogen Use Efficiency in Paddy Rice. J. Irrig. Drain. Eng. 2019, 145, 04019024. [Google Scholar] [CrossRef]
  12. Yang, H.S.; Li, Y.F.; Zhai, S.L.; Fang, C.; Liu, J.; Zhang, Q. Long term ditch-buried straw return affects soil fungal community structure and carbon-degrading enzymatic activities in a rice-wheat rotation system. Appl. Soil Ecol. 2020, 155, 103660. [Google Scholar] [CrossRef]
  13. Yao, Z.; Zheng, X.; Wang, R.; Xie, B.; Butterbach-Bahl, K.; Zhu, J. Nitrous oxide and methane fluxes from a rice–wheat crop rotation under wheat residue incorporation and no-tillage practices. Atmos. Environ. 2013, 79, 641–649. [Google Scholar] [CrossRef]
  14. Gabisa, E.W.; Gheewala, S.H. Potential of bio-energy production in Ethiopia based on available biomass residues. Biomass Bioenergy 2018, 111, 77–87. [Google Scholar] [CrossRef]
  15. Zhu, Q.; Liu, X.; Hao, T.; Zeng, M.; Shen, J.; Zhang, F.; De Vries, W. Modeling soil acidification in typical Chinese cropping systems. Sci. Total Environ. 2018, 613–614, 1339–1348. [Google Scholar] [CrossRef] [PubMed] [Green Version]
  16. Zhao, X.; Zhou, Y.; Min, J.; Wang, S.Q.; Shi, W.M.; Xing, G.X. Nitrogen runoff dominates water nitrogen pollution from rice-wheat rotation in the Taihu Lake region of China. Agric. Ecosyst. Environ. 2012, 156, 1–11. [Google Scholar] [CrossRef]
  17. Tan, X.; Shao, D.; Liu, H.; Yang, F.; Xiao, C.; Yang, H. Effects of alternate wetting and drying irrigation on percolation and nitrogen leaching in paddy fields. Paddy Water Environ. 2013, 11, 381–395. [Google Scholar] [CrossRef]
  18. Zhang, Z.S.; Guo, L.J.; Liu, T.Q.; Li, C.F.; Cao, C.G. Effects of tillage practices and straw returning methods on greenhouse gas emissions and net ecosystem economic budget in rice–wheat cropping systems in central China. Atmos. Environ. 2015, 122, 636–644. [Google Scholar] [CrossRef]
  19. Almutairi, A.; Weatherley, L.R. Intensification of ammonia removal from waste water in biologically active zeolitic ion exchange columns. J. Environ. Manag. 2015, 160, 128–138. [Google Scholar] [CrossRef]
  20. He, X.; Li, H.; Zhu, J. A value-added step towards promoting the serviceability of fluidized bed bioreactor in treating wastewater with low carbon to nitrogen ratio. Sci. Total Environ. 2021, 750, 141665. [Google Scholar] [CrossRef]
  21. Smith, D.P.; Smith, N.T. Anaerobic-ion exchange (AN-IX) process for local-scale nitrogen recovery from wastewater. Bioresour. Technol. 2015, 196, 324–331. [Google Scholar] [CrossRef]
  22. Armbruster, T.; Gunter, M.E. Crystal structures of natural zeolites. Nat. Zeolites Occur. Prop. Appl. 2001, 45, 1–67. [Google Scholar]
  23. Mumpton, F.A. La roca magica: Uses of natural zeolites in agriculture and industry. Proc. Natl. Acad. Sci. USA 1999, 96, 3463–3470. [Google Scholar] [CrossRef] [PubMed]
  24. Bish, D.L. Chapter 13.2 Parallels and Distinctions between Clay Minerals and Zeolites. Dev. Clay Sci. 2006, 1, 1097–1112. [Google Scholar]
  25. Hermassi, M.; Valderrama, C.; Font, O.; Moreno, N.; Querol, X.; Batis, N.H.; Cortina, J.L. Phosphate recovery from aqueous solution by K-zeolite synthesized from fly ash for subsequent valorisation as slow release fertilizer. Sci. Total Environ. 2020, 731, 139002. [Google Scholar] [CrossRef] [PubMed]
  26. Montalvo, S.; Huilinir, C.; Borja, R.; Sanchez, E.; Herrmann, C. Application of zeolites for biological treatment processes of solid wastes and wastewaters—A review. Bioresour. Technol. 2020, 301, 122808. [Google Scholar] [CrossRef] [PubMed]
  27. Montalvo, S.; San Martina, J.; Huilinir, C.; Guerrero, L.; Borja, R. Assessment of a UASB reactor with high ammonia concentrations: Effect of zeolite addition on process performance. Process Biochem. 2014, 49, 2220–2227. [Google Scholar] [CrossRef] [Green Version]
  28. Wang, X.W.; Zhang, L.Y.; Xi, B.D.; Sun, W.J.; Xia, X.F.; Zhu, C.W.; He, X.S.; Li, M.X.; Yang, T.X.; Wang, P.F.; et al. Biogas production improvement and C/N control by natural clinoptilolite addition into anaerobic co-digestion of Phragmites australis, feces and kitchen waste. Bioresour. Technol. 2015, 180, 192–199. [Google Scholar] [CrossRef]
  29. Noori, M.; Zendehdel, M.; Ahmadi, A. Using natural zeolite for the improvement of soil salinity and crop yield. Toxicol. Environ. Chem. 2006, 88, 77–84. [Google Scholar] [CrossRef]
  30. He, Z.L.; Calvert, D.V.; Alva, A.K.; Li, Y.C.; Banks, D.J. Clinoptilolite zeolite and cellulose amendments to reduce ammonia volatilization in a calcareous sandy soil. Plant Soil 2002, 247, 253–260. [Google Scholar] [CrossRef]
  31. Sha, Y.; Chi, D.; Chen, T.; Wang, S.; Zhao, Q.; Li, Y.; Sun, Y.; Chen, J.; Lærke, P.E. Zeolite application increases grain yield and mitigates greenhouse gas emissions under alternate wetting and drying rice system. Sci. Total Environ. 2022, 838, 156067. [Google Scholar] [CrossRef]
  32. Campisi, T.; Abbondanzi, F.; Faccini, B.; Di Giuseppe, D.; Malferrari, D.; Coltorti, M.; Laurora, A.; Passaglia, E. Ammonium-charged zeolitite effects on crop growth and nutrient leaching: Greenhouse experiments on maize (Zea mays). Catena 2016, 140, 66–76. [Google Scholar] [CrossRef]
  33. Castro, C.J.; Shyu, H.Y.; Xaba, L.; Bair, R.; Yeh, D.H. Performance and onsite regeneration of natural zeolite for ammonium removal in a field-scale non-sewered sanitation system. Sci. Total Environ. 2021, 776, 145938. [Google Scholar] [CrossRef] [PubMed]
  34. Sun, Y.D.; He, Z.L.; Wu, Q.; Zheng, J.L.; Li, Y.H.; Wang, Y.Z.; Chen, T.T.; Chi, D.C. Zeolite amendment enhances rice production, nitrogen accumulation and translocation in wetting and drying irrigation paddy field. Agric. Water Manag. 2020, 235, 106126. [Google Scholar] [CrossRef]
  35. Zhao, Y.; Shu, X.; Tu, Q.; Yang, Y.; Liu, C.; Fu, D.; Li, W.; Duan, C. Pollutant removal from agricultural drainage water using a novel double-layer ditch with biofilm carriers. Bioresour. Technol. 2020, 310, 123344. [Google Scholar] [CrossRef]
  36. Guaya, D.; Mendoza, A.; Valderrama, C.; Farran, A.; Sauras-Yera, T.; Cortina, J.L. Use of nutrient-enriched zeolite (NEZ) from urban wastewaters in amended soils: Evaluation of plant availability of mineral elements. Sci. Total Environ. 2020, 727, 138646. [Google Scholar] [CrossRef]
  37. Baghaie, A.H.; Aghili, F.; Jafarinia, R. Soil-indigenous arbuscular mycorrhizal fungi and zeolite addition to soil synergistically increase grain yield and reduce cadmium uptake of bread wheat (through improved nitrogen and phosphorus nutrition and immobilization of Cd in roots). Environ. Sci. Pollut. Res. Int. 2019, 26, 30794–30807. [Google Scholar] [CrossRef]
  38. GhassemiSahebi, F.; Mohammadrezapour, O.; Delbari, M.; KhasheiSiuki, A.; Ritzema, H.; Cherati, A. Effect of utilization of treated wastewater and seawater with Clinoptilolite-Zeolite on yield and yield components of sorghum. Agric. Water Manag. 2020, 234, 106117. [Google Scholar] [CrossRef]
  39. Mohan, S.; Dinesha, P.; Kumar, S. NOx reduction behaviour in copper zeolite catalysts for ammonia SCR systems: A review. Chem. Eng. J. 2020, 384, 123253. [Google Scholar] [CrossRef]
  40. Shinzato, M.C.; Wu, L.F.; Mariano, T.O.; Freitas, J.G.; Martins, T.S. Mineral sorbents for ammonium recycling from industry to agriculture. Environ. Sci. Pollut. Res. Int. 2020, 27, 13599–13616. [Google Scholar] [CrossRef]
  41. Mahmoud, A.W.M.; Abdeldaym, E.A.; Abdelaziz, S.M.; El-Sawy, M.B.I.; Mottaleb, S.A. Synergetic Effects of Zinc, Boron, Silicon, and Zeolite Nanoparticles on Confer Tolerance in Potato Plants Subjected to Salinity. Agronomy 2019, 10, 19. [Google Scholar] [CrossRef] [Green Version]
  42. Smith, D.P. Chabazite Biofilter for Enhanced Stormwater Nitrogen Removal. Water Environ. Res. 2011, 83, 373–384. [Google Scholar] [CrossRef] [PubMed]
  43. Li, H.; Li, M.; Zheng, F.; Wang, J.; Chen, L.; Hu, P.; Zhen, Q.; Bashir, S.; Liu, J.L. Efficient removal of water pollutants by hierarchical porous zeolite-activated carbon prepared from coal gangue and bamboo. J. Clean. Prod. 2021, 325, 129322. [Google Scholar] [CrossRef]
  44. Seruga, P.; Krzywonos, M.; Pyzanowska, J.; Urbanowska, A.; Pawlak-Kruczek, H.; Niedzwiecki, L. Removal of Ammonia from the Municipal Waste Treatment Effluents using Natural Minerals. Molecules 2019, 24, 3633. [Google Scholar] [CrossRef] [PubMed]
  45. Zhang, B.; Wang, X.; Li, S.; Liu, Y.; An, Y.; Zheng, X. Preferable Adsorption of Nitrogen and Phosphorus from Agricultural Wastewater Using Thermally Modified Zeolite–Diatomite Composite Adsorbent. Water 2019, 11, 2053. [Google Scholar] [CrossRef] [Green Version]
  46. Wu, J.; Guo, X.; Lu, J.; Wan, S.; Wang, Y.; Xu, Z.; Zhang, X. Decomposition characteristics of wheat straw and effects on soil biological properties and nutrient status under different rice cultivation. Acta Ecol. Sin. 2013, 33, 565–575. [Google Scholar]
  47. Scandelai, A.P.J.; Zotesso, J.P.; Jegatheesan, V.; Cardozo-Filho, L.; Tavares, C.R.G. Intensification of supercritical water oxidation (ScWO) process for landfill leachate treatment through ion exchange with zeolite. Waste Manag. 2020, 101, 259–267. [Google Scholar] [CrossRef] [PubMed]
  48. Moussavi, G.; Talebi, S.; Farrokhi, M.; Sabouti, R.M. The investigation of mechanism, kinetic and isotherm of ammonia and humic acid co-adsorption onto natural zeolite. Chem. Eng. J. 2011, 171, 1159–1169. [Google Scholar] [CrossRef]
Figure 1. Temperature and precipitation of the test field during the growing season.
Agronomy 13 00327 g001
Figure 2. A schematic diagram of the experimental treatments.
Agronomy 13 00327 g002
Figure 3. The traditional drainage engineering layout of the paddy field.
Agronomy 13 00327 g003
Figure 4. Nitrogen (N) adsorption kinetics in a drainage ditch simulation using two particle sizes of zeolite. (A) N adsorption over time. (B) Pseudo-first-order kinetic model and (C) pseudo-second-order kinetic model of N adsorption on zeolite. Red circles indicate 5 mm zeolite particles; black squares indicate 3 mm zeolite particles. (D) Fitness of the intraparticle diffusion model using the Morris–Weber equation.
Agronomy 13 00327 g004
Figure 5. Nitrogen (N) adsorption curves of different applications of zeolite in a drainage ditch simulation. The ammonia N (NH4+-N) adsorption rate was measured over time with 25, 50, 75, 100, 125, or 150 g L−1 zeolite.
Agronomy 13 00327 g005
Figure 6. Nitrogen adsorption kinetics with three zeolite treatment groups. Black squares indicate heat-dried zeolite (Zd); red circles indicate air-dried zeolite (Zad); blue triangles indicate heat-dried soil without zeolite (Sd).
Agronomy 13 00327 g006
Figure 7. Dynamic changes in ammonia nitrogen (NH4+-N) concentration in different layers (in cm) of surface water and soil solutions under different treatments. Black squares indicate no straw returning (CK4); red circles indicate straw returning (ST); blue triangles indicate straw returning with zeolite (SZ). Different fertilizer treatments are indicated by black arrows.
Agronomy 13 00327 g007
Figure 8. Dynamic changes in nitrate nitrogen (NO3-N) concentration in different layers (in cm) of surface water and soil solutions under different treatments. Black squares indicate no straw returning (CK4); red circles indicate straw returning (ST); blue triangles indicate straw returning with zeolite (SZ). Different fertilizer treatments are indicated by black arrows.
Agronomy 13 00327 g008
Figure 9. Dynamic changes in total nitrogen (TN) concentration in different layers of surface water and soil solutions under different treatments. (Top left panel) shows the no straw returning group (CK4); (top right panel) shows the straw returning group (ST); (bottom left panel) shows the straw returning with zeolite group (SZ). Different fertilizer treatments are indicated by black arrows.
Agronomy 13 00327 g009
Figure 10. Dynamic changes in total phosphorous (TP) concentration in different layers of surface water and soil solutions under different treatments. (Top left panel) shows the no straw returning group (CK4); (top right panel) shows the straw returning group (ST); (bottom left panel) shows the straw returning with zeolite group (SZ). Different fertilizer treatments are indicated by black arrows.
Agronomy 13 00327 g010
Table 1. Chemical composition of the clinoptilolite zeolite.
Component Component
Al2O3 (%)13.39Na2O (%)1.25
SiO2 (%)68.30K2O (%)2.92
Fe2O3 (%)1.06MgO (%)0.71
Cao (%)3.42TiO2 (%)0.20
CEC (cmol + kg−1)140
Table 2. Types and amounts of fertilizer applied in the different growth periods.
FertilizerTypeDate Application
(kg/ha)
Basic fertilizerCompound fertilizer
(mineral and solid)
N: P2O5: K2O = 15%: 15%: 15%
7th July300
Reviving fertilizerUrea (mineral and solid): N ≧ 46.4%20th July150
Tillering fertilizerUrea (mineral and solid): N ≧ 46.4%31st July75
Panicle fertilizerUrea (mineral and solid): N ≧ 46.4%29th August150
Table 3. Adsorption kinetic parameters of nitrogen onto zeolite.
Size
(mm)
Pseudo-First-Order ModelPseudo-Second-Order Model
q e
( mg   g 1 )
k 1
(min)
R2 q e
(mg g−1)
k 2
(g mg−1 min)
R2h
(mg g−1 min)
0.5–33.370.01750.82163.640.00760.98990.1016
3–52.770.00950.85493.260.00420.96770.0454
Disclaimer/Publisher’s Note: The statements, opinions and data contained in all publications are solely those of the individual author(s) and contributor(s) and not of MDPI and/or the editor(s). MDPI and/or the editor(s) disclaim responsibility for any injury to people or property resulting from any ideas, methods, instructions or products referred to in the content.

