
Identification of Eco-Climatic Factors Driving Yields and Genotype by Environment Interactions for Yield in Early Maturity Soybean Using Crop Simulation

 ,
,  ,
,
Abstract
:1. Introduction
2. Materials and Methods
2.1. Experimental Dataset
2.1.1. Multi-Environment Trials Data Source
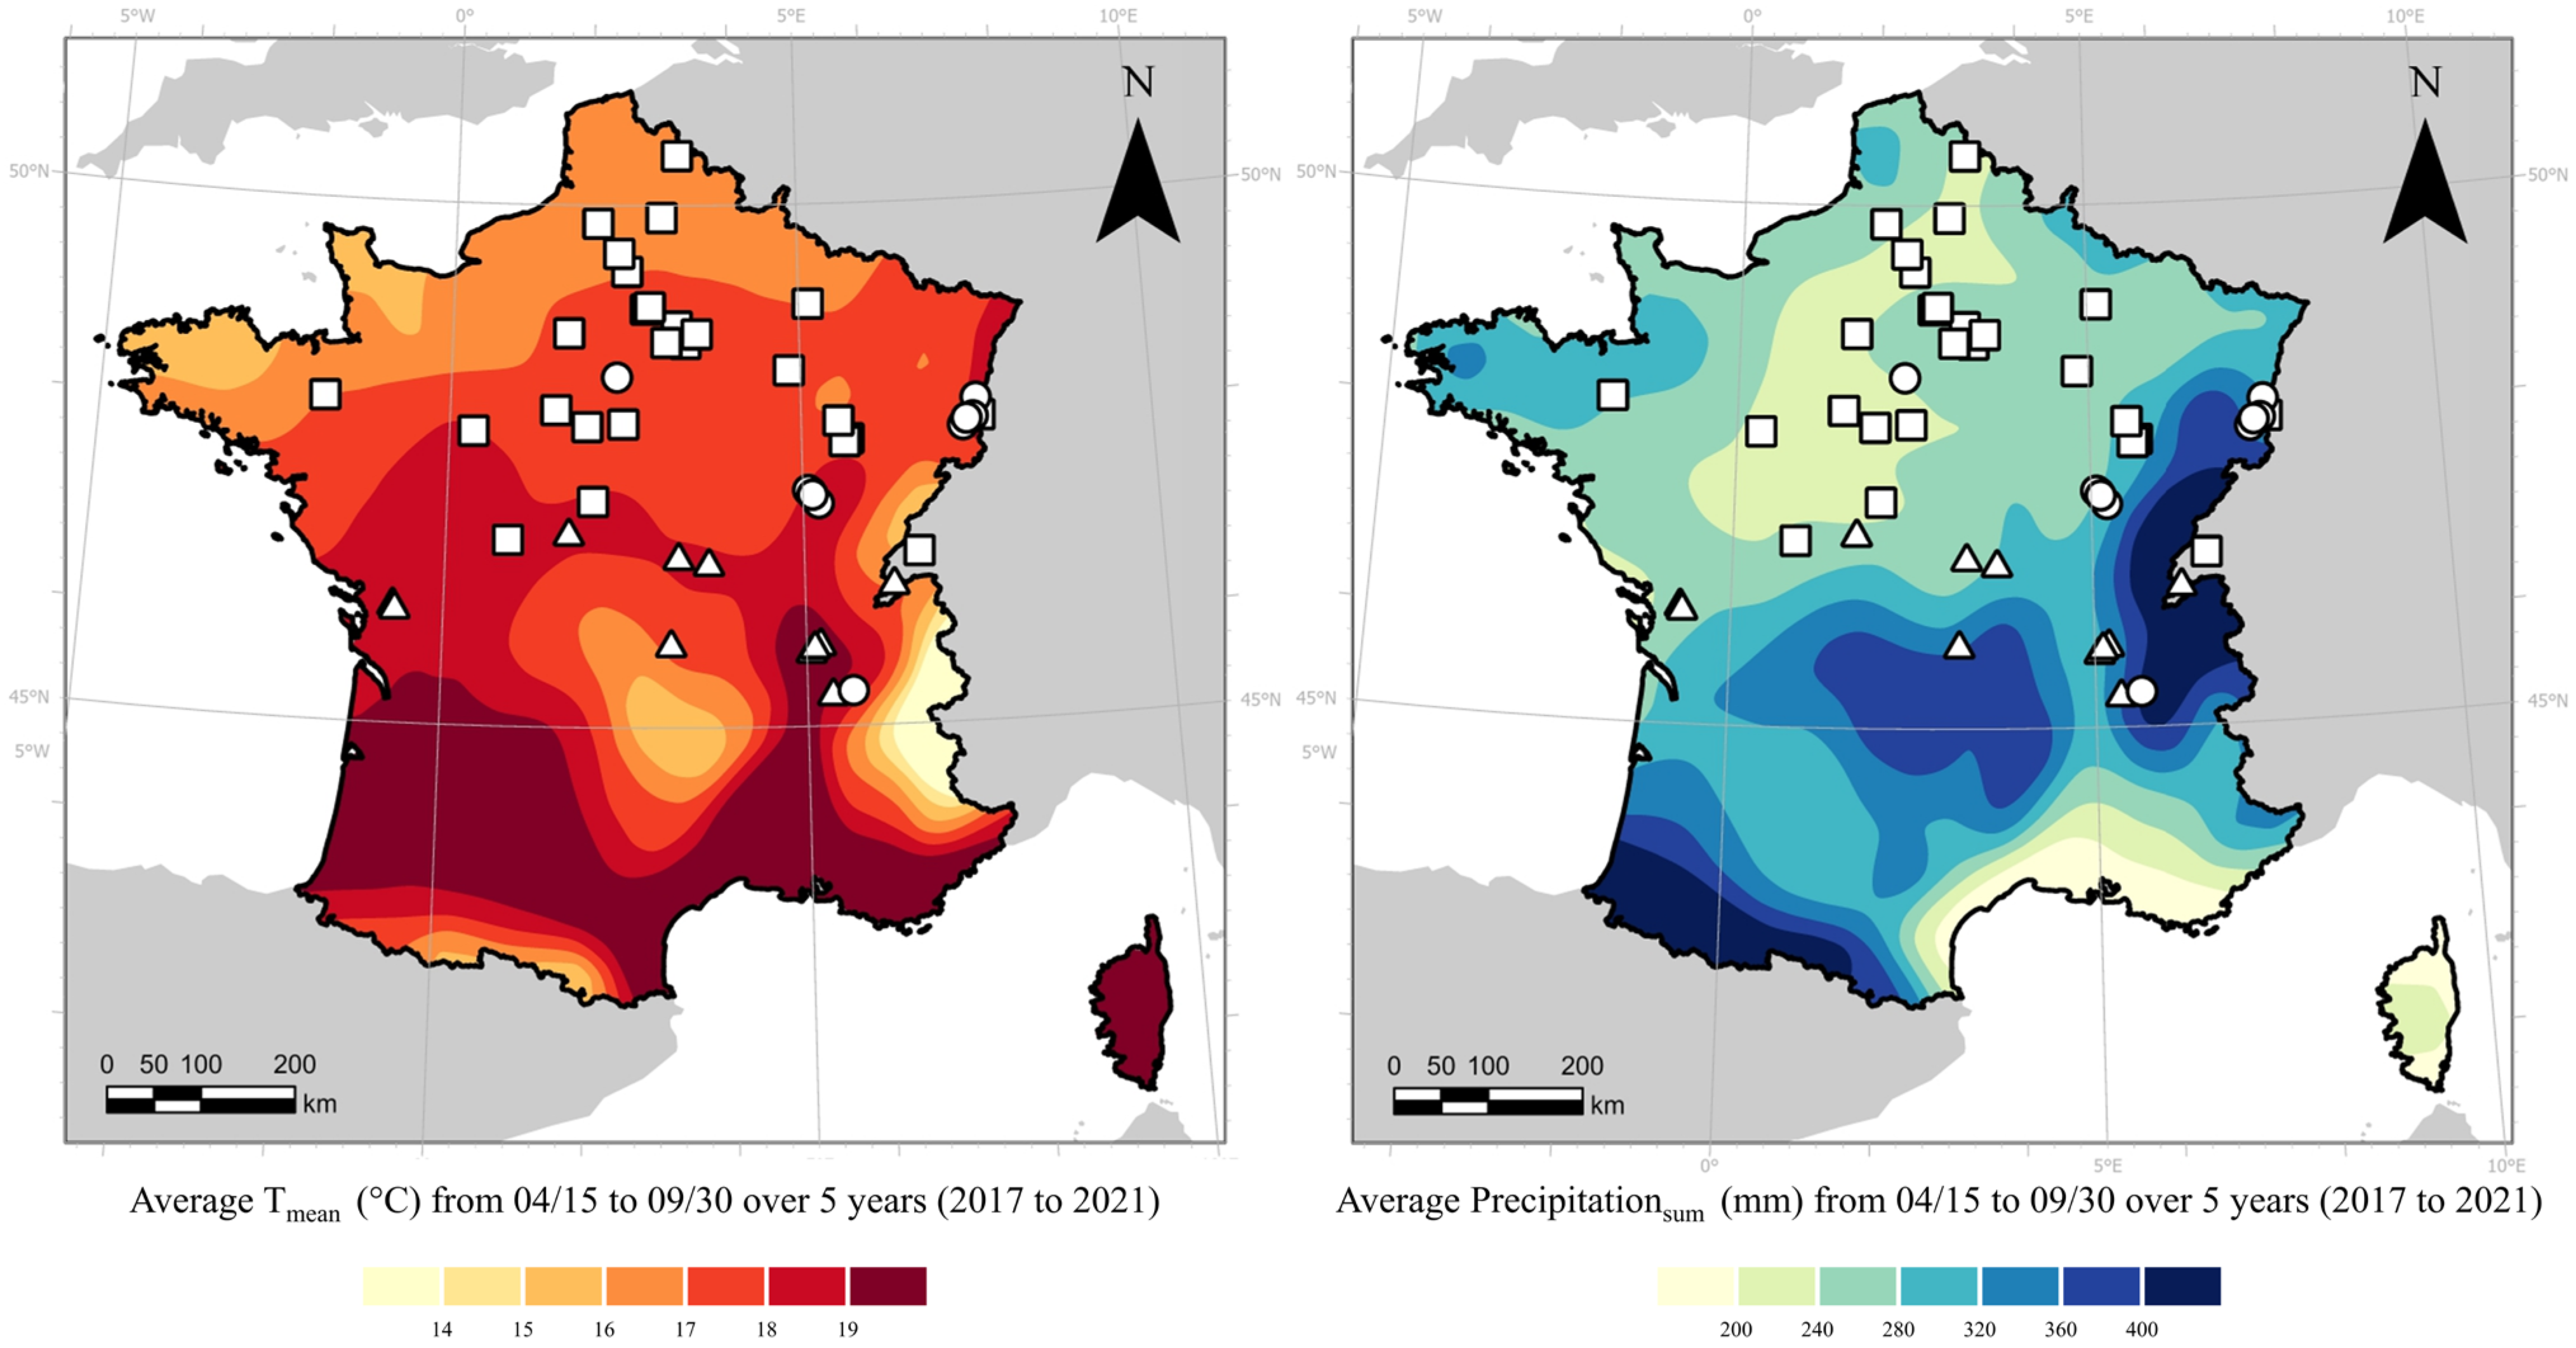
2.1.2. Weather and Soil Data Source
2.2. DSSAT Simulations and Eco-Climatic Factors Calculation
2.2.1. CROPGRO-Soybean Model Inputs
2.2.2. CROPGRO Outputs and Eco-Climatic Factors Calculation
2.3. Partial Least Square Regression Analysis for the Selection of Eco-Climatic Factors
2.3.1. Yield Analysis
2.3.2. Genotype by Environment Interactions Analysis
3. Results
3.1. Main Eco-Climatic Factors Impacting Yields
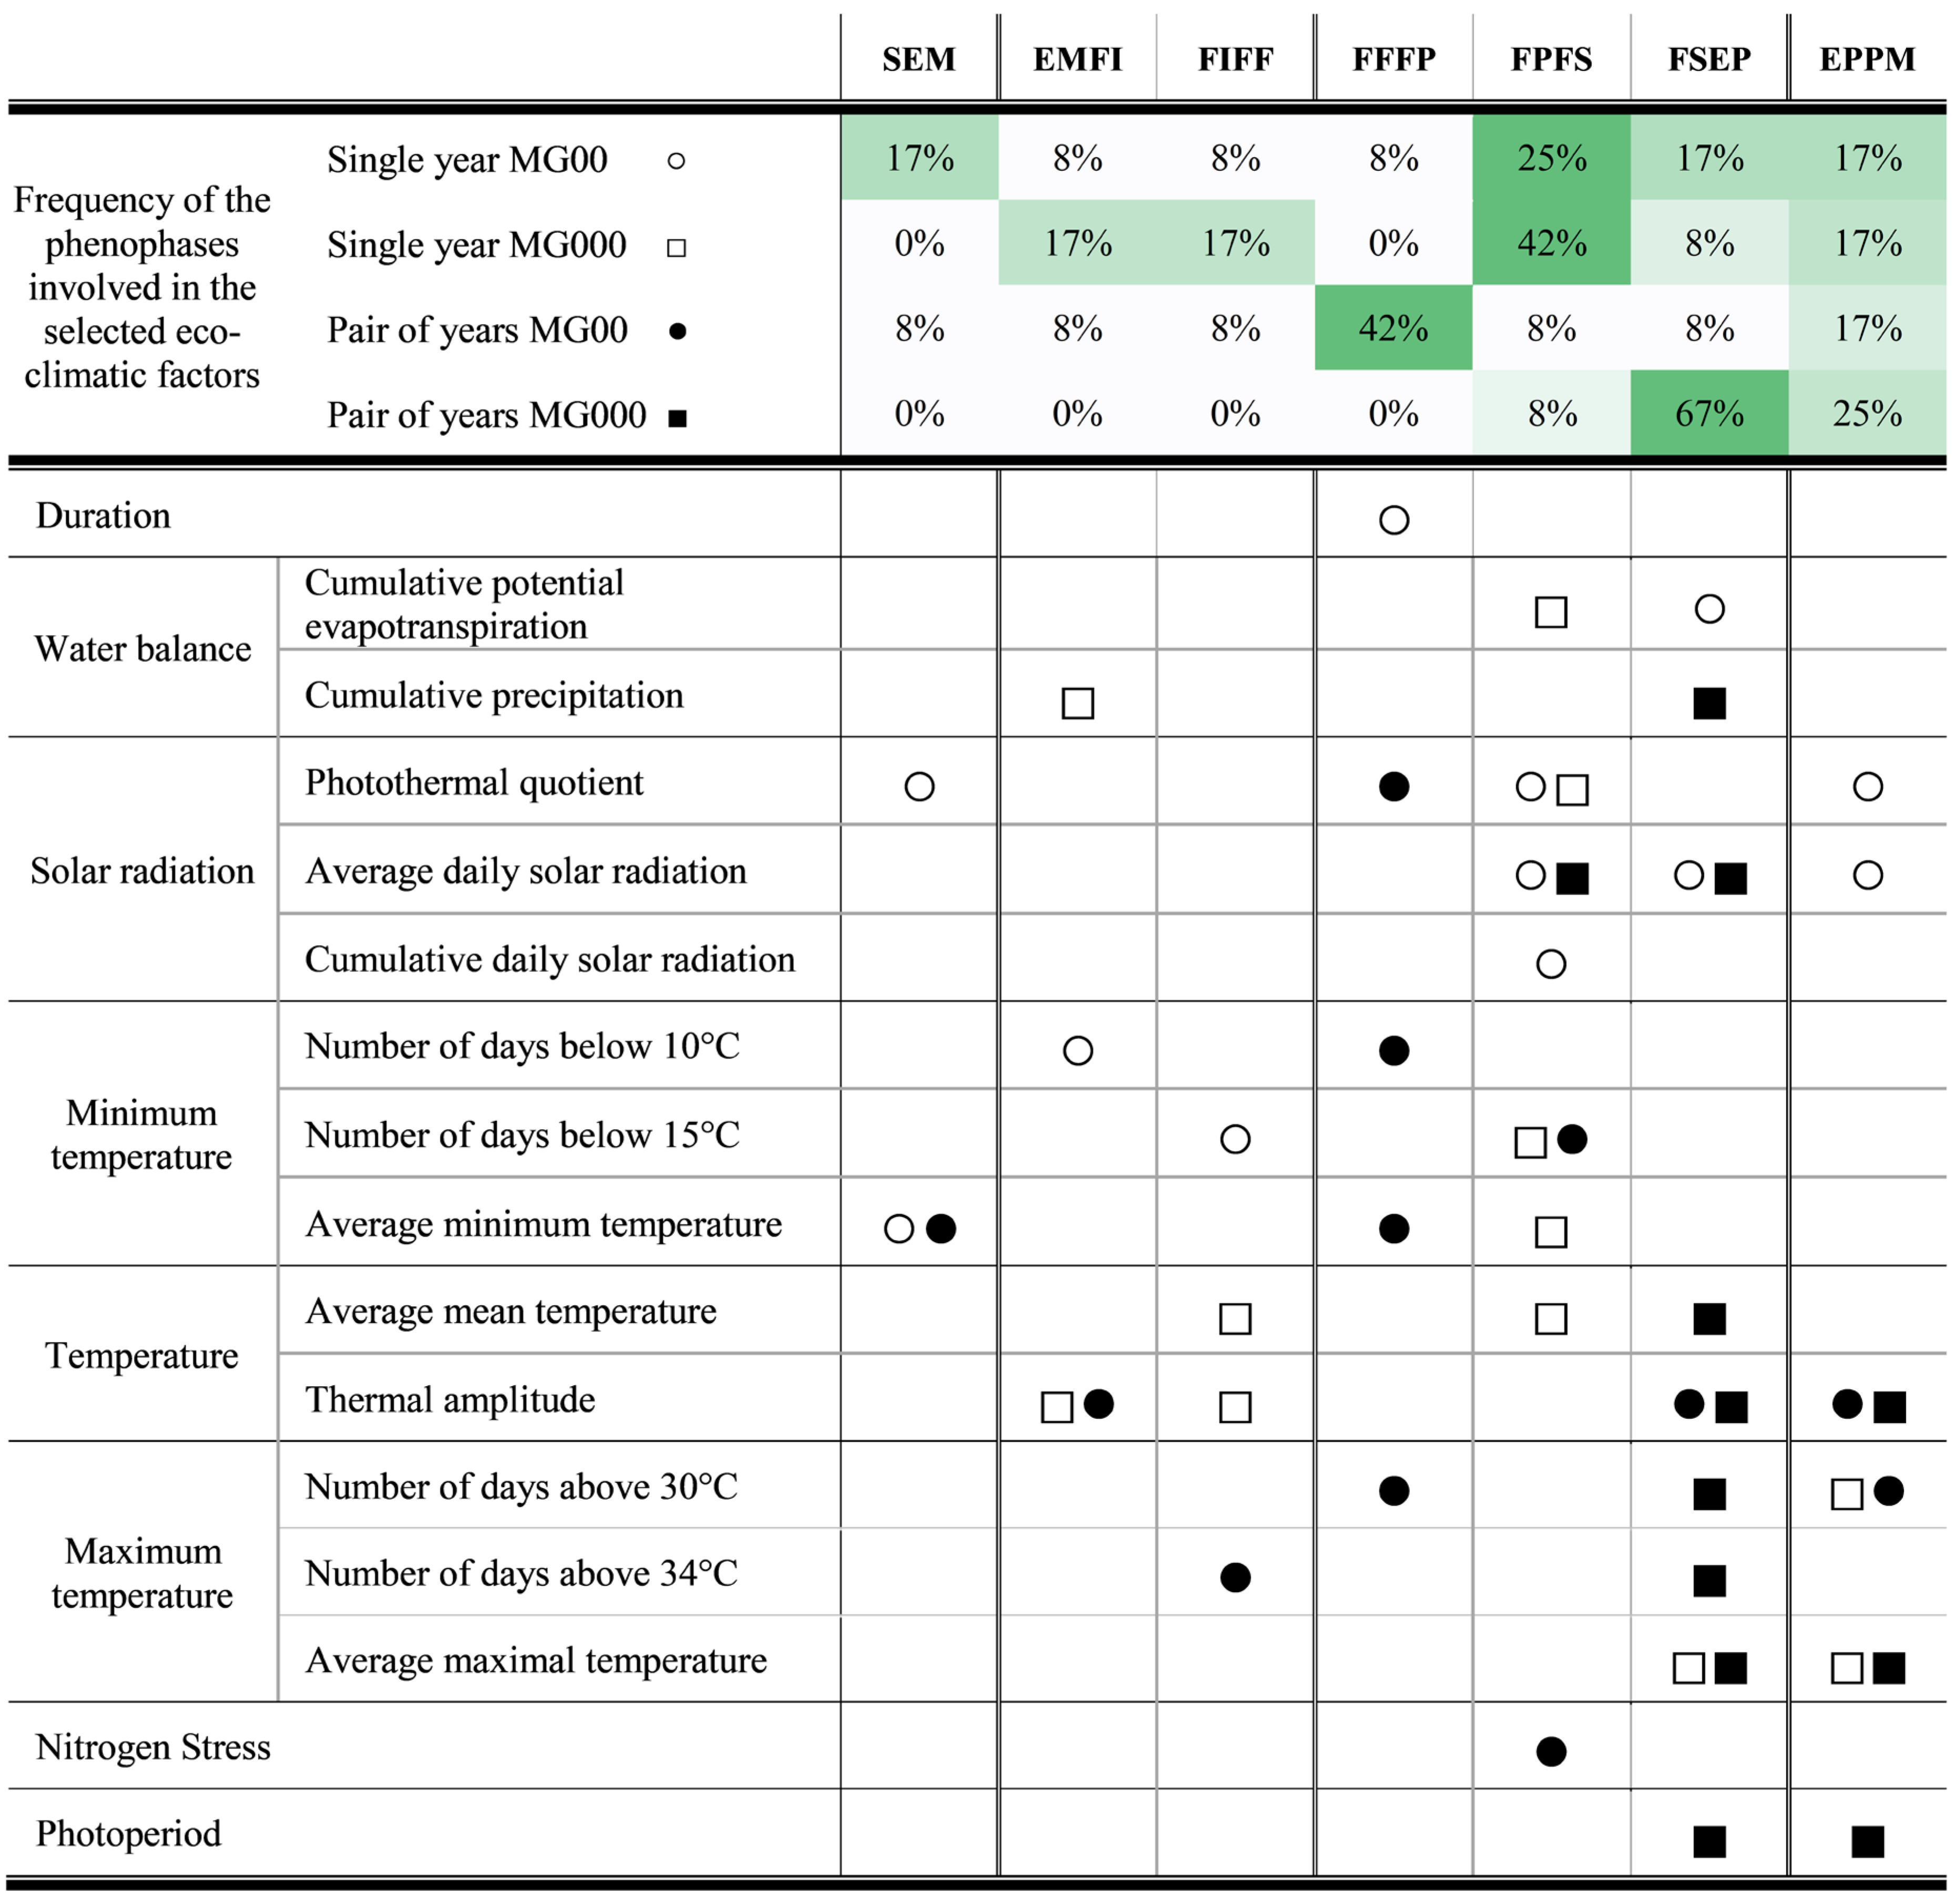
3.2. Main Eco-Climatic Factors Affecting Genotype by Environment Interactions
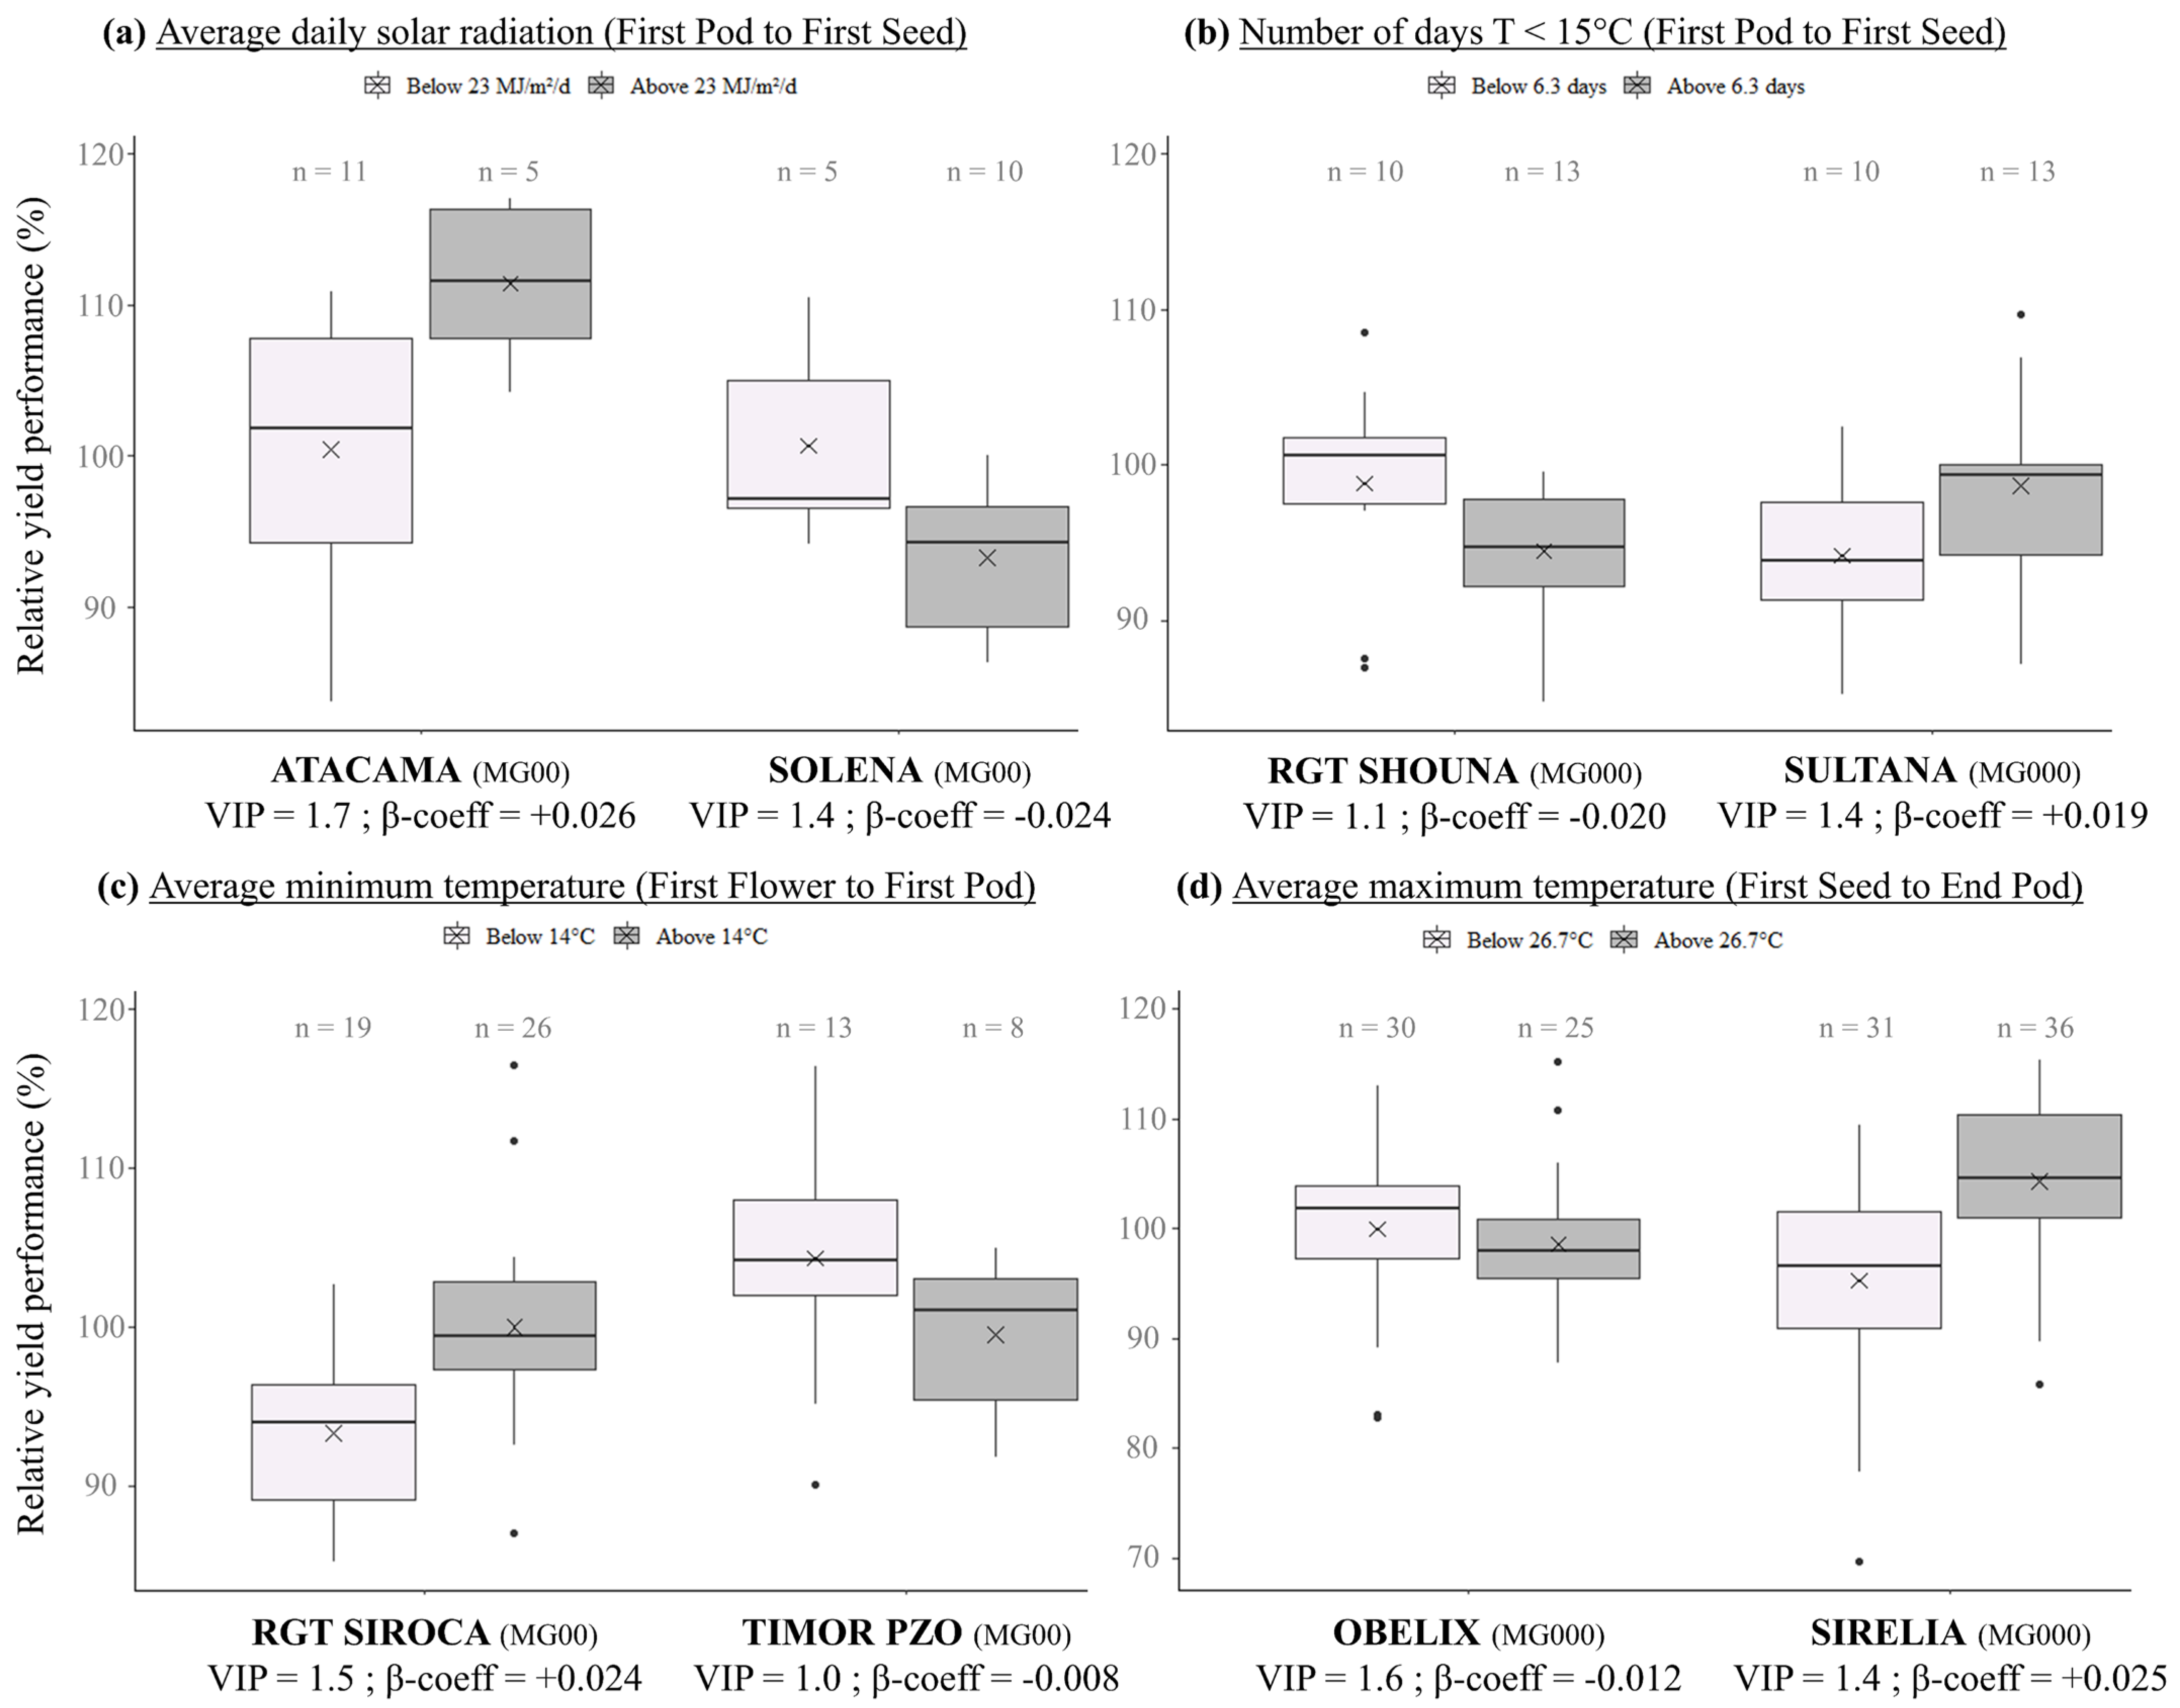
3.3. Effect of Eco-Climatic Factors Frequently Detected in GEI Analyses on Genotypic Responses
4. Discussion
4.1. Eco-Climatic Factors Influencing Soybean Yields
4.2. Major Eco-Climatic Factors Impacting Genotype by Environment Interactions
5. Conclusions
Supplementary Materials
Author Contributions
Funding
Data Availability Statement
Acknowledgments
Conflicts of Interest
References
- Cooper, M.; Byth, D.E. Understanding Plant Adaptation to Achieve Systematic Applied Crop Improvement—A Fundamental Challenge. In Plant Adaptation and Crop Improvement; IRRI; CAB International: Wallingford, UK, 1996; pp. 5–23. ISBN 978-0-85199-108-5. [Google Scholar]
- Lin, B.B. Resilience in Agriculture through Crop Diversification: Adaptive Management for Environmental Change. BioScience 2011, 61, 183–193. [Google Scholar] [CrossRef] [Green Version]
- Massawe, F.; Mayes, S.; Cheng, A. Crop Diversity: An Unexploited Treasure Trove for Food Security. Trends Plant Sci. 2016, 21, 365–368. [Google Scholar] [CrossRef]
- Cortinovis, G.; Di Vittori, V.; Bellucci, E.; Bitocchi, E.; Papa, R. Adaptation to Novel Environments during Crop Diversification. Curr. Opin. Plant Biol. 2020, 56, 203–217. [Google Scholar] [CrossRef] [PubMed]
- Chapman, S.C.; Chakraborty, S.; Dreccer, M.F.; Howden, S.M.; Chapman, S.C.; Chakraborty, S.; Dreccer, M.F.; Howden, S.M. Plant Adaptation to Climate Change-Opportunities and Priorities in Breeding. Crop Pasture Sci. 2012, 63, 251–268. [Google Scholar] [CrossRef] [Green Version]
- van Ittersum, M.K.; Cassman, K.G.; Grassini, P.; Wolf, J.; Tittonell, P.; Hochman, Z. Yield Gap Analysis with Local to Global Relevance—A Review. Field Crops Res. 2013, 143, 4–17. [Google Scholar] [CrossRef] [Green Version]
- Mae, T. Physiological Nitrogen Efficiency in Rice: Nitrogen Utilization, Photosynthesis, and Yield Potential. Plant Soil 1997, 196, 201–210. [Google Scholar] [CrossRef]
- Mathew, J.P.; Herbert, S.J.; Zhang, S.; Rautenkranz, A.A.F.; Litchfield, G.V. Differential Response of Soybean Yield Components to the Timing of Light Enrichment. Agron. J. 2000, 92, 1156–1161. [Google Scholar] [CrossRef] [Green Version]
- Earl, H.J.; Davis, R.F. Effect of Drought Stress on Leaf and Whole Canopy Radiation Use Efficiency and Yield of Maize. Agron. J. 2003, 95, 688–696. [Google Scholar] [CrossRef]
- Leilah, A.A.; Al-Khateeb, S.A. Statistical Analysis of Wheat Yield under Drought Conditions. J. Arid Environ. 2005, 61, 483–496. [Google Scholar] [CrossRef]
- Chenu, K.; Cooper, M.; Hammer, G.L.; Mathews, K.L.; Dreccer, M.F.; Chapman, S.C. Environment Characterization as an Aid to Wheat Improvement: Interpreting Genotype–Environment Interactions by Modelling Water-Deficit Patterns in North-Eastern Australia. J. Exp. Bot. 2011, 62, 1743–1755. [Google Scholar] [CrossRef]
- Annicchiarico, P. Genotype X Environment Interactions: Challenges and Opportunities for Plant Breeding and Cultivar Recommendations; Food & Agriculture Organization: Rome, Italy, 2002; ISBN 978-92-5-104870-2. [Google Scholar]
- Voss-Fels, K.P.; Cooper, M.; Hayes, B.J. Accelerating Crop Genetic Gains with Genomic Selection. Theor. Appl. Genet. 2019, 132, 669–686. [Google Scholar] [CrossRef]
- Resende, R.T.; Piepho, H.-P.; Rosa, G.J.M.; Silva-Junior, O.B.; e Silva, F.F.; de Resende, M.D.V.; Grattapaglia, D. Enviromics in Breeding: Applications and Perspectives on Envirotypic-Assisted Selection. Theor. Appl. Genet. 2021, 134, 95–112. [Google Scholar] [CrossRef]
- Smith, A.; Ganesalingam, A.; Lisle, C.; Kadkol, G.; Hobson, K.; Cullis, B. Use of Contemporary Groups in the Construction of Multi-Environment Trial Datasets for Selection in Plant Breeding Programs. Front. Plant Sci. 2021, 11, 623586. [Google Scholar] [CrossRef]
- Caubel, J.; García de Cortázar-Atauri, I.; Launay, M.; de Noblet-Ducoudré, N.; Huard, F.; Bertuzzi, P.; Graux, A.-I. Broadening the Scope for Ecoclimatic Indicators to Assess Crop Climate Suitability According to Ecophysiological, Technical and Quality Criteria. Agric. For. Meteorol. 2015, 207, 94–106. [Google Scholar] [CrossRef]
- Chenu, K. Chapter 13—Characterizing the Crop Environment—Nature, Significance and Applications. In Crop Physiology (Second Edition); Sadras, V.O., Calderini, D.F., Eds.; Academic Press: San Diego, CA, USA, 2015; pp. 321–348. ISBN 978-0-12-417104-6. [Google Scholar]
- Chenu, K.; Porter, J.R.; Martre, P.; Basso, B.; Chapman, S.C.; Ewert, F.; Bindi, M.; Asseng, S. Contribution of Crop Models to Adaptation in Wheat. Trends Plant Sci. 2017, 22, 472–490. [Google Scholar] [CrossRef]
- Rincent, R.; Malosetti, M.; Ababaei, B.; Touzy, G.; Mini, A.; Bogard, M.; Martre, P.; Le Gouis, J.; van Eeuwijk, F. Using Crop Growth Model Stress Covariates and AMMI Decomposition to Better Predict Genotype-by-Environment Interactions. Theor. Appl. Genet. 2019, 132, 3399–3411. [Google Scholar] [CrossRef]
- Heslot, N.; Akdemir, D.; Sorrells, M.E.; Jannink, J.-L. Integrating Environmental Covariates and Crop Modeling into the Genomic Selection Framework to Predict Genotype by Environment Interactions. Theor. Appl. Genet. 2014, 127, 463–480. [Google Scholar] [CrossRef]
- Crossa, J.; Gauch, H.G., Jr.; Zobel, R.W. Additive Main Effects and Multiplicative Interaction Analysis of Two International Maize Cultivar Trials. Crop Sci. 1990, 30, 493–500. [Google Scholar] [CrossRef]
- Vargas, M.; Crossa, J.; Sayre, K.; Reynolds, M.; Ramírez, M.E.; Talbot, M. Interpreting Genotype × Environment Interaction in Wheat by Partial Least Squares Regression. Crop Sci. 1998, 38, 679. [Google Scholar] [CrossRef]
- Marraccini, E.; Gotor, A.A.; Scheurer, O.; Leclercq, C. An Innovative Land Suitability Method to Assess the Potential for the Introduction of a New Crop at a Regional Level. Agronomy 2020, 10, 330. [Google Scholar] [CrossRef]
- Ayerdi Gotor, A.; Marraccini, E. Innovative Pulses for Western European Temperate Regions: A Review. Agronomy 2022, 12, 170. [Google Scholar] [CrossRef]
- Sudarić, A. Soybean for Human Consumption and Animal Feed; IntechOpen: London, UK, 2020; ISBN 978-1-83881-018-4. [Google Scholar]
- Kremen, C.; Miles, A. Ecosystem Services in Biologically Diversified versus Conventional Farming Systems: Benefits, Externalities, and Trade-Offs. Ecol. Soc. 2012, 17, 40. [Google Scholar] [CrossRef]
- FAOSTAT Food and Agriculture Organization Corporate Statistical Database. Available online: https://www.fao.org/faostat/fr/#data (accessed on 25 April 2022).
- Myers, N.; Mittermeier, R.A.; Mittermeier, C.G.; da Fonseca, G.A.B.; Kent, J. Biodiversity Hotspots for Conservation Priorities. Nature 2000, 403, 853–858. [Google Scholar] [CrossRef] [PubMed]
- Jia, H.; Jiang, B.; Wu, C.; Lu, W.; Hou, W.; Sun, S.; Yan, H.; Han, T. Maturity Group Classification and Maturity Locus Genotyping of Early-Maturing Soybean Varieties from High-Latitude Cold Regions. PLoS ONE 2014, 9, e94139. [Google Scholar] [CrossRef] [PubMed]
- Grassini, P.; Cafaro La Menza, N.; Rattalino Edreira, J.I.; Monzón, J.P.; Tenorio, F.A.; Specht, J.E. Chapter 8—Soybean. In Crop Physiology Case Histories for Major Crops; Sadras, V.O., Calderini, D.F., Eds.; Academic Press: Cambridge, MA, USA, 2021; pp. 282–319. ISBN 978-0-12-819194-1. [Google Scholar]
- Musser, R.L.; Kramer, P.J.; Thomas, J.F. Periods of Shoot Chilling Sensitivity in Soybean Flower Development, and Compensation in Yield after Chilling. Ann. Bot. 1986, 57, 317–329. [Google Scholar] [CrossRef]
- Neuner, G.; Larcher, W. Determination of Differences in Chilling Susceptibility of Two Soybean Varieties by Means of in Vivo Chlorophyll Fluorescence Measurements. J. Agron. Crop Sci. 1990, 164, 73–80. [Google Scholar] [CrossRef]
- Gass, T.; Schori, A.; Fossati, A.; Soldati, A.; Stamp, P. Cold Tolerance of Soybean (Glycine Max (L.) Merr.) during the Reproductive Phase. Eur. J. Agron. 1996, 5, 71–88. [Google Scholar] [CrossRef]
- Ohnishi, S.; Miyoshi, T.; Shirai, S. Low Temperature Stress at Different Flower Developmental Stages Affects Pollen Development, Pollination, and Pod Set in Soybean. Environ. Exp. Bot. 2010, 69, 56–62. [Google Scholar] [CrossRef]
- Shaheen, T.; Rahman, M.; Shahid Riaz, M.; Zafar, Y.; Rahman, M. 8—Soybean Production and Drought Stress. In Abiotic and Biotic Stresses in Soybean Production; Miransari, M., Ed.; Academic Press: San Diego, CA, USA, 2016; pp. 177–196. ISBN 978-0-12-801536-0. [Google Scholar]
- Ergo, V.V.; Lascano, R.; Vega, C.R.C.; Parola, R.; Carrera, C.S. Heat and Water Stressed Field-Grown Soybean: A Multivariate Study on the Relationship between Physiological-Biochemical Traits and Yield. Environ. Exp. Bot. 2018, 148, 1–11. [Google Scholar] [CrossRef]
- Jumrani, K.; Bhatia, V.S. Impact of Combined Stress of High Temperature and Water Deficit on Growth and Seed Yield of Soybean. Physiol. Mol. Biol. Plants 2018, 24, 37–50. [Google Scholar] [CrossRef]
- Sinclair, T.R. Cessation of Leaf Emergence in Indeterminate Soybeans. Crop Sci. 1984, 24, 483–486. [Google Scholar] [CrossRef]
- Cera, J.C.; Streck, N.A.; Yang, H.; Zanon, A.J.; de Paula, G.M.; Lago, I. Extending the Evaluation of the SoySim Model to Soybean Cultivars with High Maturation Groups. Field Crops Res. 2017, 201, 162–174. [Google Scholar] [CrossRef]
- Doss, B.D.; Pearson, R.W.; Rogers, H.T. Effect of Soil Water Stress at Various Growth Stages on Soybean Yield1. Agron. J. 1974, 66, 297–299. [Google Scholar] [CrossRef]
- Monzon, J.P.; Cafaro La Menza, N.; Cerrudo, A.; Canepa, M.; Rattalino Edreira, J.I.; Specht, J.; Andrade, F.H.; Grassini, P. Critical Period for Seed Number Determination in Soybean as Determined by Crop Growth Rate, Duration, and Dry Matter Accumulation. Field Crops Res. 2021, 261, 108016. [Google Scholar] [CrossRef]
- Vogel, J.T.; Liu, W.; Olhoft, P.; Crafts-Brandner, S.J.; Pennycooke, J.C.; Christiansen, N. Soybean Yield Formation Physiology – A Foundation for Precision Breeding Based Improvement. Front. Plant Sci. 2021, 12, 2483. [Google Scholar] [CrossRef]
- Schoving, C.; Stöckle, C.O.; Colombet, C.; Champolivier, L.; Debaeke, P.; Maury, P. Combining Simple Phenotyping and Photothermal Algorithm for the Prediction of Soybean Phenology: Application to a Range of Common Cultivars Grown in Europe. Front. Plant Sci. 2020, 10, 1755. [Google Scholar] [CrossRef] [Green Version]
- Lamichhane, J.R.; Aubertot, J.-N.; Champolivier, L.; Debaeke, P.; Maury, P. Combining Experimental and Modeling Approaches to Understand Genotype × Sowing Date × Environment Interaction Effects on Emergence Rates and Grain Yield of Soybean. Front. Plant Sci. 2020, 11, 1358. [Google Scholar] [CrossRef]
- Karges, K.; Bellingrath-Kimura, S.D.; Watson, C.A.; Stoddard, F.L.; Halwani, M.; Reckling, M. Agro-Economic Prospects for Expanding Soybean Production beyond Its Current Northerly Limit in Europe. Eur. J. Agron. 2022, 133, 126415. [Google Scholar] [CrossRef]
- Boulch, G.; Elmerich, C.; Djemel, A.; Lange, B. Evaluation of Soybean (Glycine Max, L.) Adaptation to Northern European Regions under Different Agro-Climatic Scenarios. Silico Plants 2021, 3, 1–13. [Google Scholar] [CrossRef]
- Schoving, C.; Champolivier, L.; Maury, P.; Debaeke, P. Combining Multi-Environmental Trials and Crop Simulation to Understand Soybean Response to Early Sowings under Contrasting Water Conditions. Eur. J. Agron. 2022, 133, 126439. [Google Scholar] [CrossRef]
- Xavier, A.; Jarquin, D.; Howard, R.; Ramasubramanian, V.; Specht, J.E.; Graef, G.L.; Beavis, W.D.; Diers, B.W.; Song, Q.; Cregan, P.B.; et al. Genome-Wide Analysis of Grain Yield Stability and Environmental Interactions in a Multiparental Soybean Population. G3 GenesGenomesGenetics 2018, 8, 519–529. [Google Scholar] [CrossRef] [PubMed] [Green Version]
- Peel, M.C.; Finlayson, B.L.; McMahon, T.A. Updated World Map of the Köppen-Geiger Climate Classification. Hydrol. Earth Syst. Sci. 2007, 11, 1633–1644. [Google Scholar] [CrossRef] [Green Version]
- Panagos, P.; Van Liedekerke, M.; Jones, A.; Montanarella, L. European Soil Data Centre: Response to European Policy Support and Public Data Requirements. Land Use Policy 2012, 29, 329–338. [Google Scholar] [CrossRef]
- Boote, K.J.; Jones, J.W.; Hoogenboom, G.; Pickering, N.B. The CROPGRO Model for Grain Legumes. In Understanding Options for Agricultural Production; Systems Approaches for Sustainable Agricultural Development; Tsuji, G.Y., Hoogenboom, G., Thornton, P.K., Eds.; Springer: Dordrecht, The Netherlands, 1998; Volume 7, pp. 99–128. ISBN 978-90-481-4940-7. [Google Scholar]
- Jones, J.W.; Hoogenboom, G.; Porter, C.H.; Boote, K.J.; Batchelor, W.D.; Hunt, L.A.; Wilkens, P.W.; Singh, U.; Gijsman, A.J.; Ritchie, J.T. The DSSAT Cropping System Model. Eur. J. Agron. 2003, 18, 235–265. [Google Scholar] [CrossRef]
- Hoogenboom, G.; Porter, C.H.; Boote, K.J.; Shelia, V.; Wilkens, P.W.; Singh, U.; White, J.W.; Asseng, S.; Lizaso, J.I.; Moreno, L.P.; et al. The DSSAT Crop Modeling Ecosystem. In Advances in Crop Modeling for a Sustainable Agriculture; Burleigh Dodds Science Publishing: Cambridge, UK, 2019; pp. 173–216. ISBN 978-1-78676-240-5. [Google Scholar]
- Kurasch, A.K.; Hahn, V.; Leiser, W.L.; Vollmann, J.; Schori, A.; Bétrix, C.-A.; Mayr, B.; Winkler, J.; Mechtler, K.; Aper, J.; et al. Identification of Mega-Environments in Europe and Effect of Allelic Variation at Maturity E Loci on Adaptation of European Soybean: Soybean Adaptation to Europe. Plant Cell Environ. 2017, 40, 765–778. [Google Scholar] [CrossRef]
- Boote, K.J.; Jones, J.W.; Batchelor, W.D.; Nafziger, E.D.; Myers, O. Genetic Coefficients in the CROPGRO–Soybean Model. Agron. J. 2003, 95, 32–51. [Google Scholar] [CrossRef]
- Jones, J.W.; Boote, K.J.; Jagtap, S.S.; Mishoe, J.W. Soybean Development. In Modeling Plant and Soil Systems; John Wiley & Sons, Ltd.: Hoboken, NJ, USA, 1991; pp. 71–90. ISBN 978-0-89118-223-8. [Google Scholar]
- Ritchie, J. Soil Water Balance and Plant Water Stress. In Understanding Options for Agricultural Production; Springer: Dordrecht, The Netherlands, 1998; Volume 7, pp. 41–54. ISBN 978-90-481-4940-7. [Google Scholar]
- Crossa, J.; Vargas, M.; Joshi, A.K. Linear, Bilinear, and Linear-Bilinear Fixed and Mixed Models for Analyzing Genotype × Environment Interaction in Plant Breeding and Agronomy. Can. J. Plant Sci. 2010, 90, 561–574. [Google Scholar] [CrossRef] [Green Version]
- Mehmood, T.; Liland, K.H.; Snipen, L.; Sæbø, S. A Review of Variable Selection Methods in Partial Least Squares Regression. Chemom. Intell. Lab. Syst. 2012, 118, 62–69. [Google Scholar] [CrossRef]
- Cocchi, M.; Biancolillo, A.; Marini, F. Chapter Ten—Chemometric Methods for Classification and Feature Selection. In Comprehensive Analytical Chemistry; Data Analysis for Omic Sciences: Methods and Applications; Jaumot, J., Bedia, C., Tauler, R., Eds.; Elsevier: Amsterdam, The Netherlands, 2018; Volume 82, pp. 265–299. [Google Scholar]
- Kvalheim, O.M.; Arneberg, R.; Grung, B.; Rajalahti, T. Determination of Optimum Number of Components in Partial Least Squares Regression from Distributions of the Root-Mean-Squared Error Obtained by Monte Carlo Resampling. J. Chemom. 2018, 32, e2993. [Google Scholar] [CrossRef]
- Board, J.E.; Tan, Q. Assimilatory Capacity Effects on Soybean Yield Components and Pod Number. Crop Sci. 1995, 35, 846–851. [Google Scholar] [CrossRef]
- Chaves, M.M. Effects of Water Deficits on Carbon Assimilation. J. Exp. Bot. 1991, 42, 1–16. [Google Scholar] [CrossRef]
- Garrity, D.P.; Watts, D.G.; Sullivan, C.Y.; Gilley, J.R. Moisture Deficits and Grain Sorghum Performance: Evapotranspiration - Yield Relationships. Agron. J. 1982, 74, 815–820. [Google Scholar] [CrossRef]
- Monteith, J.L. Solar Radiation and Productivity in Tropical Ecosystems. J. Appl. Ecol. 1972, 9, 747–766. [Google Scholar] [CrossRef] [Green Version]
- Daynard, T.B.; Tanner, J.W.; Duncan, W.G. Duration of the Grain Filling Period and Its Relation to Grain Yield in Corn, Zea Mays, L.1. Crop Sci. 1971, 11, 45–48. [Google Scholar] [CrossRef]
- Gonzalez-Barrios, P.; Castro, M.; Pérez, O.; Vilaró, D.; Gutiérrez, L. Genotype by Environment Interaction in Sunflower (Helianthus Annus, L.) to Optimize Trial Network Efficiency. Span. J. Agric. Res. 2018, 15, e0705. [Google Scholar] [CrossRef] [Green Version]
- Corlouer, E.; Gauffreteau, A.; Bouchet, A.-S.; Bissuel-Bélaygue, C.; Nesi, N.; Laperche, A. Envirotypes Based on Seed Yield Limiting Factors Allow to Tackle G × E Interactions. Agronomy 2019, 9, 798. [Google Scholar] [CrossRef] [Green Version]
- Kurosaki, H.; Yumoto, S.; Matsukawa, I. Pod Setting Pattern during and after Low Temperature and the Mechanism of Cold-Weather Tolerance at the Flowering Stage in Soybeans. Plant Prod. Sci. 2003, 6, 247–254. [Google Scholar] [CrossRef]
- Kurosaki, H.; Yumoto, S. Effects of Low Temperature and Shading during Flowering on the Yield Components in Soybeans. Plant Prod. Sci. 2003, 6, 17–23. [Google Scholar] [CrossRef]
- Sobko, O.; Stahl, A.; Hahn, V.; Zikeli, S.; Claupein, W.; Gruber, S. Environmental Effects on Soybean (Glycine Max (L.) Merr) Production in Central and South Germany. Agronomy 2020, 10, 1847. [Google Scholar] [CrossRef]
- Müller, M.; Rakocevic, M.; Caverzan, A.; Chavarria, G. Grain Yield Differences of Soybean Cultivars Due to Solar Radiation Interception. Am. J. Plant Sci. 2017, 8, 2795–2810. [Google Scholar] [CrossRef]
- Zinn, K.E.; Tunc-Ozdemir, M.; Harper, J.F. Temperature Stress and Plant Sexual Reproduction: Uncovering the Weakest Links. J. Exp. Bot. 2010, 61, 1959–1968. [Google Scholar] [CrossRef] [PubMed] [Green Version]
- Hatfield, J.L.; Boote, K.J.; Kimball, B.A.; Ziska, L.H.; Izaurralde, R.C.; Ort, D.; Thomson, A.M.; Wolfe, D. Climate Impacts on Agriculture: Implications for Crop Production. Agron. J. 2011, 103, 351–370. [Google Scholar] [CrossRef] [Green Version]
- Gibson, L.R.; Mullen, R.E. Influence of Day and Night Temperature on Soybean Seed Yield. Crop Sci. 1996, 36, 98–104. [Google Scholar] [CrossRef]
- Löffler, C.M.; Wei, J.; Fast, T.; Gogerty, J.; Langton, S.; Bergman, M.; Merrill, B.; Cooper, M. Classification of Maize Environments Using Crop Simulation and Geographic Information Systems. Crop Sci. 2005, 45, 1708–1716. [Google Scholar] [CrossRef]


| Abbreviation | Definition | Abbreviation | Definition |
|---|---|---|---|
| CGM | Crop Growth Model | MET | Multi-Environment Trial |
| cv. | Cultivar name | MG | Maturity Group |
| DSSAT | Decision Support System for Agrotechnology Transfer | PLS | Partial Least Square regression |
| EF | Eco-climatic Factor | PY-MG00 | PLS meta-analysis using pairs of years for MG00 |
| EMFI | Emergence to Flower Induction | PY-MG000 | PLS meta-analysis using pairs of years for MG000 |
| EPPM | End of Pod to Physiological Maturity | RMSE | Root Mean Square Error |
| FFFP | First Flower to First Pod | SEM | Sowing to Emergence |
| FIFF | Flower Induction to First Flower | SY-MG00 | PLS meta-analysis using single years for MG00 |
| FPFS | First Pod to First Seed | SY-MG000 | PLS meta-analysis using single years for MG000 |
| FSEP | First Seed to End of Pod | VIP | Variable Importance in Projection |
| GEI | Genotype by Environment Interactions |
| EF | Description | VIP | β-Coeff | Std. Err. | t-Value | p-Value |
|---|---|---|---|---|---|---|
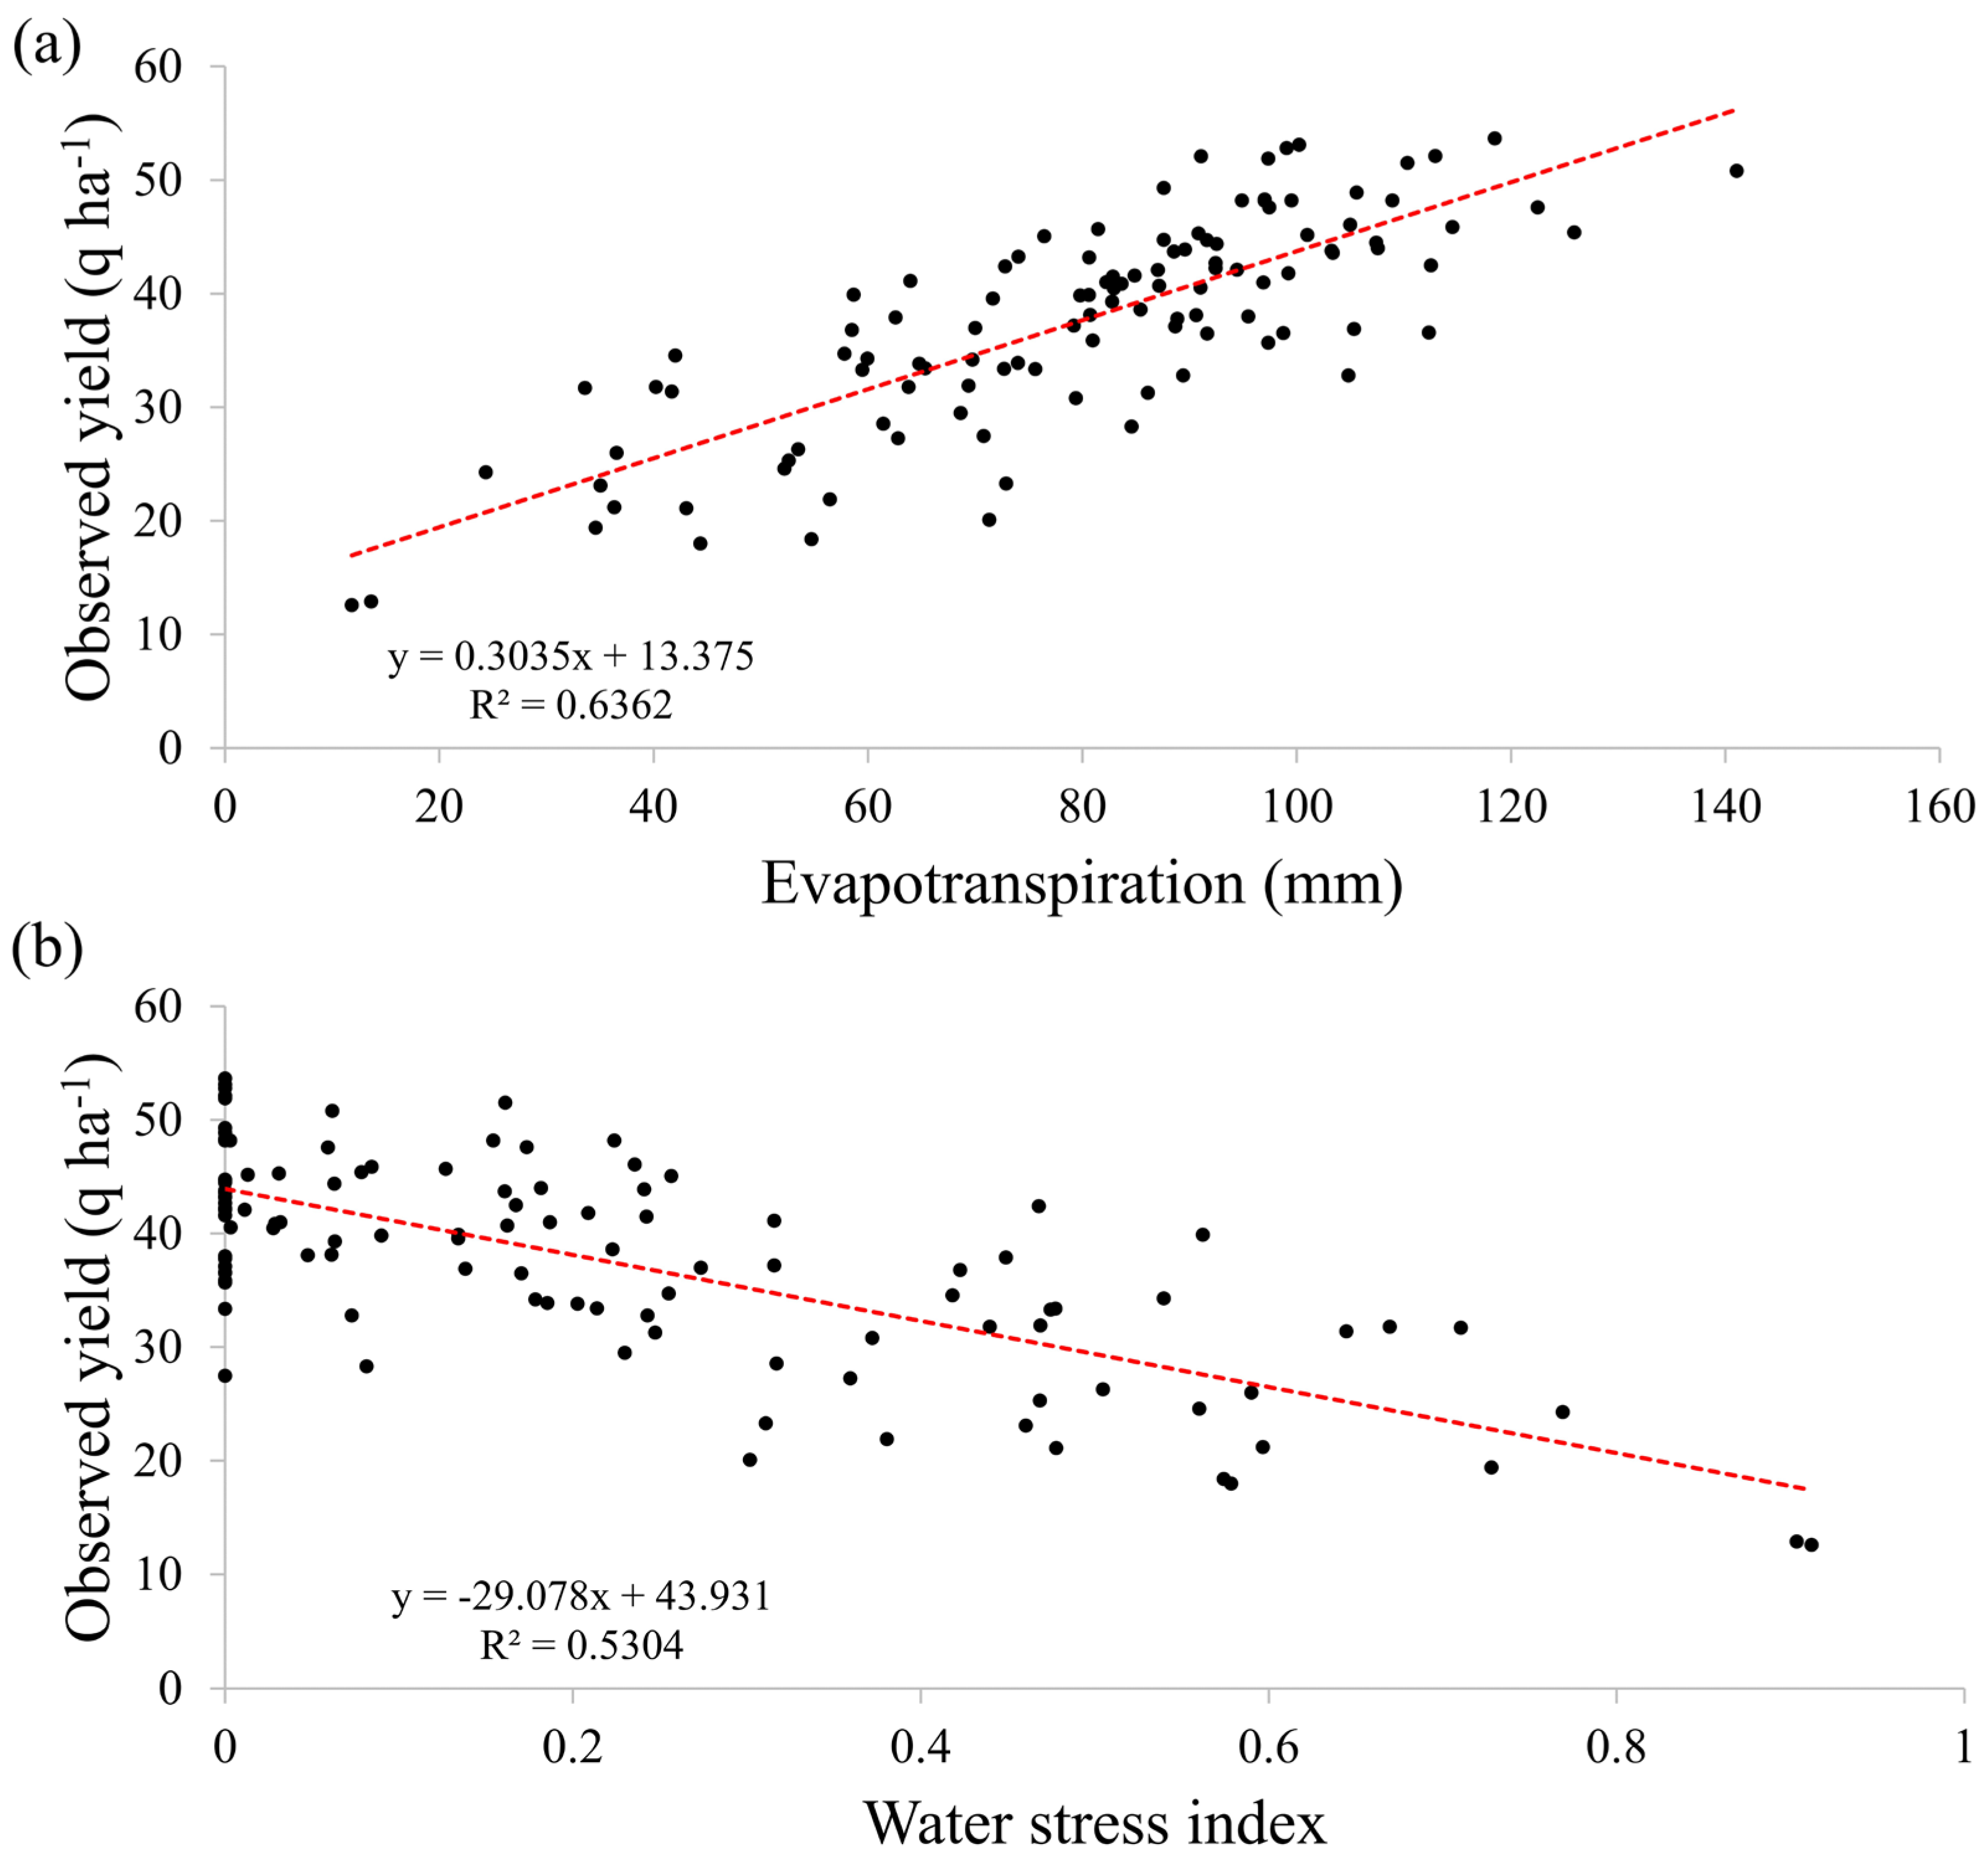
| ETsumEPPM | Sum of evapotranspiration from End Pod to Physiological Maturity (mm) | 2.86 | 0.14 | 0.02 | 7.26 | 0 |
| WSMNEPPM | Average water stress index from End Pod to Physiological Maturity | 2.82 | −0.15 | 0.02 | −7.08 | 0 |
| DurationEPPM | Duration of the period from End Pod to Physiological Maturity (days) | 2.54 | 0.13 | 0.02 | 7.30 | 0 |
| SRADsumEPPM | Sum of solar radiation from End Pod to Physiological Maturity (MJ/m2) | 2.25 | 0.10 | 0.02 | 6.18 | 0 |
| WSMNFSEP | Average water stress index from First Seed to End Pod | 2.16 | −0.08 | 0.03 | −3.08 | 0 |
| ETsumFSEP | Sum of evapotranspiration from First Seed to End Pod (mm) | 2.08 | 0.05 | 0.02 | 2.91 | 0 |
| WSMNFPFS | Average water stress index from First Pod to First Seed | 2.02 | −0.08 | 0.02 | −4.00 | 0 |
| NSMNFPFS | Average nitrogen stress index from First Pod to First Seed | 1.91 | −0.10 | 0.04 | −2.59 | 0.01 |
| DurationFSEP | Duration of the period from First Seed to End Pod (days) | 1.91 | 0.05 | 0.02 | 2.46 | 0.02 |
Disclaimer/Publisher’s Note: The statements, opinions and data contained in all publications are solely those of the individual author(s) and contributor(s) and not of MDPI and/or the editor(s). MDPI and/or the editor(s) disclaim responsibility for any injury to people or property resulting from any ideas, methods, instructions or products referred to in the content. |
© 2023 by the authors. Licensee MDPI, Basel, Switzerland. This article is an open access article distributed under the terms and conditions of the Creative Commons Attribution (CC BY) license (https://creativecommons.org/licenses/by/4.0/).
Share and Cite
Elmerich, C.; Boulch, G.; Faucon, M.-P.; Lakhal, L.; Lange, B. Identification of Eco-Climatic Factors Driving Yields and Genotype by Environment Interactions for Yield in Early Maturity Soybean Using Crop Simulation. Agronomy 2023, 13, 322. https://doi.org/10.3390/agronomy13020322
Elmerich C, Boulch G, Faucon M-P, Lakhal L, Lange B. Identification of Eco-Climatic Factors Driving Yields and Genotype by Environment Interactions for Yield in Early Maturity Soybean Using Crop Simulation. Agronomy. 2023; 13(2):322. https://doi.org/10.3390/agronomy13020322
Chicago/Turabian StyleElmerich, Chloé, Guénolé Boulch, Michel-Pierre Faucon, Lyes Lakhal, and Bastien Lange. 2023. "Identification of Eco-Climatic Factors Driving Yields and Genotype by Environment Interactions for Yield in Early Maturity Soybean Using Crop Simulation" Agronomy 13, no. 2: 322. https://doi.org/10.3390/agronomy13020322