
Risk Assessment and Limiting Soil Factors for Vine Production—Cu and Zn Contents in Vineyard Soils in Galicia (Rías Baixas D.O.)

 and
and
Abstract
:1. Introduction
2. Materials and Methods
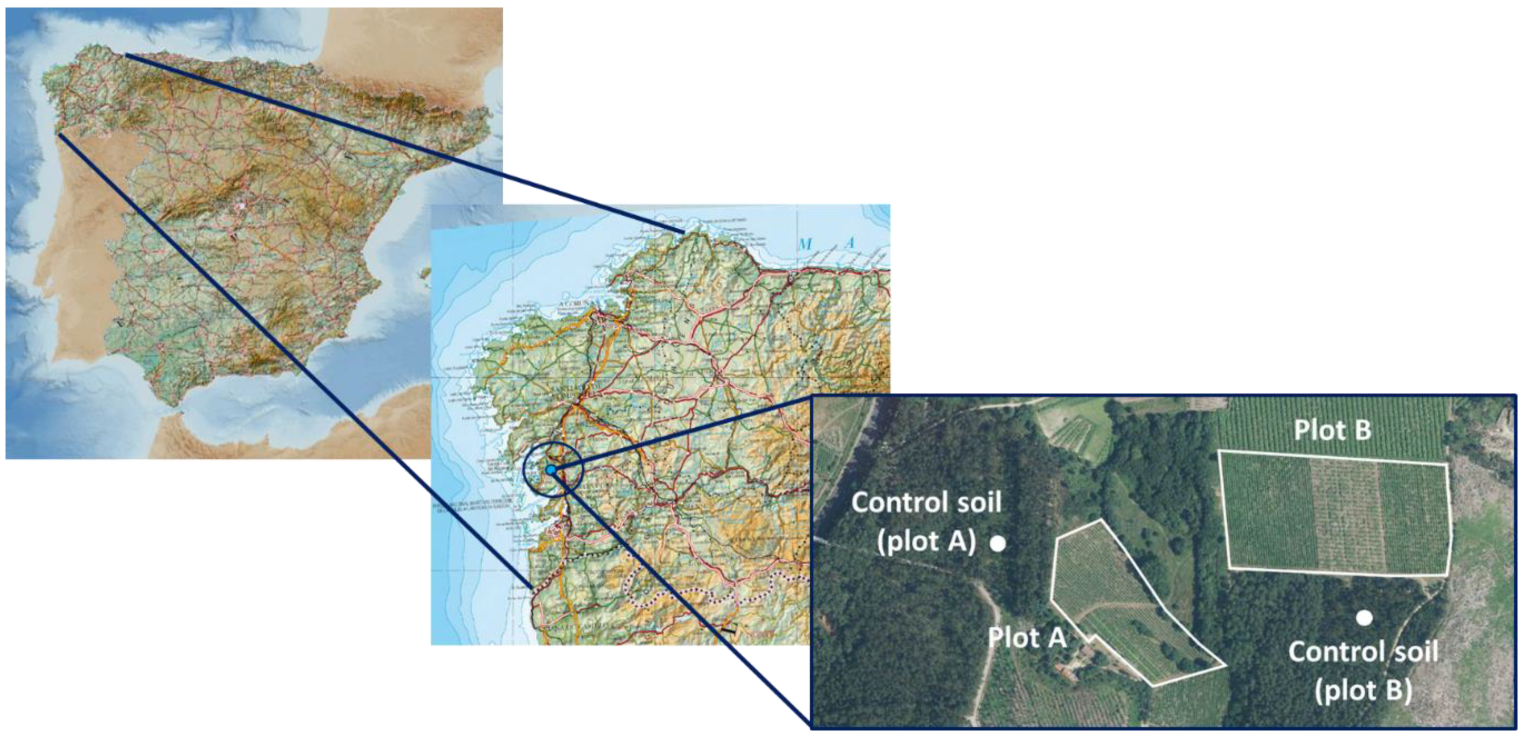
2.1. Study Area
2.2. Soil Sample Collection
2.3. Vineyard Maintenance
2.4. Soil Analysis
2.5. Limiting Factors for Vine Development
2.5.1. Physical Factors
- Texture of the arable layer. Textural classes S, L, C, and O are established (and R when there is a lithic contact below the arable layer). Their ranges are S—Sandy (sandy and sandy loams); L—Loamy <35% clay (excluding sandy and sandy loams); C—Clay >35% clay; O—Organic >30% organic matter up to 50 cm or more.
- Stoniness. Two stoniness intervals are defined: medium stoniness (15–35%) and stony (>35%) for a fraction greater than 2 mm.
- “A” factor. This indicator evaluates the presence of rocky outcrops. Soils with exposed rocks between 10% and 90% are considered limiting for cultivation.
- “E” factor. This indicator evaluates the risk of erosion based on the slope of the land and other parameters such as the erosive potential of rainfall, soil erosivity, conservation practices, and vegetation cover. The slope is classified into areas of strong (>25%), medium (6% and 25%), and low (<6%).
- “M” factor. This indicator evaluates the impediments to mechanization due to trafficability and ease of tillage. It is classified into four levels of limitation using the slope as the basic criterion: steep (>15%), medium (7–15%), slight (3–7%), and none (<3%).
2.5.2. Chemical Factors
- Acidity factor. This indicator evaluates the pH ranges of soils, which are established for vineyard soils according to strongly acidic (3.5 and 4.5), acidic (4.5 and 5.5), weakly acidic (5.5 and 6.5), neutral (6.5–7.5), and basic (>7.5). Likewise, this indicator also allows for assessing the percentage of Al saturation in the exchange complex. Its presence is considered moderate between 10 and 20%, strong between 20 and 60%, and very strong higher than 60% (alic character).
- “a” factor. This indicator evaluates the alic character and is applied in soils with high Al concentrations when its saturation percentage in the exchange complex is higher than 60%.
- “om” factor. This is used to evaluate the organic matter content. It is considered deficit contents < 2% (om1) and excess contents >5% (om2).
- “N” factor. This indicator evaluates the nitrogen content. It is applied to soil whose total N content is <0.1% (low) or >0.3% (high).
- “P” factor. This indicator evaluates the phosphorus content and delimits excessive values for viticulture crops if they imply unnecessary inputs: low < 18 mg kg−1, medium 18–36 mg kg−1, high 36–72 mg kg−1, very high > 72 mg kg−1.
- “e” factor. This indicator evaluates the low cation exchange capacity. There is a strong limitation when ECEC is < 4 cmol(+) kg−1 and moderate if it is between 4 and 7 cmol(+) kg−1.
- “Ca” factor. This indicator evaluates Ca deficiency. It is considered deficient when the value of the exchange complex is <1.5 cmol(+) kg−1 or the Ca/Mg ratio < 0.5.
- “n” factor. This indicator evaluates the presence of high Na contents in the exchange complex. It is considered positive when Na saturation in the exchange complex is ≥15%.
- “k1” factor. This indicator evaluates the low reserve of K (< 0.2 cmol(+) kg−1).
- “k2” factor. This indicator evaluates the unbalance in the exchange complex between K and the rest of the cations (<2% to the sum of the exchange bases when <10 cmol(+) kg−1).
- “Mg” factor. This indicator evaluates Mg deficiency. It is applied in soils with insufficient assimilable Mg content. This deficit may be due to a low content (<0.4 cmol(+) kg−1) or a Ca/Mg imbalance (>10 imbalance) or a K/Mg imbalance (>0.5).
- “Cu” factor. This indicator evaluates the Cu content. Available Cu values <1 mg kg−1 (Cu1) are considered deficient. Available contents higher than 25 mg kg−1 (Cu2) in sandy soils can be toxic for vines, mainly in soils with acidic pH. Generally, total contents above 100 mg kg−1 (Cu3) are considered phytotoxic [5].
- “Zn” factor. This indicator evaluates the Zn content. Available Zn contents <3.3 mg kg−1 (Zn1) are considered deficient for viticulture crops, and >15 mg kg−1 (Zn2) are phytotoxic. In general, upper toxic levels for total contents of Zn are considered 500 mg kg−1 (Zn3) [5].
2.6. Determination of Vine Nutritional State
Leaves Analysis
2.7. Statistical Analysis
3. Results
3.1. Analysis of the Limiting Factors for Vine Development Physical Properties of Soilsubsection
- Texture of the arable layer. The vineyard soils of both plots have a texture class of sandy loam with less than 30% of organic matter, which is classified as S (Sandy), while soil controls are classified as L (Loamy).
- Stoniness and “A” factor. In general, the vineyard soils of both plots are classified as stony (>35%) except for soil B5 (24.4%), which is medium stoniness (15–35%), and soil B4 (14.5%), which is not limited by the presence of stoniness (<15%). On the other hand, no rocky outcrops were found in the vineyard soils studied, so the soils did not present a limitation associated with factor “A” for the cultivation of grapevines.
- “E” factor and “M” factor. According to the slope, plot B has a slope of ≈7%, while the slope in plot A is <1%. Thus, the risk of soil erosion in both plots is considered low. Regarding the impediments associated with mechanization, trafficability, and easy tillage, the vineyard soils from plot B are regarded as “medium/slight limitation” for these management practices. In contrast, the vineyard soils from plot A are considered “with no limitation.”
3.2. Analysis of the Limiting Factors for Vine Development: Chemical Properties of Soils
- Acidity factor. The analysis of the pH of the vineyard soils during the nine samplings carried out shows that the soils of plot A and plot B have an average neutral pH (6.5–7.5), except for the pH of soils measured during the first sampling in the plot A and plot B, which are mostly weakly acidic (5.5–6.5). This is related to the fact that the first sampling of the study was done before adding compost (Supplementary Materials Table S1), whose pH of 8.1 favors the increase of soil pH. This indicates that the addition of compost was a sufficient measure to increase the pH of the soils and maintain correct pH values for the development of the vines. The percentage of Al saturation in the exchange complex in the soils of plot A and plot B is mostly < 1%, which explains why the potential pH (KCl) of the vineyard soils is not drastically much lower than the actual pH (H2O). On the other hand, the control soils have percentages of Al in the exchange complex that are considered strong (20–60%) and very strong (>60), with values of 46% (plot A control) and 65% (plot B control). The control soil for plot B shows an alkali character (“a” factor).
- “om” factor. The percentages of organic matter in the vineyard soils determined during the first sampling are much lower than those found in the rest of the samples. This is due to the application of compost with an organic matter content of 34.9% (first application and 33.9% (second application)). On the other hand, the percentage of organic matter in the vineyard soils is also lower than in the control soils (forest soils), which indicates the loss of organic matter when the land use was changed from forest to vineyard. This confirms the need to apply external inputs (in this case, compost) to maintain the organic matter content in the vineyard soils. In general, the contents of organic material in plot A and plot B in the first sampling are within the soils considered to have normal levels of organic material (2–5%). Despite this, some of the soils of plot A have deficit contents (<2% - om1). However, from the second sampling onwards, the average percentages of organic matter increased and contained excess contents (>5% - om2).
- “N” factor. The total N content in the soils from both plots during the first sampling have low total N contents (<0.1%). After compost application (total N; 1st treatment: 25.2 g kg−1 and 2nd treatment: 27.2 g kg−1), the total N contents in the soils from plot A were normal. The only total N contents that exceeded 0.3% (considered high) were during the second and fifth samplings (March of the first and second year), just after compost application. In plot B, the total N contents are considered normal but may be regarded as high just after compost application. The control soils present excess N with total contents higher than 0.3%, and the plot A control is excessively high (>1%).
- “P” factor. The average P contents in vineyard soils ranged from high (36–72 mg kg−1) to very high (high > 72 mg kg−1) during the whole period studied. In any case, some of the vineyard soils have medium P contents (18–36 mg kg−1). Therefore, there is no P deficit in any of the vineyard soils over the three years of the study. In contrast, the control soils have low phosphorus contents (<18 mg kg−1), which indicates that the nearby forest soils are deficient in P and that any transformation of these lands for use as vineyards will require inputs of this macronutrient.
- “e” factor. The mean values of eCEC in the vineyard soils are all greater than 7 cmol(+) kg−1, so none of the soils show limitations associated with eCEC. It should be noted that before applying the compost, the eCEC for some vineyard soils from plot B showed a moderate limitation according to this factor, with eCEC between 4 and 7 cmol(+) kg−1.
- “Ca” factor, “n” factor, “k1” factor, “k2” factor, and “Mg” factor. The factors associated with the basic cations of the exchange complex indicate that none of the vineyard soils presented Ca2+ deficiencies during the three years in which the sampling was carried out. On the other hand, the control soil of plot A showed an exchangeable Ca deficiency, with lower Ca2+ values lower than 1.5 cmol(+) kg−1. Regarding the Na+ content in the exchange complex, none of the vineyard soils or the controls had excess Na+ (≥15%) in the exchange complex. Vineyard soils also do not have low K reserves (<0.2 cmol(+) kg−1) nor an imbalance of the exchange complex (neither k1 nor k2). An imbalance between Ca and Mg content (ratio >10) was observed in some vineyard soils, mainly after compost application before the second and third sampling, with average ratio values of 13.2 and 13.7, respectively. Subsequently, a progressive decrease in this ratio was observed until values below 10. In addition, several soils in both plots show an imbalance between Mg and K (ratio > 0.5). The control soil of plot A also has an Mg unbalance, while the ratio of the control soil of plot B is within the limit established for Mg content to be considered unbalanced.
3.3. Analysis of the Limiting Factors for Vine Development: Cu and Zn Contents in Soils
- “Cu” factor. None of the vineyard soils analyzed had available Cu deficits (>1 mg kg−1; they are not classified as Cu1). All vineyard soils have high available Cu contents, which increased over the 3 years of study. Similar results are found for the total Cu contents, whose highest contents were determined in the third year of sampling. These values are in line with the intensive treatments with fungicides and other phytosanitary compounds to which the vines were subjected during the period studied (Supplementary Materials Table S2). According to the parameters established by the Cu factor, all vineyard soils in plot A in the third year of sampling exceeded 25 mg kg−1 of available Cu (classified as Cu2), which is established as phytotoxic for vineyard soils. Likewise, the average available Cu contents in the soils of plot B exceeded 25 mg kg−1 since the first sampling was carried out, so the toxicity problems for the vines began before the first sampling. Likewise, total Cu contents in all vineyard soils are above the limit of 100 mg kg−1 (classified as Cu3), which is established as phytotoxic [5]. In contrast, none of the control soils exceeded the limits set to be considered as having toxicity problems; this confirms that the origin of the high levels of Cu in the vineyard soils is related mainly to the phytosanitary treatments carried out in the vineyards. In addition, an increase in total and available Cu content was observed in control soils after the third sampling, which may be related to the transfer and mobilization of Cu to areas adjacent to the vineyard.
- “Zn” factor. Available Zn contents in vineyard soils increased during the 3 years of study. During the first two years, Zn contents in the soils were deficient (classified as Zn1 < 3.3 mg kg−1). On the other hand, in the third year, the available Zn contents were higher than 15 mg kg−1, thus exceeding the limit established to consider the concentrations as phytotoxic (classified as Zn2). In general, total Zn contents also increased during the 3 years in the vineyard soils, but the values are below the phytotoxic value [5]. The increase of Zn content in the soils is mainly associated with the phytosanitary treatments carried out in the vineyards. In contrast, the control soils were deficient in Zn during the entire study period. An increase in total and available Zn content was observed over time in control soils, which may be linked to Zn transfer and mobilization from the vineyard soils to adjacent areas.
3.4. Analysis of the Nutritional Status of Vine Leaves
4. Discussion
5. Conclusions
Supplementary Materials
Author Contributions
Funding
Institutional Review Board Statement
Informed Consent Statement
Data Availability Statement
Acknowledgments
Conflicts of Interest
References
- Rías Baixas, D.O. Denominación de Origen Rías Baixas. Available online: https://doriasbaixas.com/en (accessed on 1 December 2022).
- Xunta de Galicia Autorizaciones Para Plantaciones de Viñedo. 2016–2045. Available online: https://mediorural.xunta.gal/es/temas/explotaciones/vinedo/autorizaciones-para-plantaciones-de-vina (accessed on 1 December 2022). (In Spanish).
- Korchagin, J.; Moterle, D.F.; Escosteguy, P.A.V.; Bortoluzzi, E.C. Distribution of Copper and Zinc Fractions in a Regosol Profile under Centenary Vineyard. Environ. Earth Sci. 2020, 79, 439. [Google Scholar] [CrossRef]
- Pham, N.T.H.; Babcsányi, I.; Balling, P.; Farsang, A. Accumulation Patterns and Health Risk Assessment of Potentially Toxic Elements in the Topsoil of Two Sloping Vineyards (Tokaj-Hegyalja, Hungary). J. Soils Sediments 2022, 22, 2671–2689. [Google Scholar] [CrossRef]
- Kabata-Pendias, A. Trace Elements in Soils and Plants, 4th ed.; Taylor and Francis: Abingdon, UK, 2010; ISBN 9781420093704. [Google Scholar]
- Macías, F.; Calvo de Anta, R. Niveles Genéricos de Referencia de Metales Pesados y Otros Elementos Traza En Los Suelos de Galicia; Xunta de Galicia: A Coruña, Spain, 2009. [Google Scholar]
- Shabbir, Z.; Sardar, A.; Shabbir, A.; Abbas, G.; Shamshad, S.; Khalid, S.; Natasha; Murtaza, G.; Dumat, C.; Shahid, M. Copper Uptake, Essentiality, Toxicity, Detoxification and Risk Assessment in Soil-Plant Environment. Chemosphere 2020, 259, 127436. [Google Scholar] [CrossRef]
- Kumar, V.; Pandita, S.; Singh Sidhu, G.P.; Sharma, A.; Khanna, K.; Kaur, P.; Bali, A.S.; Setia, R. Copper Bioavailability, Uptake, Toxicity and Tolerance in Plants: A Comprehensive Review. Chemosphere 2021, 262, 127810. [Google Scholar] [CrossRef]
- Cambrollé, J.; Mancilla-Leytón, J.M.; Muñoz-Vallés, S.; Luque, T.; Figueroa, M.E. Zinc Tolerance and Accumulation in the Salt-Marsh Shrub Halimione Portulacoides. Chemosphere 2012, 86, 867–874. [Google Scholar] [CrossRef] [PubMed]
- Arenas-Lago, D.; Carvalho, L.C.; Santos, E.S.; Abreu, M.M. The Physiological Mechanisms Underlying the Ability of Cistus Monspeliensis L. from São Domingos Mine to Withstand High Zn Concentrations in Soils. Ecotoxicol. Environ. Saf. 2016, 129, 219–227. [Google Scholar] [CrossRef]
- Kaur, H.; Garg, N. Zinc Toxicity in Plants: A Review. Planta 2021, 253, 129. [Google Scholar] [CrossRef]
- Poschenrieder, C.; Bech, J.; Llugany, M.; Pace, A.; Fenés, E.; Barceló, J. Copper in Plant Species in a Copper Gradient in Catalonia (North East Spain) and Their Potential for Phytoremediation. Plant Soil 2001, 230, 247–256. [Google Scholar] [CrossRef]
- Michaud, A.M.; Bravin, M.N.; Galleguillos, M.; Hinsinger, P. Copper Uptake and Phytotoxicity as Assessed in Situ for Durum Wheat (Triticum Turgidum Durum L.) Cultivated in Cu-Contaminated, Former Vineyard Soils. Plant Soil 2007, 298, 99–111. [Google Scholar] [CrossRef]
- MacKie, K.A.; Müller, T.; Kandeler, E. Remediation of Copper in Vineyards—A Mini Review. Environ. Pollut. 2012, 167, 16–26. [Google Scholar] [CrossRef]
- Ambrosini, V.G.; Rosa, D.J.; Corredor Prado, J.P.; Borghezan, M.; Bastos de Melo, G.W.; Fonsêca de Sousa Soares, C.R.; Comin, J.J.; Simão, D.G.; Brunetto, G. Reduction of Copper Phytotoxicity by Liming: A Study of the Root Anatomy of Young Vines (Vitis Labrusca L.). Plant Physiol. Biochem. 2015, 96, 270–280. [Google Scholar] [CrossRef] [PubMed] [Green Version]
- Brunetto, G.; Rosa, D.J.; Ambrosini, V.G.; Heinzen, J.; Ferreira, P.A.A.; Ceretta, C.A.; Soares, C.R.F.S.; Melo, G.W.B.; Soriani, H.H.; Nicoloso, F.T.; et al. Use of Phosphorus Fertilization and Mycorrhization as Strategies for Reducing Copper Toxicity in Young Grapevines. Sci. Hortic. 2019, 248, 176–183. [Google Scholar] [CrossRef]
- Rosa, D.J.; Ambrosini, V.G.; Kokkoris, V.; Brunetto, G.; Hart, M.; Ricachenevsky, F.; Pescador, R. Lime Protection for Young Vines Exposed to Copper Toxicity. Water Air Soil Pollut. 2020, 231, 296. [Google Scholar] [CrossRef]
- Cesco, S.; Pii, Y.; Borruso, L.; Orzes, G.; Lugli, P.; Mazzetto, F.; Genova, G.; Signorini, M.; Brunetto, G.; Terzano, R.; et al. A Smart and Sustainable Future for Viticulture Is Rooted in Soil: How to Face Cu Toxicity. Appl. Sci. 2021, 11, 907. [Google Scholar] [CrossRef]
- Undabeytia, T.; Morillo, E.; Ramos, A.B.; Maqueda, C. Mutual Influence of Cu and a Cationic Herbicide on Their Adsorption-Desorption Processes on Two Selected Soils. Water Air Soil Pollut. 2002, 137, 81–94. [Google Scholar] [CrossRef]
- Pateiro-Moure, M.; Pérez-Novo, C.; Arias-Estévez, M.; López-Periago, E.; Martínez-Carballo, E.; Simal-Gándara, J. Influence of Copper on the Adsorption and Desorption of Paraquat, Diquat, and Difenzoquat in Vineyard Acid Soils. J. Agric. Food Chem. 2007, 55, 6219–6226. [Google Scholar] [CrossRef]
- Huguenot, D.; Bois, P.; Jézéquel, K.; Cornu, J.Y.; Lebeau, T. Selection of Low Cost Materials for the Sorption of Copper and Herbicides as Single or Mixed Compounds in Increasing Complexity Matrices. J. Hazard. Mater. 2010, 182, 18–26. [Google Scholar] [CrossRef] [PubMed]
- Liu, J.; Li, P.; Hei, X. Notice of Retraction: Mobility of Cypermethrin in Soil as Affected by Copper. In Proceedings of the 2011 5th International Conference on Bioinformatics and Biomedical Engineering, Wuhan, China, 10–12 May 2011. [Google Scholar] [CrossRef]
- Filipe, O.M.S.; Santos, S.A.O.; Domingues, M.R.M.; Vidal, M.M.; Silvestre, A.J.D.; Santos, E.B.H. Effect of Copper Ions on the Degradation of Thiram in Aqueous Solution: Identification of Degradation Products by HPLC-MS/MS. J. Hazard. Mater. 2014, 279, 125–132. [Google Scholar] [CrossRef] [PubMed]
- Blanco-Ward, D.; García Queijeiro, J.M.; Jones, G.V. Spatial Climate Variability and Viticulture in the Miño River Valley of Spain. Vitis -Geilweilerhof 2007, 46, 63. [Google Scholar]
- Fernández-Calviño, D.; Nóvoa-Muñoz, J.C.; Díaz-Raviña, M.; Arias-Estévez, M. Copper Accumulation and Fractionation in Vineyard Soils from Temperate Humid Zone (NW Iberian Peninsula). Geoderma 2009, 153, 119–129. [Google Scholar] [CrossRef]
- Duplay, J.; Semhi, K.; Errais, E.; Imfeld, G.; Babcsanyi, I.; Perrone, T. Copper, Zinc, Lead and Cadmium Bioavailability and Retention in Vineyard Soils (Rouffach, France): The Impact of Cultural Practices. Geoderma 2014, 230–231, 318–328. [Google Scholar] [CrossRef]
- Gómez-Armesto, A.; Carballeira-Díaz, J.; Pérez-Rodríguez, P.; Fernández-Calviño, D.; Arias-Estévez, M.; Nóvoa-Muñoz, J.C.; Álvarez-Rodríguez, E.; Fernández-Sanjurjo, M.J.; Núñez-Delgado, A. Copper Content and Distribution in Vineyard Soils from Betanzos (A Coruña, Spain). Spanish J. Soil Sci. 2015, 5, 60–71. [Google Scholar] [CrossRef]
- Salomé, C.; Coll, P.; Lardo, E.; Metay, A.; Villenave, C.; Marsden, C.; Blanchart, E.; Hinsinger, P.; Le Cadre, E. The Soil Quality Concept as a Framework to Assess Management Practices in Vulnerable Agroecosystems: A Case Study in Mediterranean Vineyards. Ecol. Indic. 2016, 61, 456–465. [Google Scholar] [CrossRef]
- Vega-Ávila, A.; Medina, E.; Paroldi, H.; Toro, M.; Baigori, M.; Vázquez, F.; Vega-Ávila, A.; Medina, E.; Paroldi, H.; Toro, M.; et al. Bioindicators of Soil Quality of Open Shrubland and Vineyards. J. Soil Sci. Plant Nutr. 2018, 18, 1065–1079. [Google Scholar] [CrossRef] [Green Version]
- Oliver, D.P.; Bramley, R.G.V.; Riches, D.; Porter, I.; Edwards, J. Review: Soil Physical and Chemical Properties as Indicators of Soil Quality in Australian Viticulture. Aust. J. Grape Wine Res. 2013, 19, 129–139. [Google Scholar] [CrossRef]
- Bortoluzzi, E.C.; Korchagin, J.; Moterle, D.F.; Santos, D.R.D.; Caner, L. Accumulation and Precipitation of Cu and Zn in a Centenarian Vineyard. Soil Sci. Soc. Am. J. 2019, 83, 492–502. [Google Scholar] [CrossRef]
- Babcsányi, I.; Pham, N.T.H.; Fekete, I.; Farsang, A. The Spatial Distribution of Copper and Zinc in Vineyard Soils (in Tokaj, Hungary) as Impacted by Soil Erosion. Adv. Sci. Technol. Innov. 2022, 1, 211–214. [Google Scholar] [CrossRef]
- Brunetto, G.; Comin, J.J.; Miotto, A.; de Moraes, M.P.; Sete, P.B.; Schmitt, D.E.; Gatiboni, L.C.; de Melo, G.W.B.; Morais, G.P. Copper and Zinc Accumulation, Fractionation and Migration in Vineyard Soils from Santa Catarina State, Brazil. Bragantia 2018, 77, 141–151. [Google Scholar] [CrossRef] [Green Version]
- Beygi, M.; Jalali, M. Assessment of Trace Elements (Cd, Cu, Ni, Zn) Fractionation and Bioavailability in Vineyard Soils from the Hamedan, Iran. Geoderma 2019, 337, 1009–1020. [Google Scholar] [CrossRef]
- Peralta, E.; Pérez, G.; Ojeda, G.; Alcañiz, J.M.; Valiente, M.; López-Mesas, M.; Sánchez-Martín, M.J. Heavy Metal Availability Assessment Using Portable X-ray Fluorescence and Single Extraction Procedures on Former Vineyard Polluted Soils. Sci. Total Environ. 2020, 726, 138670. [Google Scholar] [CrossRef]
- Romero, I.; García-Escudero, E.; Martín, I. Leaf Blade versus Petiole Analysis for Nutritional Diagnosis of Vitis Vinifera L. Cv. Tempranillo. Am. J. Enol. Vitic. 2013, 64, 50–64. [Google Scholar] [CrossRef]
- Dominguez, N.; García-Escudero, E.; Romero, I.; Benito, A.; Martín, I. Leaf Blade and Petiole Nutritional Evolution and Variability throughout the Crop Season for Vitis Vinifera L. Cv. Graciano. Spanish J. Agric. Res. 2015, 13, e0801. [Google Scholar] [CrossRef] [Green Version]
- IUSS Working Group. WRB World Reference Base for Soil Resources 2015. International Soil Classification System for Naming Soils and Creating Legends for Soil Maps; World Soil Resources Reports No 106; FAO: Rome, Italy, 2015; ISBN 9789251083697. [Google Scholar]
- Gee, G.W.; Or, D. Particle-Size Analysis: Pipette Method; Dane, J.H., Topp, G.C., Eds.; Soil Science Society of Americ: Madison, WI, USA, 2002; pp. 272–278. [Google Scholar]
- Eriksson, C.P.; Holmgren, P. Estimating Stone and Boulder Content in Forest Soils—Evaluating the Potential of Surface Penetration Methods. CATENA 1996, 28, 121–134. [Google Scholar] [CrossRef]
- Carter, M.R.; Gregorich, E.G. Soil Sampling and Methods of Analysis; CRC Press: Boca Raton, FL, USA, 2007. [Google Scholar] [CrossRef]
- Walkley, A.; Black, I.A. An Examination of the Degtjareff Method for Determining Soil Organic Matter, and a Proposed Modification of the Chromic Acid Titration Method. Soil Sci. 1934, 37, 29–38. [Google Scholar] [CrossRef]
- Bremner, J.M.; Mulvaney, C.S. Nitrogen-Total; Page, A.L., Miller, R.H., Keeney, R.S., Eds.; American Society of Agronomy and Soil Science Society of America: Madison, WI, USA, 1982; pp. 595–624. [Google Scholar]
- Mehlich, A. Mehlich 3 Soil Test Extractant: A Modification of Mehlich 2 Extractant. Commun. Soil Sci. Plant Anal. 1984, 15, 1409–1416. [Google Scholar] [CrossRef]
- Hendershot, W.H.; Duquette, M. A Simple Barium Chloride Method for Determining Cation Exchange Capacity and Exchangeable Cations. Soil Sci. Soc. Am. J. 1986, 50, 605–608. [Google Scholar] [CrossRef]
- Lindsay, W.L.; Norvell, W.A. Development of a DTPA Soil Test for Zinc, Iron, Manganese, and Copper. Soil Sci. Soc. Am. J. 1978, 42, 421–428. [Google Scholar] [CrossRef]
- Sanchez, P.A.; Palm, C.A.; Buol, S.W. Fertility capability soil classification: A tool to help assess soil quality in the tropics. Geoderma 2003, 114, 157–185. [Google Scholar] [CrossRef]
- Calvo, R.M.; Garcia-Rodeja, E.; Macias, F. Mineralogical Variability in Weathering Microsystems of A Granitic Outcrop of Galicia (Spain). CATENA 1983, 10, 225–236. [Google Scholar] [CrossRef]
- Calvo, R.; Macias, F. Limitantes Quimicos a La Fertilidad de Los Suelos de La Provincia de La Coruña. In Proceedings of the VII Congreso Nacional de Química Agrícola, Sevilla, Spain, 12–17 October 1987; p. 23. [Google Scholar]
- Calvo, R.; Macias, F. Aptitud agronómica de los suelos de la Provincia de La Coruña. (Cultivos, Pinos, Robles, Eucaliptos y Castaños); Editorial Diputación Provincial de A Coruña: A Coruña, Spain, 1992; p. 88. [Google Scholar]
- Levy, J.F. Les Bases Physiologiques Du Diagnostic Foliaire de La Vigne. Le Contrôle de La Fertilisation des Plantes Cultivées, II. In Proceedings of the II Coloquio Europeo y Mediterraneo, Sevilla, Spain, 1968; pp. 243–254. [Google Scholar]
- Bertoni, G.; Morard, P. Blade or Petiole Analysis as a Guide for Grape Nutrition. Commun. Soil Sci. Plant Anal. 2008, 13, 593–605. [Google Scholar] [CrossRef]
- Fregoni, M. Viticoltura Generale: Compendi Didattici e Scientifici; Reda: Rome, Italy, 1985. [Google Scholar]
- Delas, J. Diagnostic Foliaire: Aspect Historique, Pratique Actuelle. Progrès Agric. Vitic. 1990, 107, 399–402. [Google Scholar]
- Hoenig, M.; Baeten, H.; Vanhentenrijk, S.; Vassileva, E.; Quevauviller, P. Critical Discussion on the Need for an Efficient Mineralization Procedure for the Analysis of Plant Material by Atomic Spectrometric Methods. Anal. Chim. Acta 1998, 358, 85–94. [Google Scholar] [CrossRef]
- Lazcano, C.; Decock, C.; Wilson, S.G. Defining and Managing for Healthy Vineyard Soils, Intersections with the Concept of Terroir. Front. Environ. Sci. 2020, 8, 68. [Google Scholar] [CrossRef]
- Andrés, P.; Doblas-Miranda, E.; Silva-Sánchez, A.; Mattana, S.; Font, F. Physical, Chemical, and Biological Indicators of Soil Quality in Mediterranean Vineyards under Contrasting Farming Schemes. Agronomy 2022, 12, 2643. [Google Scholar] [CrossRef]
- Kaan Kurtural, S. Desired Soil Properties for Vineyard Site Preparation. HortFact 2011, 31, 1–7. [Google Scholar]
- Leake, S. Vineyard Soil Management; Sydney Environmental & Soil Laboratory Pty Ltd.: Sydney, Australia, 1999. [Google Scholar]
- Rusjan, D.; Strlič, M.; Pucko, D.; Korošec-Koruza, Z. Copper Accumulation Regarding the Soil Characteristics in Sub-Mediterranean Vineyards of Slovenia. Geoderma 2007, 141, 111–118. [Google Scholar] [CrossRef]
- Fernández-Calviño, D.; Arias-Estévez, M.; Díaz-Raviña, M.; Bååth, E. Assessing the Effects of Cu and PH on Microorganisms in Highly Acidic Vineyard Soils. Eur. J. Soil Sci. 2012, 63, 571–578. [Google Scholar] [CrossRef]
- Fernández-Calviño, D.; Martín, A.; Arias-Estévez, M.; Bååth, E.; Díaz-Raviña, M. Microbial Community Structure of Vineyard Soils with Different PH and Copper Content. Appl. Soil Ecol. 2010, 46, 276–282. [Google Scholar] [CrossRef]
- Ozpinar, S.; Ozpinar, A.; Cay, A. Soil Management Effect on Soil Properties in Traditional and Mechanized Vineyards under a Semiarid Mediterranean Environment. Soil Tillage Res. 2018, 178, 198–208. [Google Scholar] [CrossRef]
- Jiménez-Ballesta, R.; Bravo, S.; García-Pradas, J.; Pérez-de-los-Reyes, C.; Amorós, J.A.; García-Navarro, F.J. Characteristics of Vineyard Soils Derived from Plio-Quaternary Landforms (Raña or Rañizo) in Southern Europe. Eur. J. Soil Sci. 2022, 73, e13291. [Google Scholar] [CrossRef]
- Doğan, B.; Gülser, C. Assessment of Soil Quality for Vineyard Fields: A Case Study in Menderes District of Izmir, Turkey. Eurasian J. Soil Sci. 2019, 8, 176–183. [Google Scholar] [CrossRef]
- Calvo De Anta, R.; Luís Calvo, E.; Casás Sabarís, F.; Galiñanes Costa, J.M.; Matilla Mosquera, N.; Vázquez, F.M.; Camps Arbestain, M.; Vázquez García, N. Soil Organic Carbon in Northern Spain (Galicia, Asturias, Cantabria and País Vasco). Spanish J. Soil Sci. 2015, 5, 41–53. [Google Scholar] [CrossRef]
- Giannakis, I.; Emmanouil, C.; Mitrakas, M.; Manakou, V.; Kungolos, A. Chemical and Ecotoxicological Assessment of Sludge-Based Biosolids Used for Corn Field Fertilization. Environ. Sci. Pollut. Res. 2021, 28, 3797–3809. [Google Scholar] [CrossRef] [PubMed]
- Thomidis, T.; Zioziou, E.; Koundouras, S.; Karagiannidis, C.; Navrozidis, I.; Nikolaou, N. Effects of Nitrogen and Irrigation on the Quality of Grapes and the Susceptibility to Botrytis Bunch Rot. Sci. Hortic. 2016, 212, 60–68. [Google Scholar] [CrossRef]
- Trasar-Cepeda, M.C.; Gil-Sotres, F.; Guitian-Ojea, F. Relation between Phosphorus Fractions and Development of Soils from Galicia (NW Spain). Geoderma 1990, 47, 139–150. [Google Scholar] [CrossRef]
- McDowell, R.W.; Mahieu, N.; Brookes, P.C.; Poulton, P.R. Mechanisms of Phosphorus Solubilisation in a Limed Soil as a Function of PH. Chemosphere 2003, 51, 685–692. [Google Scholar] [CrossRef]
- Penn, C.J.; Camberato, J.J. A Critical Review on Soil Chemical Processes That Control How Soil PH Affects Phosphorus Availability to Plants. Agriculture 2019, 9, 120. [Google Scholar] [CrossRef] [Green Version]
- Korboulewsky, N.; Dupouyet, S.; Bonin, G. Environmental Risks of Applying Sewage Sludge Compost to Vineyards. J. Environ. Qual. 2002, 31, 1522–1527. [Google Scholar] [CrossRef]
- Brunetto, G.; Lorensini, F.; Ceretta, C.A.; Gatiboni, L.C.; Trentin, G.; Girotto, E.; Miotto, A.; Lourenzi, C.R.; de Melo, G.W. Soil Phosphorus Fractions in a Sandy Typic Hapludaft as Affected by Phosphorus Fertilization and Grapevine Cultivation Period. Commun. Soil. Sci. Plant. Anal. 2013, 44, 1937–1950. [Google Scholar] [CrossRef]
- Schmitt, D.E.; Gatiboni, L.C.; Girotto, E.; Lorensini, F.; Melo, G.W.B.; Brunetto, G. Phosphorus Fractions in the Vineyard Soil of the Serra Gaúcha of Rio Grande Do Sul, Brazil. Rev. Bras. Eng. Agríc. Ambient 2014, 18, 133–140. [Google Scholar] [CrossRef]
- Van Leeuwen, C. Influence of Climate, Soil, and Cultivar on Terroir. Am. J. Enol. Vitic. 2004, 55, 207–217. [Google Scholar] [CrossRef]
- Howell, C.L.; Conradie, W.J. Comparison of Three Different Fertigation Strategies for Drip Irrigated Table Grapes—Part II. Soil and Grapevine Nutrient Status. S. Afr. J. Enol. Vitic. 2013, 34, 10–20. [Google Scholar] [CrossRef]
- Parat, C.; Chaussod, R.; Lévéque, J.; Dousset, S.; Andreux, F. The Relationship between Copper Accumulated in Vineyard Calcareous Soils and Soil Organic Matter and Iron. Eur. J. Soil Sci. 2002, 53, 663–670. [Google Scholar] [CrossRef]
- Arias, M.; López, E.; Fernández, D.; Soto, B.; Estévez. Copper Distribution and Dynamics in Acid Vineyard Soils Treated with Copper-Based Fungicides. Soil Sci. 2004, 169, 796–805. [Google Scholar] [CrossRef]
- Droz, B.; Payraudeau, S.; Rodríguez Martín, J.A.; Tóth, G.; Panagos, P.; Montanarella, L.; Borrelli, P.; Imfeld, G. Copper Content and Export in European Vineyard Soils Influenced by Climate and Soil Properties. Environ. Sci. Technol. 2021, 55, 7327–7334. [Google Scholar] [CrossRef]
- García-Navarro, F.J.; Jiménez-Ballesta, R.; Garcia-Pradas, J.; Amoros, J.A.; de los Reyes, C.P.; Bravo, S. Zinc Concentration and Distribution in Vineyard Soils and Grapevine Leaves from Valdepeñas Designation of Origin (Central Spain). Sustainability 2021, 13, 7390. [Google Scholar] [CrossRef]


| Leaf Blade | Petiole | ||||||||||
|---|---|---|---|---|---|---|---|---|---|---|---|
| Status | N | P | K | Zn | Cu | Mg | Ca | Fe | Mn | Status | K/Mg |
| mg kg−1 | |||||||||||
| Deficiency | - | <1.5 | <10 | - | <4 | <2.0 | <20 | - | - | Probable K deficiency | <2 |
| Slight deficiency | <24 | 1.5–2.0 | 12 October | 0–30 | 5 April | 2.0–2.3 | 20–25 | 0–50 | - | Risk of K deficiency | 3 |
| Optimum | 24–26 | 2.0–2.4 | 14 December | 30–150 | 20 May | 2.3–2.7 | >25 | 50–225 | 0–200 | Normal feeding | 10 |
| Slight excess | 26–28 | 2.4–2.6 | 14–16 | 150–400 | 20–40 | 2.7–3.0 | - | 225–300 | 200–500 | Risk of Mg deficiency | 12 |
| Excess | >28 | >2.6 | >16 | >400 | >40 | >3.0 | - | >300 | >500 | Probable Mg deficiency | >12 |
| Soil | Bulk Density (g cm−3) | Stoniness (%) | Sand (%) | Silt (%) | Clay (%) | Texture |
|---|---|---|---|---|---|---|
| Amin | 0.96 | 52.01 | 78.7 | 16.1 | 3.4 | Sandy-Loam |
| Amax | 1.35 | 61.54 | 79.9 | 16.7 | 5.2 | Sandy-Loam |
| A(mean) | 1.15 ± 0.19 | 57.53 ± 3.96 | 79.3 ± 0.7 | 16.4 ± 0.3 | 4.3 ± 1.0 | Sandy-Loam |
| Bmin | 0.98 | 14.47 | 75.9 | 17.6 | 6.2 | Sandy-Loam |
| Bmax | 1.14 | 63.87 | 76.1 | 18.1 | 6.4 | Sandy-Loam |
| B(mean) | 1.04 ± 0.07 | 38.32 ± 14.50 | 75.9 ± 0.3 | 17.8 ± 0.2 | 6.3 ± 0.1 | Sandy-Loam |
| CA | 0.35 ± 0.04 | 44.62 ± 8.32 | 71.8 ± 0.2 | 19.6 ± 0.1 | 8.6 ± 0.0 | Loamy-Sand |
| CB | 0.44 ± 0.05 | 10.24 ± 2.45 | 75.5 ± 0.1 | 15.8 ± 0.1 | 8.7 ± 0.0 | Loamy-Sand |
| Soil | pH(H2O) | pH(KCl) | Org C | OM | N | K | P | C/N | K+ | Ca2+ | Mg2+ | Al3+ | Na+ | eCEC | Ca/Mg | K/Mg |
|---|---|---|---|---|---|---|---|---|---|---|---|---|---|---|---|---|
| g kg−1 | % | g kg−1 | mg kg−1 | cmol(+) kg−1 | ||||||||||||
| 1st sampling—October (Year 1) | ||||||||||||||||
| Amin | 5.6 | 4.7 | 7.8 | 1.4 | 0.6 | 248 | 67 | 11.1 | 0.6 | 4.4 | 2.0 | 0.1 | 0.1 | 7.4 | 2.2 | 0.2 |
| Amax | 6.1 | 5.8 | 18.0 | 3.1 | 0.8 | 286 | 91 | 28.3 | 0.7 | 12.2 | 2.9 | 0.1 | 0.2 | 15.5 | 5.0 | 0.4 |
| Amean | 5.8 | 5.4 | 13.1 | 2.3 | 0.7 | 270 | 80 | 19.1 | 0.7 | 8.3 | 2.5 | 0.1 | 0.1 | 11.6 | 3.3 | 0.3 |
| SD | 0.2 | 0.4 | 4.9 | 0.8 | 0.1 | 16 | 10 | 7.1 | 0.0 | 2.6 | 0.3 | 0.0 | 0.0 | 2.8 | 1.0 | 0.05 |
| Bmin | 5.4 | 5.0 | 15.0 | 2.6 | 0.2 | 255 | 54 | 38.8 | 0.7 | 2.5 | 0.6 | 0.1 | 0.1 | 4.8 | 1.3 | 0.4 |
| Bmax | 6.6 | 6.1 | 21.5 | 4.3 | 0.4 | 396 | 91 | 108 | 1.0 | 11.8 | 2.1 | 0.6 | 0.2 | 14.1 | 8.7 | 1.4 |
| Bmean | 6.2 | 5.5 | 18.1 | 3.4 | 0.3 | 324 | 82 | 69.0 | 0.8 | 4.4 | 1.5 | 0.3 | 0.1 | 7.1 | 3.5 | 0.7 |
| SD | 0.4 | 0.4 | 2.6 | 0.7 | 0.1 | 60 | 14 | 25.6 | 0.2 | 3.2 | 0.6 | 0.2 | 0.0 | 3.1 | 2.7 | 0.4 |
| CA | 4.9 | 4.3 | 56.0 | 11.2 | 11.3 | 158 | 2 | 5.4 | 0.3 | 0.2 | 0.2 | 1.6 | 0.2 | 2.5 | 1.1 | 1.6 |
| SD | 0.1 | 0.1 | 2.1 | 1.1 | 1.2 | 12 | 0 | 1.1 | 0.1 | 0.1 | 0.1 | 0.2 | 0.1 | 0.6 | 0.1 | 0.1 |
| CB | 4.9 | 3.9 | 44.0 | 8.8 | 3.9 | 162 | 2 | 12.7 | 0.3 | 1.9 | 0.7 | 2.7 | 0.2 | 5.8 | 2.7 | 0.5 |
| SD | 0.1 | 0.1 | 1.9 | 1.3 | 0.5 | 9.0 | 0 | 1.2 | 0.1 | 0.1 | 0.1 | 0.1 | 0.1 | 0.5 | 0.1 | 0.1 |
| 2nd sampling—March (Year 1) | ||||||||||||||||
| Amin | 6.3 | 5.5 | 23.5 | 4.7 | 2.0 | 202 | 45 | 8.0 | 0.5 | 13.3 | 0.7 | 0.1 | 0.1 | 16.6 | 5.8 | 0.3 |
| Amax | 7.2 | 6.4 | 36.5 | 7.3 | 4.2 | 560 | 103 | 13.4 | 1.4 | 24.6 | 3.2 | 0.1 | 0.2 | 26.6 | 27.0 | 0.7 |
| Amean | 6.9 | 6.1 | 31.4 | 6.3 | 3.1 | 347 | 68 | 10.7 | 0.9 | 19.0 | 1.9 | 0.1 | 0.1 | 22.0 | 13.2 | 0.5 |
| SD | 0.3 | 0.4 | 4.4 | 0.9 | 0.8 | 131 | 20 | 2.1 | 0.3 | 3.9 | 0.9 | 0.0 | 0.0 | 3.4 | 9.0 | 0.2 |
| Bmin | 6.6 | 5.8 | 21.0 | 4.2 | 1.9 | 214 | 76 | 10.9 | 0.5 | 13.6 | 3.9 | 0.1 | 0.1 | 20.1 | 1.9 | 0.1 |
| Bmax | 7.5 | 6.8 | 48.5 | 9.7 | 4.3 | 474 | 131 | 11.8 | 1.2 | 38.8 | 10.6 | 0.1 | 0.2 | 44.2 | 8.4 | 0.2 |
| Bmean | 7.1 | 6.2 | 36.1 | 7.2 | 3.2 | 322 | 101 | 11.3 | 0.8 | 20.5 | 5.5 | 0.1 | 0.1 | 27.0 | 4.1 | 0.2 |
| SD | 0.3 | 0.3 | 9.9 | 2.0 | 0.9 | 86 | 19 | 0.3 | 0.2 | 7.8 | 2.2 | 0.0 | 0.0 | 7.9 | 2.0 | 0.04 |
| CA | 5.0 | 4.2 | 61.0 | 12.0 | 11.4 | 112 | 3 | 5.4 | 0.4 | 0.2 | 0.2 | 1.6 | 0.2 | 2.6 | 1.0 | 2.0 |
| SD | 0.1 | 0.1 | 2.3 | 1.0 | 1.3 | 14 | 1 | 0.9 | 0.1 | 0.1 | 0.1 | 0.1 | 0.1 | 0.5 | 0.1 | 0.1 |
| CB | 4.9 | 3.9 | 48.0 | 9.6 | 3.8 | 138 | 7 | 12.6 | 0.3 | 2.0 | 0.7 | 2.8 | 0.1 | 5.9 | 2.9 | 0.4 |
| SD | 0.2 | 0.1 | 2.1 | 1.5 | 0.6 | 8 | 0 | 1.0 | 0.1 | 0.2 | 0.1 | 0.2 | 0.1 | 0.7 | 0.1 | 0.1 |
| 3rd sampling—July (Year 1) | ||||||||||||||||
| Amin | 6.5 | 5.9 | 21.5 | 4.3 | 1.8 | 210 | 40 | 10.9 | 0.5 | 10.9 | 1.2 | 0.1 | 0.1 | 13.8 | 5.7 | 0.4 |
| Amax | 7.3 | 6.7 | 31.0 | 6.2 | 2.7 | 672 | 60 | 14.6 | 1.7 | 24.0 | 2.6 | 0.1 | 0.2 | 27.1 | 13.7 | 0.9 |
| Amean | 6.9 | 6.3 | 27.0 | 5.4 | 2.3 | 362 | 52 | 12.1 | 0.9 | 15.7 | 1.8 | 0.1 | 0.2 | 18.7 | 9.5 | 0.5 |
| SD | 0.3 | 0.3 | 3.3 | 0.7 | 0.4 | 163 | 7 | 1.4 | 0.4 | 4.8 | 0.5 | 0.0 | 0.0 | 4.7 | 4.0 | 0.2 |
| Bmin | 7.0 | 6.3 | 13.5 | 2.7 | 1.0 | 304 | 60 | 12.6 | 0.8 | 11.0 | 2.3 | 0.1 | 0.1 | 14.4 | 2.0 | 0.1 |
| Bmax | 7.6 | 7.1 | 53.5 | 10.7 | 3.2 | 480 | 99 | 16.8 | 1.2 | 23.5 | 8.4 | 0.1 | 0.2 | 30.5 | 4.7 | 0.4 |
| Bmean | 7.2 | 6.6 | 34.7 | 6.9 | 2.3 | 389 | 79 | 14.8 | 1.0 | 16.9 | 5.5 | 0.1 | 0.2 | 23.7 | 3.4 | 0.2 |
| SD | 0.2 | 0.3 | 14.6 | 2.9 | 0.8 | 64 | 14 | 1.7 | 0.2 | 4.0 | 2.1 | 0.0 | 0.0 | 5.2 | 1.1 | 0.1 |
| CA | 4.9 | 4.2 | 61.5 | 12.3 | 11.5 | 113 | 3 | 5.3 | 0.3 | 0.2 | 0.2 | 1.5 | 0.2 | 2.4 | 1.0 | 1.5 |
| SD | 0.1 | 0.1 | 2.3 | 0.5 | 1.3 | 11 | 0 | 1.8 | 0.2 | 0.1 | 0.1 | 0.2 | 0.1 | 0.7 | 1.0 | 2.0 |
| CB | 4.8 | 3.9 | 47.5 | 9.5 | 3.8 | 138 | 8 | 12.5 | 0.3 | 1.8 | 0.8 | 2.8 | 0.2 | 5.9 | 2.3 | 0.4 |
| SD | 0.2 | 0.1 | 1.8 | 0.4 | 0.6 | 8 | 0 | 3.0 | 0.1 | 0.1 | 0.2 | 0.1 | 0.1 | 0.6 | 0.5 | 0.5 |
| 4th sampling—October (Year 2) | ||||||||||||||||
| Amin | 6.7 | 5.8 | 24.5 | 4.9 | 1.7 | 188 | 21 | 11.3 | 0.5 | 14.6 | 1.1 | 0.1 | 0.1 | 16.4 | 5.5 | 0.2 |
| Amax | 7.2 | 6.6 | 35.0 | 7.0 | 3.1 | 612 | 69 | 18.9 | 1.5 | 22.5 | 3.0 | 0.1 | 0.2 | 25.6 | 13.4 | 0.5 |
| Amean | 7.0 | 6.3 | 29.7 | 5.9 | 2.3 | 325 | 51 | 13.6 | 0.8 | 18.3 | 2.1 | 0.1 | 0.2 | 21.5 | 9.5 | 0.4 |
| SD | 0.2 | 0.3 | 4.1 | 0.8 | 0.6 | 152 | 17 | 3.0 | 0.4 | 3.2 | 0.7 | 0.0 | 0.0 | 3.5 | 3.3 | 0.1 |
| Bmin | 6.2 | 5.7 | 18.0 | 3.6 | 1.5 | 262 | 34 | 11.1 | 0.7 | 12.6 | 3.2 | 0.1 | 0.1 | 17.0 | 2.1 | 0.1 |
| Bmax | 7.6 | 7.0 | 49.0 | 9.8 | 3.2 | 424 | 127 | 18.5 | 1.1 | 25.7 | 6.4 | 0.1 | 0.2 | 29.9 | 8.1 | 0.3 |
| Bmean | 7.1 | 6.4 | 32.7 | 6.5 | 2.3 | 351 | 69 | 14.1 | 0.9 | 16.8 | 4.6 | 0.1 | 0.2 | 22.5 | 4.1 | 0.2 |
| SD | 0.5 | 0.5 | 10.6 | 2.1 | 0.5 | 59 | 30 | 2.4 | 0.1 | 4.3 | 1.3 | 0.0 | 0.0 | 3.8 | 2.0 | 0.06 |
| CA | 4.8 | 4.2 | 56.1 | 11.2 | 11.5 | 110 | 2 | 4.9 | 0.4 | 0.2 | 0.3 | 1.6 | 0.2 | 2.7 | 0.7 | 1.3 |
| SD | 0.2 | 0.1 | 2.3 | 0.5 | 1.2 | 10 | 0 | 1.9 | 0.1 | 0.1 | 0.1 | 0.2 | 0.1 | 0.6 | 1.0 | 1.0 |
| CB | 4.8 | 4 | 43.1 | 8.6 | 4.0 | 135 | 9 | 10.8 | 0.3 | 1.9 | 0.7 | 2.7 | 0.2 | 5.8 | 2.7 | 0.4 |
| SD | 0.1 | 0.2 | 2.2 | 0.4 | 0.4 | 8 | 0 | 5.5 | 0.1 | 0.2 | 0.1 | 0.1 | 0.1 | 0.6 | 2.0 | 1.0 |
| 5th sampling—March (Year 2) | ||||||||||||||||
| Amin | 6.8 | 6.1 | 27.5 | 5.5 | 1.9 | 234 | 46 | 8.2 | 0.6 | 13.8 | 1.2 | 0.1 | 0.1 | 17.4 | 5.7 | 0.3 |
| Amax | 7.4 | 6.8 | 34.0 | 6.8 | 4.0 | 570 | 83 | 15.3 | 1.4 | 21.4 | 3.2 | 0.1 | 0.2 | 23.7 | 16.7 | 0.7 |
| Amean | 7.1 | 6.5 | 30.9 | 6.2 | 3.1 | 356 | 66 | 10.4 | 0.9 | 17.2 | 2.0 | 0.1 | 0.2 | 20.4 | 10.2 | 0.5 |
| SD | 0.2 | 0.3 | 2.4 | 0.5 | 0.7 | 114 | 14 | 2.6 | 0.3 | 3.0 | 0.8 | 0.0 | 0.0 | 2.5 | 5.0 | 0.2 |
| Bmin | 7.0 | 6.2 | 19.0 | 3.8 | 1.2 | 254 | 37 | 11.6 | 0.6 | 12.8 | 2.7 | 0.1 | 0.1 | 18.5 | 2.1 | 0.1 |
| Bmax | 7.8 | 7.1 | 49.5 | 9.9 | 3.5 | 444 | 119 | 17.9 | 1.1 | 21.2 | 8.5 | 0.1 | 0.3 | 41.2 | 6.3 | 0.3 |
| Bmean | 7.4 | 6.7 | 33.3 | 6.7 | 2.2 | 342 | 69 | 15.4 | 0.9 | 16.2 | 4.8 | 0.1 | 0.2 | 24.6 | 3.8 | 0.2 |
| SD | 0.3 | 0.3 | 9.9 | 2.0 | 0.8 | 54 | 28 | 2.4 | 0.1 | 2.7 | 1.8 | 0.0 | 0.1 | 7.5 | 1.4 | 0.06 |
| CA | 5.0 | 4.4 | 63.5 | 12.7 | 11.4 | 115 | 2 | 5.6 | 0.3 | 0.3 | 0.3 | 1.7 | 0.2 | 2.8 | 1.0 | 1.0 |
| SD | 0.3 | 0.1 | 2.5 | 0.5 | 1.2 | 12 | 0 | 2.1 | 0.1 | 0.1 | 0.1 | 0.2 | 0.1 | 0.6 | 1.0 | 1.0 |
| CB | 5.1 | 4.0 | 47.5 | 9.5 | 3.9 | 128 | 8 | 12.2 | 0.3 | 1.7 | 0.8 | 2.7 | 0.2 | 5.7 | 2.1 | 0.4 |
| SD | 0.1 | 0.2 | 1.8 | 0.4 | 0.4 | 8 | 0 | 4.5 | 0.2 | 0.3 | 0.1 | 0.1 | 0.1 | 0.8 | 3.0 | 2.0 |
| 6th sampling—July (Year 2) | ||||||||||||||||
| Amin | 6.5 | 5.7 | 25.5 | 5.1 | 1.9 | 244 | 50 | 8.7 | 0.6 | 7.7 | 1.2 | 0.1 | 0.1 | 11.1 | 2.3 | 0.2 |
| Amax | 7.7 | 6.9 | 30.0 | 6.0 | 3.0 | 442 | 110 | 14.0 | 1.1 | 16.0 | 3.9 | 0.1 | 0.2 | 18.8 | 9.1 | 0.5 |
| Amean | 7.1 | 6.4 | 27.3 | 5.5 | 2.5 | 311 | 70 | 11.3 | 0.8 | 10.3 | 2.3 | 0.1 | 0.2 | 13.6 | 5.2 | 0.4 |
| SD | 0.5 | 0.5 | 1.8 | 0.4 | 0.4 | 73 | 23 | 2.1 | 0.2 | 3.0 | 0.9 | 0.0 | 0.0 | 2.7 | 3.0 | 0.2 |
| Bmin | 6.8 | 6.2 | 16.5 | 3.3 | 0.9 | 272 | 37 | 8.6 | 0.7 | 6.6 | 1.4 | 0.1 | 0.1 | 9.1 | 1.6 | 0.1 |
| Bmax | 7.6 | 6.9 | 50.5 | 10.1 | 5.8 | 440 | 131 | 18.9 | 5.2 | 15.2 | 6.1 | 0.1 | 0.6 | 25.0 | 9.4 | 1.3 |
| Bmean | 7.1 | 6.5 | 30.8 | 6.2 | 2.6 | 311 | 83 | 13.2 | 1.3 | 10.7 | 3.6 | 0.1 | 0.2 | 16.0 | 3.7 | 0.4 |
| SD | 0.3 | 0.2 | 11.7 | 2.3 | 1.5 | 55 | 33 | 4.0 | 1.6 | 2.9 | 1.7 | 0.0 | 0.2 | 4.9 | 2.4 | 0.4 |
| CA | 4.9 | 4.2 | 63.2 | 12.6 | 11.0 | 112 | 2 | 5.7 | 0.4 | 0.3 | 0.2 | 1.7 | 0.3 | 2.9 | 1.5 | 2.0 |
| SD | 0.1 | 0.2 | 2.2 | 0.4 | 1.4 | 10 | 0 | 1.6 | 0.1 | 0.1 | 0.1 | 0.2 | 0.1 | 0.6 | 1.0 | 1.0 |
| CB | 4.8 | 3.8 | 48.5 | 9.7 | 3.8 | 137 | 9 | 12.8 | 0.3 | 1.8 | 0.8 | 2.9 | 0.2 | 6 | 2.3 | 0.4 |
| SD | 0.2 | 0.2 | 2.0 | 0.4 | 0.4 | 10 | 0 | 5.0 | 0.1 | 0.1 | 0.1 | 0.1 | 0.1 | 0.5 | 1.0 | 1.0 |
| 7th sampling—October (Year 3) | ||||||||||||||||
| Amin | 6.7 | 5.9 | 22.0 | 4.4 | 1.8 | 192 | 35 | 6.6 | 0.5 | 8.1 | 1.1 | 0.1 | 0.1 | 11.0 | 3.4 | 0.2 |
| Amax | 7.6 | 6.8 | 31.5 | 6.3 | 3.9 | 554 | 65 | 16.3 | 1.4 | 15.7 | 2.4 | 0.1 | 0.2 | 17.5 | 14.0 | 0.8 |
| Amean | 7.2 | 6.4 | 26.1 | 5.2 | 2.6 | 290 | 53 | 11.0 | 0.7 | 11.4 | 1.6 | 0.1 | 0.1 | 14.0 | 7.8 | 0.5 |
| SD | 0.3 | 0.3 | 3.9 | 0.8 | 1.0 | 134 | 12 | 3.6 | 0.3 | 3.0 | 0.5 | 0.0 | 0.0 | 2.7 | 3.9 | 0.2 |
| Bmin | 7.0 | 6.2 | 16.5 | 3.3 | 1.8 | 256 | 50 | 9.4 | 0.6 | 7.8 | 2.4 | 0.1 | 0.1 | 11.1 | 1.7 | 0.1 |
| Bmax | 7.8 | 6.8 | 47.0 | 9.4 | 3.9 | 394 | 109 | 14.9 | 1.0 | 11.7 | 6.4 | 0.1 | 0.2 | 19.2 | 3.2 | 0.3 |
| Bmean | 7.4 | 6.4 | 34.5 | 6.9 | 2.9 | 317 | 67 | 12.0 | 0.8 | 9.9 | 4.3 | 0.1 | 0.1 | 15.2 | 2.5 | 0.2 |
| SD | 0.3 | 0.2 | 10.3 | 2.1 | 0.8 | 46 | 20 | 2.3 | 0.1 | 1.5 | 1.5 | 0.0 | 0.0 | 3.0 | 0.6 | 0.1 |
| CA | 4.8 | 4.3 | 58.2 | 11.6 | 11.5 | 112 | 2 | 5.1 | 0.4 | 0.2 | 0.3 | 1.6 | 0.2 | 2.7 | 0.7 | 1.3 |
| SD | 0.1 | 0.2 | 2.3 | 0.5 | 1.1 | 11 | 0 | 2.1 | 0.1 | 0.1 | 0.1 | 0.2 | 0.1 | 0.6 | 1.0 | 1.0 |
| CB | 4.7 | 3.8 | 46.4 | 9.3 | 3.7 | 130 | 8 | 12.5 | 0.2 | 1.8 | 0.7 | 2.6 | 0.2 | 5.5 | 2.6 | 0.3 |
| SD | 0.1 | 0.1 | 1.8 | 0.4 | 0.5 | 9 | 0 | 3.6 | 0.1 | 0.2 | 0.1 | 0.1 | 0.1 | 0.6 | 2.0 | 1.0 |
| 8th sampling—March (Year 3) | ||||||||||||||||
| Amin | 6.4 | 5.7 | 20.5 | 4.1 | 1.4 | 160 | 37 | 9.0 | 0.4 | 6.8 | 1.1 | 0.1 | 0.1 | 9.5 | 3.6 | 0.3 |
| Amax | 7.3 | 6.7 | 34.0 | 6.8 | 2.8 | 314 | 52 | 14.6 | 0.8 | 13.7 | 2.6 | 0.1 | 0.2 | 15.6 | 12.5 | 0.5 |
| Amean | 6.8 | 6.1 | 27.0 | 5.4 | 2.3 | 233 | 48 | 11.9 | 0.6 | 10.3 | 1.8 | 0.1 | 0.2 | 12.9 | 6.6 | 0.3 |
| SD | 0.4 | 0.4 | 5.2 | 1.0 | 0.5 | 56 | 6 | 2.3 | 0.1 | 2.5 | 0.6 | 0.0 | 0.0 | 2.1 | 3.6 | 0.1 |
| Bmin | 6.4 | 5.7 | 17.0 | 3.4 | 1.4 | 160 | 28 | 10.7 | 0.4 | 7.9 | 2.3 | 0.1 | 0.1 | 10.8 | 1.6 | 0.1 |
| Bmax | 7.3 | 6.6 | 51.5 | 10.3 | 2.8 | 276 | 97 | 21.0 | 0.7 | 10.7 | 5.3 | 0.1 | 0.2 | 15.5 | 4.3 | 0.2 |
| Bmean | 6.8 | 6.1 | 32.0 | 6.4 | 2.1 | 218 | 61 | 15.4 | 0.5 | 9.4 | 3.4 | 0.1 | 0.2 | 13.6 | 2.9 | 0.2 |
| SD | 0.3 | 0.3 | 10.3 | 2.1 | 0.5 | 41 | 19 | 3.3 | 0.1 | 1.0 | 1.0 | 0.0 | 0.0 | 1.4 | 0.8 | 0.0 |
| CA | 4.9 | 4.4 | 61.8 | 12.4 | 11.4 | 111 | 3 | 5.4 | 0.3 | 0.3 | 0.3 | 1.7 | 0.2 | 2.8 | 1.0 | 1.0 |
| SD | 0.2 | 0.1 | 2.1 | 0.4 | 1.5 | 11 | 0 | 1.4 | 0.1 | 0.1 | 0.1 | 0.2 | 0.1 | 0.6 | 1.0 | 1.0 |
| CB | 4.9 | 4.0 | 50.2 | 10.0 | 3.8 | 133 | 9 | 13.2 | 0.3 | 1.9 | 0.8 | 2.9 | 0.3 | 6.2 | 2.4 | 0.4 |
| SD | 0.1 | 0.2 | 2.0 | 0.4 | 0.4 | 8 | 0 | 5.0 | 0.1 | 0.1 | 0.2 | 0.1 | 0.1 | 0.6 | 0.5 | 0.5 |
| 9th sampling—(Year 3) | ||||||||||||||||
| Amin | 6.3 | 5.4 | 22.5 | 4.5 | 2.3 | 236 | 48 | 9.9 | 0.6 | 7.4 | 1.2 | 0.1 | 0.2 | 10.2 | 3.8 | 0.3 |
| Amax | 7.1 | 6.6 | 33.0 | 6.6 | 3.2 | 536 | 113 | 14.5 | 1.3 | 15.1 | 2.1 | 0.3 | 0.3 | 18.0 | 9.7 | 0.8 |
| Amean | 6.8 | 6.1 | 28.1 | 5.6 | 2.5 | 386 | 70 | 11.5 | 1.0 | 10.3 | 1.7 | 0.1 | 0.2 | 13.3 | 6.5 | 0.6 |
| SD | 0.3 | 0.4 | 4.6 | 0.9 | 0.4 | 97 | 25 | 1.8 | 0.2 | 3.2 | 0.4 | 0.1 | 0.0 | 3.0 | 2.9 | 0.2 |
| Bmin | 6.4 | 5.5 | 15.5 | 3.1 | 1.4 | 166 | 39 | 8.3 | 0.4 | 5.2 | 2.1 | 0.1 | 0.2 | 8.0 | 2.0 | 0.1 |
| Bmax | 7.3 | 6.6 | 40.0 | 8.0 | 4.0 | 532 | 127 | 15.4 | 1.3 | 12.4 | 6.3 | 0.1 | 0.3 | 19.9 | 3.2 | 0.5 |
| Bmean | 6.8 | 6.0 | 28.0 | 5.6 | 2.6 | 326 | 85 | 11.3 | 0.8 | 8.2 | 3.4 | 0.1 | 0.2 | 12.8 | 2.5 | 0.3 |
| SD | 0.3 | 0.3 | 8.6 | 1.7 | 1.0 | 114 | 32 | 2.4 | 0.3 | 2.3 | 1.3 | 0.0 | 0.0 | 3.6 | 0.4 | 0.1 |
| CA | 5.0 | 4.3 | 61.4 | 12.3 | 11.3 | 110 | 3 | 5.4 | 0.4 | 0.2 | 0.2 | 1.6 | 0.2 | 2.6 | 1.0 | 2.0 |
| SD | 0.2 | 0.3 | 2.3 | 0.5 | 1.3 | 13 | 0 | 1.8 | 0.1 | 0.1 | 0.1 | 0.2 | 0.1 | 0.6 | 1.0 | 1.0 |
| CB | 4.9 | 3.8 | 49.5 | 9.9 | 3.9 | 132 | 9 | 12.7 | 0.3 | 2.0 | 0.8 | 2.8 | 0.2 | 6.1 | 2.5 | 0.4 |
| SD | 0.1 | 0.1 | 2.5 | 0.5 | 0.3 | 9 | 0 | 8.3 | 0.2 | 0.2 | 0.1 | 0.1 | 0.1 | 0.7 | 2.0 | 2.0 |
| Soil (mg kg−1) | 1st Sampling (Year 1) | 2nd Sampling (Year 2) | 3rd Sampling (Year 3) | |||||||||
|---|---|---|---|---|---|---|---|---|---|---|---|---|
| CuT | CuA | ZnT | ZnA | CuT | CuA | ZnT | ZnA | CuT | CuA | ZnT | ZnA | |
| Amin | 206 | 14.6 | 103 | 2.6 | 189 | 15.4 | 115 | 6.5 | 241 | 26.9 | 140 | 16.7 |
| Amax | 210 | 18.2 | 111 | 2.9 | 219 | 20.1 | 142 | 6.8 | 271 | 31.6 | 171 | 18.5 |
| A(mean) | 208 | 16.1 | 107 | 2.8 | 207 | 17.1 | 127 | 6.7 | 259 | 28.6 | 155 | 17.6 |
| SD | 2 | 1.4 | 4 | 0.1 | 12 | 1.7 | 9 | 0.1 | 12 | 1.7 | 12 | 0.7 |
| Bmin | 114 | 17.6 | 68 | 1.4 | 123 | 18.2 | 84 | 5.3 | 175 | 55.7 | 130 | 17.9 |
| Bmax | 309 | 56.9 | 110 | 2.0 | 324 | 63.7 | 125 | 5.9 | 376 | 92.4 | 167 | 23.1 |
| B(mean) | 196 | 35.3 | 87 | 1.8 | 207 | 41.3 | 107 | 5.7 | 259 | 76.4 | 143 | 19.8 |
| SD | 91 | 15.4 | 16 | 0.2 | 95 | 16.1 | 16 | 0.2 | 95 | 12.9 | 14 | 2.1 |
| CA | 39 | 1.2 | 63 | 0.8 | 41 | 1.2 | 67 | 1.5 | 44 | 7.1 | 78 | 2.8 |
| SD | 3 | 0.2 | 4 | 0.1 | 3 | 0.1 | 5 | 0.2 | 4 | 1.1 | 3 | 0.4 |
| CB | 28 | 1.1 | 61 | 0.9 | 30 | 1.1 | 67 | 1.9 | 53 | 9.7 | 75 | 3.6 |
| SD | 2 | 0.2 | 5 | 0.2 | 2 | 0.2 | 7 | 0.3 | 3 | 1.4 | 3 | 0.5 |
| Sampling—Second Year | ||||||||||
| Vineyard/Nutrient (mg kg−1) | N | P | K | Cu | Zn | |||||
| Lb | Pt | Lb | Pt | Lb | Pt | Lb | Pt | Lb | Pt | |
| Plot A | 32.6 | 12.8 | 1.6 | 1.5 | 16.7 | 36.2 | 15.0 | 6.5 | 32.9 | 33.9 |
| SD | 7.8 | 2.5 | 0.8 | 0.4 | 3.1 | 20.1 | 1.4 | 1.0 | 7.6 | 2.4 |
| Plot B | 32.6 | 16.8 | 1.3 | 1.6 | 18.0 | 34.8 | 15.2 | 9.3 | 26.5 | 50.6 |
| SD | 2.3 | 0.6 | 0.4 | 0.8 | 0.3 | 2.2 | 5.4 | 2.9 | 4.1 | 12.3 |
| Vineyard/Nutrient (mg kg−1) | Mg | Ca | Fe | Mn | K/Mg | |||||
| Lb | Pt | Lb | Pt | Lb | Pt | Lb | Pt | Lb | Pt | |
| Plot A | 3.4 | 2.7 | 18.3 | 12.9 | 63.1 | 16.8 | 141.0 | 57.9 | 4.9 | 13.4 |
| SD | 1.5 | 0.7 | 3.8 | 5.1 | 8.8 | 0.7 | 24.6 | 18.9 | - | - |
| Plot B | 3.8 | 3.6 | 11.5 | 11.8 | 61.5 | 16.8 | 108.6 | 82.7 | 4.7 | 9.7 |
| SD | 0.4 | 0.4 | 0.3 | 0.8 | 1.5 | 0.3 | 13.9 | 13.9 | - | - |
| Sampling—Third year | ||||||||||
| Vineyard/Nutrient (mg kg−1) | N | P | K | Cu | Zn | |||||
| Lb | Pt | Lb | Pt | Lb | Pt | Lb | Pt | Lb | Pt | |
| Plot A | 28.0 | 10.7 | 0.9 | 0.7 | 14.4 | 30.1 | 11.0 | 5.3 | 29.3 | 32.5 |
| SD | 7.9 | 3.2 | 0.3 | 0.3 | 3.4 | 14.3 | 1.4 | 1.1 | 8.8 | 2.8 |
| Plot B | 29.4 | 12.6 | 1.0 | 1.1 | 14.6 | 28.1 | 12.3 | 8.0 | 22.3 | 50.3 |
| SD | 2.0 | 2.0 | 0.1 | 0.1 | 0.6 | 1.6 | 3.9 | 2.1 | 2.5 | 10.3 |
| Vineyard/Nutrient (mg kg−1) | Mg | Ca | Fe | Mn | K/Mg | |||||
| Lb | Pt | Lb | Pt | Lb | Pt | Lb | Pt | Lb | Pt | |
| Plot A | 2.5 | 1.9 | 14.8 | 12.2 | 60.3 | 15.8 | 131.9 | 48.1 | 5.8 | 15.8 |
| SD | 0.8 | 0.3 | 4.5 | 4.8 | 9.8 | 0.4 | 22.4 | 20.8 | - | - |
| Plot B | 2.2 | 2.8 | 9.6 | 10.0 | 61.7 | 15.6 | 90.8 | 84.4 | 6.6 | 10.0 |
| SD | 0.2 | 0.1 | 0.1 | 1.1 | 3.1 | 0.1 | 27.1 | 29.9 | - | - |
Disclaimer/Publisher’s Note: The statements, opinions and data contained in all publications are solely those of the individual author(s) and contributor(s) and not of MDPI and/or the editor(s). MDPI and/or the editor(s) disclaim responsibility for any injury to people or property resulting from any ideas, methods, instructions or products referred to in the content. |
© 2023 by the authors. Licensee MDPI, Basel, Switzerland. This article is an open access article distributed under the terms and conditions of the Creative Commons Attribution (CC BY) license (https://creativecommons.org/licenses/by/4.0/).
Share and Cite
Vázquez-Blanco, R.; González-Feijoo, R.; Campillo-Cora, C.; Fernández-Calviño, D.; Arenas-Lago, D. Risk Assessment and Limiting Soil Factors for Vine Production—Cu and Zn Contents in Vineyard Soils in Galicia (Rías Baixas D.O.). Agronomy 2023, 13, 309. https://doi.org/10.3390/agronomy13020309
Vázquez-Blanco R, González-Feijoo R, Campillo-Cora C, Fernández-Calviño D, Arenas-Lago D. Risk Assessment and Limiting Soil Factors for Vine Production—Cu and Zn Contents in Vineyard Soils in Galicia (Rías Baixas D.O.). Agronomy. 2023; 13(2):309. https://doi.org/10.3390/agronomy13020309
Chicago/Turabian StyleVázquez-Blanco, Raquel, Rocío González-Feijoo, Claudia Campillo-Cora, David Fernández-Calviño, and Daniel Arenas-Lago. 2023. "Risk Assessment and Limiting Soil Factors for Vine Production—Cu and Zn Contents in Vineyard Soils in Galicia (Rías Baixas D.O.)" Agronomy 13, no. 2: 309. https://doi.org/10.3390/agronomy13020309