1. Introduction
Quinoa (
Chenopodium quinoa Willd) was first domesticated by ancient Andean civilizations in the region surrounding the Bolivian and Peruvian Altiplano, where it was considered a sacred crop [
1]. Today, quinoa is gaining worldwide attention due to its outstanding nutritional value and its ability to grow in various stress conditions, including drought, salinity, and frost [
2]. Quinoa remains an important food crop in South America; however, in order to meet increasing demand its cultivation has expanded, being currently grown in more than 95 countries [
3]. In Spain, quinoa was first introduced in the Andalucía region ten years ago. Presently, Andalucía leads quinoa production in Europe, with around 4,500 ha cultivated per year (data obtained from Algosur and Alsur companies, the main companies growing quinoa in Spain). The current cultivars grown in Spain have been developed in agroclimatic conditions differing from the Spanish ones (Peru, Netherlands and Denmark). Therefore, a quinoa breeding program has been established in Córdoba, Spain, with the goal of developing quinoa varieties showing better adaptation to Mediterranean field conditions. Relevant breeding targets in this breeding program are the development of varieties that are insensitive to photoperiod, tolerant to drought and heat, and resistant to the main disease affecting quinoa crops in Spain, downy mildew.
Environmentally friendly methods for disease control, such as genetic resistance, are required for sustainable quinoa cultivation. The main disease affecting this crop worldwide, including in Spain, is downy mildew, which is caused by the biotrophic oomycete
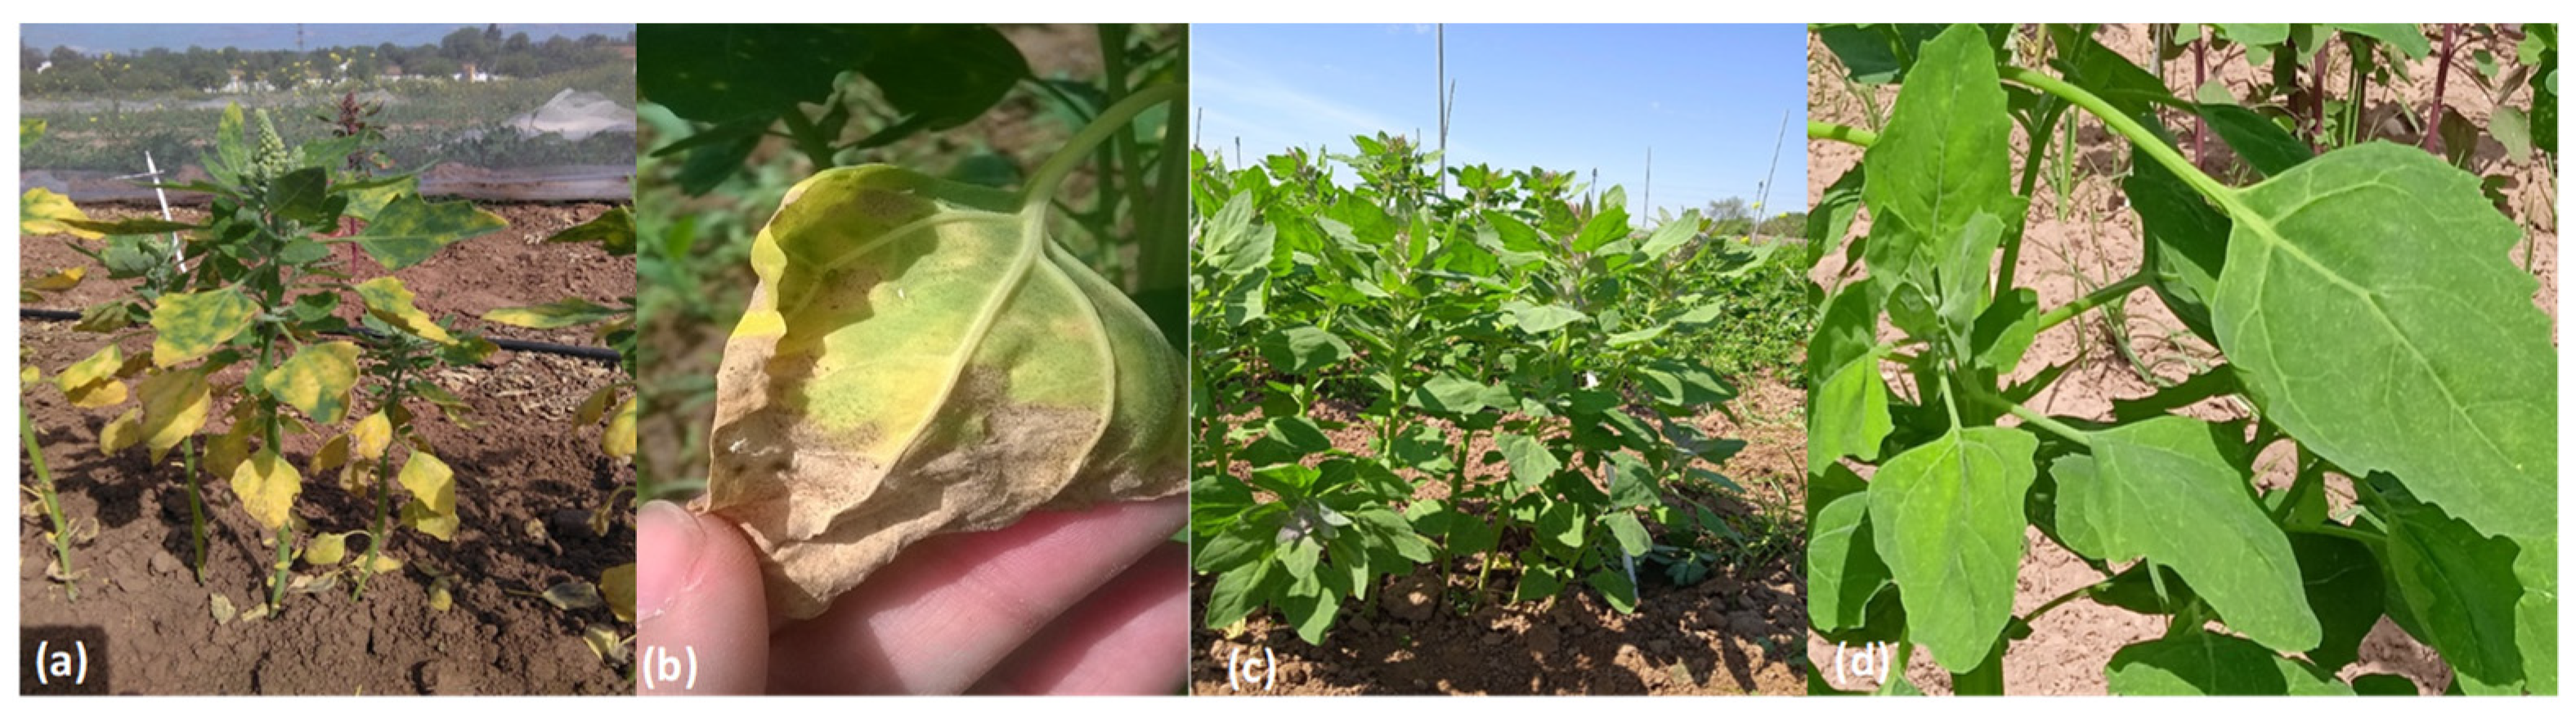
Peronospora variabilis Gäum. Downy mildew attacks the foliage of the plant, causing yellowing or reddening of the leaves (depending on the genotype) and eventual defoliation. Infections initially occur in the lowest leaves, then progress to the upper leaves of the plant. Initial symptoms caused by
P. variabilis are small irregular chlorotic spots; as the disease evolves, these chlorotic spots enlarge and form chlorotic regions that finally become necrotic. At last, the pathogen sporulates forming characteristic gray-violaceous sporulating areas (sporangiophores) on the underside of the leaves [
4]. Downy mildew can cause up to 99% yield losses in susceptible cultivars [
5]. In Spain, quinoa is severely affected by
P. variabilis. Our breeding program to develop quinoa varieties better adapted to our field conditions started five years ago, and in all these years severe attacks of downy mildew were observed. In the years in which conditions were less conductive for the disease, susceptible cultivars showed up to 70% of the plant area affected by the disease, while in those years in which conditions were more favourable, up to 90% of the plant area was affected and severe defoliation was observed.
A range of resistance levels against downy mildew have been reported in quinoa [
6,
7,
8,
9,
10]. Differences in virulence between
P. variabilis isolates have been observed, and the presence of races has been suggested [
11]. Therefore, a quinoa resistance gene might be effective against the
P. variabilis races present in a certain region while being overcome by more virulent
P. varibilis races present in other regions, making local screenings mandatory.
In addition, little is known about the resistance mechanisms acting in quinoa against
P. variabilis. Characterizing these resistance mechanisms would be useful in discerning which of them could provide more durable resistance. In such a way, resistance based on hypersensitive response (HR) is usually race-specific and has been shown to be easily broken down by pathogens. This kind of resistance is usually governed by gene-for-gene interactions between a resistance gene in the host and an avirulence gene in the pathogen, and can be easily overcome by a mutation in the avirulence gene or by a race not having the corresponding avirulent gene. By contrast, no-HR resistance is expected to be more durable. As an example,
mlo genes confer durable broad-spectrum powdery mildew resistance in several crops through penetration resistance associated with the formation of papillae or protein cross-linking in the penetration site [
12]. In addition, characterizing the resistance mechanisms acting against
P. variabilis would be useful in order to combine different mechanisms into the same variety. Combining mechanisms that act in different steps of the infection process can reduce the chance of spores successfully infecting the host, as spores would have to overcome all the consecutive barriers provided by each mechanism. A range of resistance levels against downy mildew exists in quinoa accessions [
4,
9,
11]. Certain resistant accessions show minimal signs of necrotic spots and no signs of sporulation, suggesting the occurrence of HR. However, HR, that is, a pathogen-induced cell death process at the site of infection, has not yet been demonstrated in the
P. variabilis Chenopodium quinoa pathosystem. While other accessions show different levels of quantitative resistance, the mechanisms involved are not thoroughly understood. Defense responses mediated by physical or chemical barriers may be involved. As an example, Donofrio and Delanay [
13] observed in the interaction of the oomycete
Peronospora parasitica with
Arabidopsis thaliana, causing downy mildew disease in this species, the presence of callose deposits around parasitic haustoria as a defense response. However, the few studies characterizing quantitative resistance to
P. variabilis in quinoa have analysed macroscopic variables such as sporulation, latent period, severity, and defoliation [
7,
9], and the resistance mechanisms acting at the cellular level remain unknown.
Thus, the objectives of this study were to: (1) identify quinoa accessions showing resistance to P. variabilis in Spanish field conditions; and (2) characterize the resistance mechanisms acting against P. variabilis at different steps of the infection process in a set of selected resistant quinoa accessions.
2. Materials and Methods
A graphical representation of the experimental layout can be seen in
Figure S1.
2.1. Plant Material
In total, there were 229 accessions of
C. quinoa, plus one accession of each one of the species
Chenopodiun berlandieri subs.
nutillae,
Chenopodium ugandae, and
Chenopodium opulifolium, screened for resistance to
P. variabilis under field conditions (
Table S1). These accessions were obtained from the USDA ARS North Central Regional Plant Introduction Station (Ames, EEUU) and Leibniz IPK (Intitute of Plant Genetics and Crop Plant Research) (Seeland OT Gatersleben, Germany) genebanks, excepting cultivars Vikinga, Duquesa and F16, which were kindly provided by Algosur S.A. In order to increase the homogeneity of each accession before carrying out the field experiments, one plant per accession was selected and selfed at least twice.
2.2. Field Experiments
Field experiments were carried out in experimental plots located at the Institute for Sustainable Agriculture (Córdoba, Spain). In the 2019 season, an initial set of 132 accessions of C. quinoa, including the commercial cultivar F16, plus one accession of each of the wild species C. berlandieri subs. nutillae, C. opulifolium, and C. ugandae, were screened for resistance to P. variabilis. Sixteen out of the 132 C. quinoa accessions and the wild Chenopodiun spp. accessions were omitted in the 2022 season, as they did not produce enough seed. The remaining accessions were again screened, together with 97 additional C. quinoa accessions and the commercial cultivars Duquesa and Vikinga. In both seasons, accessions were sown at the beginning of February and experiments were carried out in a completely randomised block design with three blocks. Each block consisted of one 1-m-long row of each accession 0.7 m apart from other rows, with ten plants per row. Basal fertilisation was applied one week before sowing by mixing the fertiliser (400 kg/ha of 8:15:15 N:P:K fertilizer plus 87 Kg of urea/ha) with the soil. In addition, top dressing with 130 kg urea/ha was applied at flowering.
Disease was evaluated once a week from the time at which the initial symptoms of downy mildew were observed until plants started senescence. From that moment on, it was difficult to discern whether leaves showing yellowing or fallen leaves were caused by
P. variabilis or by senescence. Disease severity was evaluated using the “three-leaf screening method”, which considers the average percentage of leaf area in each plant that is infected by the pathogen in three leaves randomly selected: one from each of the lower, middle, and upper part of the plant [
4]. This is regarded as the best method to predict quinoa yield losses caused by downy mildew [
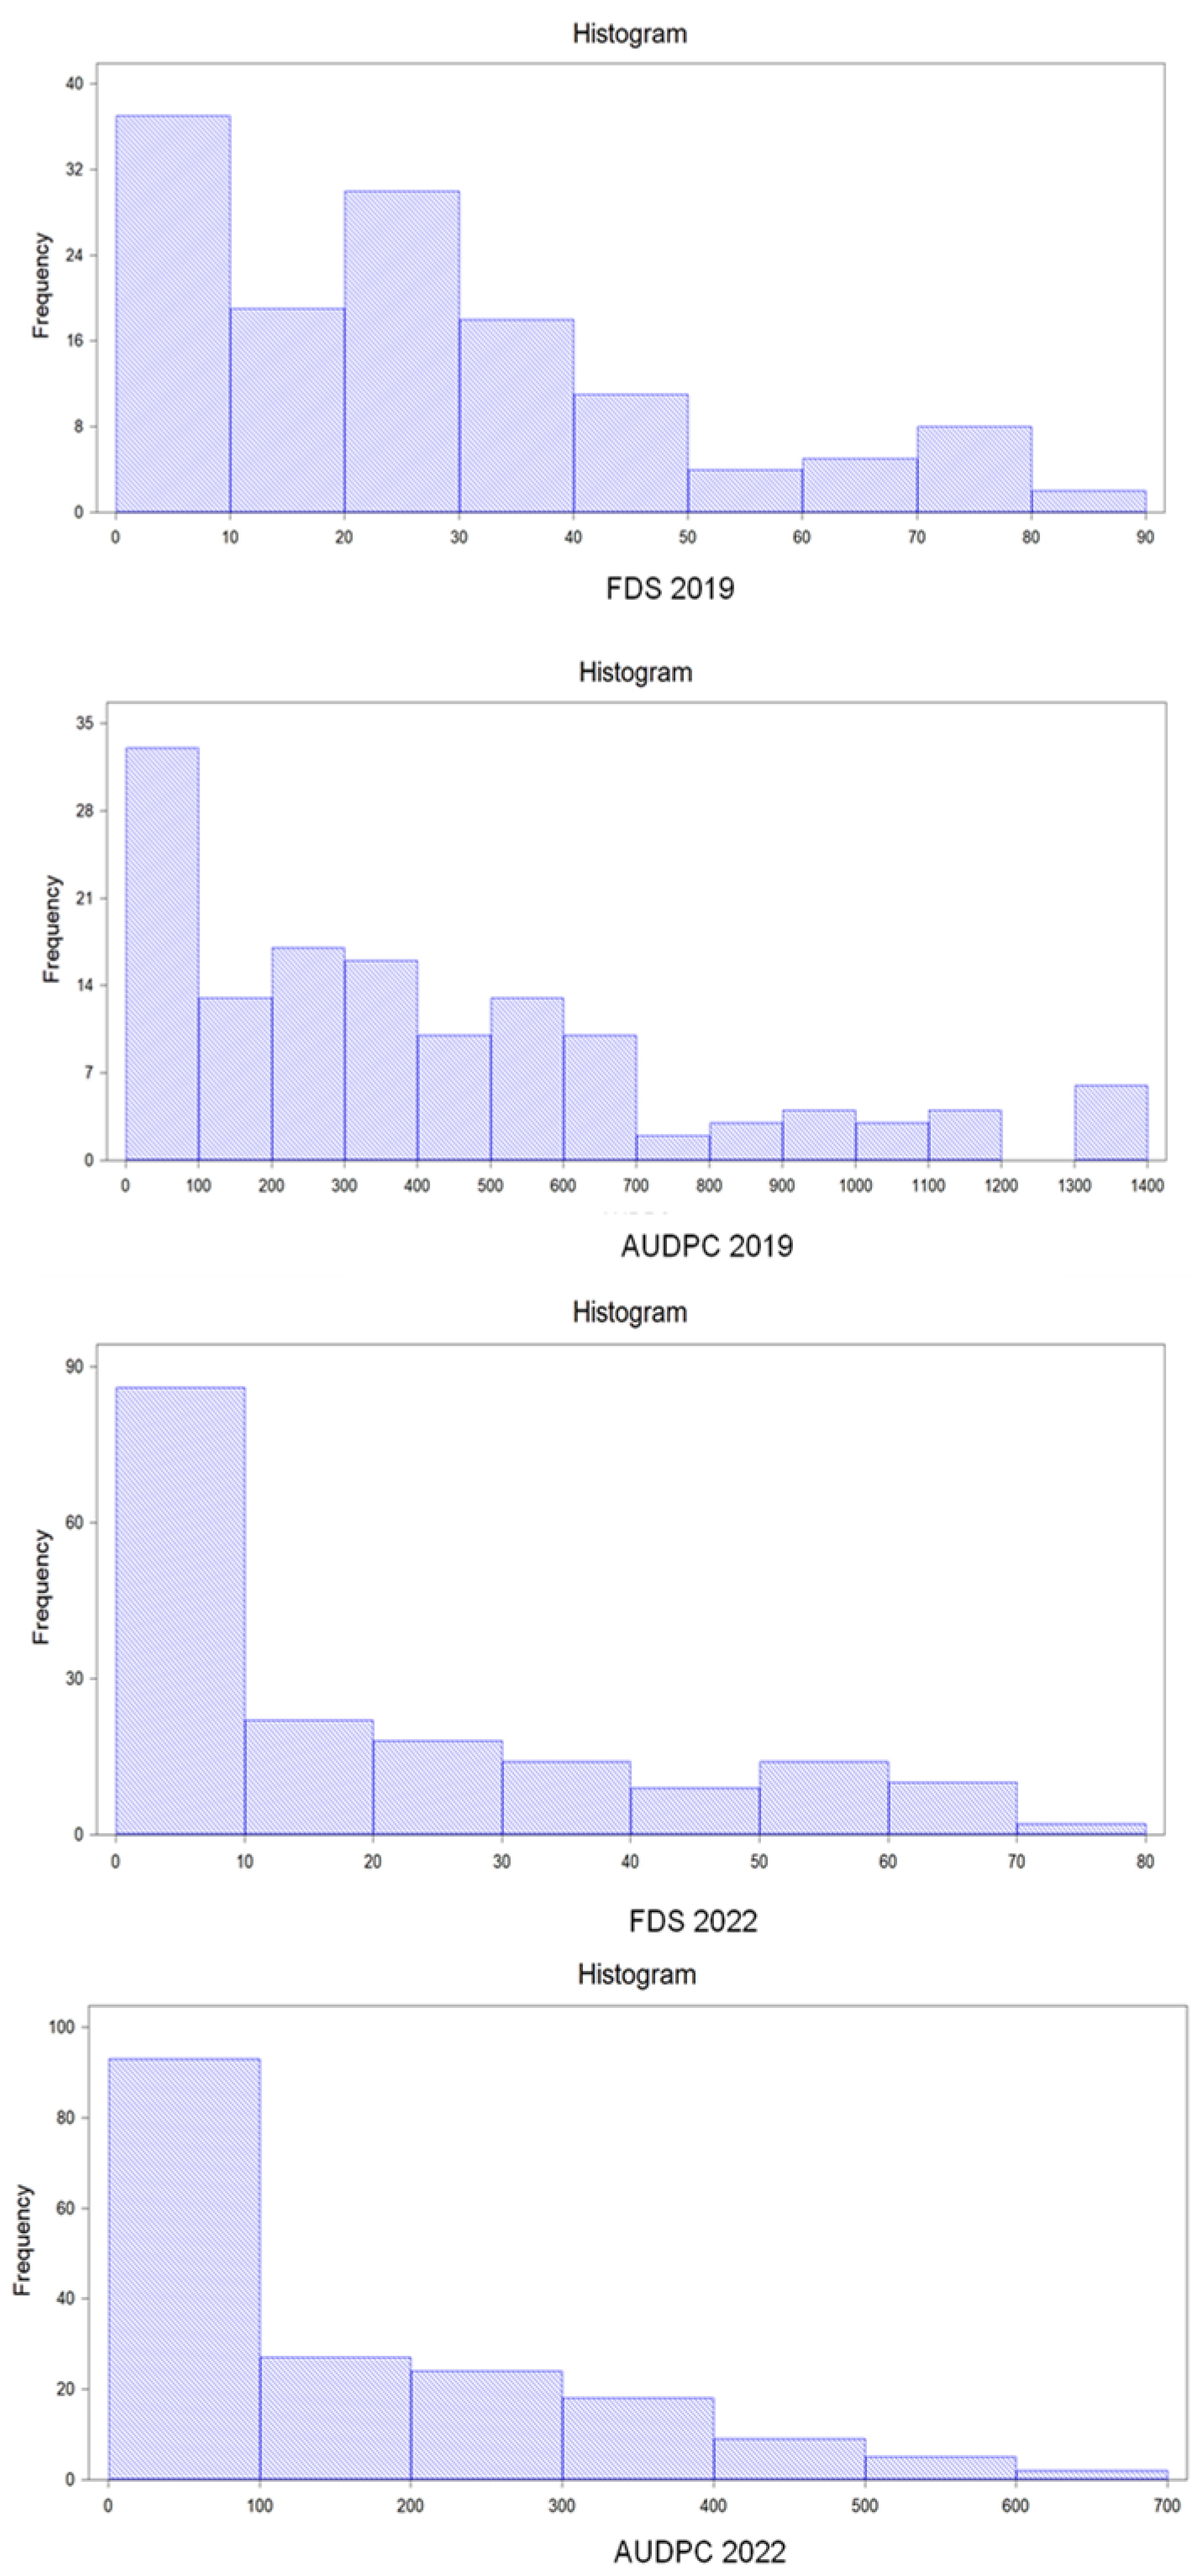
14]. Disease severity displayed by each accession at the last assessment date was considered as Final Disease Severity, and weekly data on disease severity were used to calculate the AUDPC (area under disease progress curve) for each accession and replicate using the following formula, as reported by Aydogdu and Koc [
7]:
where
Ti is the evaluation time
i,
Ti+1 is the evaluation time (
i + 1), S
i is the disease severity at
Ti, and
Si+1 is the disease severity at
Ti+1. Moreover, (
T,
S) = (0, 0) is included as the first assessment.
The disease progress curve is obtained by plotting disease severity against time. Therefore, while final disease severity indicates the percentage of plant area affected by the disease at the last assessment date, AUDPC provides information about the evolution of the disease symptoms across the time. In this way, if in an accession disease progresses slowly, this accession has an AUDPC value smaller than accessions in which disease progresses faster. The formula reported by Aydogdu and Koc [
7] estimates AUDPC by dividing the disease progress curve into a series of trapezoids, calculating the area of each, and then adding up the areas summing the trapezoids between time intervals.
2.3. Histological Studies
According to the results obtained in the field experiments, fifteen resistant and one susceptible accession were selected for histological studies (
Table 1). In order to identify as many different resistance mechanisms as possible, resistant accessions having different geographical origins were selected. In the case of accession PI674266, only one row and only in 2019 season could be screened under field conditions due to a lack of seeds. Therefore, PI674266 was not included in our statistical analyses. However, because it was the only accession from Ecuador showing resistance (it showed complete resistance in 2019 season), this accession was included in the histological studies.
Histological experiments were performed using a detached leaf method in three independent replicates. Plants were grown in pots containing 1100 cm3 of 1:1 sand-peat mixture (three plants per pot) and kept in a greenhouse (22 °C ± 5) until they reached the eighth leaf stage, when the fourth and fifth leaves were excised for inoculation.
Inoculations were carried out using a P. variabilis isolate obtained from a population collected from naturally infected quinoa plants at an experimental plot located in Córdoba, Spain, in 2022. The isolate was maintained on detached leaves of a susceptible quinoa variety.
Spore suspensions were prepared by immersing intensely sporulating leaves of a susceptible variety in a Falcon tube with deionized water and vortexing the tubes for 1 min. The suspensions were filtered through two layers of sterile gauze and homogenised by vortex, then their concentration was adjusted to 5 × 10⁴ spores/mL using a hemocytometer. Each cut leaf was inoculated by depositing 60 uL of the spore suspension on a Petri dish (12 × 12 cm) containing 40 mL of technical agar (4 g/L), and was thereafter placed onto the drop with the adaxial surface facing down. After inoculation, leaves were incubated in a growth chamber at 15 °C in the dark during 24 h. At this time the temperature was set at 20 °C ± 0.5 and the photoperiod was adjusted to a 12 h light/dark photoperiod.
The different variables were scored in at least one leaf of each accession per replicate. In order to examine superficial
P. variabilis structures (spores, germ tubes, appressoria), cut leaves were stained 48 h after inoculation (hai) as reported by Carrillo et al. [
15] with slight modifications. For fixation, leaves were placed adaxial surface up on filter paper moistened with 1:1 (
v/v) glacial acetic acid:absolute ethanol. After decolorization, leaves were placed onto filter paper moistened with tap water for 2 h. Leaves were then transferred to filter paper moistened with lactoglycerol (1:1:1, lactic acid:glycerol:water,
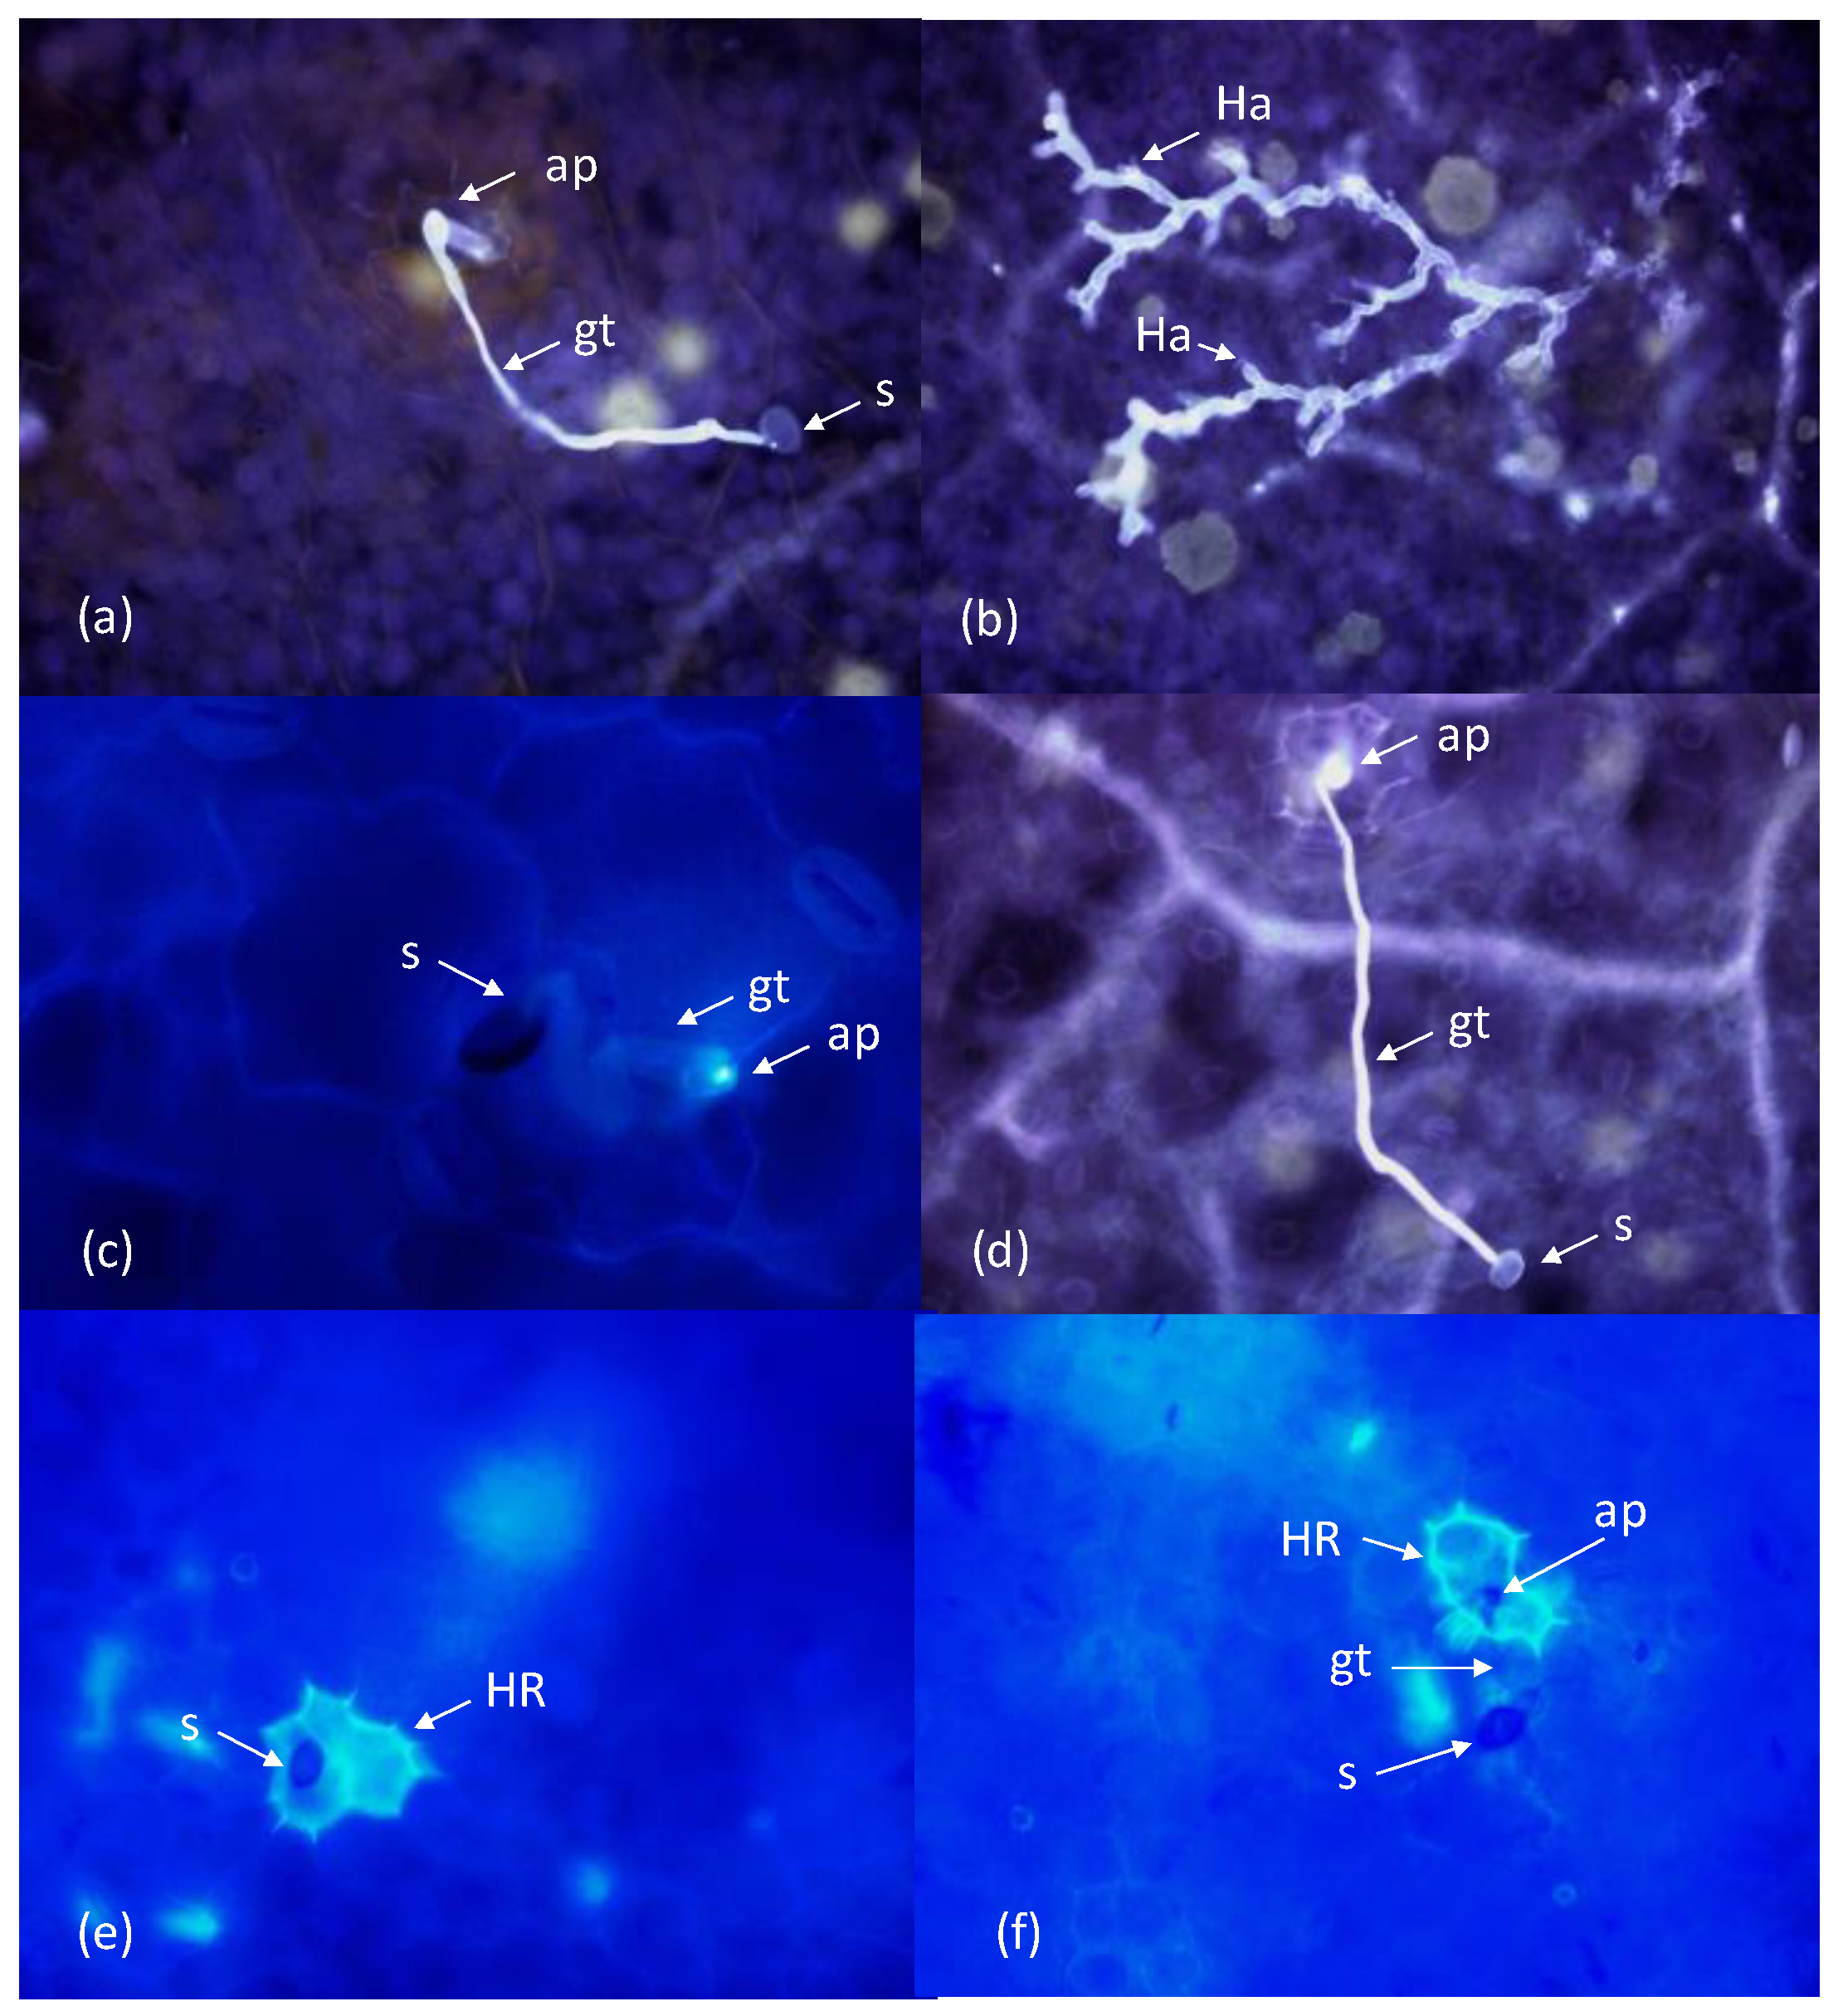
v/v). Afterwards, to avoid the washing of ungerminated spores, samples were sprayed with 0.1% trypan blue in water and observed, without coverslip, under an Optika Brightfield microscope. In each sample, percentages of germinated spores and germinated spores that formed an appresorium were calculated.
The protocol described by Díez-Navajas et al. (2007) [
16] to observe the infection structures of
Plasmopara viticola in grapevine was used in our study to score
P. variabilis penetration and mesophyll colonization. In this case, leaves were sampled at 36 hai, because at 48 hai colonies on susceptible lines were extremely well developed with hyphae of neighbouring colonies becoming intertwined, making developmental assessments complex and inaccurate. Staining was carried out by incubation of leaves for 15 min at 95 °C in 1 M KOH, followed by three 15-min rinses in water and a 15-min soaking in 0.05% aniline blue in 0.067 M K
2HPO
4 pH 9–9.5. After staining, samples were observed with UV light incident fluorescent microscopy (390 nm excitation/420 nm emission; Optika Brightfield, HBO fluorescence microscope). The frequency of successful colony establishment was determined by observation of spores forming appressoria. A colony was considered to be stablished when secondary hyphae were observed. Colony size was determined in twenty established colonies by counting the number of hyphal tips per colony.
To detect HR as a result of pathogen attack, leaves were sampled at 48 hai and fixed and cleared using the protocol described above for observation of superficial structures of P. variabilis, with the difference that samples were observed under UV light and stained with a drop of 0.01% aniline blue. Epidermal cells that were located under P. variabilis spores or appressoria and had died as a result of the pathogen attack were identified by whole-cell autofluorescence.
2.4. Data Analyses
Analysis of variance (ANOVA) was performed using the Statistix 8.0 statistical package (Analytical Software, Tallahassee, FL, USA). Normality of residuals, equality of variances and non-additivity criteria were checked using the Shapiro–Wilk, Bartlett, and Tukey one degree of freedom tests, respectively. Prior to ANOVA, the number of tips per colony, % failed colonies associated with HR, and AUDPC were transformed according to arcsine √x/100, log10 x, and square root x, respectively. When significant differences were found, comparisons of means were performed using Dunnett’s Multiple Comparisons with Control test, considering accession PI614907 as the susceptible control. Null hypotheses were rejected when
p < 0.05. Correlation analyses were carried out using Pearson’s correlation coefficient. Broad-sense heritability of final disease severity was estimated using data from accessions recorded in both 2019 and 2022 seasons as reported by Toker (2004) [
17]:
In this way, broad-sense heritability was estimated as genotypic variance/phenotypic variance:
h2 = σg2/σp2
The phenotypic variance was σp2 = σg2 + (σgy2/y) + (σe2/ry), where y, g, and r are the year, genotype, and replication, respectively, while σg2 and σσe2 are components of variance for genotypes and error, respectively.
Variances were estimated as follows:
σg2 = M3 – M2/yr
σgy2 = M2 – M1/r
σe2 = M1
To obtain the M1, M2, and M3 values, a factorial ANOVA considering year and genotype as factors and FDS as the dependent variable was performed using FDS data obtained in 2019 and 2022. M1, M2, and M3 are the mean squares corresponding to the sources error, genotype x year, and genotype, respectively, obtained in this factorial ANOVA.
4. Discussion
Our study shows that downy mildew can severely affect quinoa crops in Córdoba. Specifically, in the 2019 and 2022 seasons susceptible accessions showed more than 70% of disease severity at final disease assessment. Fortunately, our work shows that effective genetic resistance exists in the quinoa germplasm.
C. quinoa accessions showing different levels of incomplete resistance and other accessions that were completely resistant and showed no symptoms were identified within our collection. These accessions are valuable sources of genetic resistance for the sustainable control of quinoa downy mildew in our conditions. Interestingly,
C. opulifolium accession CHEN 43 and
C. ugandae accession CHEN 77 showed complete resistance, in agreement with previous studies reporting that resistance to
P. variabilis is present in these accessions [
10]. Regarding
Chenopodiun berlandieri subs.
nutillae species, in our field experiment, as well as in a field screening carried out by Aydogdu and Koc (2021) [
7] in Turkey, accession PI476820, belonging to this species, showed a level of incomplete resistance (reaching 30% FDS in our study). In the study carried out by Kumar et al. [
10], the two
Chenopodiun berlandieri subs.
nutillae accessions included in their screening showed no symptoms. Therefore, all these findings suggest that different levels of resistance to
P. variabilis are present in the
C. opulifolium and
Chenopodiun berlandieri subs.
nutillae species.
Disease assessments were highly correlated between seasons, showing the consistency of the results obtained and the similarity of the pathogen population among seasons. Values of AUDPC and FDS were highly correlated in both seasons, and broad-sense heritability was high (95%) for FDS, indicating that the latter is a valid and accurate variable for identifying and selecting accessions carrying resistance to the pathogen. However, because quinoa shows leaf yellowing and defoliation at senescence, special care has to be taken to finish disease assessments when senescence begins. In fact, in our study, several evaluations were accomplished to select the most adequate and accurate date for the final disease assessment.
As previously suggested [
11], our results suggest that a diversity of virulences and/or races exists in
P. variabilis. Several of the accessions included in our field experiments have been evaluated for resistance to
P. variabilis in Turkey [
7] and India [
10], with contrasting reactions to
P. variabilis being observed depending on the country. Thus, accessions Ames13760, PI510542 and PI510545 showed complete resistance in our conditions, while they were highly susceptible in Turkey. Similarly, accession PI614881 was completely resistant in Spain, susceptible in India (Kumar et al. 2006), and only moderately resistant in Turkey. On the other hand, accessions PI614917, PI470932, and PI510536 were highly susceptible in our experiments and moderately resistant in Turkey, and accession CHEN 67 was highly susceptible in Spain and completely resistant in India. Therefore, although differences in environmental conditions between locations may cause variations in the response of a particular quinoa accession to downy mildew, the opposite reactions observed in accessions in different countries (complete resistance vs. high susceptibility) suggest the presence of different
P. variabilis races in different regions. Consequently, local screenings are mandatory in order to identify those accessions showing effective resistance in each particular region.
Although several studies have identified quinoa accessions showing resistance to
P. variabilis [
6,
7,
8,
9,
10], little is known about the resistance mechanisms acting against this important disease. Differences in macroscopic variables such as incidence, severity, and latent period have been reported within quinoa accessions; however, knowledge about the
P. variabilis–
C. quinoa pathosystem at the histological level is scarce. Here, we describe a set of histological methods that allow the observation and quantification of the different stages of
P. variabilis infection process (germination, appressorium formation, penetration, mesophyll colonization) using bright field and fluorescence microscopy. We successfully used these protocols to characterize the resistance mechanisms acting in a group of resistant accessions. Infection processes of
P. variabilis in resistant and susceptible accessions of quinoa have been previously described using a scanning electron microscopy (SEM) [
18]; however, SEMs are expensive and often unaffordable for research teams. Our results prove that resistance against
P. variabilis acts mainly at the colony establishment stage. Even though no significant differences in germination and apressorium formation between accessions were observed, the success of colony establishment was reduced or even null in resistant accessions compared with the susceptible control, in which more than 67% of spores forming appresorium were able to penetrate and form secondary hypha and haustoria in the host mesophyll. We observed that
P. variabilis usually penetrates its host through stomata, as previously reported [
8,
18]; here, our important finding is that
P. variabilis is able to penetrate the host epidermis through a cuticle or between two epidermal cells as well (
Figure 3).
Kitz et al. [
18] reported greater amounts of sporangiophores on the leaf surface and hyphal strands and haustoria in mesophyll tissues in resistant cv. Chucapaca compared with susceptible cv. 0654. A low number of hyphal strands and haustoria in resistant quinoa might be caused by a lower number of colonies established or by a smaller size of colonies formed, although this was not addressed in the work carried out by Kitz [
18]. According to our results, and because the size of the few colonies successfully established was not significantly reduced in the resistant accessions compared with the susceptible control, colony abortion seems to be the main reason for the lower mesophyll colonization observed in resistant accessions.
Hypersensitive response, which is a pathogen-induced cell death process at the site of infection that limits pathogen growth, is a common resistance mechanism against biothrophic pathogens [
19]. Our study proves, for the very first time, the occurrence of HR in the
P. variabilis–
C. quinoa interaction. Moreover, we provide a histological protocol that is suitable for HR quantification. Our study shows that HR has a relevant role in the colony abortion observed in several of the resistant accessions studied. Thereby, while only a small percentage of failed colonies were associated with host epidermal cell death in the susceptible control, this percentage was high in accessions Ames 13745, PI596498, PI634922, PI614884, Ames 13762, cvs. Kancolla, and F16. HR usually occurred under an appressorium, though in a few cases we observed that the cells located under spores without visible appressorium were dead as well. This is surprising, because in other pathosystems HR typically occurs after the pathogen has penetrated the plant cell, and therefore after appressorium formation. Therefore, we can not rule out the possibility that those cases where HR was observed under a spore without any visible appressorium were caused by spores that formed their appressorium just below the spore, making the appresorium invisible. The occurrence of HR in the
P. variabilis–
C. quinoa interaction had been suggested by several authors who visually observed that resistant lines showed only a few small spots and no sporulation after
P. variabilis infection [
6,
11]; however, it has not been histologically demonstrated before.
HR is the result of the recognition of pathogen effectors by the plant, unleashing effector-triggered immunity (ETI), and is activated by R-genes. In our experiment, we identified accessions with resistance that was characterized by lower success in colony establishment, which was associated with a hypersensitive response. In these accessions, resistance is most probably controlled by R-genes. In agreement with this, we have already reported the presence of major genes controlling downy mildew resistance in quinoa [
20]. Breeders prefer single gene-controlled resistance to polygenic resistance, as it is easy to incorporate into susceptible material through simple backcrossing. However, experienced gained in other pathosystems suggests that resistance based on a single gene is more easily overcome by evolution of pathogen virulence. Therefore, in order to increase the durability of resistance, several resistance genes should be combined into a single variety. Alternatively, several varieties carrying different resistance genes may be cultivated in the same region. Furthermore, in order to provide additional barriers to pathogen development, combining different resistance mechanisms is desirable. In our histological study we identified a set of accessions showing a high resistance level and not showing HR. Therefore, the mechanisms acting in these lines, and probably the genes controlling them, are different. These could be combined with HR resistance to increase resistance durability. Further studies are needed to clarify the mechanism acting in these lines. Chemical or physical barriers hampering pathogen growth could be involved. Donofrio and Delanay [
13] observed interaction with the oomycete
Peronospora parasitica in
Arabidopsis thaliana, causing downy mildew disease in this species via haustoria surrounded by thick callose encasements. We applied a staining technique used by Donofrio and Delanay [
20] to detect callose depositions that could act as physical barriers to pathogen development; however, both,
P. variabilis structures and callose, showed fluorescence using this method, making it difficult to distinguish callose from pathogen structures.
On the other hand, polygenic resistance controlled by minor genes is expected to be more durable than resistance based on a single major gene, as it cannot be easily broken by a single mutation of the pathogen. A quantitative mode of inheritance of resistance to
P. variabilis has been suggested by other authors [
6,
21]. Therefore, both major and minor genes may be involved in the control of resistance to this pathogen in quinoa depending on the accession. In our study, we identified a set of accessions showing different levels of incomplete resistance. Several accessions showed only a few symptoms, which could be controlled by major genes conferring incomplete resistance or influenced by the environment. However, other accessions displayed moderate resistance levels. The quantitative resistance present in these lines is expected to be controlled by several minor genes, and for this reason is expected to be more durable. In spite of this, the difficulty in transferring polygenic resistance to other varieties should be taken into account in breeding programs. Further studies, several of which are currently in progress, are needed to unravel the genetic control of the different levels of resistance identified in our study.

 ,
, 


