Article

Synergistic Effects of N Fertilization and Irrigation on Soil Bacterial Community in Super Rice Paddies

1
Key Laboratory of Arable Land Quality Monitoring, Evaluation Ministry of Agriculture and Rural Affairs, College of Environmental Science and Engineering, Yangzhou University, Yangzhou 225000, China
2
Zhenjiang Agricultural Technology Extension Station, Zhenjiang 212009, China
*
Author to whom correspondence should be addressed.
Agronomy 2023, 13(12), 2856; https://doi.org/10.3390/agronomy13122856
Submission received: 13 September 2023 / Revised: 4 November 2023 / Accepted: 11 November 2023 / Published: 21 November 2023

Abstract

:
Nitrogen reduction, in association with increased planting density and irrigation management, has been widely adopted in super rice cultivation systems to pursue higher yield with lower input. Here, soil microbial community structures under accurate N and water management were investigated after four years of experiments. Plot experiments were conducted with three treatments, including conventional farming practice (CF), reduced nitrogen with increased plant density (RNID), and reduced nitrogen with increased plant density and precise irrigation (RNIDPI). The results showed that RNID treatment increased soil bacterial diversity, enriched biomarker bacterial taxa, and altered bacterial community structure, with pH as the influential factor. The phylum Chloroflexi was enriched in the treatment of N reduction, while a higher ratio of Firmicutes was present in CF treatments. RNID treatment witnessed a low proportion of bacterial functional groups involved in nitrification and nitrate reduction. N fertilizer reduction with irrigation management increased rice yield (up to 22%) without changing the major soil fertility properties except for the increased pH and decreased ammonium N. The results suggest that N reduction, in association with increased plant density and accurate irrigation, is beneficial for super rice production.

1. Introduction

Rice (Oryza sativa L.) is a major food for over half of the world population, accounting for 21.64% of the total crop planting area. According to the FAO, 757 million tons of rice were produced on 2.463 billion acres of growing area worldwide in 2020. China has 451 million acres of rice-growing land, making up approximately 18.31% of the global market [1]. To meet the demands of expanding population, super rice varieties, with great yield potential [2], have been produced and developed rapidly in China over the last few decades [3,4]. Super rice cultivars can increase the yield by 15–20% as compared to common rice cultivars [5].
It is commonly known that these super rice varieties require high nitrogen (N) input in order to achieve high yield, with a N application dosage of more than 350 kg N ha−1 needed [6]. High fertilization input, especially of N [7], has long been adopted to achieve high rice yield and quality, which, however, has resulted in low nitrogen use efficiency (NUE) and detrimental environmental effects [8,9,10]. These include the release of greenhouse gas, specifically N2O, soil deterioration, waterbody pollution by nitrate leaching and runoff, loss of biodiversity, and more. The Yangtze Delta region [11] in China, where rice is the principal crop, is particularly known for its intensive nitrogen use combined with poor NUE (about 31%). With the policy of “double reduction”, it is crucial for sustainable development to seek for alternative N fertilization modes to keep high rice yield while improving NUE [12,13].
Soil microorganisms are essential to ecosystem function by regulating soil nutrient turnover, maintaining soil health and influencing crop productivity [14,15]. Studies showed rice yield may be affected by the rhizospheric microbial community [16,17,18]. This may be related to microbial N transformation [19,20]. The N cycle is predominately mediated by soil microbes, with the corresponding functional genes involved in the transformation of different nitrogen forms, such as NH4+, NO3, and N2O [14], which might have affected rice yield [21]. However, soil microbes are rather sensitive to anthropogenic disturbance [22] and their structure and functions are often affected by farming practices [23]. It has been reported that fertilization application affects soil microbial community composition as well as plant growth [24].
Alternate wetting and drying (AWD) have been demonstrated to increase N availability by coordinating the source–sink relationship [19,25,26]. AWD may also have a significant impact on soil microbes and nutrient contents. AWD reduce CH4 emissions [27] and regulate rhizospheric bacterial community and corresponding functions [28,29] and the mixture of both ammonia (NH4+) and NO3, beneficial for rice growth [30,31,32]. Previous research revealed that AWD had contradictory effects on soil nitrogen loss and NUE [19,33]. Moderate drying–wetting increase mineralization of soil organic matter and soil fertility, beneficial to the soil microbial community [34], but the drying process might also affect soil microbial diversity and plant productivity adversely [26].
After years of experiments, precise irrigation was determined to be the optimal approach for AWD [35]. By matching nitrogen and water supply with the crop growth demand, this could maintain rice yield while lowering N input and environmental risk [36,37], through enhancing physiological activities of rice plants [5]. However, little is known about how these activities affect the soil microorganisms, particularly in “super” rice cultivation systems.
With a total area of 1.98 × l07 hectares, the Yangtze Delta region represents one of China’s major rice production regions in China [38]. Extensive research has been conducted on the NUE of rice under various integrated farming practices in this region [21]. However, little attention has been received concerning the integrative effects of N input rate and irrigation regime on soil bacterial communities in super rice cultivation. The purpose of this study was to examine the alterations in soil bacterial community and function following four years of integrated N management. The hypotheses were that 1. N reduction and plant density increases would significantly affect bacterial community in super rice fields; 2. precise irrigation would affect rice yield through altering bacterial community composition.

2. Materials and Methods

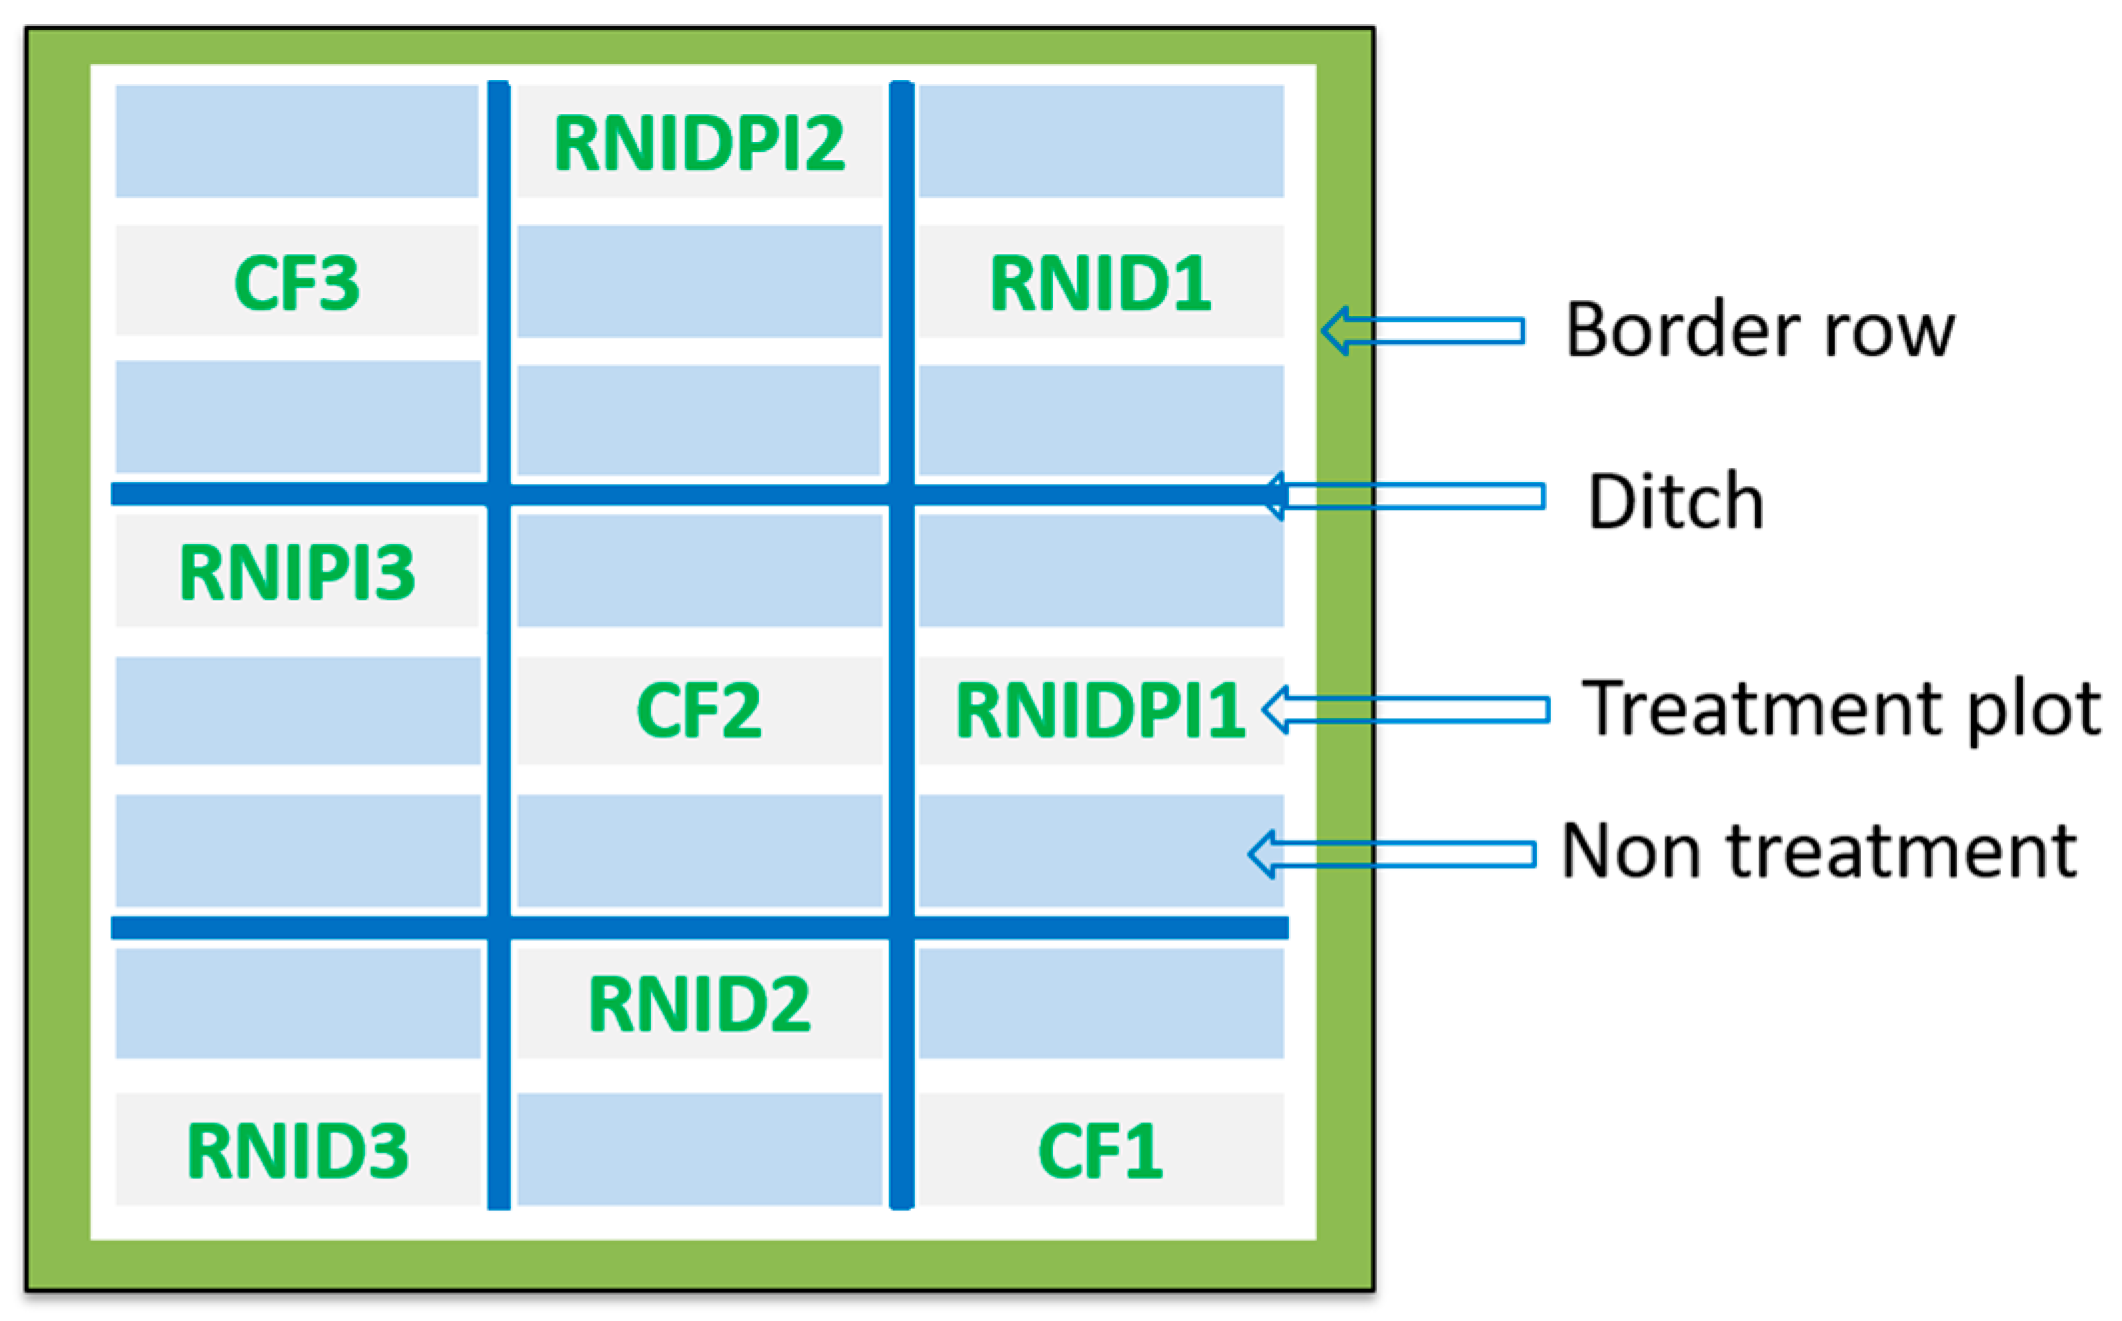
2.1. Study Site and Experimental Setup

The five-year field experiment with application of different nitrogen rates and irrigation management was commenced at a research farm of Yangzhou University, Jiangsu Province, China (32°30′ N, 119°25′ E). This region has a warm temperate monsoon climate, with average annual precipitation and average annual temperature 1049.4 mm and 14.8 °C, respectively. The soil is classified as a sandy loam soil according to the Chinese Soil Classification System. The basic soil properties included organic matter 24.4 g kg−1, alkali-hydrolyzable N 105 mg kg−1, available phosphorus (P) 34.3 mg kg−1, and available potassium (K) 68.2 mg kg−1. The experiment lasted for four consecutive years and samples were taken each year.
The experiment was conducted in a completely random block (5 m × 4 m) design comprising three treatments with three replications (Figure 1). The treatments were as follows: (1) conventional fertilization (CF, the local farmers’ practice of the Yangtze River Basin area) with N application at 300 kg hm−2 (with plant row spacing of 10.7 cm × 30 cm); (2) reduced N application in combination of increased density (RNID), with N application at 270 kg hm−2 where the planting density was increased by ~25% (with plant row spacing of 13.3 cm × 30 cm); and (3) reduced N application, increased density, and precision irrigation (RNIDPI). To achieve precise irrigation, a shallow water layer was maintained from the transplanting to seedling establishment stage of rice, followed by periodically drying–wetting till the first two leaf stages (N − n − 2), where N denotes total leaf number of main stem, n denotes elongation internode number of main stem, with the lower soil water potential limit at 10 kPa; then, the field was drained and dried from the (N − n − 1) to (N − n) leaf stage, with the lower soil water potential limit at 20 kPa; alternate dry and wet irrigation was applied from the (N − n + 1) leaf stage to beginning of the top third leaf, with the lower soil water potential limit at −10 kPa; from end of top third leaf extraction to 10 days after heading gap moist irrigation was adopted, with low soil water potential limit of −10 kPa; a second alternate dry and wet irrigation was applied 11 days to 45 days after heading, with the lower soil water potential limit of −15 kPa. In each growth period, 2–3 cm shallow water was irrigated when the low limit was reached. The plots were separated by an alley 1 m wide with a 0.5 m high barrier formed by inserting plastic film into the soil, in order to prevent water from each plot from mixing.
For all treatments, phosphate (90 kg ha−1 in the form of CaP2H4O8) and potassium (120 kg ha−1 in the form of KCl) were applied to the experimental field as the basal fertilizer before transplanting. The nitrogen fertilizer in the form of urea was applied with a ratio of 5:2:2:1 for CF treatment and of 4:2:2:2 at pre-transplanting, mid-tillering, panicle initiation, and spikelet differentiation stages, respectively, for the rest of the treatments.
The rice cultivar was “super” rice (Oryza sativa L.) Wuyunjing 24. The seedlings were transplanted into the experimental field around the middle of June in 2016, 2017, 2018, and 2019 and harvested in the middle of October. Rice seedlings were transplanted at two seedlings per hill at a hill spacing of 12.8 cm × 25 cm for RNID and 16 cm × 25 m for the rest of the treatments.

2.2. Determination of Soil Properties

The soil samples were taken at the harvest stage of rice each year, in the middle of October. Soil samples were collected at a depth of 0–20 cm. The soil surface was cleared before sampling and 12 replicate soil samples (2.5 cm in diameter) were taken from each plot following an “S” route, homogeneously mixed. The soil samples were divided on the spot into two portions, one was transported to the laboratory immediately on dry ice and stored at −80 °C for DNA analysis. The other portion was air dried for the determination of soil chemical properties.
Standard test methods were used to quantify basic chemical properties including the following. First, the air-dried samples were ground and sieved (0.15 mm). The soil sample was mixed with deionized water at a ratio of 1:2.5 for pH determination (Sanxin S731, Shanghai San-Xin Instrumentation Inc., Shanghai, China). Soil nitrate, ammonium, alkali-hydrolyzable N, available phosphorus and potassium, soil organic matter, and electric conductivity were determined following the classical procedure in [39]. SOC was determined using the potassium dichromate volumetric-external heating method; the contents of NO3-N and NH4+-N were extracted with 2 mol L−1 KCl and measured with a UV spectrophotometer. Alkaline-hydrolyzable N was measured using the alkaline hydrolysis diffusion method, available phosphorus was measured using the molybdenum–antimony anti-colorimetric method, and available potassium was measured using the flame photometry method.

2.3. Rice Yield Component Determination

For the determination of rice yield components, 100 rice plants were randomly collected from each treatment plot, and the number of panicles, number of spikelets per panicle, and grain weight were determined, based on which the yield was calculated [40].

2.4. Bacterial Community Analyses

Total genomic DNA was extracted from each soil sample using the MoBio PowerSoil DNA Isolation Kit (QIAGEN Inc., Valencia, CA, USA) according to the manufacturer’s instructions. The concentration and purity of the DNA extracts were assessed with a NanoDrop spectrophotometer (NanoDrop Technologies, Wilmington, DE, USA).
Universal bacterial primers 338F (5′-ACTCCTACGGGAGGCAGCAG-3′) and 806R (5′-GGACTACHVGGGTWTCTAAT-3′) were used to amplify the hypervariable V3∼V4 regions of 16S rDNA. A polymerase chain reaction (PCR) system included a 25 μL mixture containing 10 μL of Milli-Q water, 5 μL of 5 × FastPfu Buffer, 2 μL of 2.5 mM dNTPs, 1.0 μL of primer 338F (5 μM), 1.0 μL of primer 806R (5 μM), 0.5 μL of FastPfu Polymerase, 10 ng of purified template DNA, and 0.25 μL of BSA. The amplification conditions were as follows: DNA denaturation at 94 °C for 3 min, followed by 30 cycles of amplification (94 °C for 45 s, 50 °C for 45 s, and 72 °C for 45 s), and final extension for 10 min at 72 °C. The PCRs were performed in triplicate. The PCR products were gel purified using the AxyPrepDNA Gel Extraction Kit (Axygen Biosciences, Union City, CA, USA) and quantified using QuantiFluor™-ST (Promega, Madison, WI, USA) according to the manufacturer’s instruction. The sequencing of the purified PCR products was conducted on an Illumina MiSeq platform (Illumina, San Diego, CA, USA) by Majorbio Bio-Pharm Technology Co., Ltd. (Shanghai, China) according to the standard protocols.

Data Analyses

The raw sequences from the Illumina Miseq platform were analyzed using Mothur package V1.30.2. The chimeric sequences and singletons were removed and the quality sequences were aligned to the 16s rRNA database SILVA138 (https://www.arb-silva.de/, accessed on 18 July 2022) to acquire the taxonomic information of bacterial communities. Operational taxonomic units (OTUs) were clustered with a 97% similarity level. Normalization of the number of sequences in each sample was performed and bacterial diversity estimator indices were generated based on the OTU counts.
Bacterial alpha diversity was estimated using the observed number of species (Sobs), abundance-based coverage estimator (ACE), and Shannon diversity index. One-way ANOVA followed by Tukey’s HSD test was performed to test the difference in bacterial alpha diversity indices between treatments, and p < 0.05 was considered as significantly different. To visualize the distribution patterns in bacterial community composition in different treatments, non-metric multidimensional scaling (NMDS) analysis was applied based on Bray–Curtis distance matrices [41]. Analysis of similarities (ANOSIUM) was applied to calculate the statistical difference among the samples. Linear discriminant analysis effect size (LEfSe) analysis was performed to identify the biomarker bacterial taxa on the basis of a Kruskal–Wallis (KW) sum-rank test. A p-value < 0.05 was adopted to demonstrate statistical significance. Distance-based redundancy analysis (db-RDA) was performed to evaluate the influence of major soil parameters on the rice yield component and the bacterial community structure, together with a permutation test using the envfit function which was applied to assess the significance of individual environmental factors. A heatmap of Spearman correlation was created to reveal the correlation between the abundant bacterial phyla and soil variables. Finally, PICRUSt was used to predict the potential function and pathways of the bacterial communities in different treatments.
The differences in soil physiochemical parameters and rice yield components among the treatments were tested using ANOVA with statistical software SPSS 26.0 (IBM SPSS Statistics).

3. Results

3.1. Soil Fertility Parameters and Rice Grain Yield

Table 1 shows that the soil pH ranged from 6.78 to 7.02, with the lowest in conventional farming treatment (CF) and the highest in RNIDPI treatment. Compared to CF, soil ammonium (A_N) contents in RNIPD and RNIDPI were significantly lower. In comparison to RNID and CR, soil alkali-hydrolyzable N (K_N) was significantly higher in RNIDPI. No discernible variation was detected in the levels of soil organic matter (OM), total nitrogen (T_N), available potassium (A_K), and nitrate (N_N) across all treatments.
Both RNID and RNIDPI treatments increased rice yield, by 1% and 14%, respectively, even with a lower nitrogen input (Table 2). The number of spikelets and grains per spikelet increased, which were the primary causes of the rise. Both rice yield and corresponding rice yield components were significantly increased.

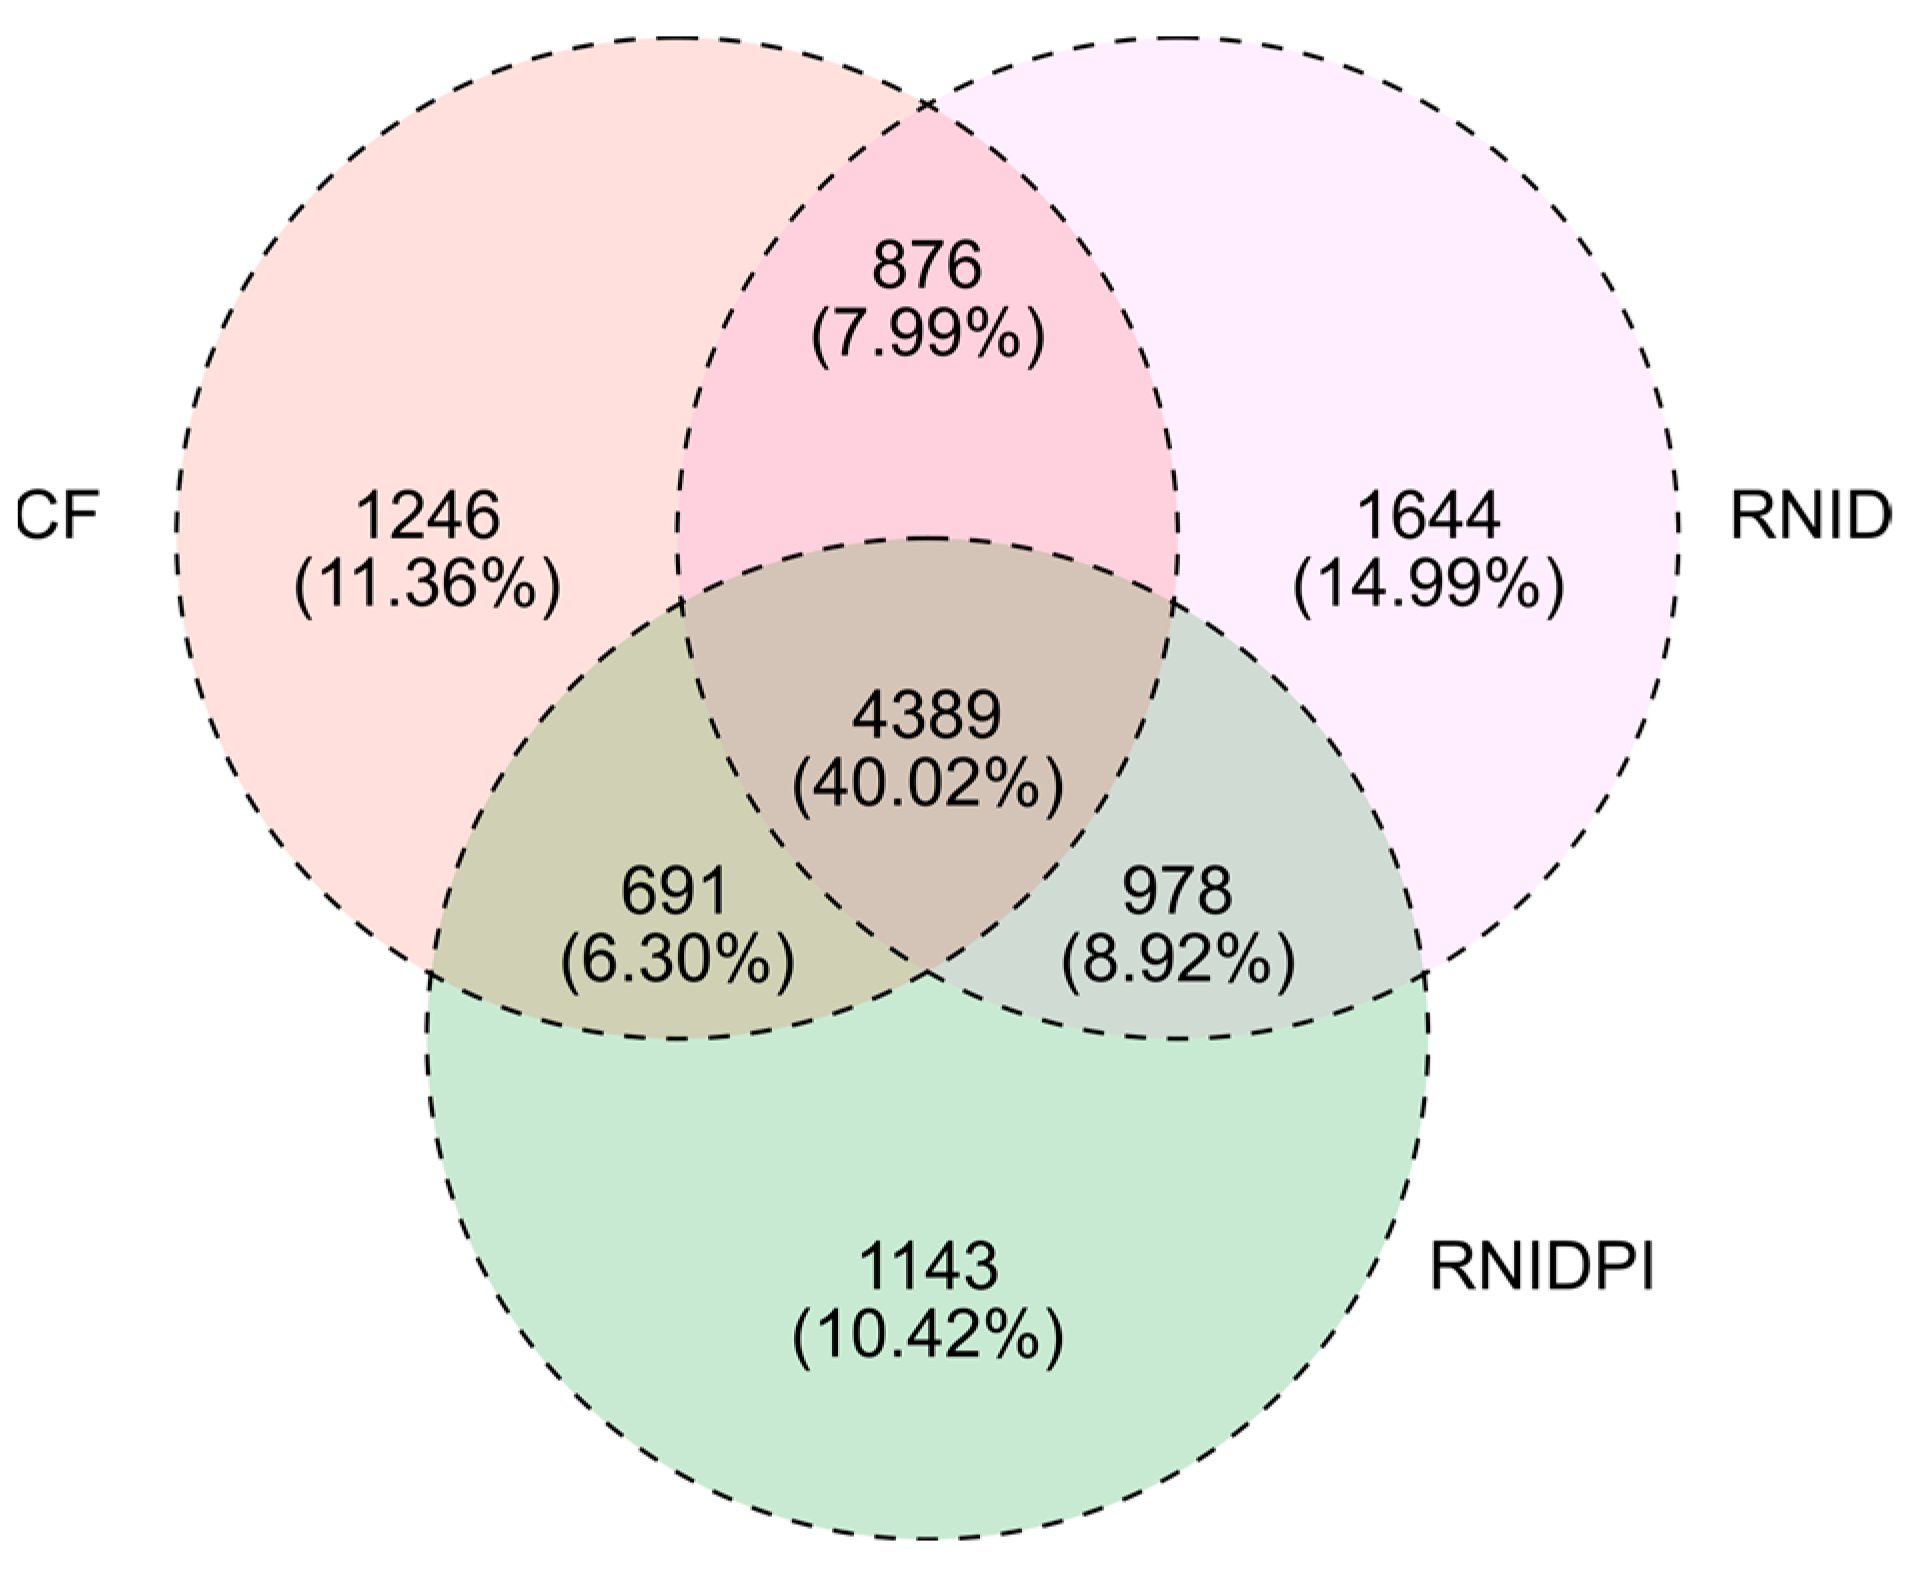
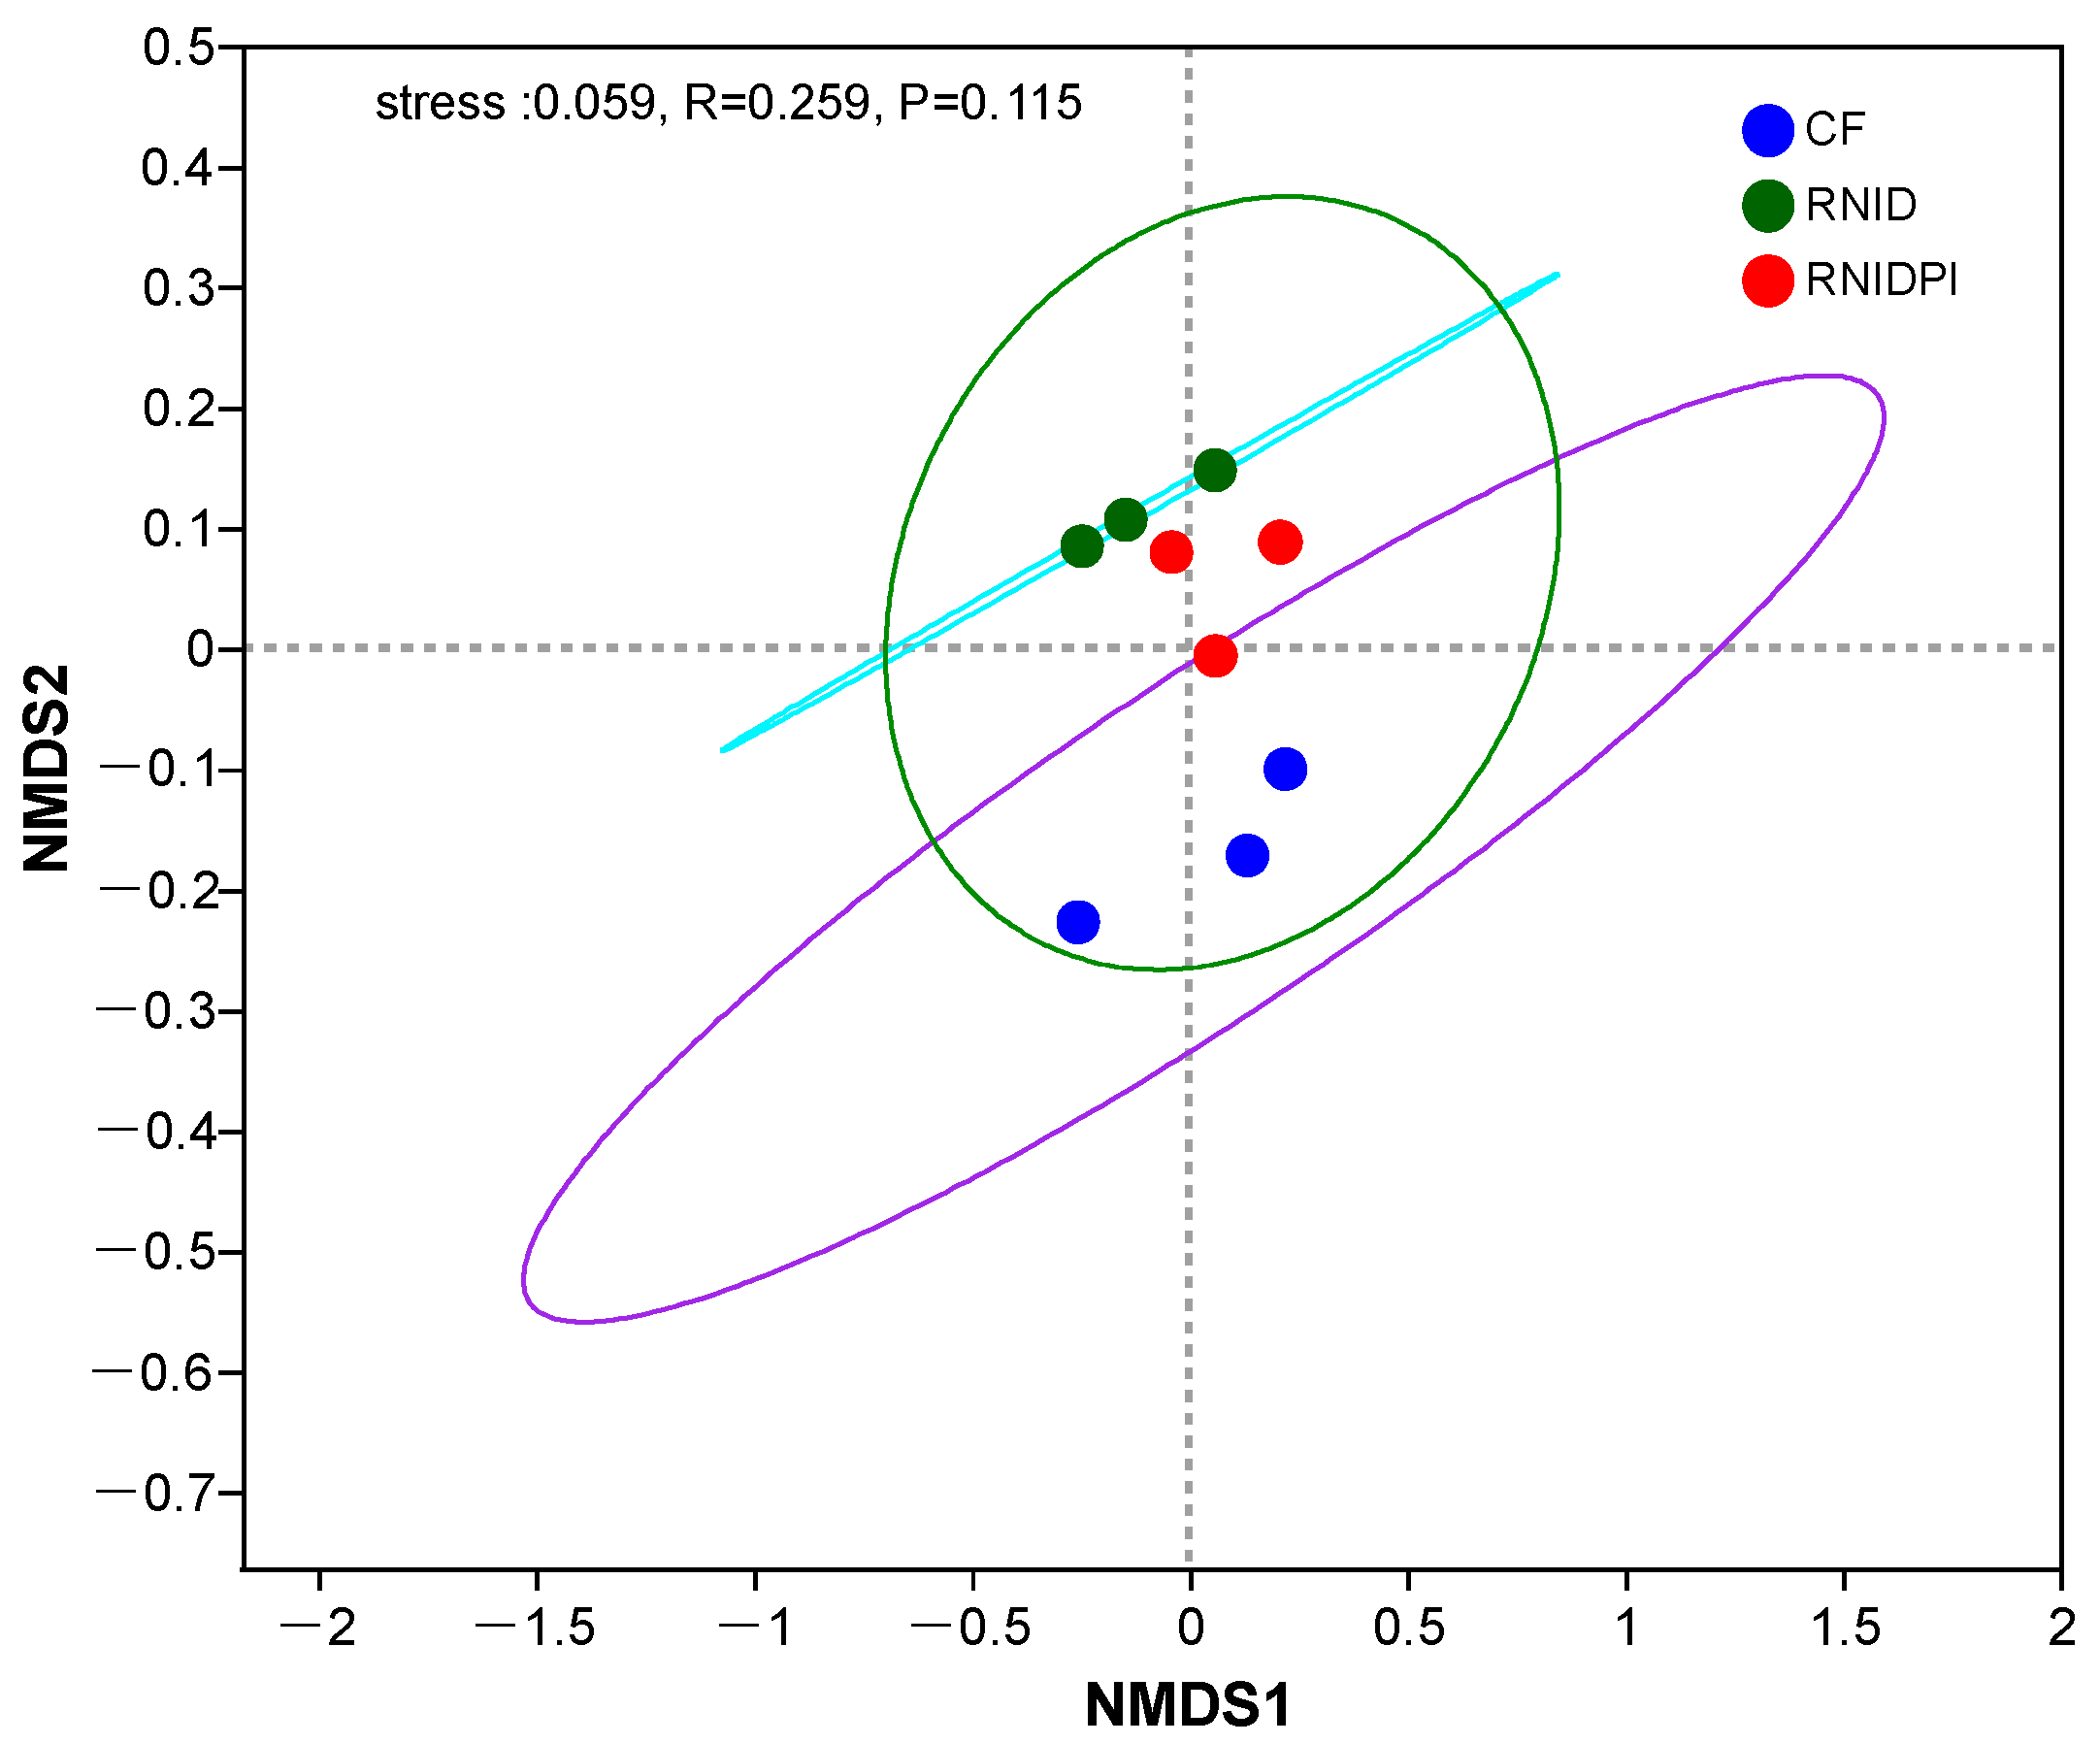
3.2. Distributions and Diversities of Soil Bacterial Taxa in Different Treatments

A total of 438,739 qualified raw reads were achieved from nine samples, with an average length of 434 bp. At a 97% identity level, 10,907 operational taxonomic units (OTUs) were assigned. Venn diagram analysis showed that the number of core OTUs shared by the three treatment was 4389 (Figure 2). Up to 15% of all sequences had distinct OTUs in RNIDPI treatment.
The Sobs, ACE, Shannon index, and coverage were calculated to evaluate the soil bacterial alpha diversity (Table 3). Generally, RNID treatment had higher richness and evenness indices than the other treatments. Both Sobs and Shannon indices were significantly higher in RNID than in CF treatments (p < 0.05). The coverage indices of the samples were higher than 92%, indicating that the sequencing data were sufficient to represent the bacterial communities.
A non-metric multidimensional scaling analysis (NMDS) plot was generated based on OTU ratio to visualize the variation of microbial communities among the treatments (Figure 3). With stress value of 0.059, the clustering results are representative. The bacterial community composition in CF treatment was clearly separated from that of RNID and RNIDPI. The result of ANOSIM similarity analysis based on Bray–Curtis calculation showed that there were significant differences in the bacterial structures across the treatments (p < 0.05, R = 0.62).

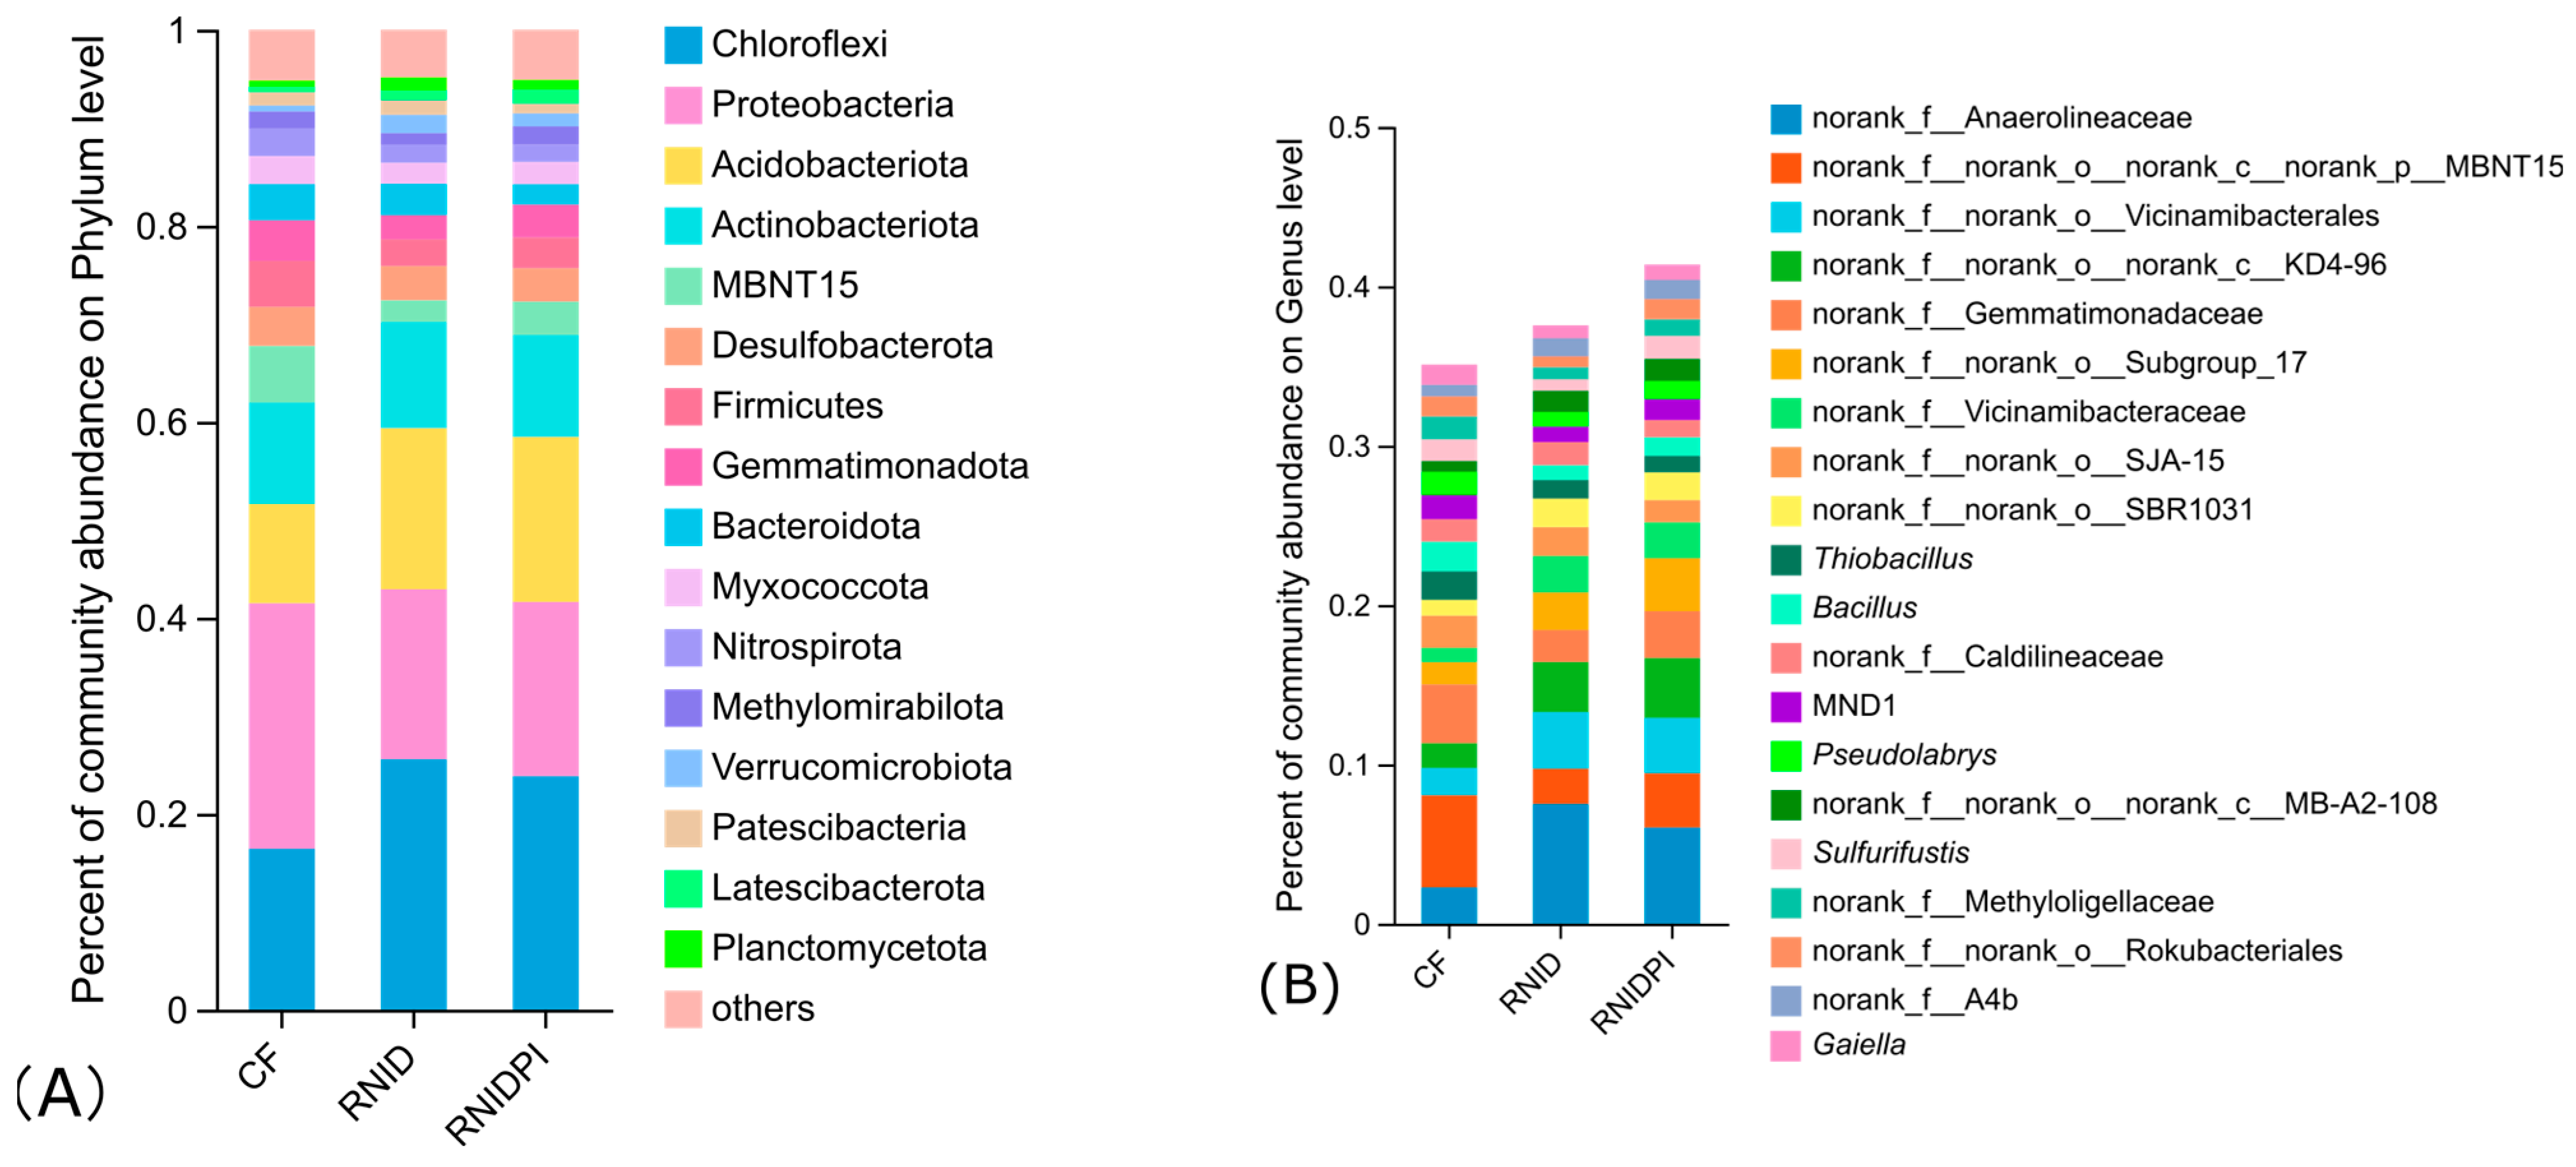
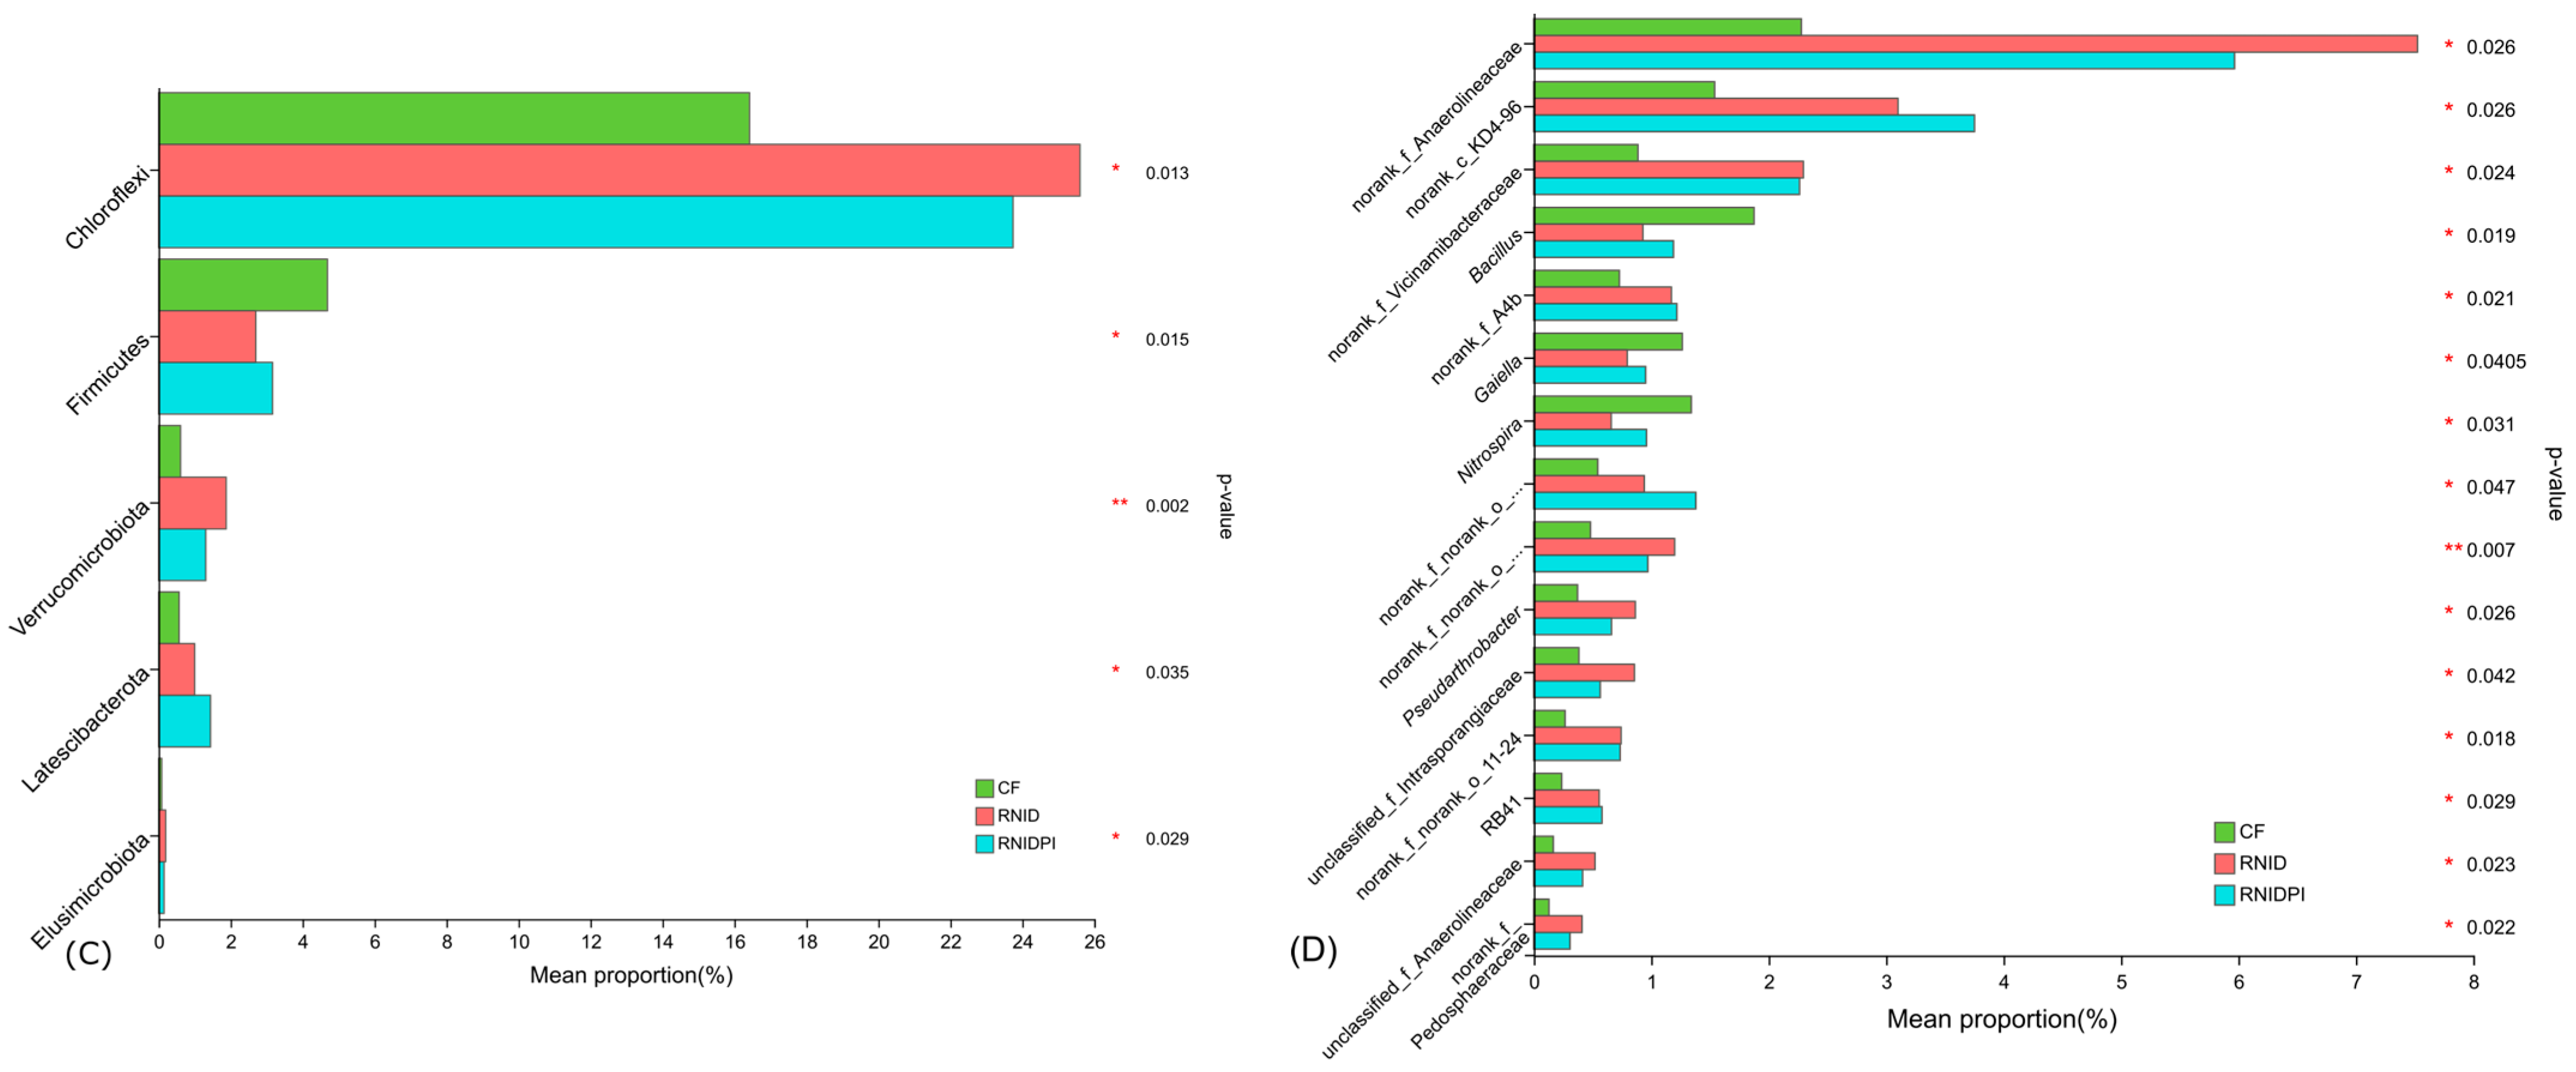
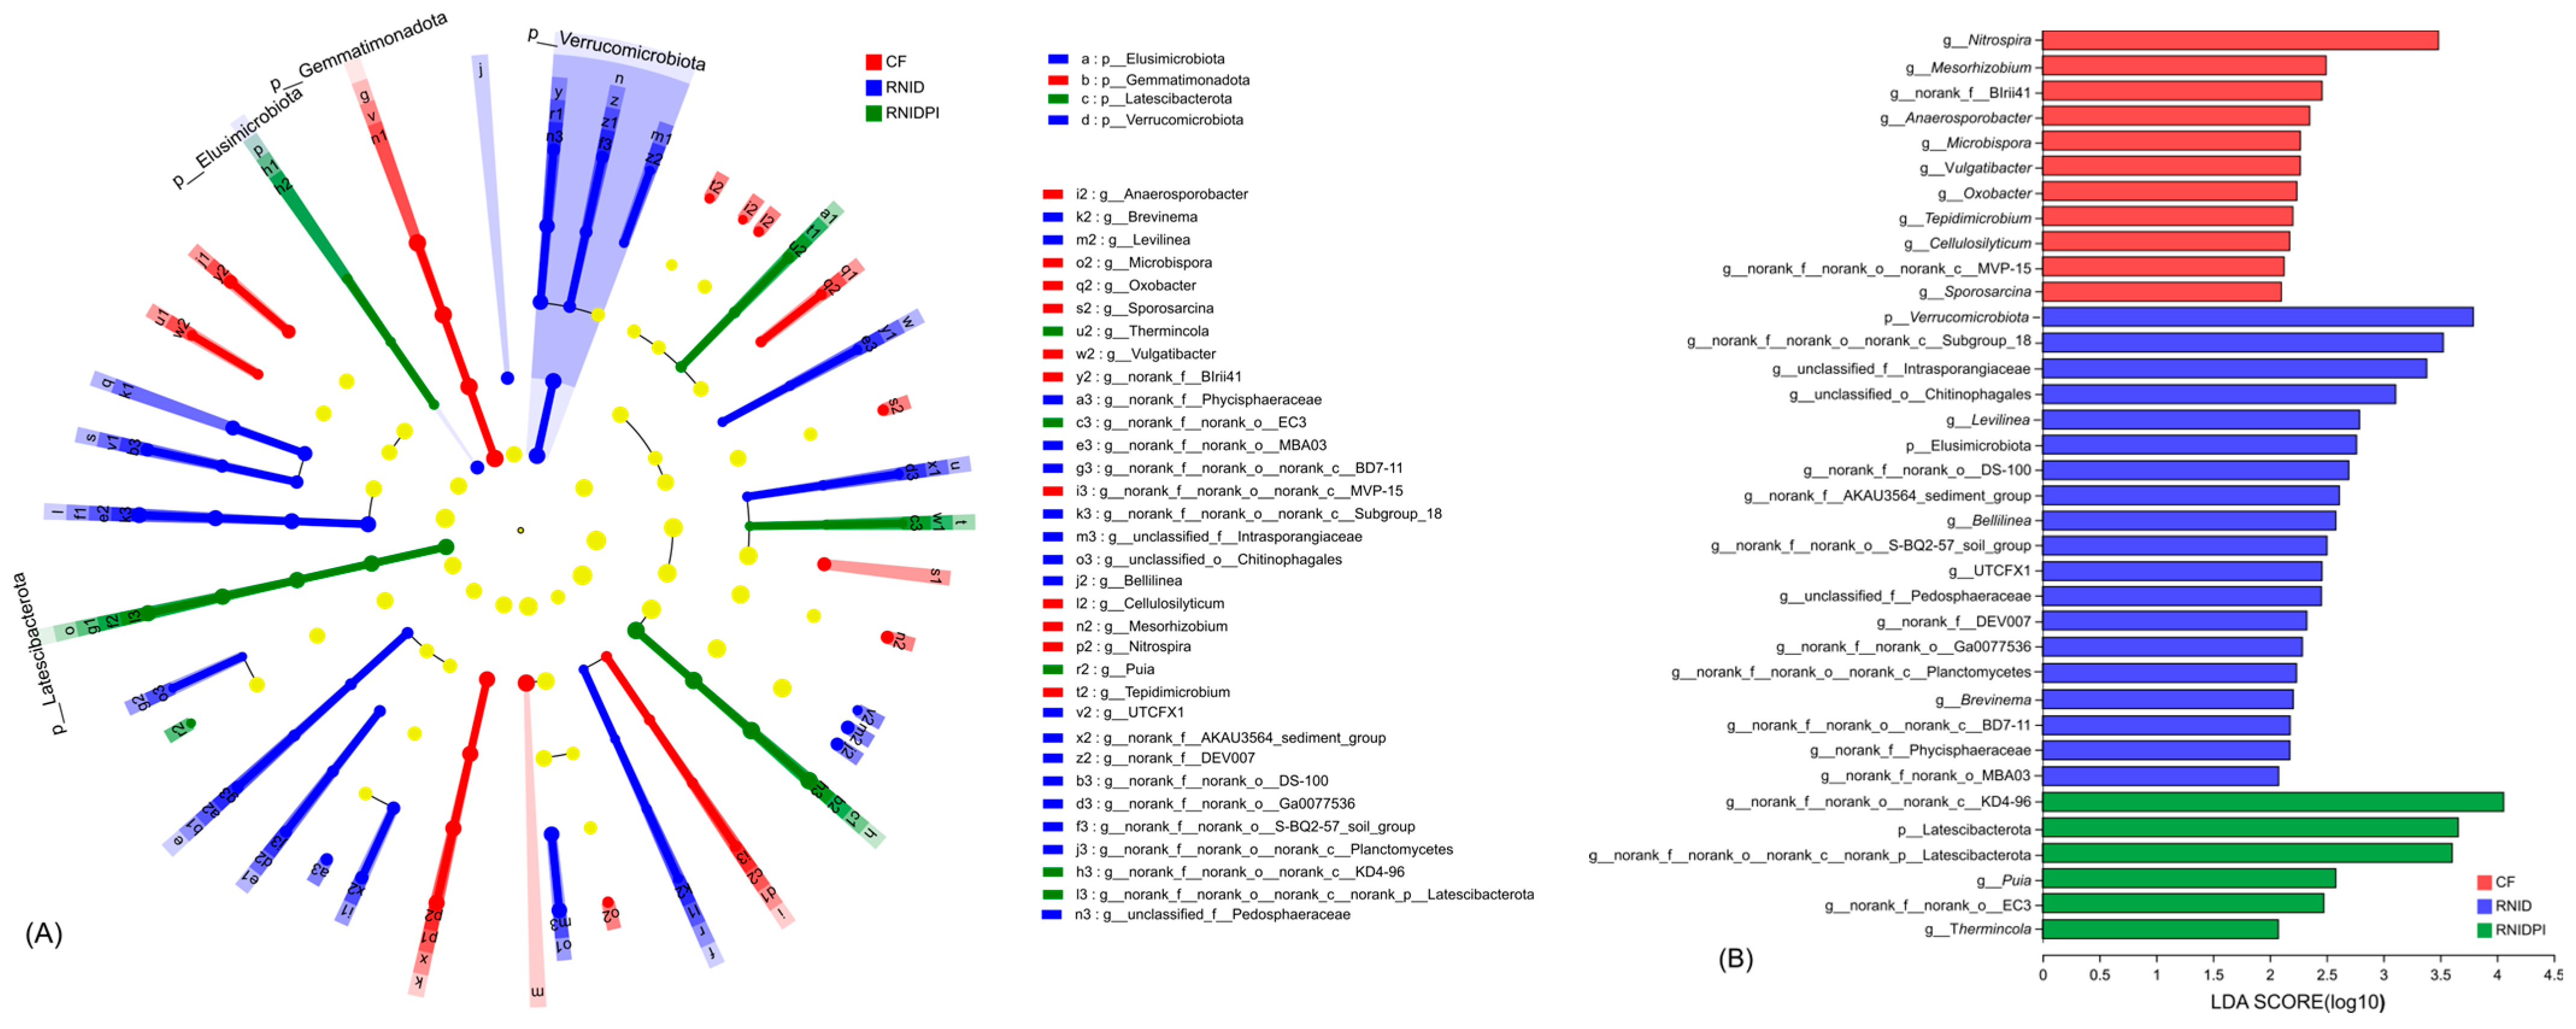
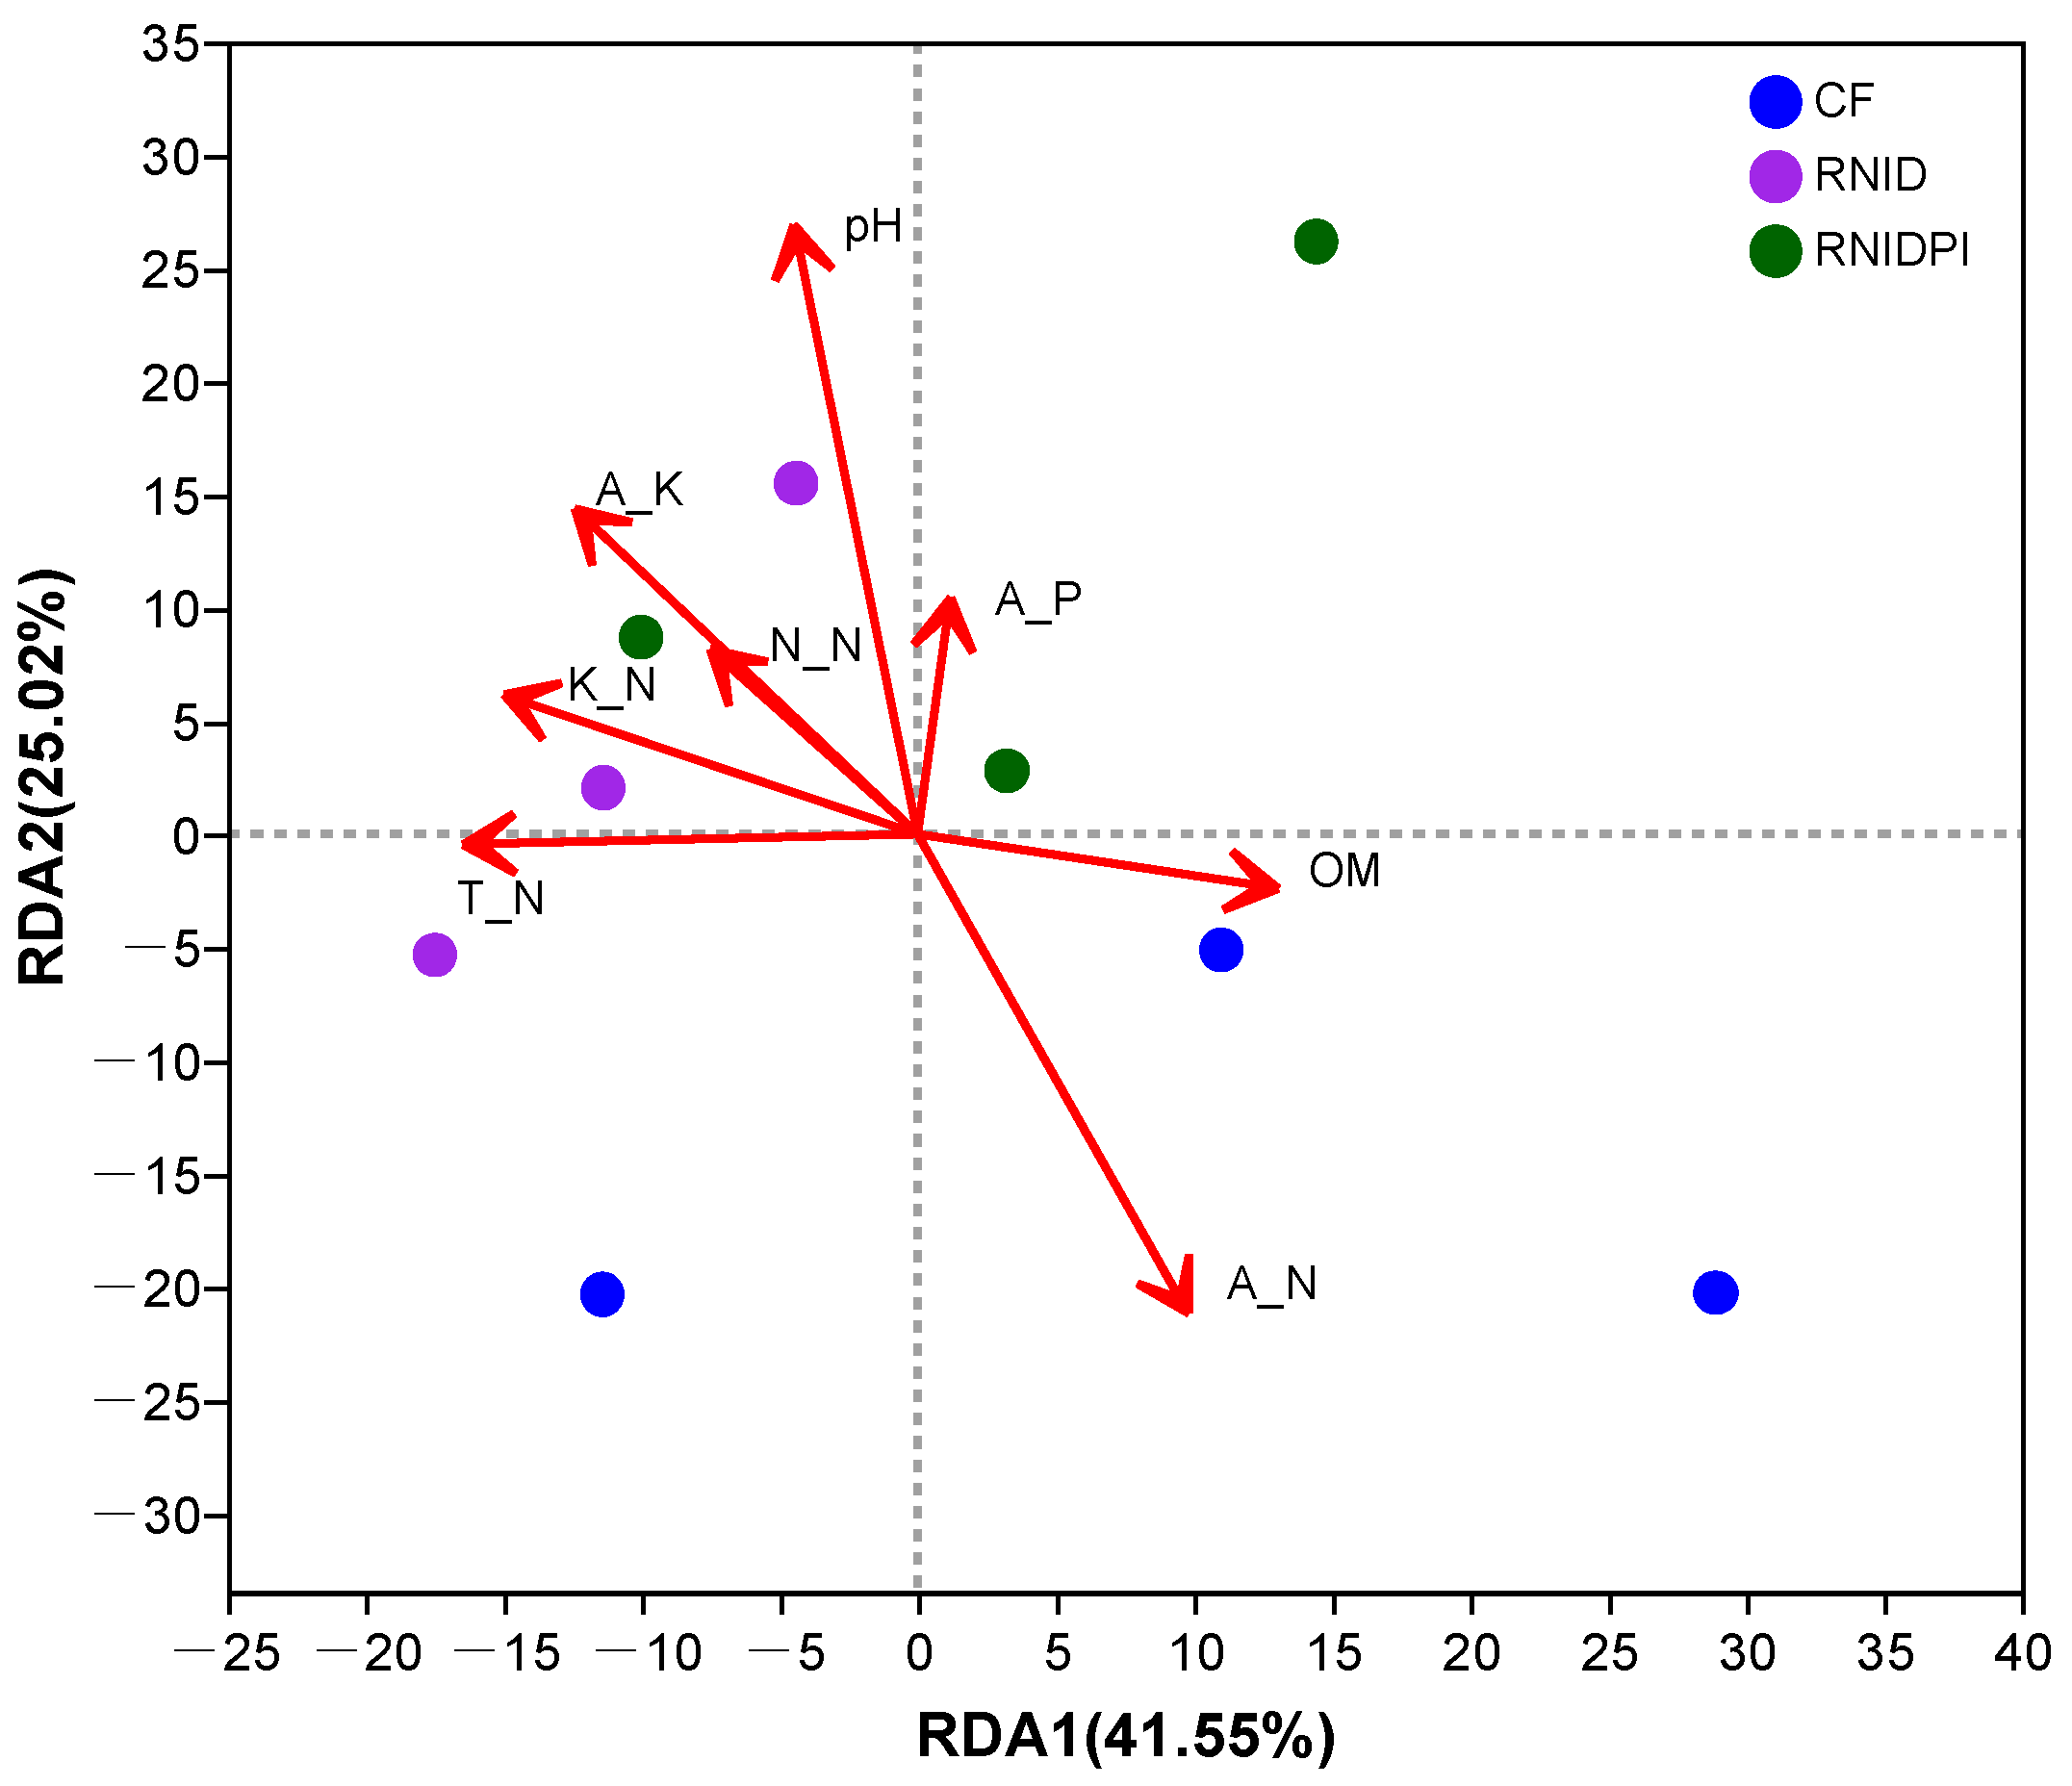
3.3. The Bacterial Community Composition in Different Treatments

The proportions of the top 15 bacteria at phylum and genus levels were calculated (Figure 4A). At the phylum level, the most dominant bacterial taxa in rice paddies under all treatments were Chloroflexi (16.4~25.6%), Proterobacteria (17.3~25.1%), and Acidobacteria (10.1~16.8%). The other bacterial phyla varied, on average, from 1.3% to 10.5%. ANOVA analysis revealed that Chloroflexi, Firmicutes, Verrucomicrobiota, Latescibacterota, and Elusimicrobiota showed significant variation among the treatments (Figure 4C). In particular, Chloroflexi were significantly more abundant in RNID and RNIDPI than in CF treatment, which held a higher proportion of Firmicutes.
At the genus level, the most abundant group norank_f_Anaerolineaceae was significantly more abundant in RNID and RNIDPI than CF treatments (Figure 4C). The distribution patterns of bacterial genus composition were closer together between RNID and RNIDPI treatments. Of the top 15 most abundant bacterial genera, only Bacillus, Gaiella, and Nitrospira were significantly more abundant in CF treatments (Figure 4D).
The bacterial biomarker taxa in the soils of different treatments were identified with LEfSe analysis. It was shown that the three treatments had distinct influential phyla (Figure 5A): Gemmatimonadota in CF, Elusimicrobiota and Verrucomicrobiota in RNID, and Latescibacterota in RNIDPI treatment. Significantly higher numbers of indicating bacterial taxa with an LDA score higher than 2 were identified in RNID treatment, followed by CF and RNIDPI (Figure 5B).
Redundancy analysis (RDA) was adopted to reveal the relationship between the soil bacterial community structure distribution and the major soil fertility properties (Figure 6). The first two axes explained 66.57% of the total variance at the OTU level. The bacterial community in CF treatment tended to be affected by ammonium and soil organic matter. RNIDPI treatment was positively correlated to available phosphorus, pH, and alkali-hydrolyzable nitrogen contents. The soil pH was the most influential environment factor to drive changes in the bacterial community composition, but the envfit calculation did not show any significance.
Based on the Spearman rank correlation method, the correlation of soil properties and rice yield on the relative abundance of the top 15 dominant bacterial phyla was evaluated (Table 4). The results demonstrated a negative correlation between soil ammonium (A-N) content and Chloroflexi, Acidobacteriota, Actinobacteriota, Verrucomicrobiota, and Latescibacterota and a positive correlation with Nitrospirota. Soil organic matter was negatively linked with Bacteroidota and positively correlated with Firmicutes. The pH of the soil was adversely connected with Proteobacteria.

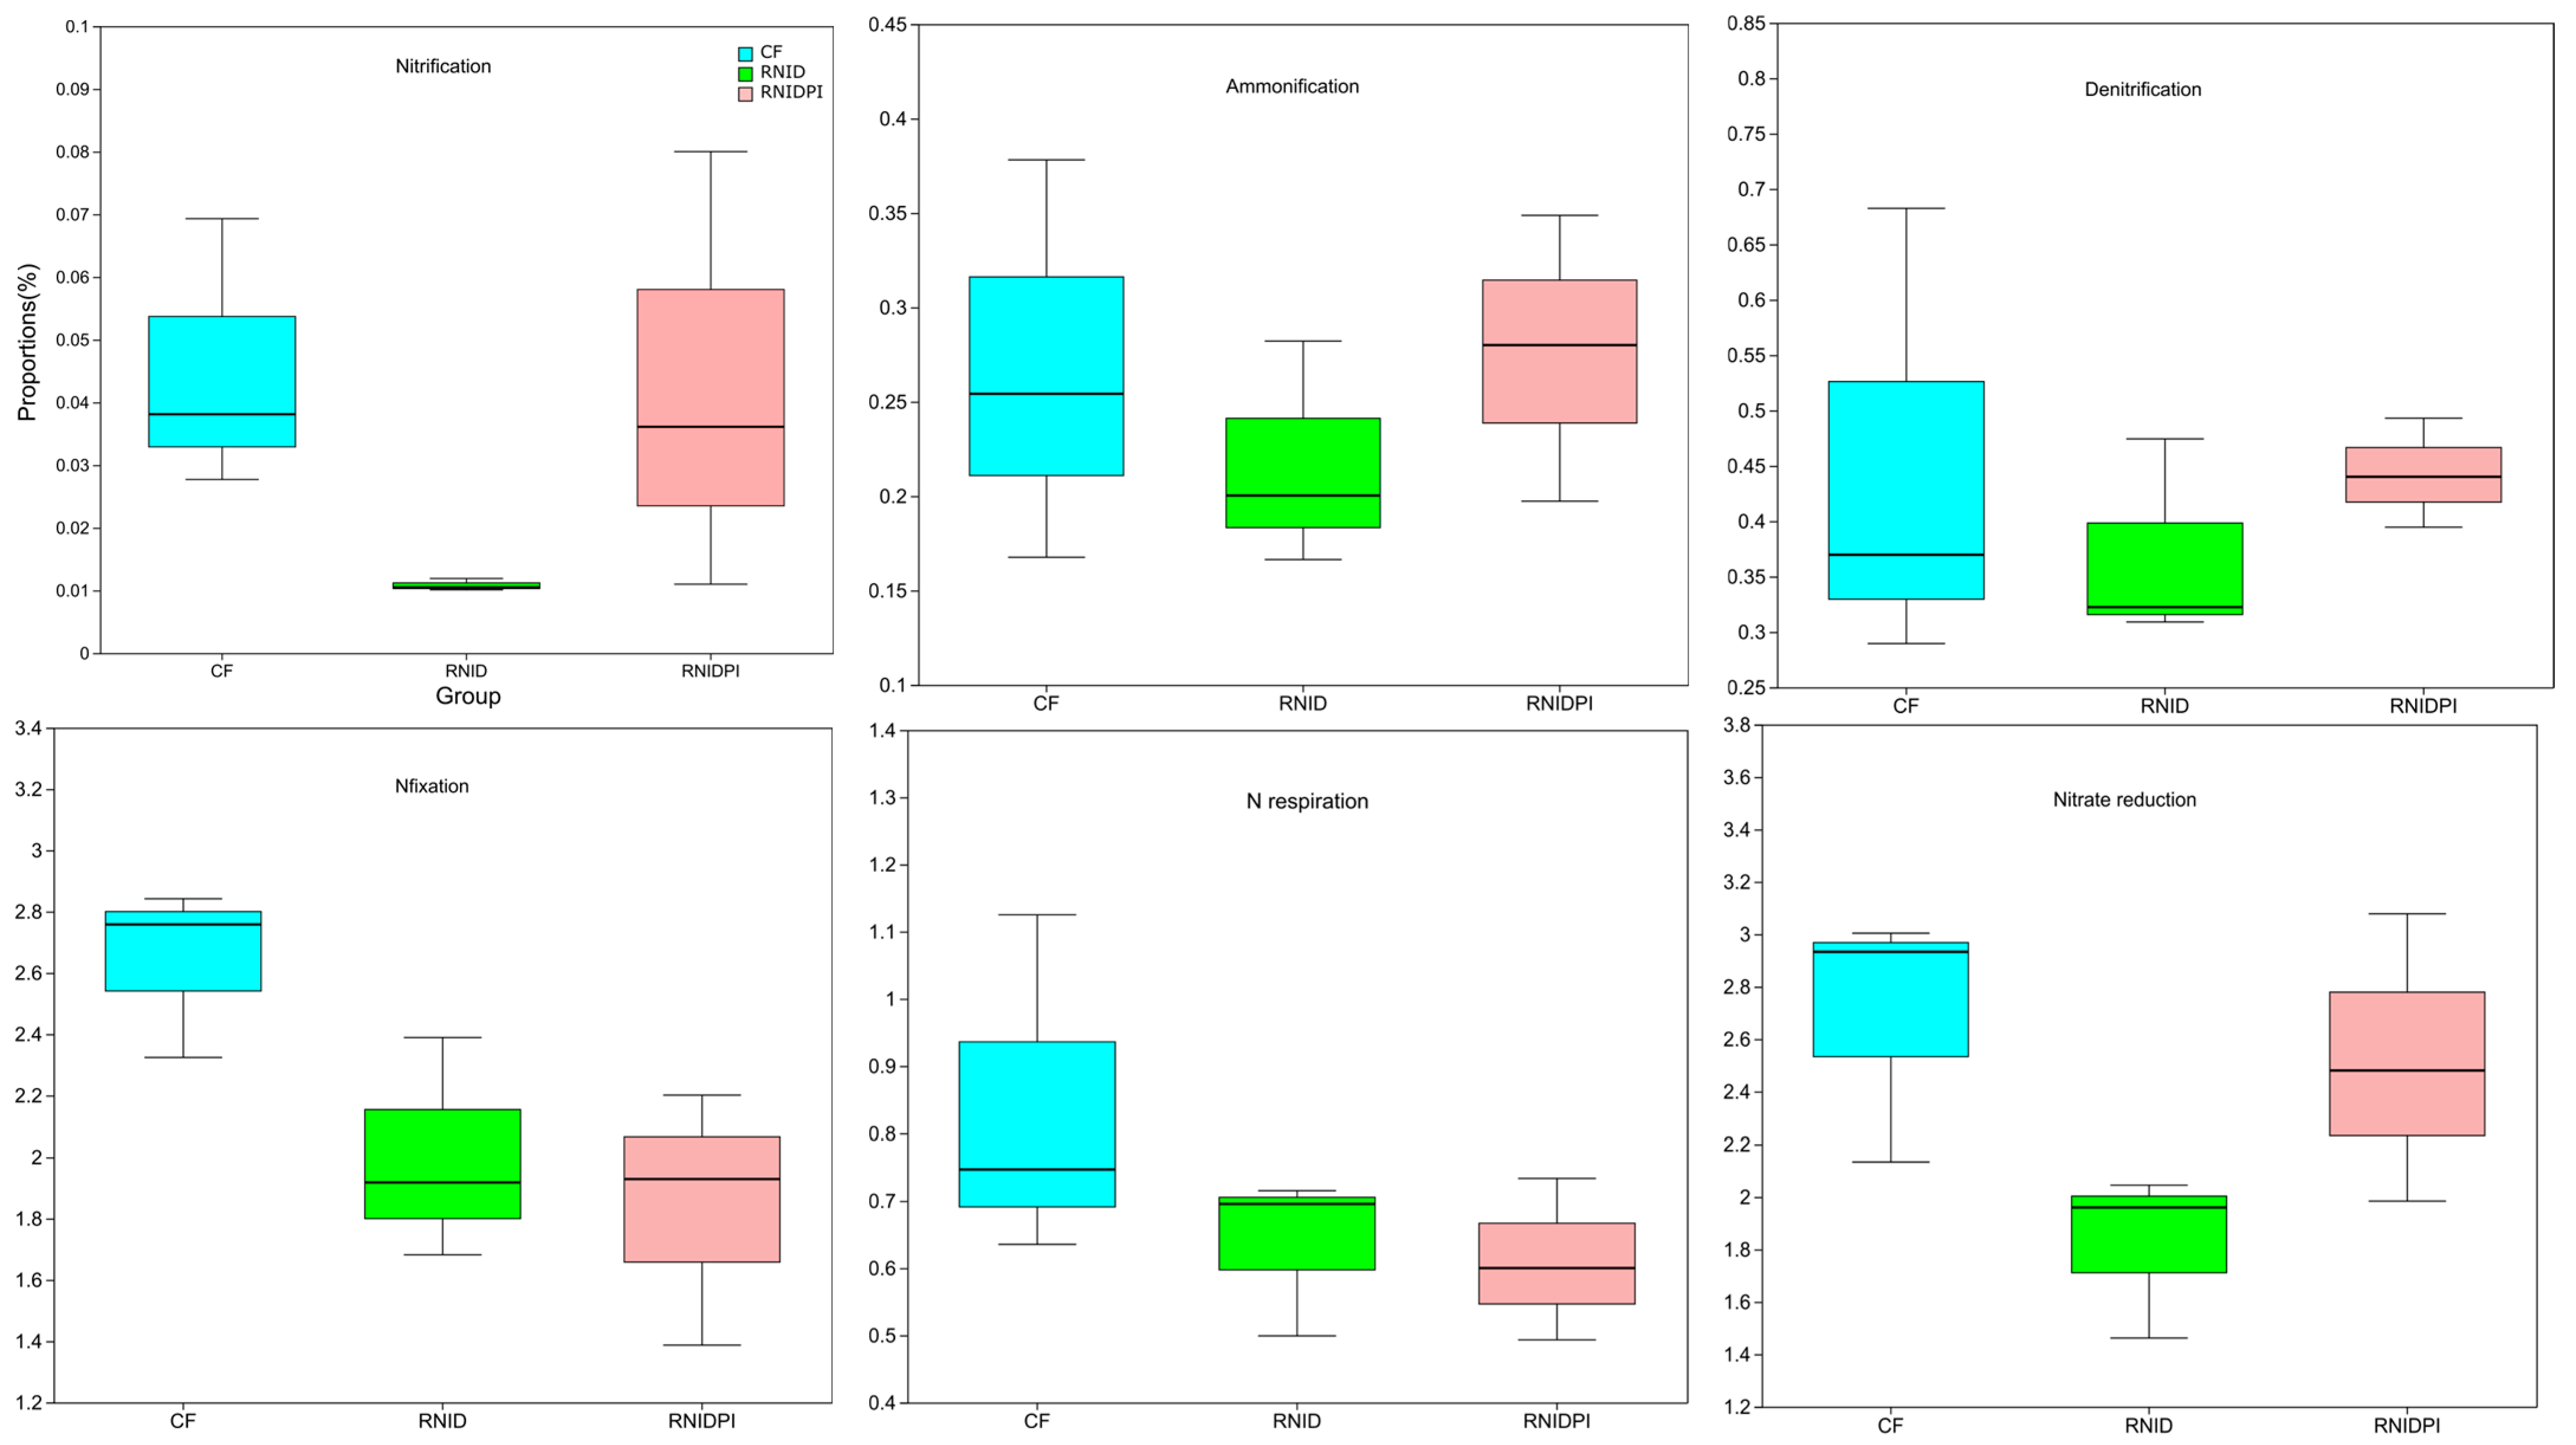
3.4. Functional Characteristics of Soil Bacteria

FAPROTAX analysis was applied to predict the function of the bacterial community in the paddy soil of different treatments. In this case, particular attention was paid to the functional groups involved in N transformation (Figure 7). In comparison to CF treatment, RNID treatment generally decreased the function groups of nitrification, ammonification, denitrification, N fixation, N respiration, and nitrate reduction, with significant differences observed in nitrification and nitrate reduction between the two treatments (p < 0.05). There was no difference observed in the relative abundance of N-cycling function between the CF and RNIDPI, or between RNID and RNIDPI.

4. Discussion

In terrestrial ecosystems, nitrogen cycling plays an essential role in regulating plant growth and microbial activities which also have profound influences on soil N cycling [14,42]. Among many practices, increasing plant density and regulating irrigation have been proven to be effective [31,43] in reducing nitrogen input while maintaining rice yield [44]. In this study, the reduction of N input by 10% with proper agricultural management increased rice yield by 22%. The rapid development of rice was associated with the consumption of essential nutrients, thus leading to the low accumulation in soils [45]. This would be beneficial for increasing NUE and reducing nitrogen loss. The interaction effects of nitrogen management and irrigation regimes on rice yield and soil nutrient status largely varied [44,46]; in this study, there was a trend that the nutrient contents, including organic matter, total nitrogen, ammonium, nitrate, and accessible P, declined after four years of cultivation, although the reduction of nitrogen did not significantly alter the nutrient status of the soil. Adjusting N content alone would affect soil N and organic matter, leading to a response of soil microbial biomass [47]. However, soil physical and chemical parameters are also dependent on crop uptake [48]. Lower soil N buildup may result from rice’s faster uptake of nitrogen due to increased plant density and growth stimulated by irrigation management.
It is well recognized that microbial diversity regulates the soil biogeochemical processes in the soil. Higher bacterial diversity was associated with high yields of super rice [16]. Despite having the highest rice production in this study, there was no discernible difference in the bacterial alpha diversity in the RNIDPI treatment. It was also reported that bacterial diversity decreased significantly with an increase in N fertilization [49]. Similarly, we observed high bacterial diversity in the treatment with reduced nitrogen and increased plant density after four years of treatment. This may be related to the increase in soil pH, as evidenced in previous studies [50].
A major group of Proteobacteria and Chloroflexi are known to be involved in nitrogen turnover [14] and are abundant in rice fields [51]. Proteobacteria include a wide range of metabolisms, known as copioratic (R-categories), and represent dominant bacterial phyla in soils enriched by higher N input, consistent with previous research [52,53,54]. There was a considerable increase in the phylum Chloroflexi in the decreased N treatment. Chloroflexi were reported to reduce N fixation abilities and have a negative correlation with super rice yield [16]. In fact, treatments with high proportions of Chloroflexi also had decreased N fixation function in this study; however, this was not associated with rice yield. While N provides nutrients and promotes bacterial growth, too much nitrogen input could inhibit their growth via soil acidification [55]. Therefore, fertilizer regime and irrigation management may have conflicting results on the soil microbial community [31,52,56], which could be related to the interactions between fertilizers, rice nutrient uptake, and root activities [57].
In addition, irrigation techniques were shown to affect soil bacterial community [28,29], with Actinobacteria increased under water stress conditions [58]. In this study, the relative abundances of Actinobacteria in RNID and RNIDPI were comparable, indicating that no water stress was induced [59]. On the other hand, timely drying according to rice growth may promote rice growth via enhancing root functions with better aerated conditions [60,61].
The process of N reduction seems to enrich Acidobacteria, which may also play important roles in reducing NO3 to NH4+ in rice paddies [62]. Studies confirmed a negative correlation of the abundance of Acidobacteria with soil pH [63]. A meta-global analysis also showed that soil pH variation was the most influential factor that modulates the shifts in bacterial community and N transformation genes [64]. In contrast to earlier findings, more Acidobacteria were found in the treatment with lower pH in this investigation. This further proved that the bacterial composition was being influenced by environmental parameters other than pH.
Soil nitrogen transformation includes several important steps [14] that are mostly driven by microorganisms. The abundance of N-cycling genes responded positively to N addition in lowland soil [64] and significantly correlated to N transformation processes [42]. In this study, CF treatment contained more functional groups related to nitrification and nitrate reduction than RNID. The ammonium content was positively correlated with the phylum Nitrospirae and negatively correlated to a number of phyla, including Gemmatimonatetes. Nitrospirae play an important role in soil nitrite oxidation, and therefore contribute to higher NH4+-N transformation efficiencies [64]. Many factors influence the N fixation process, and one of them may be oxygen [24], since improved aeration reduces nitrogenase activity [60]. The much more abundant nitrification functional groups seen in the traditional treatment, where less rhizosphere oxygen was present, could be explained by the dynamic of drying–wetting and increased plant density, which likely boosted the soil’s oxygen content. Unsurprisingly, the integrated treatments showed increased soil-nitrifying groups and nitrate concentrations and decreased NH4+-N [31,65,66]. To understand this occurrence, more research on the meta-genomics of the soil microbial population is required.

5. Conclusions

In summary, N reduction with irrigation management increased rice yield across the four experimental years. The primary characteristics of soil fertility did not change except for pH and available N and K. RNID treatment increased both bacterial richness and evenness as compared to conventional farming practices. Proterobacteria, Chloroflexi, Acidobacteria, Actinobacteria, and Bacteroidetes represented the predominant bacterial taxa in rice paddies across all treatments. Nitrogen reduction practices increased the relative abundance of Chloroflexi, while it decreased that of Firmicutes. Nitrospirae, a typical nitrifying group, was positively correlated to NH4+-N content. The potential N-transforming functional groups were not different among the treatments, except for genes involved in nitrification and nitrate reduction, which were significantly lower in RNID treatment than conventional farming. Collectively, reducing nitrogen input with increased plant density and accurate irrigation led to an increase in super rice yield without dramatically altering soil fertility conditions. After four years of experimentation, a significant change in the makeup of the soil bacterial population was observed.

Author Contributions

Conceptualization, X.Q., J.H., L.D. and G.W.; methodology, X.Q., J.H., R.X., L.D., J.W. and G.W.; validation, X.Q., R.X. and J.W.; investigation, X.Q., J.H., R.X., L.D., J.W. and G.W.; data curation, X.Q.; draft preparation, X.Q., J.H., R.X., L.D., J.W. and G.W.; funding acquisition, G.W. All authors have read and agreed to the published version of the manuscript.

Funding

The work was supported by the National Key Research and Development Program (2022YFD1500403, 2017YFD0200107).

Data Availability Statement

The data presented in this study are available on request from the corresponding author.

Conflicts of Interest

The authors declare that the research was conducted in the absence of any commercial or financial relationships that could be construed as a potential conflict of interest.

References

  1. China Rice Research Institute; National Rice Industry Technology Research and Development Center. China Rice Industry Data Analysis Report of 2022; China Agricultural Science and Technology Press: Beijing, China, 2022. [Google Scholar]
  2. Huang, M.; Tang, Q.; Ao, H.; Zou, Y. Yield potential and stability in super hybrid rice and its production strategies. J. Integr. Agric. 2017, 16, 1009–1017. [Google Scholar] [CrossRef]
  3. Liu, K.; He, A.; Ye, C.; Liu, S.; Lu, J.; Gao, M.; Fan, Y.; Lu, B.; Tian, X.; Zhang, Y. Root morphological traits and spatial distribution under different nitrogen treatments and their relationship with grain yield in super hybrid rice. Sci. Rep. 2018, 8, 131. [Google Scholar] [CrossRef] [PubMed]
  4. Bai, Z.; Huang, J.; Zhu, L.; Cao, X.; Zhu, C.; Zhong, C.; Jin, Q.; Zhang, J. Effects of N application strategies on N leaching loss in paddy soil and N use characteristics in different super hybrid rice cultivars. Paddy Water Environ. 2019, 18, 27–41. [Google Scholar] [CrossRef]
  5. Zhang, H.; Hou, D.; Peng, X.; Ma, B.; Shao, S.; Jing, W.; Gu, J.; Liu, L.; Wang, Z.; Liu, Y.; et al. Optimizing integrative cultivation management improves grain quality while increasing yield and nitrogen use efficiency in rice. J. Integr. Agric. 2019, 18, 2716–2731. [Google Scholar] [CrossRef]
  6. Wang, F.; Peng, S. Yield potential and nitrogen use efficiency of China’s super rice. J. Integr. Agric. 2017, 16, 1000–1008. [Google Scholar] [CrossRef]
  7. Fan, K.; Delgado-Baquerizo, M.; Guo, X.; Wang, D.; Zhu, Y.; Chu, H. Biodiversity of key-stone phylotypes determines crop production in a 4-decade fertilization experiment. ISME J. 2020, 15, 550–561. [Google Scholar] [CrossRef]
  8. Zhang, C.; Ju, X.; Powlson, D.; Oenema, O.; Smith, P. Nitrogen surplus benchmarks for controlling N pollution in the main crop-ping systems of China. Environ. Sci. Technol. 2019, 53, 6678–6687. [Google Scholar] [CrossRef]
  9. Qian, H.; Zhu, X.; Huang, S.; Linquist, B.; Kuzyakov, Y.; Wassmann, R.; Minamikawa, K.; Martinez-Eixarch, M.; Yan, X.; Zhou, F.; et al. Greenhouse gas emissions and mitigation in rice agriculture. Nat. Rev. Earth Environ. 2023, 4, 716–732. [Google Scholar] [CrossRef]
  10. Chen, L.; Liu, X.; Hua, Z.; Xue, H.; Mei, S.; Wang, P. Comparison of nitrogen loss weight in ammonia volatilization, runoff, and leaching between common and slow-release fertilizer in paddy field. Water Air Soil Pollut. 2021, 232, 132. [Google Scholar] [CrossRef]
  11. Zhang, S.; Zhang, G.; Wang, D.; Liu, Q. Abiotic and biotic effects of long-term straw retention on reactive nitrogen runoff losses in a rice–wheat cropping system in the Yangtze Delta region. Agric. Ecosyst. Environ. 2021, 305, 107162. [Google Scholar] [CrossRef]
  12. Liu, Y.; Wang, H.; Jiang, Z.; Wang, W.; Xu, R.; Wang, Q.; Zhang, Z.; Li, A.; Liang, Y.; Ou, S.; et al. Genomic basis of geographical adaptation to soil nitrogen in rice. Nature 2021, 590, 600–605. [Google Scholar] [CrossRef]
  13. Liu, Y.; Li, H.; Hu, T.; Mahmoud, A.; Li, J.; Zhu, R.; Jiao, X.; Jing, P. A quantitative review of the effects of biochar application on rice yield and nitrogen use efficiency in paddy fields: A meta-analysis. Sci. Total Environ. 2022, 830, 154792. [Google Scholar] [CrossRef]
  14. Kuypers, M.M.M.; Marchant, H.K.; Kartal, B. The microbial nitrogen-cycling network. Nat. Rev. Microbiol. 2018, 16, 263–276. [Google Scholar] [CrossRef] [PubMed]
  15. Yildiz, E.; Yaman, M.; Ercisli, S.; Sumbul, A.; Sonmez, O.; Gunes, A.; Bozhuyuk, M.R.; Kviklys, D. Effects of rhizobacteria application on leaf and fruit nutrient content of different apple scion–rootstock combinations. Horticulturae 2022, 8, 550. [Google Scholar] [CrossRef]
  16. Wu, Z.; Liu, Q.; Li, Z.; Cheng, W.; Sun, J.; Guo, Z.; Li, Y.; Zhou, J.; Meng, D.; Li, H.; et al. Environmental factors shaping the diversity of bacterial communities that promote rice production. BMC Microbiol. 2018, 18, 51. [Google Scholar] [CrossRef] [PubMed]
  17. Islam, T.; Hoque, M.N.; Gupta, D.R.; Mahmud, N.U.; Sakif, T.I.; Sharpe, A.G. Improvement of growth, yield and associated bacteriome of rice by the application of probiotic Paraburkholderia and Delftia. Front Microbiol. 2023, 14, 1212505. [Google Scholar] [CrossRef]
  18. Gui, Y.; Gu, C.; Xiao, X.; Gao, Y.; Zhao, Y. Microbial inoculations promoted the rice plant growth by regulating the root-zone bacterial community composition and potential function. J. Soil Sci. Plant Nutr. 2023. [CrossRef]
  19. Wang, Z.; Zhang, W.; Beebout, S.S.; Zhang, H.; Liu, L.; Yang, J.; Zhang, J. Grain yield, water and nitrogen use efficiencies of rice as influenced by irrigation regimes and their interaction with nitrogen rates. Field Crops Res. 2016, 193, 54–69. [Google Scholar] [CrossRef]
  20. Zhong, Y.; Hu, J.; Xia, Q.; Zhang, S.; Li, X.; Pan, X.; Zhao, R.; Wang, R.; Yan, W.; Shangguan, Z.; et al. Soil microbial mechanisms promoting ultrahigh rice yield. Soil Biol. Biochem. 2020, 143, 107741. [Google Scholar] [CrossRef]
  21. Pittol, M.; Durso, L.; Valiati, V.H.; Fiuza, F.M. Agronomic and environmental aspects of diazotrophic bacteria in rice fields. Ann. Microbiol. 2016, 66, 511–527. [Google Scholar] [CrossRef]
  22. Dai, Z.; Su, W.; Chen, H.; Barberán, A.; Zhao, H.; Yu, M.; Yu, L.; Brookes, P.C.; Schadt, C.W.; Chang, S. Long-term nitrogen fertilization decreases bacterial diversity and favors the growth of Actinobacteria and Proteobacteria in agro-ecosystems across the globe. Glob. Chang. Biol. 2018, 24, 3452–3461. [Google Scholar] [CrossRef]
  23. Farooq, M.S.; Wang, X.; Uzair, M.; Fatima, H.; Fiaz, S.; Maqbool, Z.; Rehman, O.U.; Yousuf, M.; Khan, M.R. Recent trends in nitrogen cycle and eco-efficient nitrogen management strategies in aerobic rice system. Front. Plant Sci. 2022, 13, 960641. [Google Scholar] [CrossRef] [PubMed]
  24. Daniel, G.; Kate, M.S. Long-term effects of mineral fertilizers on soil microorganisms—A review. Soil Biol. Biochem. 2014, 75, 54–63. [Google Scholar] [CrossRef]
  25. Islam, S.M.; Gaihre, Y.K.; Islam, M.R.; Akter, M.; Al Mahmud, A.; Singh, U.; Sander, B.O. Effects of water management on greenhouse gas emissions from farmers’ rice fields in Bangladesh. Sci. Total Environ. 2020, 734, 139382. [Google Scholar] [CrossRef] [PubMed]
  26. Cao, X.; Wu, L.; Lu, R.; Zhu, L.; Zhang, J.; Jin, Q. Irrigation and fertilization management to optimize rice yield, water productivity and nitrogen recovery efficiency. IRRI Sci. 2021, 39, 235–249. [Google Scholar] [CrossRef]
  27. Zhao, C.; Chen, M.; Li, X.; Dai, Q.; Xu, K.; Guo, B.; Hu, Y.; Wang, W.; Huo, Z. Effects of soil types and irrigation modes on rice root morphophysiological traits and grain quality. Agronomy 2021, 11, 120. [Google Scholar] [CrossRef]
  28. Li, Z.; Li, Z.; Letuma, P.; Zhao, H.; Zhang, Z.; Lin, W.; Chen, H.; Lin, W. A positive response of rice rhizosphere to alternate moderate wetting and drying irrigation at grain filling stage. Agric. Water Manag. 2018, 207, 26–36. [Google Scholar] [CrossRef]
  29. Liu, H.Y.; Huang, X.; Tan, W.; Xu, J.; Li, Y. High manure load reduces bacterial diversity and network complexity in a paddy soil under crop rotations. Soil Ecol. Lett. 2020, 2, 104–119. [Google Scholar] [CrossRef]
  30. Cao, X.; Zhu, C.; Zhong, C.; Hussain, S.; Zhu, L.; Wu, L.; Jin, Q. Mixed-nitrogen nutrition-mediated enhancement of drought tolerance of rice seedlings associated with photosynthesis, hormone balance and carbohydrate partitioning. J. Plant Growth Regul. 2018, 84, 451–465. [Google Scholar] [CrossRef]
  31. Cao, X.; Zhang, J.; Yu, Y.; Ma, Q.; Kong, Y.; Pan, W.; Wu, L.; Jin, Q. Alternate wetting–drying enhances soil nitrogen availability by altering organic nitrogen partitioning in rice-microbe system. Geoderma 2022, 424, 115993. [Google Scholar] [CrossRef]
  32. Liang, Y.; Wu, C.; Wei, X.; Liu, Y.; Chen, X.; Qin, H.; Wu, J.; Su, Y.; Ge, T.; Hu, Y. Characterization of nirS- and nirK-containing communities and potential denitrification activity in paddy soil from eastern China. Agric. Ecosyst. Environ. 2021, 319, 107561. [Google Scholar] [CrossRef]
  33. Liang, K.; Zhong, X.; Huang, N.; Lampayan, R.M.; Liu, Y.; Pan, J.; Peng, B.; Hu, X.; Fu, Y. Nitrogen losses and greenhouse gas emissions under different N and water management in a subtropical double-season rice cropping system. Sci. Total Environ. 2017, 609, 46–57. [Google Scholar] [CrossRef] [PubMed]
  34. Jia, D.; Dai, X.; Xie, Y.; He, M. Alternate furrow irrigation improves grain yield and nitrogen use efficiency in winter wheat. Agric. Water Manag. 2021, 244, 106606. [Google Scholar] [CrossRef]
  35. Zhang, H.; Jing, W.; Zhao, B.; Wang, W.; Xu, Y.; Zhang, W.; Gu, J.; Liu, L.; Wang, Z.; Yang, J. Alternative fertilizer and irrigation practices improve rice yield and resource use efficiency by regulating source-sink relationships. Field Crops Res. 2021, 265, 108124. [Google Scholar] [CrossRef]
  36. Yang, J.C.; Zhou, Q.; Zhang, J.H. Moderate wetting and drying increases rice yield and reduces water use, grain arsenic level, and methane emission. Crop J. 2017, 5, 151–158. [Google Scholar] [CrossRef]
  37. Chen, L.; Xie, H.; Wang, G.; Yuan, L.; Qian, X.; Wang, W.; Xu, Y.; Zhang, W.; Zhang, H.; Liu, L.; et al. Reducing environmental risk by improving crop management practices at high crop yield levels. Field Crops Res. 2021, 265, 108123. [Google Scholar] [CrossRef]
  38. Zou, M.; Zhou, S.; Zhou, Y.; Jia, Z.; Guo, T.; Wang, J. Cadmium pollution of soil-rice ecosystems in rice cultivation dominated regions in China: A review. Environ. Pollut. 2021, 280, 116965. [Google Scholar] [CrossRef]
  39. Bao, S. Soil Agro-Chemistrical Analysis, 3rd ed.; Agriculture Press China: Beijing, China, 2007. [Google Scholar]
  40. Yoshida, S. Physiological aspects of grain yield. Annu. Rev. Plant Physiol. 1972, 23, 437–464. [Google Scholar] [CrossRef]
  41. Faith, D.P.; Minchin, P.R.; Belbin, L. Compsitional dissimilarity as a robust measure of ecological distance. Vegetatio 1987, 69, 57–68. [Google Scholar] [CrossRef]
  42. Ouyang, Y.; Evans, S.E.; Friesen, M.L.; Tiemann, L.K. Effect of nitrogen fertilization on the abundance of nitrogen cycling genes in agricultural soils: A meta-analysis of field studies. Soil Biol. Biochem. 2018, 127, 71–78. [Google Scholar] [CrossRef]
  43. Reis, A.F.D.B.; Almeida, R.E.M.D.; Bruno, C.L.; Trivelin, P.C.; Linquist, B.; Favarin, J.L. Aerobic rice system improves water productivity, nitrogen recovery and crop performance in Brazilian weathered lowland soil. Field Crops Res. 2018, 218, 59–68. [Google Scholar] [CrossRef]
  44. Li, S.; Chen, Y.; Li, T.; Yu, F.; Zhang, Y.; Liu, K.; Zhang, H.; Gu, J.; Yang, J.; Liu, L. Alternate wetting and moderate soil drying irrigation counteracts the negative effects of lower nitrogen levels on rice yield. Plant Soil. 2022, 481, 367–384. [Google Scholar] [CrossRef]
  45. Xia, L.; Lam, S.K.; Chen, D.; Wang, J.; Tang, Q.; Yan, X. Can knowledge-based N management produce more staple grain with lower greenhouse gas emission and reactive nitrogen pollution? A meta-analysis. Glob. Change Biol. 2017, 23, 1917–1925. [Google Scholar] [CrossRef] [PubMed]
  46. Qiu, H.; Yang, S.; Jiang, Z.; Xu, Y.; Jiao, X. Effect of irrigation and fertilizer management on rice yield and nitrogen loss: A meta-analysis. Plants 2022, 11, 1690. [Google Scholar] [CrossRef]
  47. Chen, D.; Lan, Z.; Hu, S.; Bai, Y. Effects of nitrogen enrichment on belowground communities in grassland: Relative role of soil nitrogen availability vs. soil acidification. Soil Biol. Biochem. 2015, 89, 99–108. [Google Scholar] [CrossRef]
  48. Gou, X.; Ni, H.; Sadowsky, M.J.; Chang, X.; Liu, W.; Wei, X. Arbuscular mycorrhizal fungi alleviate erosion-induced soil nutrient losses in experimental agro-ecosystems. Catena 2022, 220, 106687. [Google Scholar] [CrossRef]
  49. Dong, H.; Fan, S.; Sun, H.; Chen, C.; Wang, A.; Jiang, L.; Ma, D. Rhizosphere-associated microbiomes of rice (Oryza sativa L.) under the effect of increased nitrogen fertilization. Front. Microbiol. 2021, 12, 730506. [Google Scholar] [CrossRef]
  50. Gao, M.; Yang, J.; Liu, C.; Gu, B.; Han, M.; Li, J.; Li, N.; Liu, N.; An, N.; Dai, J. Effects of long-term biochar and biochar-based fertilizer application on brown earth soil bacterial communities. Agric. Ecosyst. Environ. 2020, 309, 107285. [Google Scholar] [CrossRef]
  51. Fernández-Baca, C.P.; Rivers, A.R.; Maul, J.E.; Kim, W.; Poudel, R.; McClung, A.M.; Roberts, D.P.; Reddy, V.R.; Barnaby, J.Y. Rice plant–soil microbiome interactions driven by root and shoot biomass. Diversity 2021, 13, 125. [Google Scholar] [CrossRef]
  52. Zhou, J.; Guan, D.; Zhou, B.; Zhao, B.; Ma, M.; Qin, J.; Jiang, X.; Chen, S.; Cao, F.; Shen, D. Influence of 34-years of fertilization on bacterial communities in an intensively cultivated black soil in northeast China. Soil Biol. Biochem. 2015, 90, 42–51. [Google Scholar] [CrossRef]
  53. Boubekri, K.; Soumare, A.; Mardad, I.; Lyamlouli, K.; Ouhdouch, Y.; Hafidi, M.; Kouisni, L. Multifunctional role of Actinobacteria in agricultural production sustainability: A review. Microbiol. Res. 2022, 261, 127059. [Google Scholar] [CrossRef] [PubMed]
  54. Tang, H.; Xiao, X.; Li, C.; Shi, L.; Cheng, K.; Wen, L.; Li, W.; Wang, K. Influences of different manure N input on soil ammonia-oxidizing archaea and bacterial activity and community structure in a double-cropping rice field. J. Appl. Microbiol. 2020, 130, 937–947. [Google Scholar] [CrossRef]
  55. Shen, J.; Luo, Y.; Tao, Q.; White, P.J.; Sun, G.; Li, M.; Luo, J.; He, Y.; Li, B.; Li, Q. The exacerbation of soil acidification correlates with structural and functional succession of the soil microbiome upon agricultural intensification. Sci. Total Environ. 2022, 828, 154524. [Google Scholar] [CrossRef]
  56. Wang, W.; Luo, X.; Chen, Y.; Ye, X.; Wang, H.; Cao, Z.; Ran, W.; Cui, Z. Succession of composition and function of soil bacterial communities during key rice growth stages. Front. Microbiol. 2019, 10, 421. [Google Scholar] [CrossRef] [PubMed]
  57. Zhang, W.; Wan, W.; Lin, H.; Pan, X.; Lin, L.; Yang, Y. Nitrogen rather than phosphorus driving the biogeographic patterns of abundant bacterial taxa in a eutrophic plateau lake. Sci. Total Environ. 2021, 806, 150947. [Google Scholar] [CrossRef] [PubMed]
  58. Moreno, J.L.; Bastida, F.; Ondoño, S.; García, C.; Manuela, A.A.; Francisco, R.L. Agro-forestry management of Paulownia plantations and their impact on soil biological quality: The effects of fertilization and irrigation treatments. Appl. Soil Ecol. 2017, 117, 46–56. [Google Scholar] [CrossRef]
  59. Wu, J.F.; Ma, C.L.; Li, F.S. Microbial community structure and function in paddy soil as affected by water-saving irrigation mode. Eur. J. Soil Biol. 2022, 113, 103450. [Google Scholar] [CrossRef]
  60. Xiao, W.; Liao, Q.; Fu, J.; Liu, Y.; Zhang, C.; Zhang, W. Effects of micro-nano bubble aerated irrigation and levels of nitrogen fertilizer on nitrogen accumulation and metabolism in super rice. Irrig. Drain. 2022, 64, 297–302. [Google Scholar] [CrossRef]
  61. Xu, C.; Chen, L.; Chen, S.; Chu, G.; Wang, D.; Zhang, X. Rhizosphere aeration improves nitrogen transformation in soil, and nitrogen absorption and accumulation in rice plants. Rice Sci. 2020, 27, 162–174. [Google Scholar] [CrossRef]
  62. Bose, H.; Sahu, R.P.; Sar, P. Impact of arsenic on microbial community structure and their metabolic potential from rice soils of West Bengal, India. Sci. Total Environ. 2022, 841, 156486. [Google Scholar] [CrossRef]
  63. Lauber, C.L.; Strickland, M.S.; Bradford, M.A.; Fierer, N. The influence of soil properties on the structure of bacterial and fungal communities across land-use types. Soil Biol. Biochem. 2008, 40, 2407–2415. [Google Scholar] [CrossRef]
  64. Zhong, Y.; Yan, W.; Canisares, L.P.; Wang, S.; Brodie, E.L. Alterations in soil pH emerge as a key driver of the impact of global change on soil microbial nitrogen cycling: Evidence from a global meta-analysis. Glob. Ecol. Biogeogr. 2023, 32, 145–165. [Google Scholar] [CrossRef]
  65. Marschner, P. Processes in submerged soils-linking redox potential, soil organic matter turn over and plants to nutrient cycling. Plant Soil 2021, 464, 1–12. [Google Scholar] [CrossRef]
  66. Li, Z.; Tian, D.; Wang, B.; Wang, J.; Wang, S.; Chen, H.Y.H.; Xu, X.; Wang, C.; He, N.; Niu, S. Microbes drive global soil nitrogen mineralization and availability. Glob. Chang. Biol. 2019, 25, 1078–1088. [Google Scholar] [CrossRef] [PubMed]
Figure 1. The experimental plot arrangement in the field.
Agronomy 13 02856 g001
Figure 2. Venn diagram based on OTU composition in paddy soils taken from different treatments.
Agronomy 13 02856 g002
Figure 3. NMDS ordination plots showing the assembly of soil bacterial communities collected from rice paddies with different treatments. The three circles indicate the different treatment groups.
Agronomy 13 02856 g003
Figure 4. The most abundant bacterial taxa at the (A) phylum and (B) genus levels in soil samples collected from different treatments (with the top 15 bacterial taxa shown), and the bacterial phyla with significant difference in relative abundance between treatments at phylum (C) and genus levels (D). *, p < 0.05, and **, p < 0.01.
Agronomy 13 02856 g004aAgronomy 13 02856 g004b
Figure 5. LEfSe analysis identifying influential biomarkers at multiple taxonomic levels in the treatments (A). Red, blue, and green dots indicate taxa significantly enriched in CF, RNID, and RNIDPI treatment, respectively. Yellow dots represent the bacteria taxa without difference among treatments. The indicating taxa with LDA score higher than 2 are listed (B).
Agronomy 13 02856 g005
Figure 6. Redundancy analysis (RDA) showed bacterial community structure (OTU assignment) in relation to major properties of paddy soils collected. N-N: nitrate N; A-N: ammonium N; K-N: alkali-hydrolyzable nitrogen; A-P: available P; A-K: available K; EC: electrical conductivity; OM: soil organic matter.
Agronomy 13 02856 g006
Figure 7. Functional Annotation of Prokaryotic Taxa (FAPROTAX) analysis of the abundance of nitrogen transformation groups in different N treatments at rice mature stage.
Agronomy 13 02856 g007
Table 1. Major soil fertility properties in treatments with different nitrogen and irrigation managements.
TreatmentspHOM
(g kg−1)
T_N
(g kg−1)
A_P
(mg kg−1)
A_K
(mg kg−1)
K_N
(mg kg−1)
A_N
(mg kg−1)
N_N
(mg kg−1)
CF6.78 ± 0.11 b 19.45 ± 1.34 b 0.92 ± 0.04 b 47.7 ± 6.96 b 102.6 ± 3.95 bc 68.86 ± 7.2 b 6.96 ± 1.06 b 2.06 ± 0.1 b
RNID6.95 ± 0.09 a 18.26 ± 1.96 b 0.92 ± 0.04 b 50.6 ± 6.58 b 126.3 ± 3.95 a 68.86 ± 7.1 b 4.77 ± 0.61 c 2.06 ± 0.1 b
RNIDPI7.02 ± 0.05 a 19.55 ± 0.97 b 0.92 ± 0.03 b 58.2 ± 7.44 b 115.712 ± 12.7 ab 78.21 ± 3.06 a 4.93 ± 0.25 c 2.74 ± 0.52 a
Different letters in the same column indicate statistically significant differences among the samples by one-way ANOVA (LSD, p < 0.05). OM: soil organic matter; T_N: total nitrogen; A_P: available phosphorus; A_K: available potassium; K_N: alkali-hydrolyzable nitrogen; A_N: ammonium; N_N: nitrate.
Table 2. Rice yield components in different treatments.
TreatmentsSpikelets (m−2)Grains per Spikelet1000 Grain Weight (g)Yield (t ha−1)
CF259.2 ± 1.2 c172.68 ± 4.2 b 26.13 ± 0.12 b10.02 ± 0.15 b
RNID283.9 ± 3.3 b178.33 ± 5.66 b26.18 ± 0.3 b10.16 ± 0.31 b
RNIDPI292.9 ± 1.2 a182.25 ± 2.87 a 26.72 ± 0.09 a11.44 ± 0.39 a
Different letters in the same column indicate statistically significant differences among the samples by one-way ANOVA (LSD, p < 0.05).
Table 3. Bacterial diversity indices in the different nitrogen management practices estimated based on 97% similarity OTU clusters.
TreatmentsSobsShannonACECoverage
CF4267.7 ± 243.9 b 7.17 ± 0.15 b7965.9 ± 741.2 a 0.93
RNID4853 ± 51.9 a 7.40 ± 0.1 a8865.3 ± 333.1 a 0.93
RINDPI4493.0 ± 124.1 ab 7.23 ± 0.12 ab 8198.5 ± 372.5 a 0.94
Different letters in the same column indicate statistically significant differences among the samples based on one-way ANOVA (LSD, p < 0.05).
Table 4. Spearman correlation coefficients illustrating the relationship between the relative abundances of dominant bacterial phyla and the corresponding environmental factors. *, p < 0.05; and **, p < 0.01 in Spearman rank correlation analysis.
PhylumpHOMT-NA-PAKK-NA_NN_NYield
Chloroflexi0.63 0.03 0.11 0.40 0.43 0.17 −0.88 ** −0.08 0.20
Proteobacteria−0.68 * 0.12 −0.26 −0.38 −0.66 −0.35 0.62 −0.21 −0.28
Acidobacteriota0.53 −0.15 −0.11 0.20 0.56 0.19 −0.82 ** 0.10 0.43
Actinobacteriota0.30 0.20 −0.26 0.53 0.27 0.16 −0.75 * −0.06 −0.03
MBNT15−0.25 0.53 −0.47 −0.02 −0.13 −0.25 0.17 −0.42 −0.13
Desulfobacterota0.07 −0.57 0.26 −0.17 −0.01 0.35 0.03 0.62 0.43
Firmicutes−0.53 0.70 * −0.21 0.02 −0.41 0.02 0.62 −0.25 −0.20
Gemmatimonadota−0.08 0.60 −0.26 0.10 −0.40 0.03 0.35 −0.19 0.15
Bacteroidota−0.25 −0.75 * 0.21 −0.42 0.14 −0.22 −0.05 0.17 −0.23
Myxococcota0.00 0.43 0.40 0.24 −0.63 0.52 0.34 0.27 0.22
Nitrospirota−0.27 0.12 0.37 −0.17 −0.62 0.11 0.88 **0.16 −0.03
Methylomirabilota0.05 0.47 −0.42 0.13 0.07 0.01 0.03 −0.16 0.18
Verrucomicrobiota0.38 −0.30 −0.11 0.08 0.71 *−0.14 −0.82 **−0.18 0.05
Patescibacteria0.02 −0.57 0.47 −0.20 0.24 0.13 −0.22 0.26 0.03
Latescibacterota0.55 0.15 −0.26 0.43 0.55 0.46 −0.67 *0.31 0.57
Disclaimer/Publisher’s Note: The statements, opinions and data contained in all publications are solely those of the individual author(s) and contributor(s) and not of MDPI and/or the editor(s). MDPI and/or the editor(s) disclaim responsibility for any injury to people or property resulting from any ideas, methods, instructions or products referred to in the content.

