1. Introduction
Given the current situation of rising temperatures and the changes in precipitation patterns influenced by climate change together with the occurrence of more intense droughts, the optimization of water use is becoming a central issue, particularly in countries with chronic water scarcity. Regarding agricultural water resource usage, the focus should be on obtaining the maximum yield with the minimum amount of water via optimal irrigation practices. Knowledge of crop water consumption or evapotranspiration (ET) is essential to determine the adequate amount and frequency of irrigation water applications. The two ET components, evaporation from soil and crop transpiration, which are difficult to separate in practice, constitute the crop water requirements and, after deducting the effective rainfall, the net irrigation needs.
The California Irrigation Management Information System (CIMIS) in the USA, for instance, is a network of over 145 automated weather stations in California that began in 1982 [
1]. These stations collect agrometeorological variables to provide reference evapotranspiration information for different regions [
2]. The data are free and available online to farmers, water managers, and the public. CIMIS network is extensively used in California for irrigation scheduling, water management, and weather forecasting [
3]. Similarly, the “Red de Información Agroclimática de Andalucía” (RIAA) [
4] in Andalusia, Spain, operational since 1999, has about one hundred automatic weather stations distributed throughout all irrigable areas, that offer essential meteorological data and ET
o information, especially crucial for irrigation scheduling in a drought-prone region [
5]. In Texas, there have been substantial efforts in utilizing ET data for irrigation management, though it has faced challenges in sustaining its ET networks over extended periods [
6]. These efforts emphasize the need for network coordination and integration to avoid errors from lack of standardization and varying ET computation methods. Moreover, these networks require extensive maintenance of equipment, data collection, and quality assessment for their expansion to other countries and regions.
To establish a successful regional ET information network, several requisites must be met. Firstly, the network must be able to provide accurate ET data that can be effectively used by policymakers, water managers, and other end-users. Secondly, the network must have a cost-effective and sustainable operational model. Thirdly, the network must be able to provide timely data to potential users and must be properly maintained over the long run.
The FAO project “Water efficiency, productivity and sustainability in the NENA regions” (Project GCP/RNE/009/SWE) funded the establishment of a regional ET network in countries of the Near East and North Africa region. The project aimed to provide experts and water users with accurate ET data to enable them to make informed decisions about water accounting and water productivity. The deployment of the ET network involved several steps, starting with the development of a novel, cost-effective ET measuring device which is fully described in Jimenez-Berni et al. [
7]. The next steps included identifying suitable partners and locations, station deployment, equipment calibration, adequate team training, and, finally, collecting, analyzing, and disseminating the ET data.
Ideally, the network should be integrated into the existing water-management information systems to provide timely and accurate data to potential users. Regional ET networks can provide a platform for collecting and sharing data, identifying best practices, and developing applications to assist in regional water-management strategies. The establishment of regional networks, however, can be challenging, requiring high upfront costs and regular maintenance for their sustainability.
Regarding agrometeorological information, the standard is a weather station with research-grade sensors typically used in scientific applications, which are costly. An alternative, tested in this work, is an inexpensive device which uses industrial-grade and commercial off-the-shelf sensors. Jimenez-Berni et al. [
7] presents the description and test of the CORDOVA-ET station, a cost-effective and easy-to-maintain unit which has been used in the ET regional network described herein. An important advantage of this system is that it permits collecting crop ET (ET
a) data in addition to determining the ET
o [
7]. The objectives of this work are to describe the deployment of such stations in different countries and institutions of the NENA region, to assess their performance in determining the ET
a and ET
o, to describe the major issues associated with network development, and to evaluate the suitability of the CORDOVA-ET for use in an ET network in the NENA region.
3. Results and Discussion
3.1. Training, Communication, and Support
3.1.1. Training and Coaching
The initial philosophy behind the network was to fully empower all the participants with the knowledge required to assemble, deploy, and run the CORDOVA-ET instrument, and also to analyze the collected data and maintain the equipment. Therefore, users’ training was considered a crucial step in the development of the network. It was considered important to ensure that all users would understand well how to assemble, use, and maintain the equipment correctly. Training took many forms, such as instructional videos, user manuals, and in-person or online training sessions.
The ND team trained all personnel from the participant countries in the use, assembly, deployment, and maintenance of the CORDOVA-ET system. Several in-person workshops were conducted in Cordoba and in the NENA region, as well as online. This training targeted technical specialists in the field of agrometeorology to provide them with the knowledge needed to adopt the CORDOVA-ET system.
Participants received the materials and instruction necessary to assemble and operate a complete CORDOVA-ET system. Upon completion of the program, country representatives took ownership of their CORDOVA-ET systems, transporting and installing them at the agreed-upon sites within their countries. Once operative, they were responsible for operation and maintenance. Under this framework, the training had the following specific objectives:
To give participants a deeper understanding of the various ways to determine evapotranspiration, focusing on the calculation method behind the CORDOVA-ET system;
To provide an overview of the system components and the manufacturing process, from procurement to assembly;
To review the critical steps in the set-up of the equipment, data retrieval, and quality checks;
To develop the autonomy of the participant to monitor, update, and maintain the equipment;
To devise the ET measurement plans according to the project objectives in each of the countries involved.
As the system evolved, several online workshops were conducted to provide training to the members of the network on the new features and advancements made. These workshops served as a platform to educate participants about the latest updates, enhancements, and improvements which were incorporated into the system over time.
The combination of in situ training and local problem-solving through backstopping missions strengthened the capacity of the participating countries to effectively utilize and maintain the technology. It also fostered a closer relationship between the ND team and the local stakeholders, promoting collaboration and knowledge exchange. Overall, the backstopping missions played a crucial role in ensuring the successful adoption and sustainable use of the technology within the participating countries.
3.1.2. Establishing a Support Network
At the early stages of the network, there were two main ways for communication among the users and developers of the ET network:
By video conferencing using a collaboration platform that unifies chat, voice, video, and file sharing (e.g., Zoom). It is designed to be used by local, remote, and distributed work groups. It was mainly used to carry out e-training and webinars;
Multiple chat groups (WhatsApp) were established for the ET network participants, serving distinct purposes facilitating real-time communication, enabling active engagement, and quick problem-solving for the community. Separate chat groups were created for each specific country, allowing participants to address country-specific concerns, exchange localized ideas, and address unique challenges efficiently. The dynamic nature of these chat groups promoted effective and seamless communication.
Although there were multiple communication channels, the community involved in the training courses, the deployment of the stations, and data collection and manipulation did not have a single platform established where the users could interact among them and with the ND team. Therefore, in December 2020, it was proposed to create a web-based portal for discussion and exchange between CORDOVA-ET users and the ND team to facilitate effective online communication, feedback, and collaboration.
To enable every person working on the CORDOVA-ET system to exchange experiences, ideas, problems found, and possible solutions, the platform was required to meet the following requisites:
Accessible meeting place with a graphical interface;
Ease of use;
Effective and affordable;
Permanent access;
Longevity;
Easy file storage and exchange.
The best platform that meets the requirements listed above is Dgroups. In terms of formal organization, the Dgroups Partnership is a cofunded project of Bellanet/IDRC, financed by the partners and members, comprising a diverse group, including international or intergovernmental organizations, such as the World Bank, UNAIDS, FAO, CTA; government agencies, such as Danida, DFID, IDRC, Sida, SDC; national and international NGOs, like ICCO, Hivos, OneWorld, KIT, SNV; ICT- and knowledge-focused institutes/projects, such as IICD and Bellanet [
13].
The Dgroups platform was selected for the following reasons:
All the groups participating in the project were already members of it;
There was the possibility to create a subgroup under the Water Productivity group, so that the CORDOVA-ET users would have access to all the documentation, not only related to the CORDOVA-ET, but also other topics related to water productivity;
The users did not need to change platforms to organize their knowledge and files;
Files were easily accessible;
While WhatsApp is fast and easy, it is very difficult to have all conversations organized and accessible to everyone. Dgroups allows you to access the organized conversations and files easily at any time.
The use of the Dgroups platform did not exclude the use of the WhatsApp chat, but complemented it. However, a forum tends to be asynchronous and visitors can catch up the conversations at any time reading previous posts. This is not viable in WhatsApp, where a conversation or topic could be easily missed.
3.2. CORDOVA-ET System Upgrades
These prototypes evolved over time through a trial-and-error process based on our own experience, and more importantly, thanks to the feedback received from the early adopters and initial users. The expansion and adoption of the system therefore followed a collaborative approach.
Since the original system development, several components have been upgraded, as described below.
3.2.1. Sensor Upgrades
The sensors integrated in the nodes are a fundamental component of the CORDOVA-ET, as they sense the infrared temperature and air temperature and humidity required for the calculation of the sensible heat used in the energy-balance approach followed to estimate the actual evapotranspiration.
Figure A1 of
Appendix A depicts pictures of both the original and the improved sensors used in the CORDOVA-ET station. Below is a description of the issues found and the implemented solutions:
The initial prototypes of the air-temperature sensor used the BME280 (Bosch, Gerlingen, Germany) sensor, integrated into a completely 3D-printed radiation shield and sensor holder. The large size of the electronic board provides large thermal mass and makes it not really suitable for precise applications; therefore, the second prototype, based on the SHT35 (Sensirion, Stäfa, Switzerland) manufactured by ClosedCube (London, UK), was used and integrated into the 3D-printed radiation shield. This new sensor provided a thermal design based on the manufacturer’s specifications and included a protective cap to avoid water and dust to enter in the sensor. A newly upgraded sensor, also based on the SHT35, was tested (Hunan Rika Electronic Tech Co.,Ltd., Changsha, Hunan, China). The new sensor is completely encapsulated and isolated from direct water and dust due to a PTFE membrane. Also, this new sensor does not require soldering to connect it to the system, as the connector comes already integrated according to our specifications. The sensor comes as a kit with a commercial radiation shield with a stainless-steel mounting bracket. This represents a quantum leap from the original 3D-printed sensors;
The original Canopy Infrared Temperature sensors have undergone a modification to include connector and preassembled cables, which provide plug-and-play without need of any soldering. On the other hand, the 3D-printed enclosure for the canopy-temperature sensor remains unchanged; designs and 3D printer files are available in GitHub:
https://github.com/OpenAgriTech/CORDOVA-ET-Hardware (accessed on 20 October 2023). The removal of soldering steps and the shipment of preprinted sensors improved the efficiency and ensured the availability of spare parts at all times;
A soil-temperature sensor was also included in the initial prototypes, with the goal of measuring soil temperature for crop simulation purposes and potentially calculating soil heat flux. The sensor is relatively simple, uses the One-Wire protocol, and has not been problematic. The main issues were due to damaged cables by tillage or animals, as well as incorrect assembly. The initial version used field-replaceable connectors, which required certain experience to ensure proper assembly. A plug-and-play solution was provided by substituting an unassembled sensor for a soil sensor that had the connector integrated;
The initial pyranometer sensor prototypes included a custom design based on a multispectral sensor (AS7262, AMS-Osram, Premstaetten, Austria) and a 3D-printed housing. The idea behind using multispectral sensors is that it could help to estimate shortwave radiation as well as the PAR component. Also, a version in the red–NIR region (AS7263) could be potentially used to estimate NDVI and other spectral indices when combined with a downward-looking sensor. However, because of the importance of solar radiation in the energy balance, a new commercial pyranometer, SP-110-SS, (Apogee Instruments, Inc., North Logan, UT, USA) was incorporated into the upgraded CORDOVA-ET. It was decided to have only one high-quality pyranometer for the whole system to keep down the costs and to remove the original pyranometers from the four nodes, assuming that radiation does not vary within the distances among the nodes. The new pyranometer node consists of the pyranometer itself, the data logger based on the original node and an accurate 18-bit analog-to-digital converter, and a solar panel, as described in detail in Jimenez-Berni et al. [
7]. The node provides a rugged circular connector for easy connection to data loggers and controllers, and it simplifies sensor removal and replacement for maintenance and recalibration.
3.2.2. Data Logger
Users also found some difficulties building the initial versions of the data logger. Therefore, there has been some evolution in this component as well.
Baseboard. A custom-designed printed circuit board (PCB) is used to hold the LoPy4 microcontroller and interface the different sensors. The board evolved from using through-hole components to the surface-mount to avoid any soldering. Also, the board has been designed to fit the specific enclosure without the need of any mounting plate. All the connections are clearly marked and are aligned with the circular connectors for the sensors that are unique for each sensor to avoid confusion. Additionally, two switches were incorporated on the baseboard for power and selecting between the different operating modes: run, firmware upgrade, or setup. This facilitates easy management and configuration of the node as needed. Another upgrade requested by the users was the possibility of providing offline data recording to avoid data loss when the LoRaWAN network was offline. A microSD card slot was added and the software adapted to provide local storage into comma-separated values (CSV). Since the LoPy4 does not have a battery-backed real-time clock (RTC) that allows it to hold the time during power cycle or reset, it has a connector for an external RTC device. The software was modified to provide a way to synchronize the internal clock and RTC with the LoRaWAN server regularly.
Solar-regulator connectors. The original solar regulator required soldering and screw terminals for the power output and inputs, respectively. The new power supply components were modified to make it plug-and-play without any need for soldering. This eliminated several issues of damaged cables or solder joints in this component, resulting in improved reliability.
Data-logging software. The software that reads the sensor data and transmits the measurements over LoRaWAN has undergone several iterations, which can be summarized as follows
- o
The LoRaWAN keys are unique for each board and generated from the hardware address of the LoRa and SigFox radios. In the initial versions, users generated the LoRaWAN keys from The Things Network (TTN) console, which required programming each node individually with the specific keys. This could have led to mistakes and duplicated keys in different nodes. Now, the software will show the keys in a serial terminal, and users can copy these keys when registering the nodes in the TTN, avoiding potential issues with the key generation;
- o
The code is unique for all the node types (different hardware revisions, normal nodes, and pyranometers). The user can select the operating mode using the serial console or remotely using LoRaWAN downlink messages. This prevents configuration issues, and nodes can be programmed only once;
- o
An interactive mode is available on the serial console for configuration and debugging. When the mode switch is moved to the setup position, the board enters into an interactive mode that can be accessed when connected with the serial console or by WiFi. This allows users to read the LoRaWAN keys, test the sensors, or change the type of the node from standard to pyranometer. This was very effective during the setup process;
- o
A time-synchronization routine is executed twice a day for time synchronization from the LoRaWAN server. The routine determines the offset between the internal LoPy4 clock and the server, which upgrades the clock accordingly and provides actual time for data storage in the microSD card;
- o
The nodes can upgrade the software and firmware using WiFi if they are close enough to the WiFi provided by the base station. This over-the-air (OTA) upgrade can be triggered manually in the setup mode or remotely using a LoRaWAN downlink command.
3.2.3. Base Station
The solar-powered base station includes the LoRaWAN gateway and a 4G modem. The initial solar capacity was insufficient and was upgraded from 25 W to 50 W, with larger panels or double the number of smaller panels. The battery was also upgraded using two 9 Ah standard batteries or one 14 Ah that fit in the standard enclosure.
Gateway and modem improvements. The initial version of the base station consisted of separated components for the LoRaWAN gateway (TTN Indoor Gateway, The Thing Industries, Amsterdam, Netherlands) and the 4G modem (RUT 240, Teltonika, Vilnius, Lithuania). These components were rated for indoor use; therefore, they were put in an enclosure to provide ingress protection. Having only an internal antenna could limit the range of the LoRaWAN communications. A second version of the base station used a single device that included the LoRaWAN module and 4G communications (DLOS8, Dragino, China) in an outdoor-rated device. This simplified installation and configuration, as there is only one device.
Commercial weather station. The original weather station (WH4000 SE, Froggit, Brandenburg, Germany) included an interactive display that showed the weather variables while providing WiFi data upload to a custom server. In a second hardware iteration, the station was upgraded to the model WH3000SE, that used a small WiFi receiver for WiFi transmission, reducing the size and power consumption. This receiver supports other instruments from Froggit, such as the soil-moisture sensors.
3.3. Communication Issues and Data Integrity
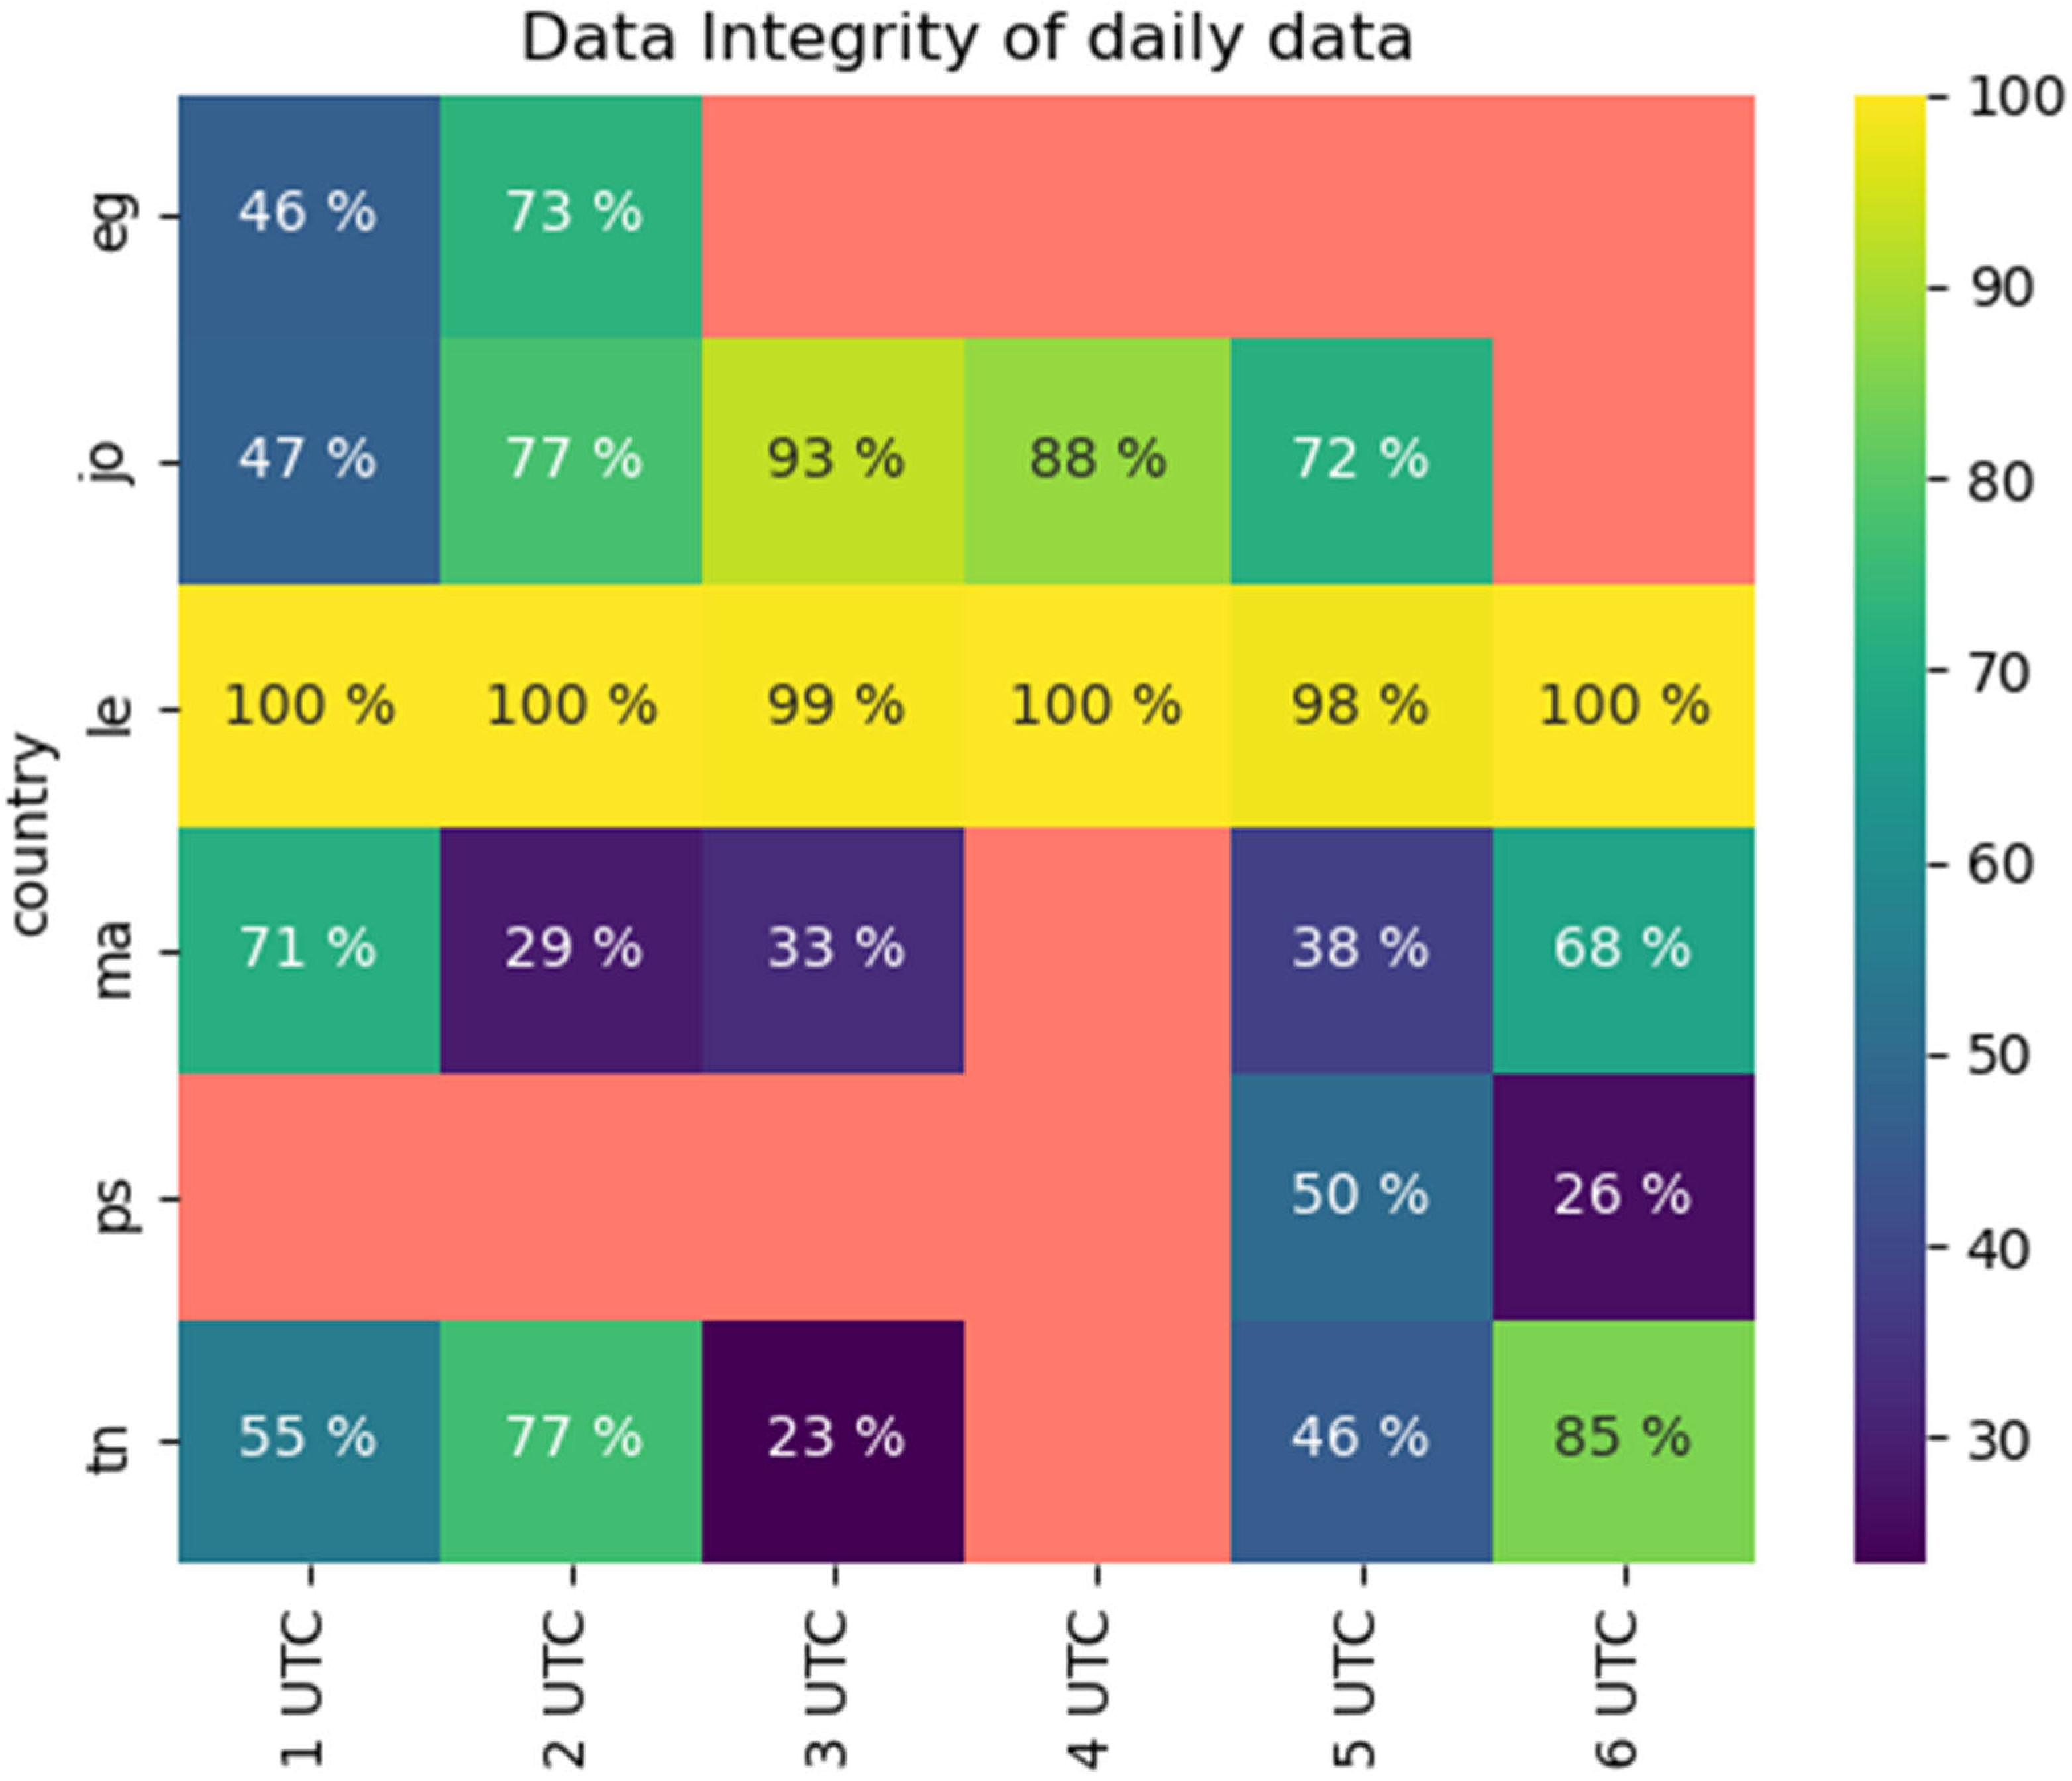
An analysis of data completeness was performed by calculating the ratio of actual observations over the theoretical number of observations for every season, taking into account the duration of each crop cycle.
The general analysis of data integrity shows a strong variation in performance across the different countries (Egypt, eg; Jordan, jo; Lebanon, le; Morocco, ma; Palestine, ps; Tunisia, tn) and seasons (season 1 = 1UTC; season 2 = 2UTC; …). The analysis at the daily scale (
Figure 1), using complete days where the ET
o can be estimated, shows that Lebanon has almost 100% of data availability for the ET
o calculation. In this particular case, the gaps in the weather data from the CORDOVA-ET were filled with backup data from the weather station deployed in the field owned by the Lebanese Agricultural Research Institute (LARI), providing seamless integration with the data-processing algorithms. In other countries, data integrity ranged from 23 to 93% depending on the country and season.
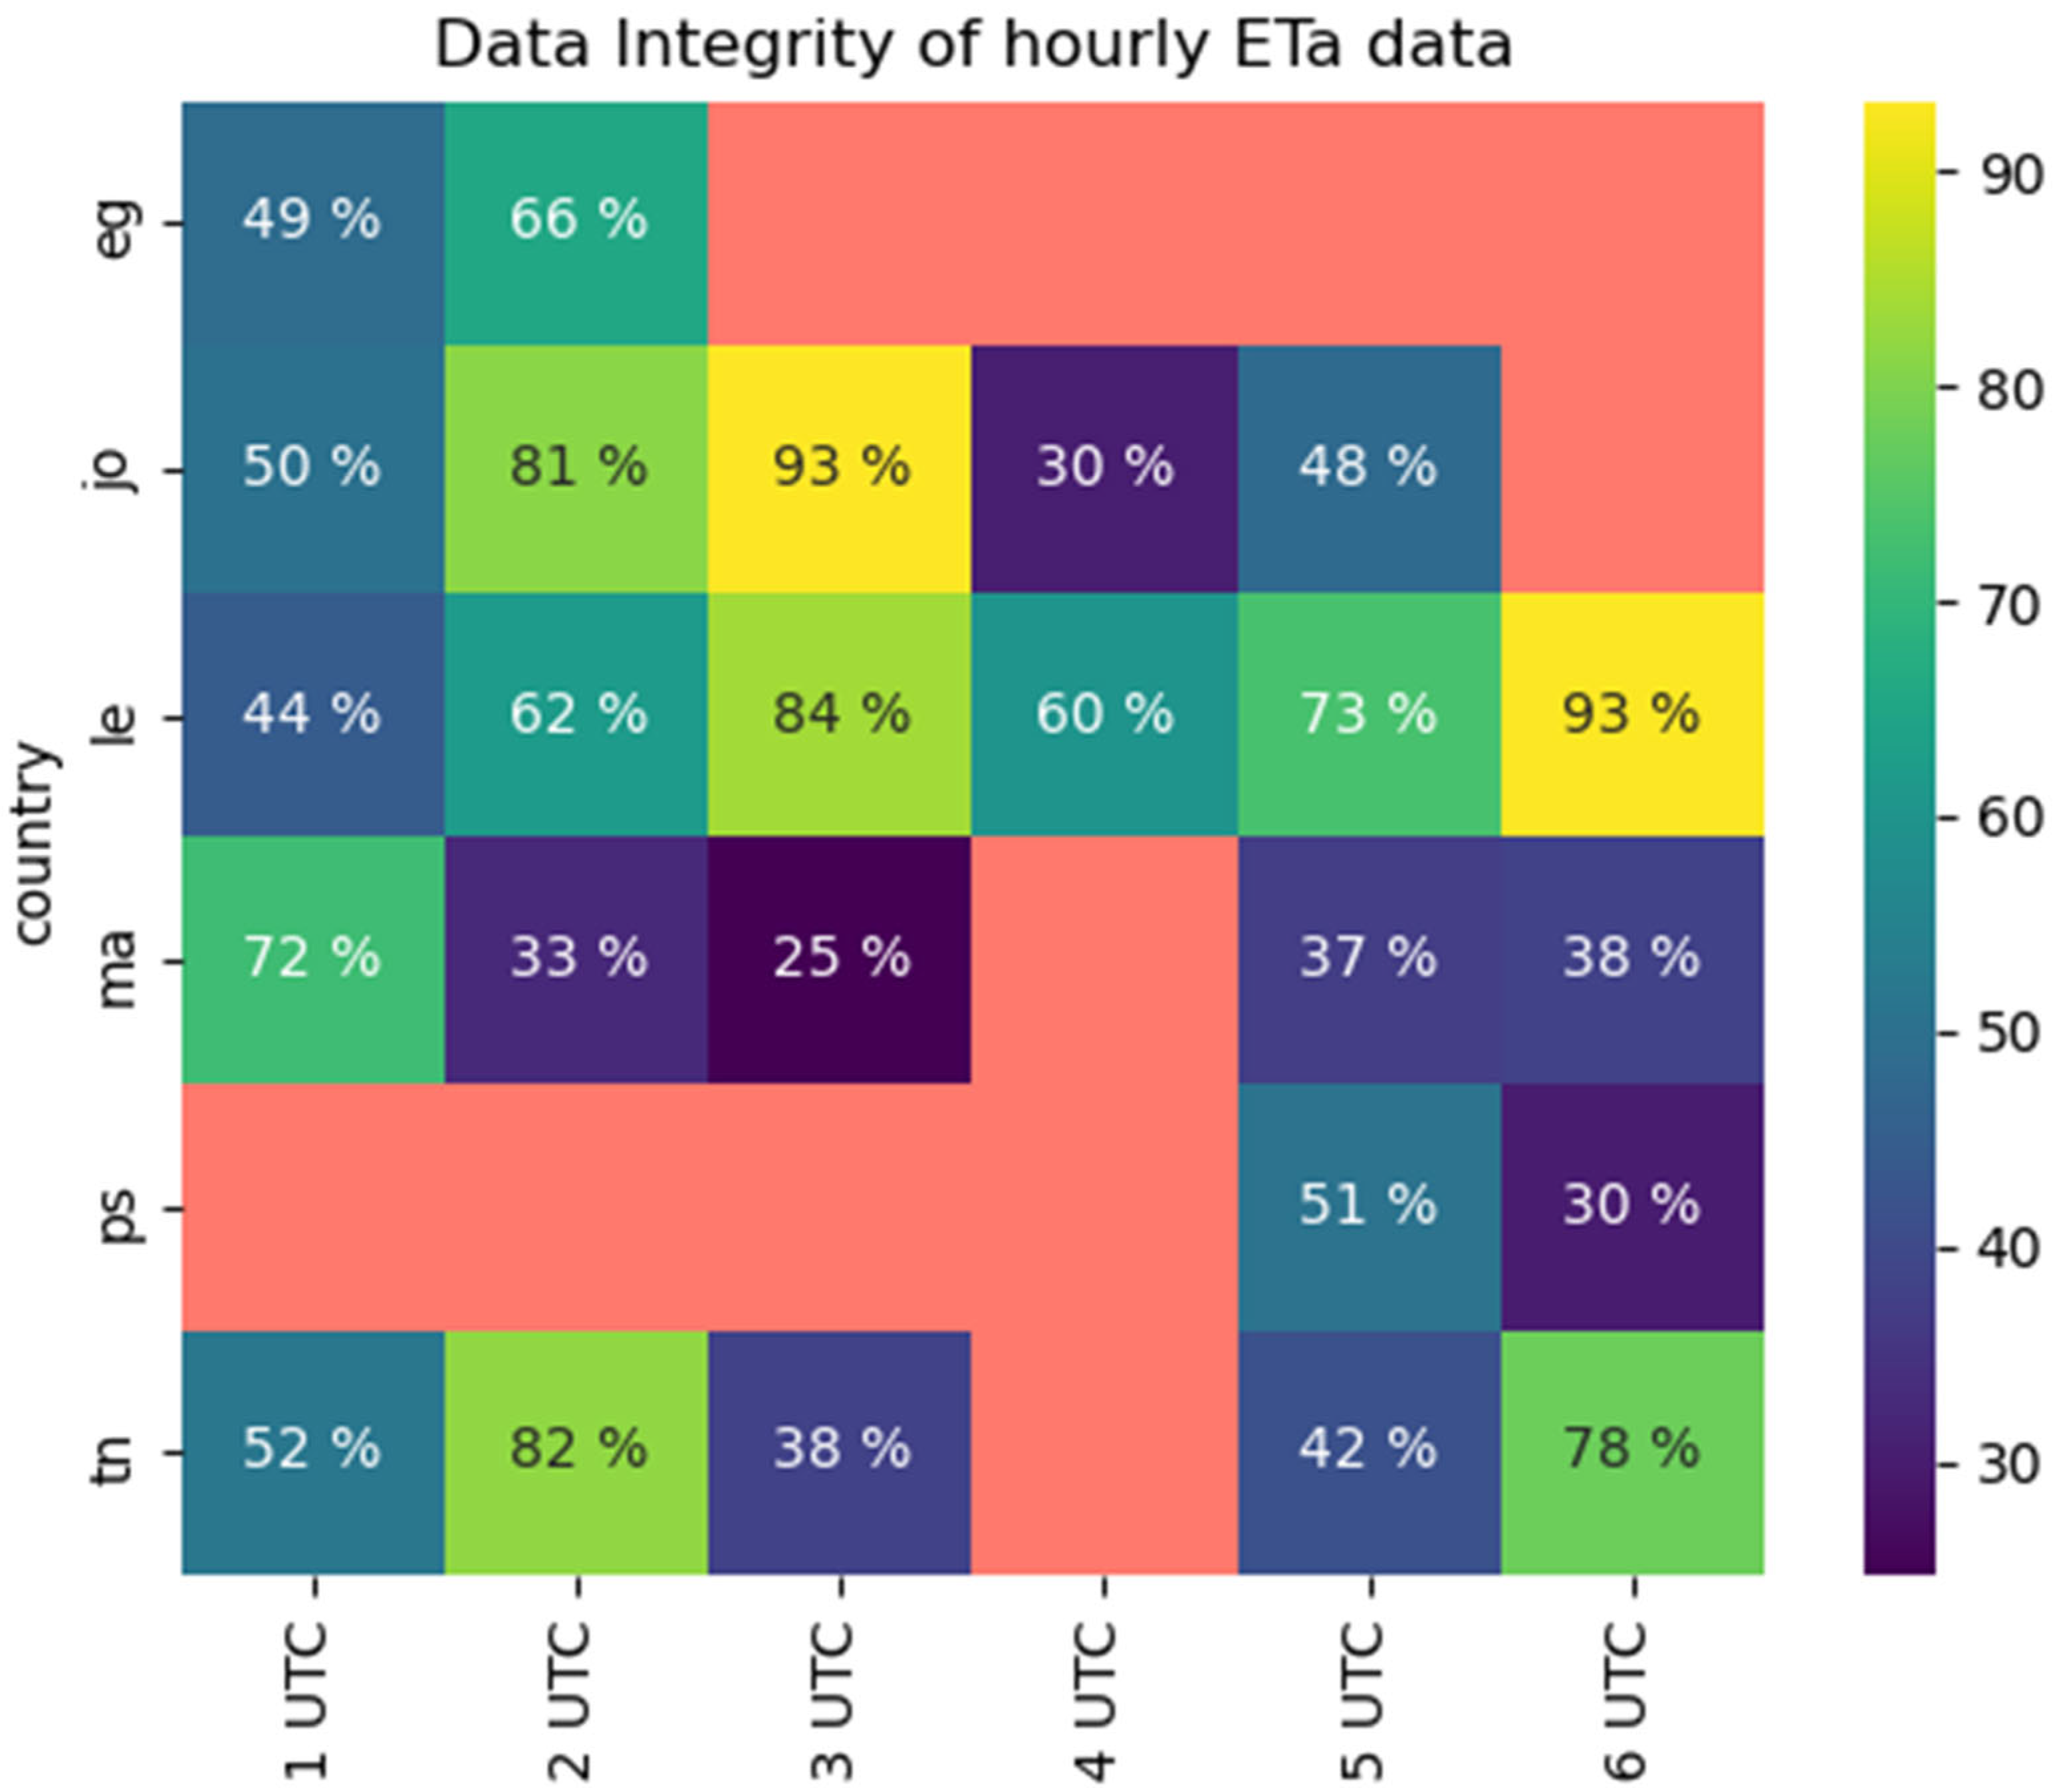
The hourly data integrity (
Figure 2), calculated as the number of hours when the ET
a can be calculated, shows less completeness, mostly due to problems in the communication or power issues in the base station. If the base station stops, all the communication from the nodes and the weather station stops. Some other times, the weather station stopped transmitting data while the nodes still transmitted. However, in that case, it was not possible to compute the ET
a because some weather variable collected by the base station was missing.
Having a completely open-source and flexible system like the CORDOVA-ET also allows it to incorporate other data sources, such as local weather station data or online datasets, that could be used to fill the gaps in case of any failure. The data discussed below are strictly those recorded by the CORDOVA-ET systems in each country during the six campaigns of this study, from the winter of 2019–2020 until the end of 2022.
3.3.1. Egypt
The two first deployments of the network were in two locations in Egypt: Zankaloun and Sakha. In Zankaloun, it was not possible to record data until the second season due to the SIM card not working. In Sakha, data were recorded from the first season, despite receiving the CORDOVA-ET system later than in Zankaloun. Both stations had minor data gaps in the first two seasons of 2020, which unfortunately were the only campaigns where data for validation were available. This is attributed to the fact that an early version of the system was deployed and suffered from the problems mentioned above. For instance, nodes progressively failed due to electronic issues caused by water and dust. These data gaps made it impossible to conduct the energy-balance calculations. Once the new version was upgraded, replacement sensors and connectors were sent, but issues with the communication between the weather station and the base station resulted in a lack of weather data for these two sites in the subsequent growing periods. This was caused by the lack of a functional SIM card, and the lack of adequate maintenance and the proper replacement of the faulty sensors.
3.3.2. Jordan
The station was installed halfway through the crop cycle in the first season. Season 1 worked well with minor gaps until the end of season 2 (November 2020). To carry out maintenance work, the station was removed after harvesting the season 2 crop. In January 2021, the station was reinstalled again for season 3, gathering a very good dataset with 93% data integrity. In season 4, the importance of correctly placing sensors was highlighted, as the recorded canopy temperature reached 55 degrees Celsius, which indicates that the sensors were probably detecting soil rather than plant temperatures. When the ground cover increased as the crop developed, canopy temperatures decreased markedly, being similar to air temperatures. This suggests that the canopy-temperature sensor was oriented along the crop rows in a way that it measured the temperature of the soil surface rather than the crop. Consequently, the data integrity for calculating the ETo was 88%, while the ETa could only be calculated for 30% of the data due to the canopy temperature errors. During season 5, there was a lack of data from the nodes due to communication failure with the base station, reducing the integrity of the hourly ETa data.
3.3.3. Lebanon
The CORDOVA-ET system was installed in Tal al Amara (Lebanon) in 2020. Its Froggit weather station experienced some port blocking issues by the mobile phone operator that prevented its communication with the server. In this case, we have used the data from the weather station operated by LARI for comparisons. The data were uploaded to the server using custom scripts to make it available to the data processing. Due to power failures, only two of the four nodes for ETa determination worked properly over the years.
3.3.4. Morocco
The initial seasons in Morocco provided very irregular datasets due to continuous communication and power issues in the base station. Moreover, one of the main problems found in this deployment was that the sensors were installed below the crop canopy, so reliable measurements were drastically reduced.
3.3.5. Tunisia
During the first season, the nodes for measuring ETa experienced battery issues (except for one node), causing intermittent data gaps. The data from season 2 correlated very well with a comparative dataset, with some small data gaps. There were communication and sensor issues that resulted in incomplete datasets and missing seasons (from the end of season 3 until midseason 5). There were also some known issues with the precipitation data due to a bug in the firmware of the weather station. The daily rainfall values were not reset correctly, resulting in repeated values, even when there was no precipitation. This was fixed in the firmware later in season 5. Finally, in the last season, the issues were solved, and a good dataset was obtained with minor gaps. In addition, a new deployment system was added to Tunisia, which has been working correctly since the end of June 2022 with good data integrity.
3.3.6. Palestine
Palestine was the last country that was incorporated to the NENA ET network, so there are only two seasons of data. In both cases, there were data gaps due to issues with the SIM card and communication issues with the CORDOVA-ET server. In the case of season 6, the data were very limited and the observations of the ETo and ETa are scarce, as discussed below.
3.4. Validation of Individual Meteorological Variables and Estimates of ET
Throughout the season and across different countries, the primary weather variables, as well as the calculations of reference evapotranspiration, were compared with the ERA5 data. By conducting these comparisons, we aimed to validate the reliability and robustness of the ET calculations, further enhancing the integrity and confidence in the dataset obtained.
This comparison involved a comprehensive analysis of ETa values, ensuring a thorough evaluation of the accuracy and consistency of the estimated evapotranspiration values in relation to the reference data provided by ERA5.
3.4.1. Primary Weather Variables
Comparing the data of a new device is of utmost importance to assess its reliability and accuracy. When introducing a novel device into a system or study, it is essential to evaluate its performance against established standards or reference devices. This comparative analysis allows for the identification of potential discrepancies, biases, or limitations in the new device’s measurements. By comparing data, researchers and practitioners can determine the device’s level of accuracy and reliability, enabling informed decision-making and ensuring the validity of subsequent analyses and interpretations. Furthermore, this process helps establish confidence in the new device’s capabilities and builds trust in the collected data. It enables users to identify any potential variations or deviations from expected results and implement appropriate adjustments or calibrations as needed. Ultimately, the act of comparing data from a new device is crucial for ensuring data quality, facilitating meaningful comparisons, and enhancing the overall robustness of scientific and technical investigations.
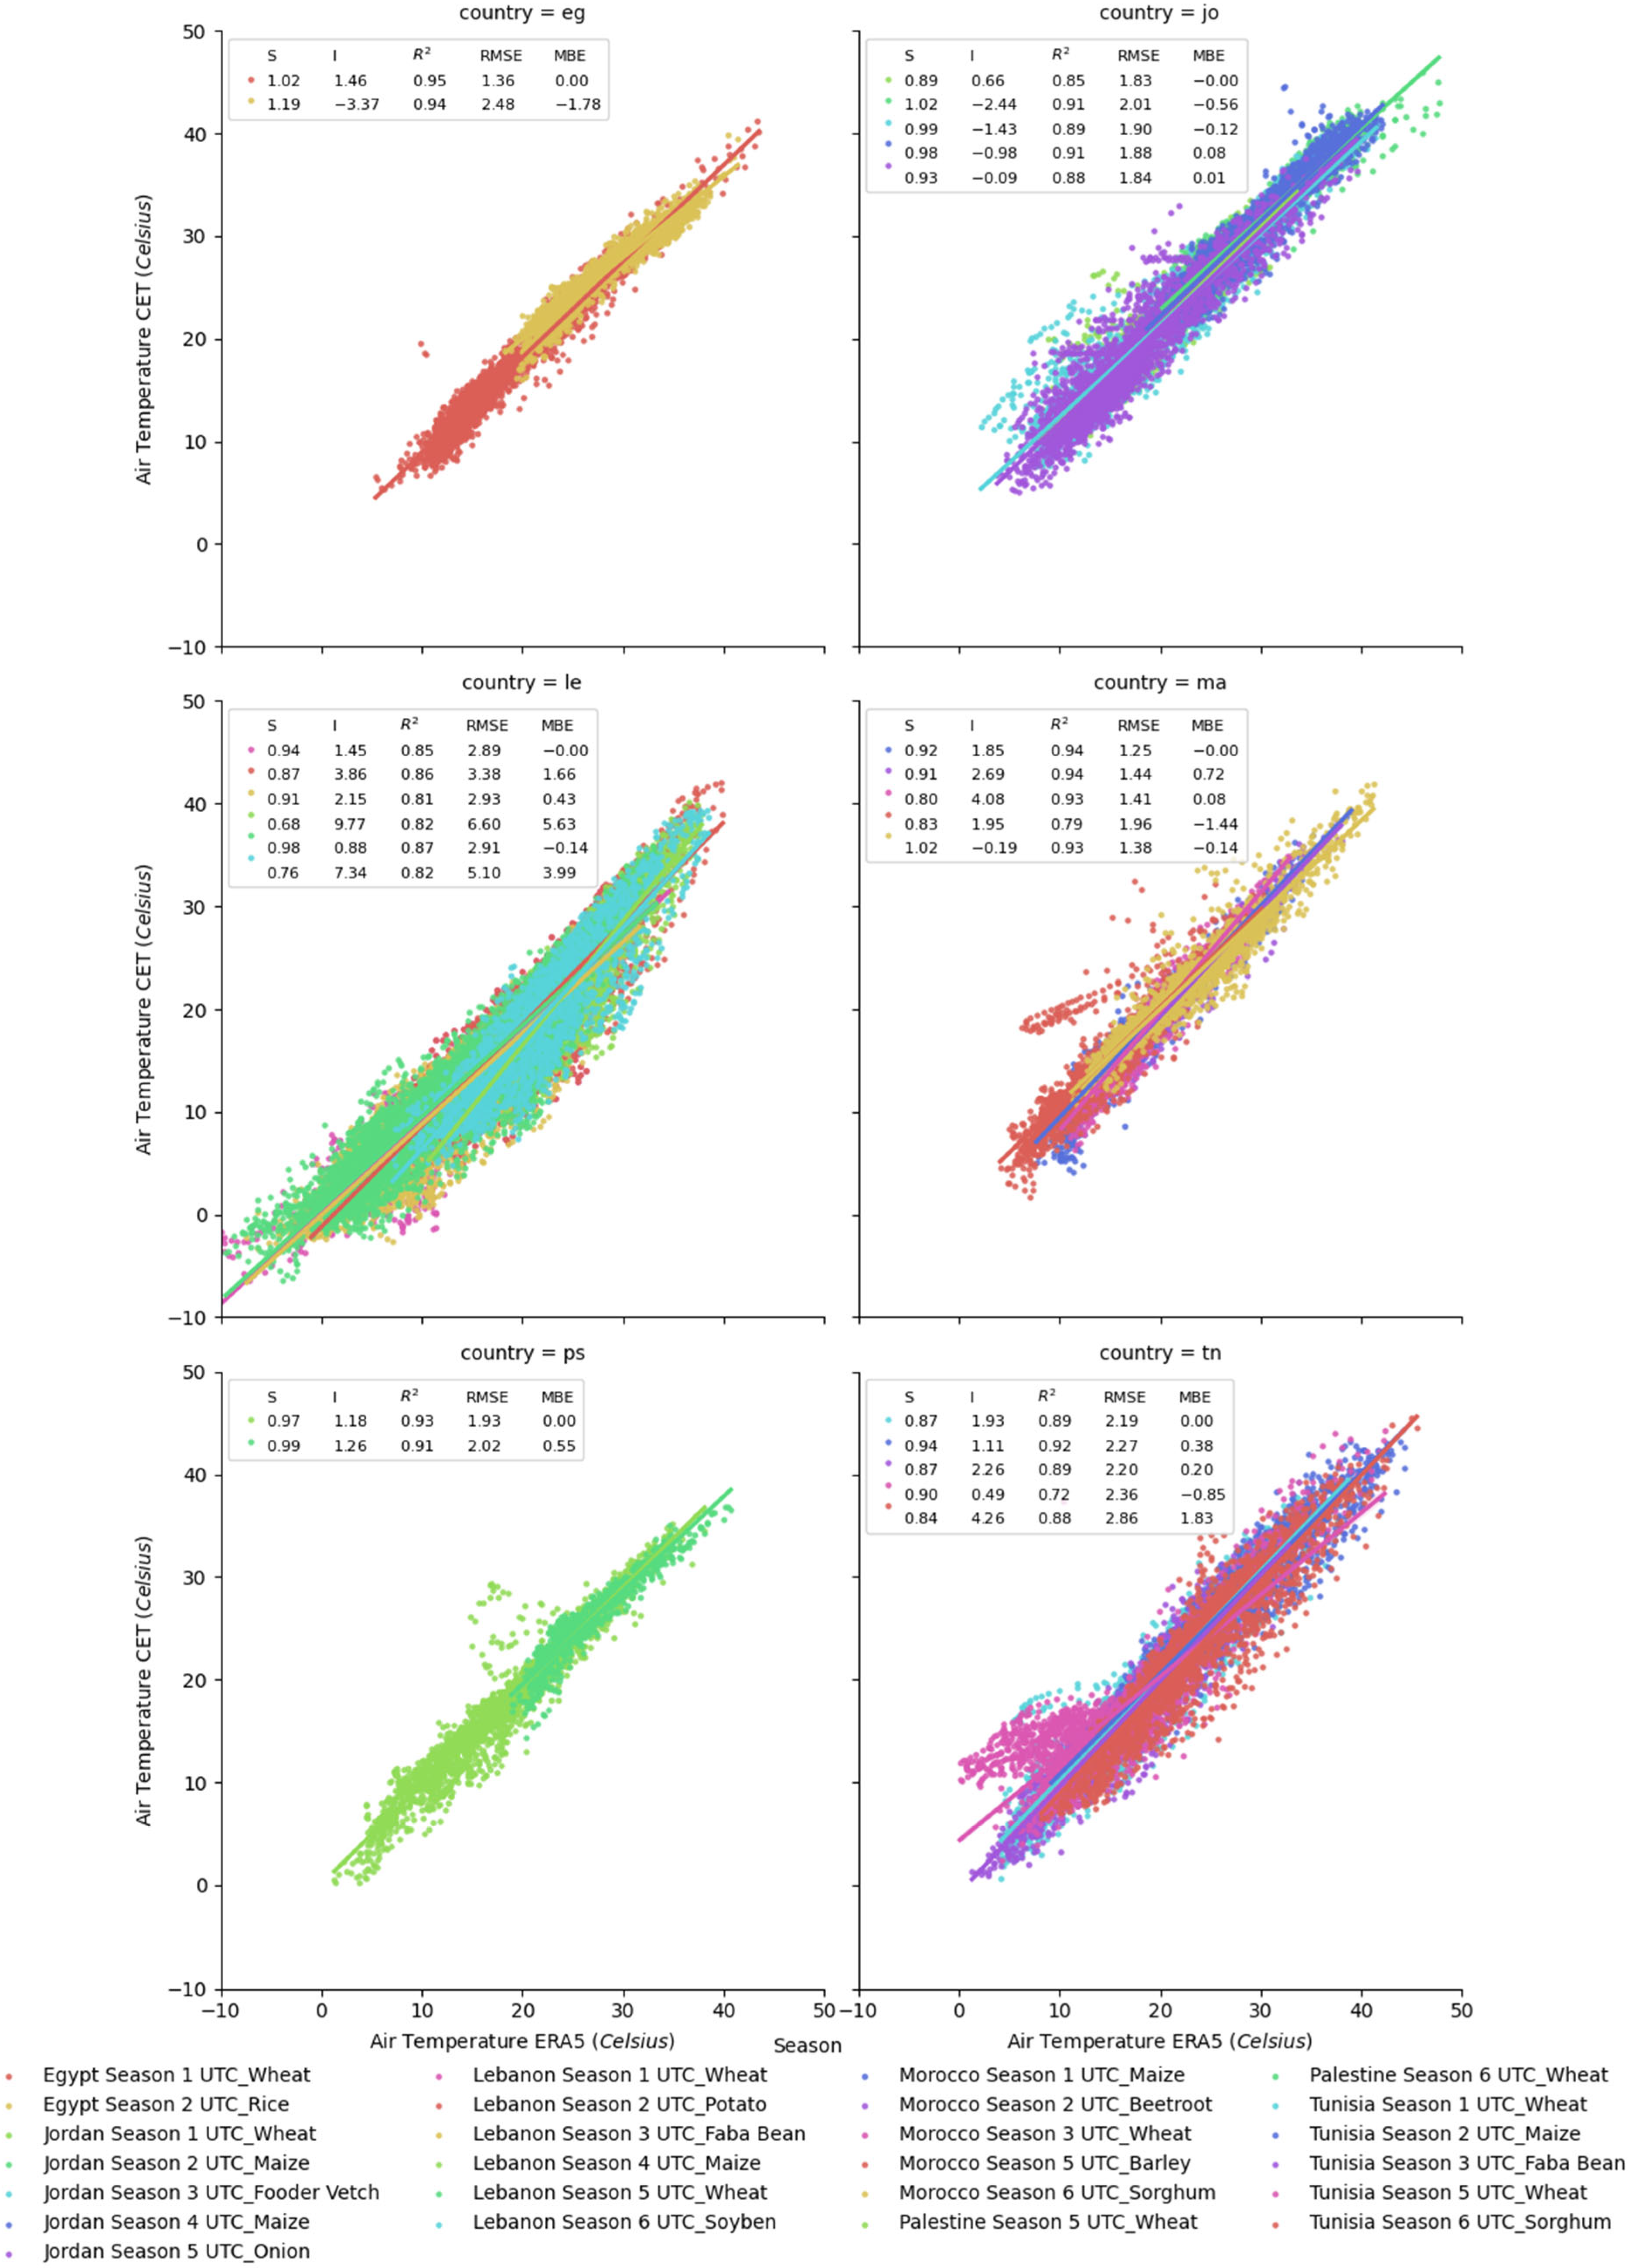
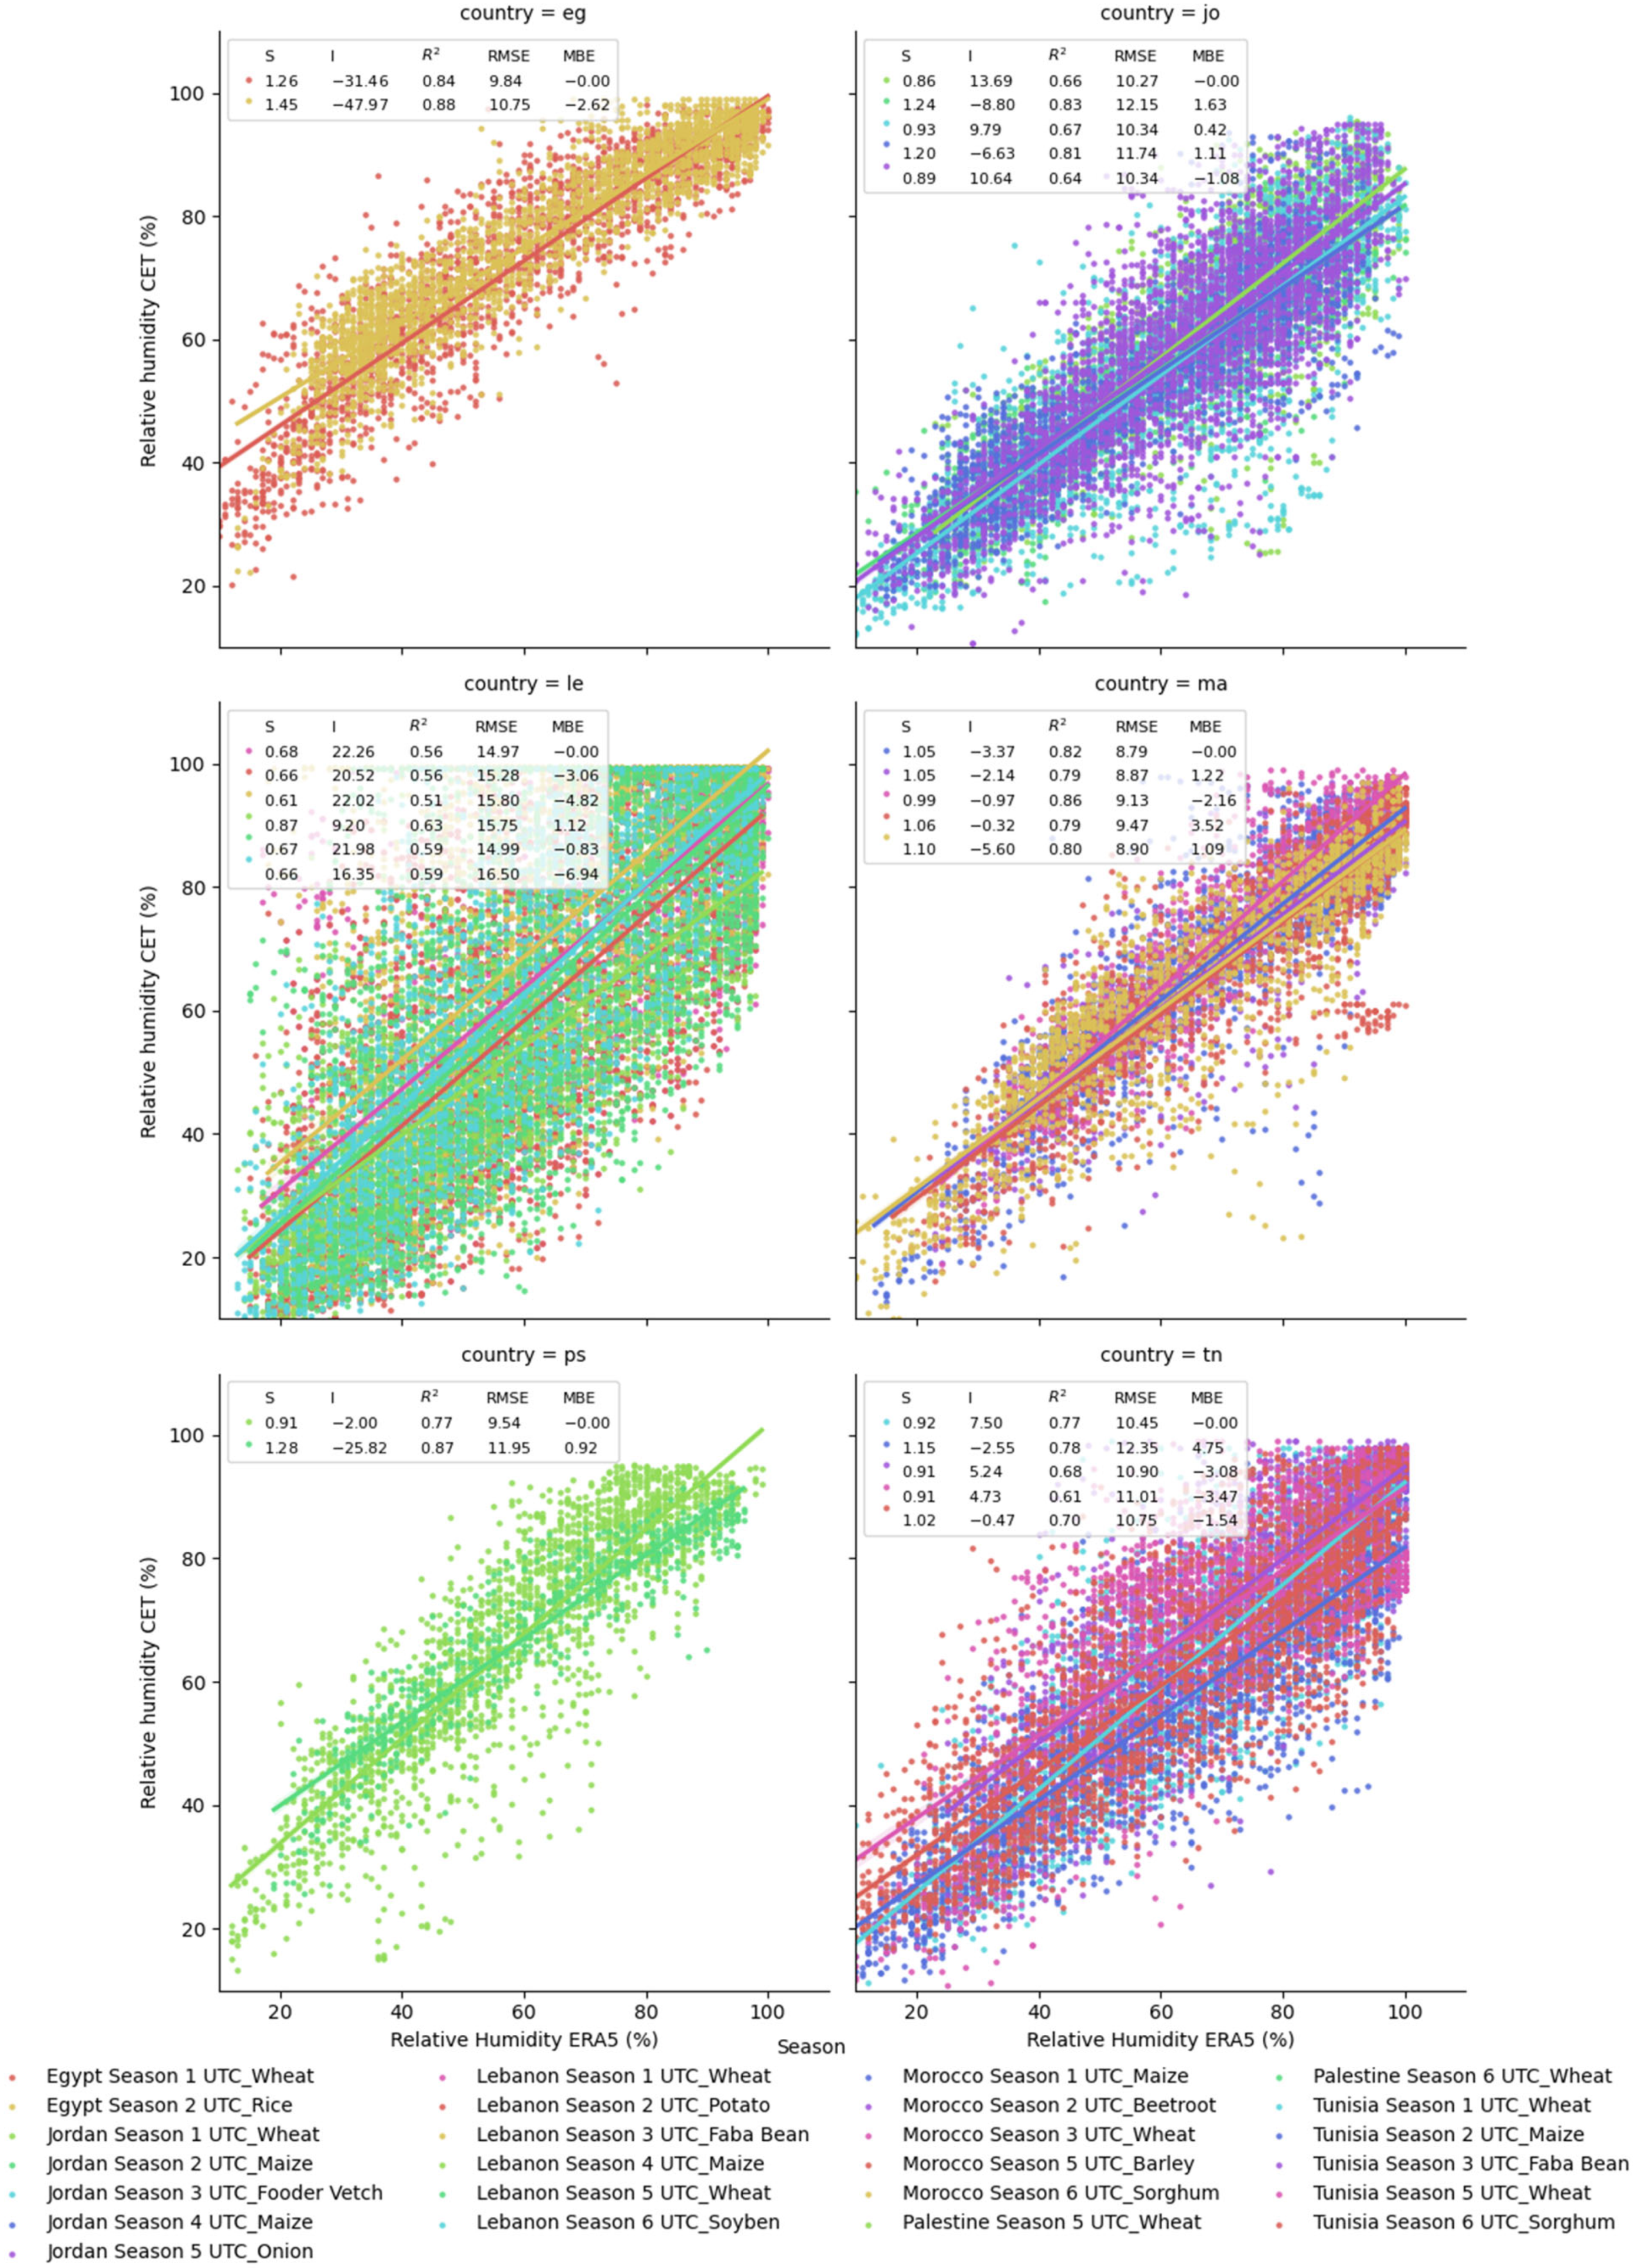
The comparison of the data obtained from the variables of the CORDOVA-ET with ERA5 reveals crucial information about the studied meteorological variables. These results provide a statistical understanding of the analyzed variables (
Table 4) and their relationship with the predictors used in the study. Detailed analysis for each variable is available in
Appendix A (
Figure A2,
Figure A3,
Figure A4 and
Figure A5).
Air temperature showed a very good agreement between the field measurements and ERA5 (R
2 = 0.92 and slope = 0.9). Likewise, shortwave solar radiation also showed good correlation and slope (R
2 = 0.89 and slope = 0.92). However, the relative humidity showed poorer performance, with an R
2 of 0.77 and a slope of 0.87. The large dispersion observed in the dataset shows very different behaviors across the different sites, which suggests local effects that may be missed by the ERA5 (
Figure A3). Wind speed exhibited the widest differences between the two datasets, also reflecting the impact of local variations. The CORDOVA-ET measurements strongly underestimated the ERA5 wind speed values, with an average slope of 0.52 and R
2 of 0.46 for all the seasons (
Figure A5).
3.4.2. Reference Evapotranspiration (ETo)
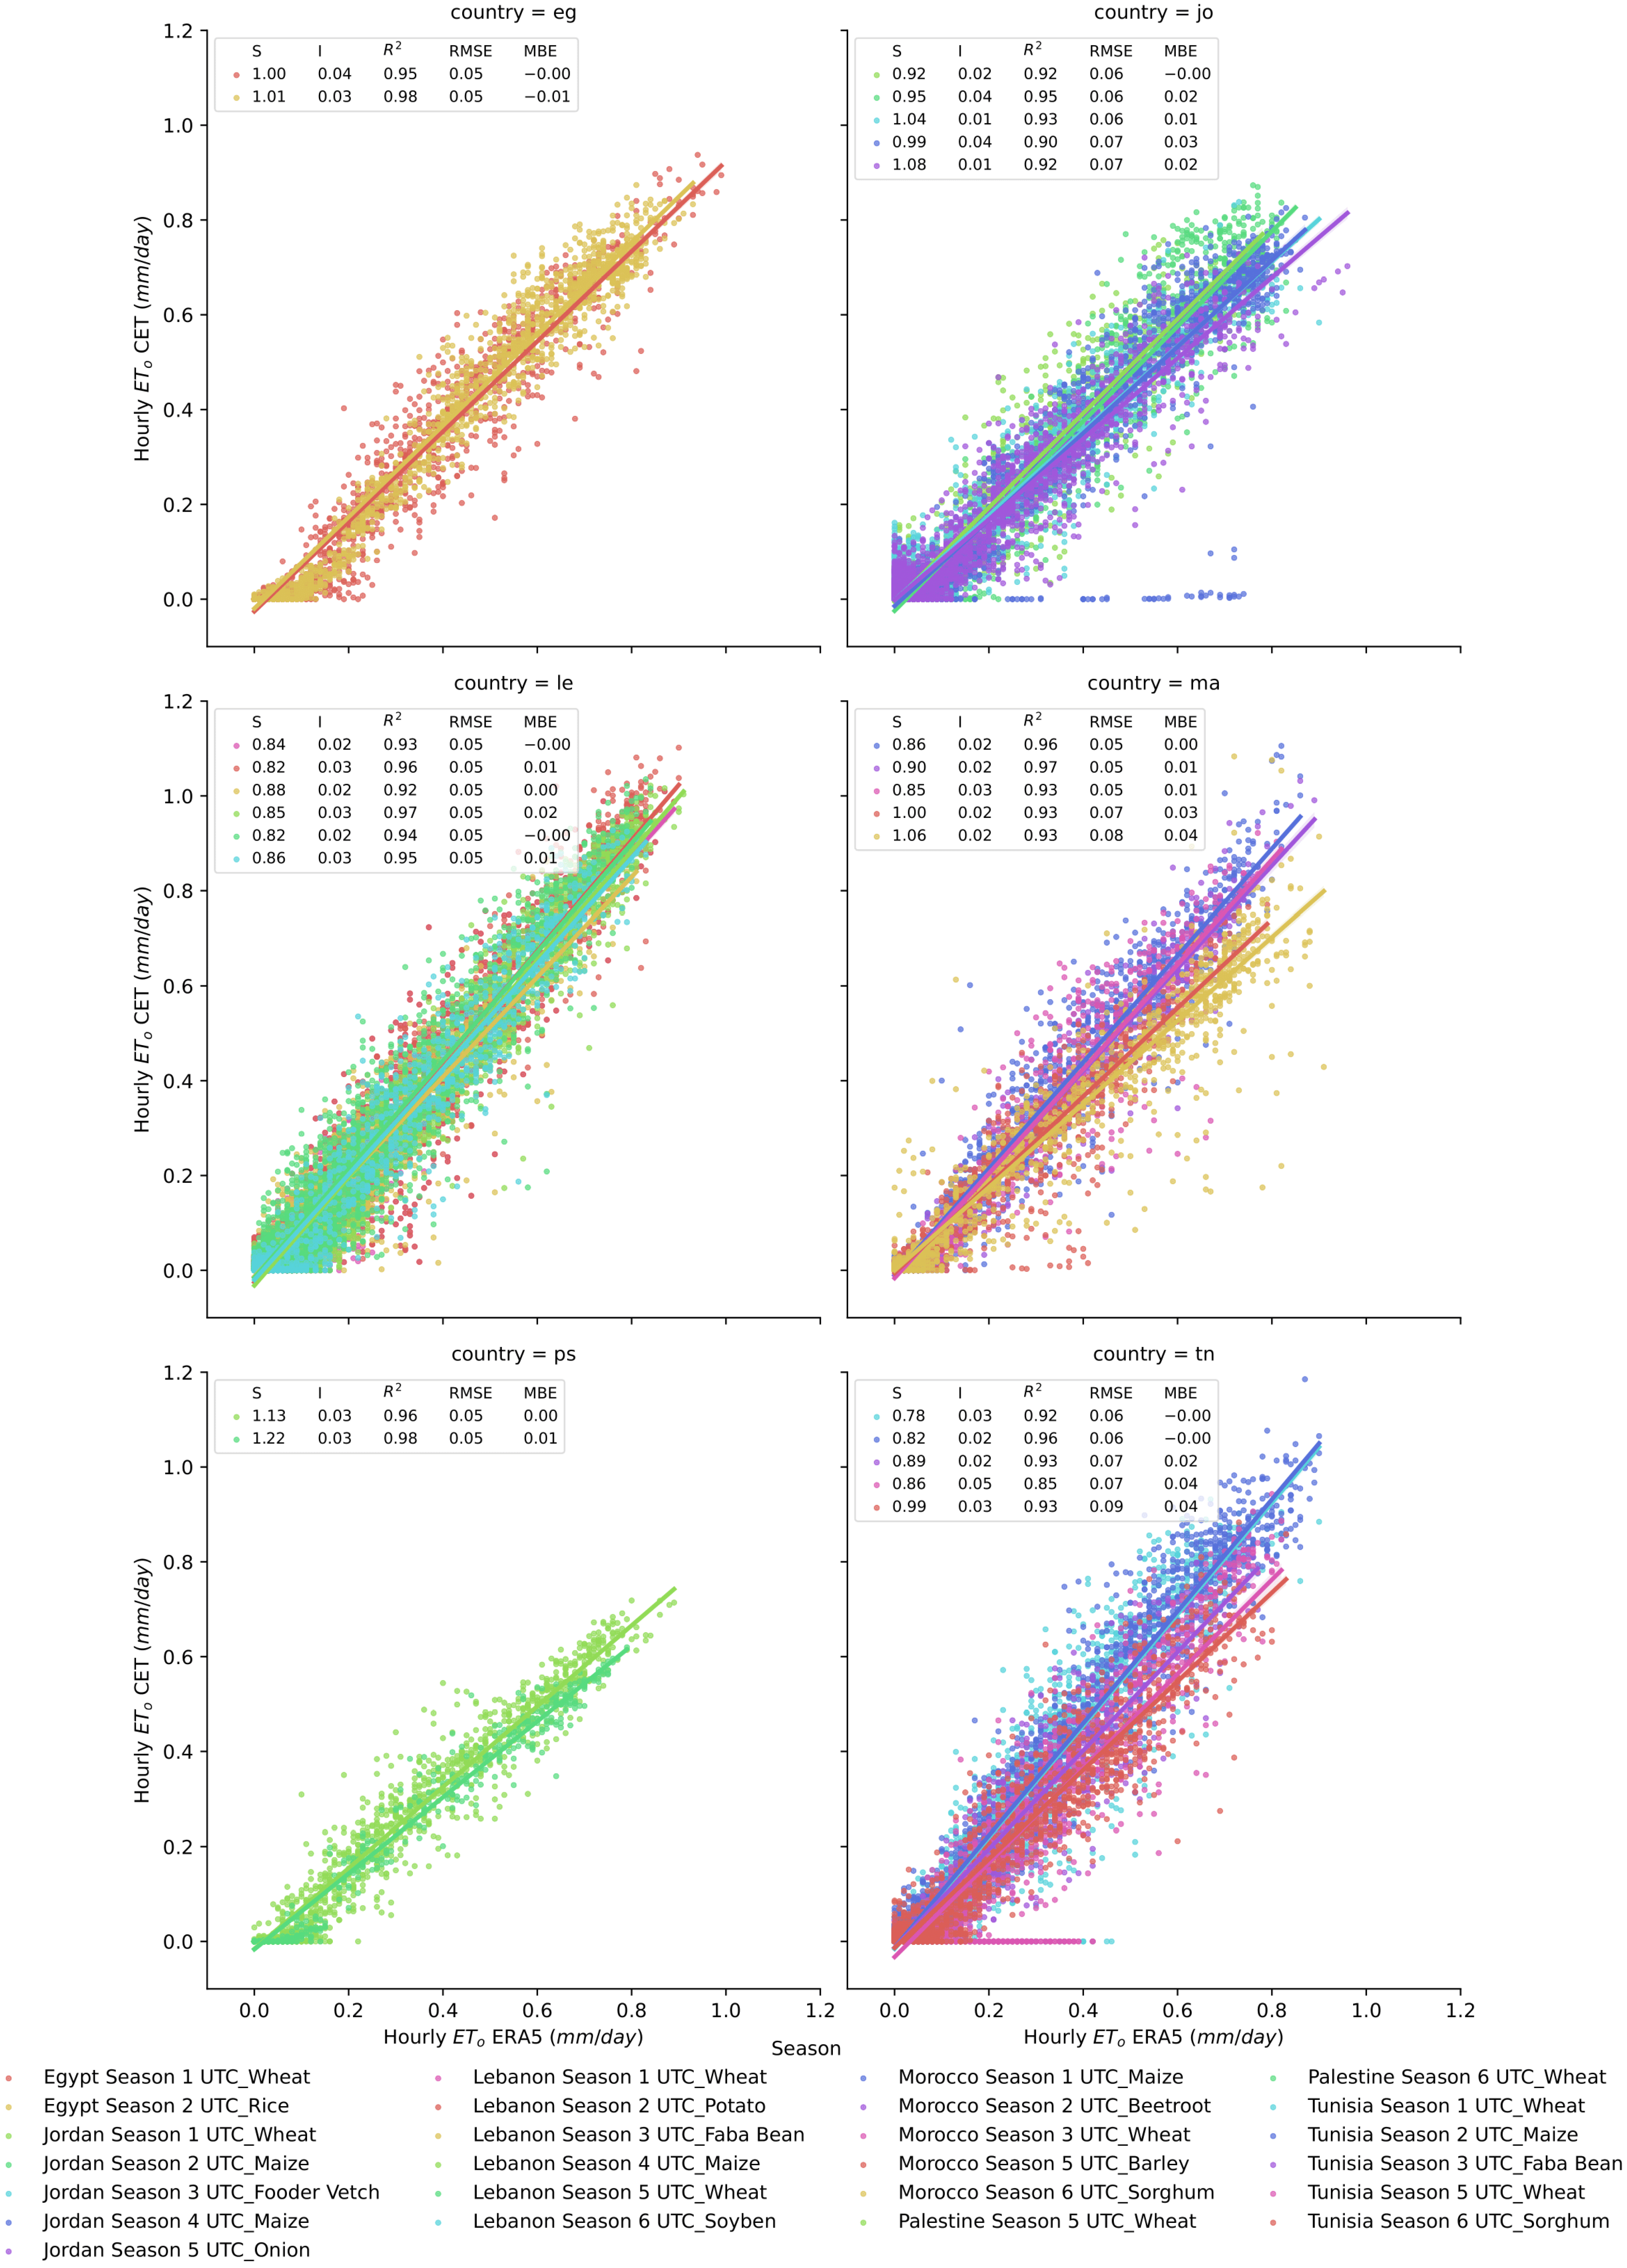
An overall comparison for each country and season was performed comparing the hourly estimates of the ET
o from the CORDOVA-ET and the ET
o calculated from ERA5. The results showed a very strong linear correlation between both variables, with a slope of 0.90, RMSE = 0.08, and MBE = −0.01 mm/h.
Figure 3 show the correlations through the six campaigns in each country.
For daily calculations, only complete days with 24 h of hourly calculations were taken into account. The results showed very strong linear correlation between the observed CORDOVA-ET ET
o and the estimates from ERA-5. Except in two seasons, Jordan in season 3 and Morocco in season 5, the R
2 ranged from 0.72 to 0.58. This issue was identified as an incorrect height of the weather station that allowed the crop to overgrow the station, resulting in incorrect wind and radiation measurements. Most slopes were close to 1 and coincident across the years, except for Egypt, with slopes of 1.27 and 0.75 for wheat and rice, respectively, and Palestine in season 5, with 1.35. The root mean square error ranged from 0.43 to 1.46 mm/s for all the other seasons (see
Figure 4).
The detailed comparison of the CORDOVA-ET with ERA5 estimates at daily and hourly intervals showed good correlation, but a consistent underestimation of the ETo (a slope of 0.89 as the average for all sites and seasons of the daily data), suggesting that there may have been some calibration issues with the pyranometer used in the CORDOVA-ET station, causing an underestimation of solar radiation. The new pyranometer chosen to replace the original one and other improvements in the weather station should correct this problem. However, it should be pointed out that future comparative studies are needed using a more accurate check than the ERA5 dataset to determine whether the ETo is underestimated by the CORDOVA-ET, or whether the ERA5 method overestimated this variable. For that purpose, comparisons between the CORDOVA-ET system and well-calibrated, research-grade agrometeorological stations seem desirable. Network issues and proposed solutions.
3.4.3. Estimates of Actual Evapotranspiration (ETa)
Throughout the six seasons, we acquired a dataset of different crops in each country, including wheat in all of them due to its significance in food production in the region. This allowed us to obtain diverse and detailed ET and crop information from various regions.
In the first season, Egypt, Jordan, Lebanon, and Tunisia focused on measuring the evapotranspiration (ET
a) of wheat. As these were the initial stages of the network, we were able to obtain approximately 50% of the hourly ET
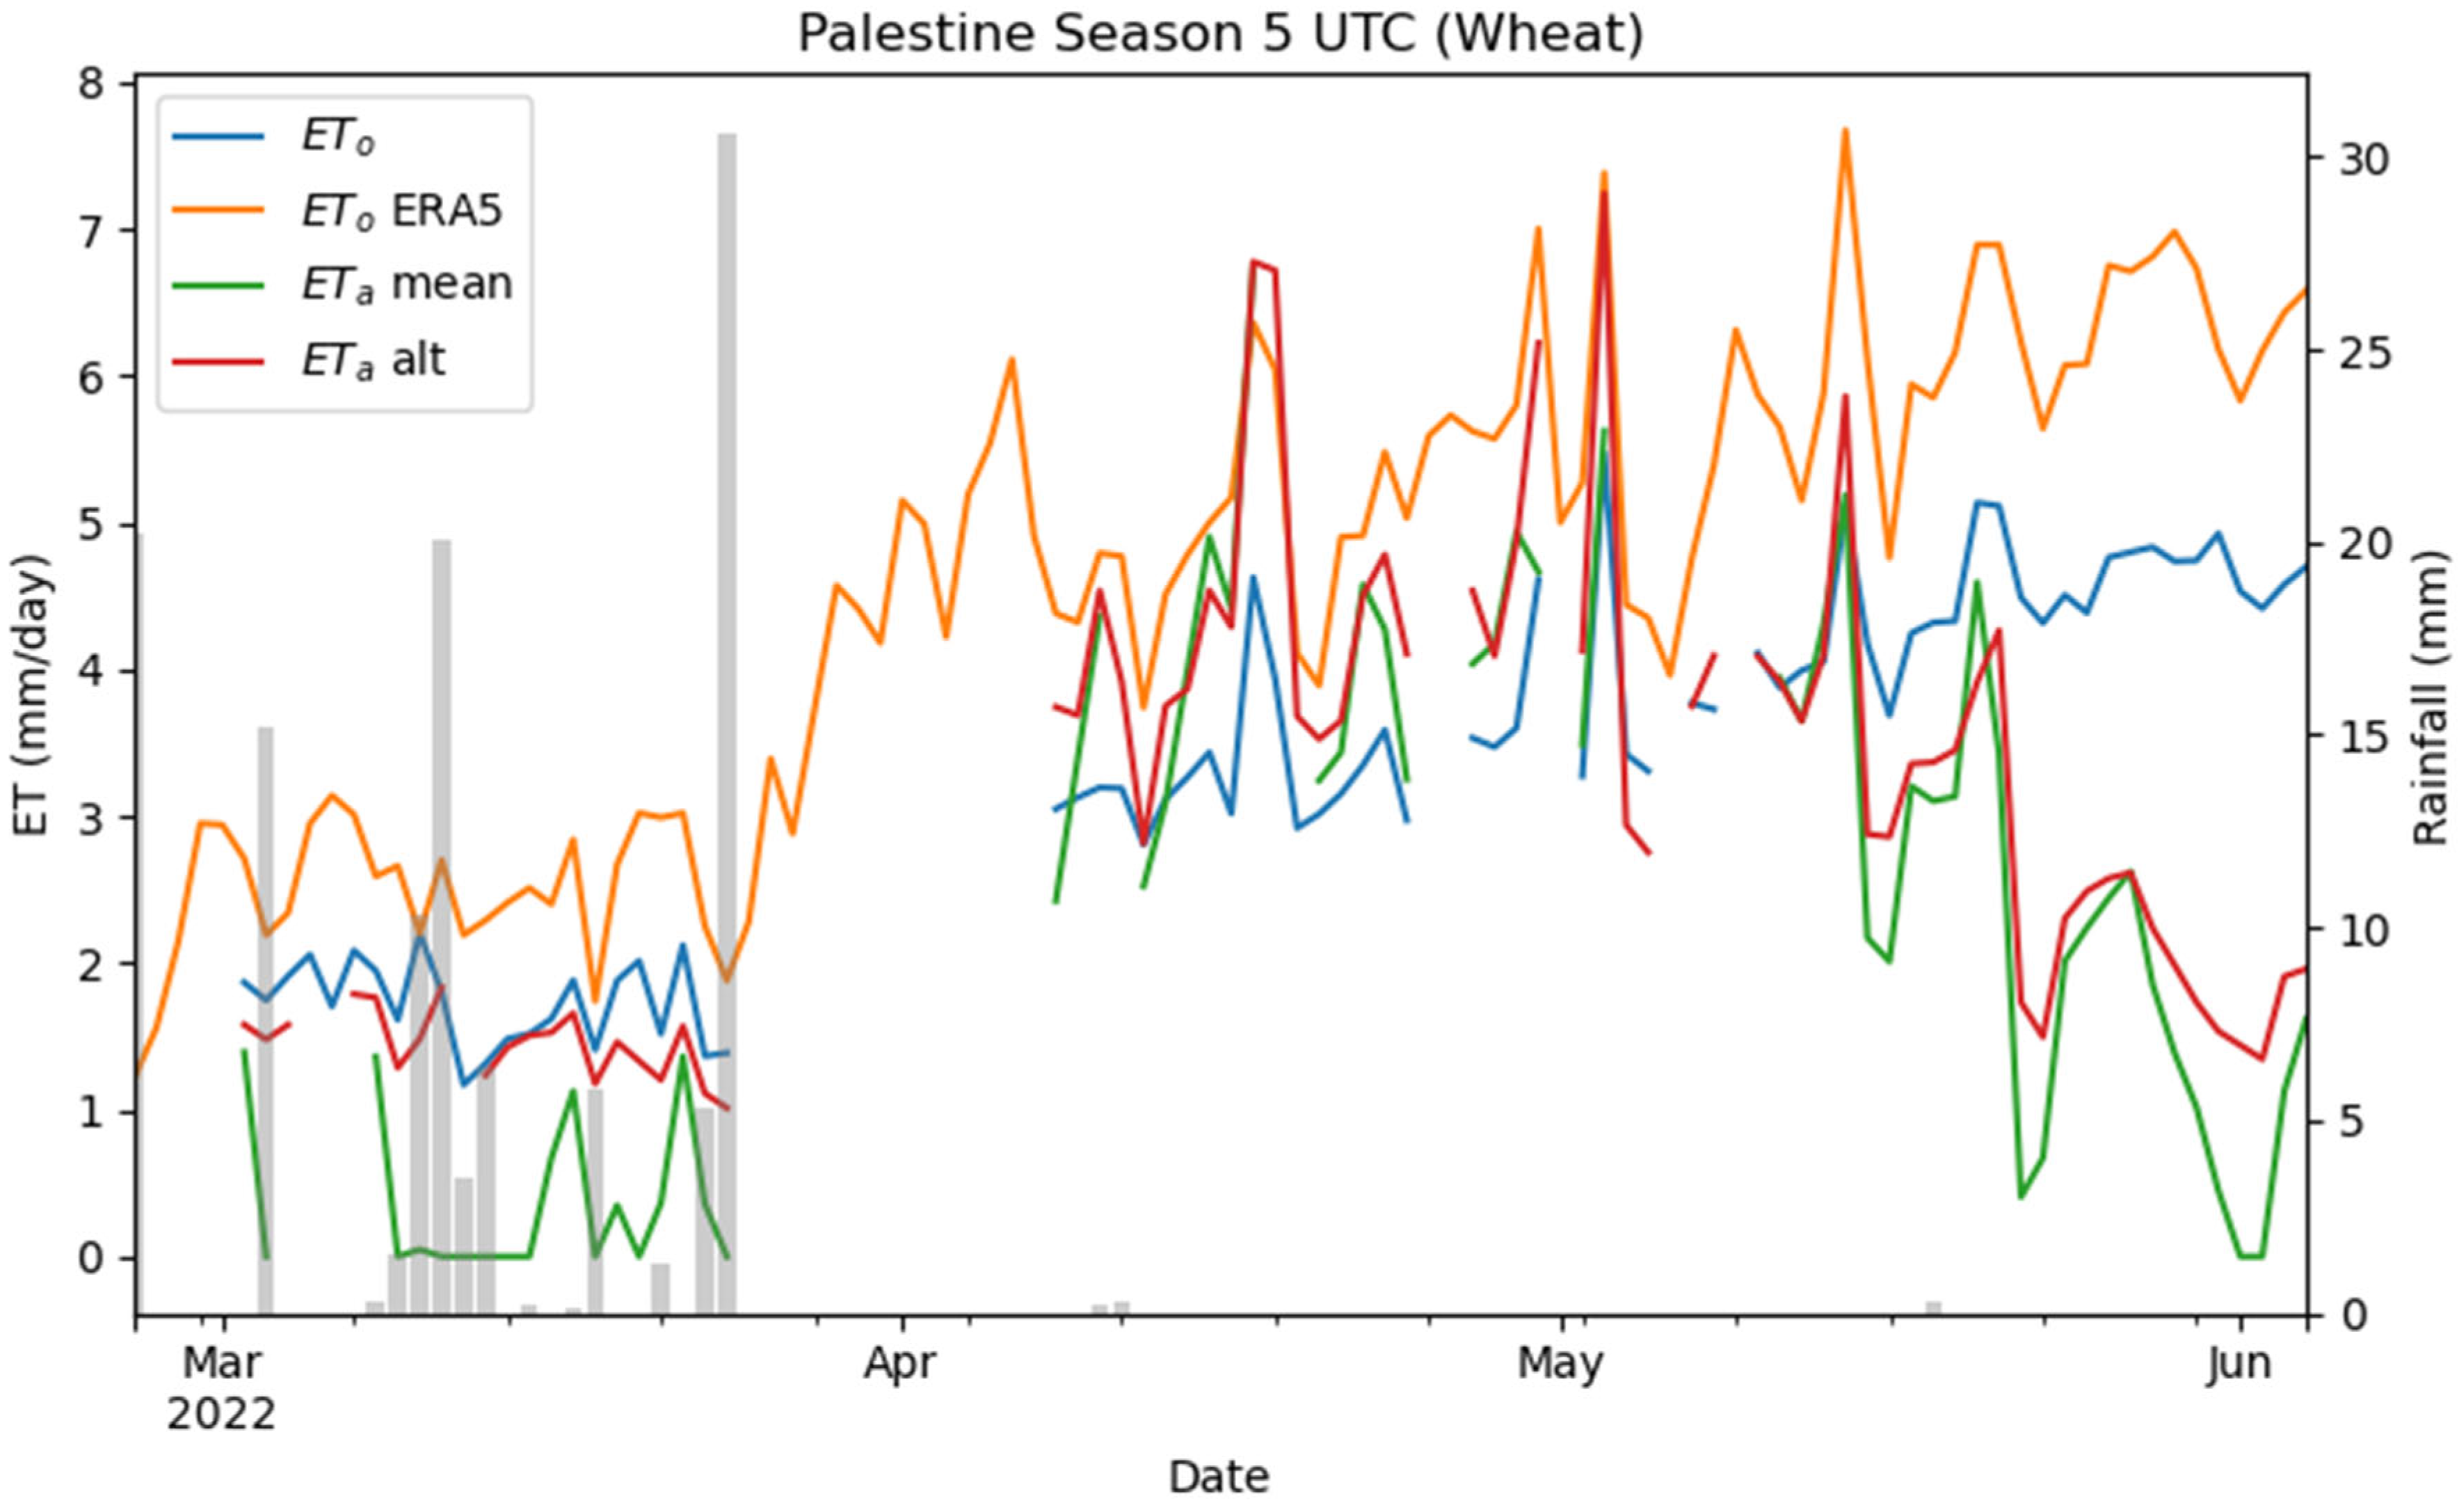
a data. Building upon this progress, in the fifth season, the wheat ET
a was measured again, with Palestine joining the effort. In this season, Lebanon emerged with the largest dataset, achieving a remarkable 73% data coverage. As a result of the dataset obtained, it was shown that the winter wheat ET
a increased until the grain-filling stage, and then the ET
a fell, as is common for the wheat crop. The ET
a tracked closely the ET
o variations caused by fluctuations in the evaporative demand until the onset of senescence, when there is a strong decline in transpiration. The fast senescence around May resulted in ET
a values that went sharply from less than the ET
o to a very low fraction of the ET
o as the wheat dried up (
Figure 5 and
Figure 6).
A valuable dataset of crops other than wheat was also obtained throughout the six seasons in the participating countries. The data-collection process included other cereals, vegetables, rice, and other crops of interest, such as maize, faba bean, sorghum, fodder vetch, onion, and soybean. This comprehensive dataset for various crops provides a solid foundation for analyzing and understanding the specific characteristics and requirements of each crop in different geographic regions.
Figure 7 shows the example of onion in Jordan, a very important crop in the region with very limited information on water productivity.
The results of the validation using reanalysis data showed that the use of a cost-effective commercial-grade weather station with the calibrations and data-handling algorithms developed in this project can provide consistent ET
o estimations comparable to established agrometeorological weather station networks. The combination of canopy-temperature sensors and the modeling of variables, such as the net radiation, also proved to provide accurate estimations of parameters that would be needed to apply the energy balance to determine the ET
a [
7].
3.5. General Issues and Proposed Solutions
Over more than two years of operation, multiple issues related to operation and maintenance were identified, all resulting in improvements in the different iterations of the prototypes supplied to the countries.
3.5.1. Power Consumption
Power issues affecting the base station were the primary cause of communication issues and data gaps. The initial power requirements were underestimated and limited by shipping logistics. It worked well during the summer months, but the solar power and energy storage were limited during the winter months or following several cloudy days. After testing, it became clear that 50 W solar panels are a minimum requirement for the stable operation of all the components of the base station. In some countries, they are using main power, which is a great option, if available.
In addition, short circuits and excessive power consumption could be due to corrosion and water intrusion. The canopy-temperature sensors have occasionally experienced these issues as well. Corrosion and water ingress have led to sensor malfunctions, along with short circuits and excessive power consumption. The early version of the air-temperature sensor proved to have serious problems with corrosion due to the lack of enclosure thickness and the electronic components of the original board (BME280, Adafruit, New York, NY, USA).
To solve these problems, for countries that already had old-version stations installed, extra 25 W solar panels were provided to connect them in parallel. The dimensions of the solar panel and batteries were increased. Also, new hardware for the gateway and modem were selected to integrate in a single device the 4G modem and the LoRaWAN gateway, resulting in more efficient power usage.
3.5.2. Device Assembly and Programming
During the assembly process, which required certain experience to ensure proper assembly, a variety of issues were faced, including:
Cables on the screw terminals breaking down and bad soldering. This damage was caused by inappropriate and incorrect assembly;
Despite the attempts to apply conformal coating to the exposed electronics, the early version of the air-temperature and solar-radiation sensors still showed poor endurance under extreme climatic conditions;
Limited spare-parts production capacity for 3D-printed parts.
These problems arose during deployments and were addressed by providing an integrated set, assuring quality, optimizing the accuracy and reliability of measurements, and increasing the degree of sealing to improve protection against harsh conditions.
Additionally, nodes were also improved in each iteration, and there was no solder involved in the newer version or the 3D-printed parts, resulting in more reliable hardware. The last sensor upgrades enhanced the approach, ensuring a faster and more efficient installation of sensors, enabling swift deployment in various environments.
3.5.3. Maintenance
Excess dirt (spider nets, bird droppings, dust, and mud) on sensors distorted the measurements. This was especially critical for the pyranometer and canopy-temperature sensors and solar panels. The lack of maintenance of the solar panels resulted in the gradual loss of battery capacity, resulting in battery degradation.
A monthly check, or even weekly in extreme conditions, of the infrared thermometer, and a cleaning of the solar panels and the pyranometer, is required. Every six months, or monthly in extreme conditions, the tightness of the boxes should be checked and the air-temperature sensor and the infrared sensor cleaned. Finally, annually, it is recommended to check the status of all the batteries that make up the station. A checklist with the task and frequency was written and can be consulted for more detail in the annex of
Appendix A (
Table A1).
3.5.4. Data Management
The initial web-based interface provided real-time data visualization, basic analysis capabilities, and a way to download data directly from the graphs. However, it was clear from the initial feedback that it was not very practical, and downloading data from different sensors required several download actions and the merging the data. The alternative of using Python code was not very practical for many users without programming experience, or in cases where one wants to quickly download the data for analysis.
Therefore, based on the feedback received, a simplified solution for downloading the data easily in flexible formats was developed. This web-based tool, called “CORDOVA-ET Data Download”, can be accessed from the main menu in the web-based application. It bundles up all the calculations for ETo, ETa, and data aggregation for the raw measurements.
3.5.5. Solar-Radiation Measurement
Measurements of solar radiation. This variable is critical for the energy balance. However, this has been the most challenging sensor of the whole system. The hardware issues with the selected sensor have prevented any useful measurement of radiation on the nodes. Moreover, having the pyranometer on top of the air-temperature radiation shield makes its leveled installation and routine maintenance (cleaning for dust) almost impossible. The concept of self-contained nodes with all the measurements included is attractive, but in this case, it did not prove to be practical. Also, the radiation should not be variable across the standard extension of the trial and range of the base station (~2 km).
The CORDOVA-ET v.3 only includes one pyranometer per base station, installed at a practical height to allow maintenance and correct leveling. The single sensor would also allow for using a higher-grade instrument that would ensure standard and robust factory calibration into energy units, described in Berni et al. [
7].
In addition, the solar radiation from the commercial weather stations was affected by the fact that the radiation sensor sees through a clear glass instead of using a cosine diffuser, as discussed in Jimenez-Berni et al. (2023) [
7]. An optical diffuser was installed, and weather station sensors were calibrated against a standard pyranometer. The calibration coefficients are stored in a CSV file that can be accessed by the data-processing scripts
https://github.com/OpenAgriTech/CORDOVA-ET-metadata (accessed on 16 October 2023).
3.5.6. Communications
The main problems faced were with the 4G modem/LoRaWAN gateway, due to expired credit in SIM cards or mobile carrier firewall issues, and communication issues in the server side due to power loss, firewall, and internet connectivity problems.
The new version of the data logger baseboard allows local data storage in the nodes for back-up and data retrieval, even in the case of no LoRaWAN connectivity. Also, the newer model of the gateway allows local storage of the LoRa packages for offline data processing.
Programming problems and configuration of gateway and modem was reduced by using a single device, the 4G modem, which integrates the gateway and modem; this means fewer parts prone to errors or the wrong configuration, and more space inside the baseboard enclosure. This simplifies installation and configuration, as there is only one device. Also, this reduces power consumption and the space inside the base station enclosure, providing extra space for batteries.
3.5.7. Other Issues
Several challenges have been encountered due to the idiosyncrasies of each team and the institutions operating in the different countries in which the CORDOVA-ET station was deployed. Among the difficulties, it is worth mentioning the limitations for the assembly and/or updating of the devices in some locations, despite providing all the necessary information, offering technical support, and sending the required elements properly packaged. This omission appears to have been caused by the insufficient commitment of some recipients, possibly influenced by a lack of alignment with the goals of both parties. Consequently, it resulted in the slowing down of the progress and development of the CORDOVA-ET device deployment.
3.5.8. Upgrades Discussion
The primary function of ET networks is to produce ET information for various users over the long-term. A recurring concern in projects developed through external funding is the uncertainty in the continuity once the funding ends. Additionally, ET networks still have a major R&D component, which is not normally addressed in most public institutions devoted to agricultural water management, such as the ministries of agriculture and of water and irrigation. It would seem that academic institutions should be the preferred recipients of the prototype network described here, but the long-term funding concerns may be even higher in that case. This risk poses a serious threat to the sustainability and continuity of an ET network. As the end of the funding approaches, there is a need to establish appropriate strategies to ensure the preservation and long-term utilization of the network. This entails not only the consolidation of acquired knowledge and best practices, but also the transfer of responsibilities and the pursuit of sustainable financing mechanisms.
A clear example took place in Egypt during the national WEPS-NENA workshop in September 2022, where the upgraded device was exhibited. This event saw the participation of renowned institutions in the country [
14]. Additionally, in Tunisia, pilot projects have been initiated to measure the ET
a with the CORDOVA-ET system in two important tree crops, namely olive and date palm.
4. Conclusions
Regarding the CORDOVA-ET equipment, adequate weather protection of its sensors and electronics is a critical issue under the harsh environmental conditions of the countries where the system was deployed. Many upgrades were made to ensure the robust and long-term operation of the system with minimum data gaps.
The goals of the CORDOVA-ET were to initiate technical personnel in the measurement of ET based on an inexpensive, user-friendly instrument that can deliver acceptable estimates of the ETo and ETa. Furthermore, the aim of the CORDOVA-ET system is to provide a cost-effective system (less than EUR 4000) that can be adopted beyond the scientific community and provide open-access and real-time information about the ETo and actual crop water status to facilitate irrigation scheduling and improve the water productivity of the adopting users.
Most ET networks are focused on providing only the reference ET (ETo), but this network offered two features that are advantageous and may be valuable in agronomy. On one hand, it provides the actual ET when the system is placed over a crop different than grass, in addition to the ETo. On the other hand, each station captures the spatial variability of the ETa, as four nodes are provided to assess some of the components of the ETa in four different locations, which might be several km apart.
The insufficient time devoted to network operations by part of the personnel responsible for the stations resulted in inadequate attention to some sensors. To address this issue, a sequentially executed script, that consists of a set of instructions and commands in the data download process to correct this problem, was implemented. This solution has proven to be effective in correcting the deficiencies caused by the lack of attention, ensuring the quality and reliability of the data collected currently.
For supporting the network over the long-term, it is essential to establish strategic alliances with key stakeholders, such as water authorities, academic institutions, research and farmers organizations, or other interested partners, in order to promote effective continuity and safeguard the project’s outcomes beyond the initial external-funding stage. Additionally, detailed documentation of processes, methodologies, and results, along with training and capacity-building at the local level, can significantly contribute to the preservation and successful transfer of the achieved advancements, ensuring a lasting legacy and the potential for a continuous impact within the project’s sphere of operation.
Despite the numerous challenges encountered, the overall response to the development of the ET network has been extremely positive. These results highlight the potential and impact that technology can have on agriculture, particularly in the measurement and optimization of water usage in specific crops. The commitment and collaboration of local institutions and experts are crucial elements in ensuring the ongoing success of these type of projects and their potential expansion to other regions in the future.


 ,
, 


