Article

Near-Infrared Spectroscopy and Chemometrics Methods to Predict the Chemical Composition of Cratylia argentea

by
Lucas Freires Abreu
1,2,*,
Ângela Maria Quintão Lana
1,
Leonardo Campos Climaco
3,
Walter José Rodrigues Matrangolo
4,
Elizabeth Pereira Barbosa
5,
Karina Toledo da Silva
5,
Jason E. Rowntree
2,
Edilane Aparecida da Silva
6 and
Maria Lucia Ferreira Simeone
4,*
1
Departamento de Zootecnia, Escola de Veterinária, Universidade Federal de Minas Gerais, Belo Horizonte 31270-901, MG, Brazil
2
Department of Animal Science, College of Agriculture and Natural Resources, Michigan State University, East Lansing, MI 48824, USA
3
Empresa de Assistência Técnica e Extensão Rural—EMATER, Felicio dos Santos 39180-000, MG, Brazil
4
Empresa Brasileira de Pesquisa Agropecuária—Embrapa Milho e Sorgo, Sete Lagoas 35701-970, MG, Brazil
5
Empresa de Pesquisa Agropecuária de Minas Gerais—EPAMIG Centro Oeste, Prudente de Morais 35715-000, MG, Brazil
6
Empresa de Pesquisa Agropecuária de Minas Gerais—EPAMIG Oeste, Uberaba 38060-040, MG, Brazil
*
Authors to whom correspondence should be addressed.
Agronomy 2023, 13(10), 2525; https://doi.org/10.3390/agronomy13102525
Submission received: 5 September 2023 / Revised: 22 September 2023 / Accepted: 27 September 2023 / Published: 29 September 2023

Abstract

:
Cratylia argentea is a leguminous shrub that has the potential for use as livestock feed in tropical areas. However, time-consuming and labor-intensive methods of chemical analysis limit the understanding of its nutritive value. Near-infrared spectroscopy (NIRS) is a low-cost technology widely used in forage crops to expedite chemical composition assessment. The objective of this study was to develop prediction models to assess the crude protein (CP), neutral detergent fiber (NDF), acid detergent fiber (ADF), and dry matter (DM) of Cratylia based on NIRS and partial least squares analysis. A total of 155 samples were harvested at different maturity levels and used for model development, of which 107 were used for calibration and 48 for external validation. The cross-validation presented a root mean square error of prediction of 0.77, 2.56, 3.43, and 0.42; a ratio of performance to deviation of 4.8, 4.0, 3.8, and 3.4; and an R2 of 0.92, 0.92, 0.87, and 0.84 for CP, NDF, ADF, and DM, respectively. Based on the obtained results, we concluded that NIRS accurately predicted the chemical parameters of Cratylia. Therefore, NIRS can serve as a useful tool for livestock producers and researchers to estimate Cratylia’s nutritive value.

1. Introduction

Cratylia argentea (Cratylia) is a leguminous shrub species, native to the South American Savanna [1], but also observed in the Amazon and Caatinga biomes [2]. Some important characteristics of this leguminous shrub are its ability to thrive in acidic soils characterized by high aluminum saturation and low fertility [3], as well as its great palatability for ruminants [4]. Cratylia stands out as a forage source with great potential for tropical areas with extended dry seasons [5]. Cratylia also has vigorous root development and a symbiotic capacity for biological nitrogen fixation (BNF). This enables the maintenance of green leaves over water-deficient periods [6] and could be an alternative to expensive protein concentrates for livestock [7].
Studies have found advantageous animal performance [8,9] and optimal nutritive value [10,11] with Cratylia. Braga et al. [11] evaluated the ruminal degradability of Cratylia argentea, Flemingia macrophylla, and Stylosanthes guianensis harvested at 55 and 75 days and fed to growing sheep. The results showed a greater performance for sheep fed with C. argentea and F. macrophylla, which were recommended as protein banks and supplements for ruminants. The same study showed the bromatological composition of Cratylia samples harvested at 55 days, which had DM (dry matter), CP (crude protein), neutral detergent fiber (NDF), and acid detergent fiber (ADF) contents of 19.32%, 27.6%, 63.3%, and 55.6%, respectively. Andersson et al. [10] assessed the bromatological composition parameters such as CP, ADF, and NDF of 38 Cratylia accessions harvested at 8 weeks of regrowth and reported mean CP of 20.6% and 22%, NDF of 44.5% and 46.2%, and ADF of 26.6% and 30.6% for the rainy and dry seasons, respectively.
Reference methods for chemical analysis of forages are essential for the development of adjusted livestock diets and the inclusion of necessary feed supplements. Wet chemistry methods are typically used to analyze the chemical composition of biomass [12]. However, this method is time-consuming, labor-intensive, expensive, and requires many reagents [13]. In addition, the wet chemical method produces considerable chemical waste, decreasing the analysis’s environmental sustainability [14].
Near-infrared spectroscopy (NIRS) is a technology that has successfully been used to predict the quality parameters of different forage crops [15,16,17]. This method is considered fast, low-cost, and minimizes labor requirements [18] once accurate prediction models have been developed. With adjusted algorithms for the chemical parameters of Cratylia, the quality variation due to plant architecture, climate, and season could be monitored within a shorter timeframe [19]. Given that, a greater frequency of sample analysis, according to changes in plants’ chemical composition, could result in adjusted livestock diets within a shorter timeframe [20].
To employ the NIRS for laboratory analysis, the development of multivariate calibration models is required. Thus, standardized laboratory procedures such as destructive harvest, drying, grinding, and bench analysis are still needed [18].
Unfortunately, NIRS prediction models have not been developed for Cratylia argentea and are very limited for other leguminous shrubs. To date, there has been no report of using NIRS to predict the chemical composition of dried C. argentea samples.
The objective of this research is to assess the potential for utilizing near-infrared spectroscopy (NIRS) combined with chemometric techniques to forecast the levels of DM, CP, ADF, and NDF in C. argentea. The intended result of this research was a system designed to expedite the acquisition of Cratylia argenta’s chemical composition and the adjustment of ruminants’ diets.

2. Materials and Methods

2.1. Site Description

The study was conducted at the Brazilian Agricultural Research Corporation—Embrapa Maize and Sorghum (Sete Lagoas, Minas Gerais, Brazil; 19°28′ S; 44°15′ W, at 732 m altitude), where Cratylia was planted and the NIR equipment was located. Cratylia was cultivated in a region with a Cwa climate type according to the Köppen classification system, i.e., savanna climate, with dry winters (May to September) and humid, rainy summers (October to April) [21]. The average annual temperature is 22.9 °C, with 24.4 °C in the wet season and 22 °C for the dry season, and an average annual precipitation of 1340 mm [22].
A soil sample was collected on 28 March 2013. Soils corresponded to the Latossolos (Oxisols) category [23], with a pH of 5.5, H + Al (7.11 dm3), OM (3.44 dag kg−1), NO3-N (18 mg kg−1), P (2.18 mg kg−1), CEC (10.23 dm3), Ca (2.73), Mg (0.28), and K (39.26 mg kg−1).

2.2. Cratylia Cultivation

On 11 December 2009, Cratylia seedlings were transplanted from a greenhouse to a 450 m2 experimental site at Embrapa Maize and Sorghum. The seedlings were 55 days old and planted in burrows spaced by 0,5 m in dual rows of 1.0, 2.0, 3.0, 4.0, and 5.0 m, which was equivalent to 20,000, 10,000, 6667, 5000, and 4000 plants ha−1, respectively. Several studies were conducted in the area since its establishment, and no fertilization was made in the area during this time.
The area was managed with a recurrent harvest. At the beginning of the current research, on 20 July 2021, Cratylia plots and inter-rows were mowed to establish uniform regrowth and weed control, respectively. The destructive harvest for the determination of agronomic parameters left a 50 cm stubble height, and the collected material was composed of leaves and stems that were smaller than 5 mm, which was considered the edible feed fraction [24]. Each harvest happened at 21, 42, 63, 84, 105, and 126 days of regrowth on 2 February, 10 July, 7 August of 2021, and 9 January and 14 April of 2022, respectively. Although all plants were on vegetative stage, the goal with different harvest dates was to create different maturity levels and increase the robustness of the model. The samples were harvested with a gardening scissor (Kotto, Santa Clara, CA, USA).

2.3. Research Material and Preparation

The samples were placed in paper bags and underwent a 72-h drying process at a temperature of 55 °C. Afterward, the specimens were ground using a Wiley mill (Thomas Scientific, Swedesboro, NJ, USA) until they could pass through a 1 mm sieve in preparation for wet chemical laboratory analysis of DM, CP, NDF, and ADF. The wet chemical analysis for DM was determined based on [25] methodology. Crude protein was determined based on the Kjeldahl method [26], and ADF and NDF were determined based on the method of Van Soest et al. [26]. For NIRS spectra collection, 15 g of milled Cratylia were placed on Petri dishes of borosilicate to obtain the spectrum of each sample in triplicate. The sample spectra were obtained with the NIRFlex 500 (Buchi Labortechnik, Flawil, Switzerland) in the region of 1000–2500 nm (4000 to 10,000 cm−1) at a resolution of 32 scans per spectra [27]. To ensure accuracy, the obtained spectra were corrected against a background spectrum.

2.4. Model Development

A total of 155 samples were used, of which 107 were employed to construct the calibration model with the spectral data. For the external validation model, 48 samples of Cratylia were used to predict the chemical properties (DM, CP, ADF, and NDF). Therefore, the Kennard–Stone algorithm guarantees that the calibration set contains the most representative samples [28]. The model’s performance was assessed on the external validation dataset.
The spectral data underwent preprocessing using two methods, namely the standard normal variate (SNV) and the Savitzky–Golay first derivative technique. These preprocessing steps were applied to remove variations such as baseline shifts and light scattering from the data, thus enhancing the quality of the spectral information. The final preprocessed spectral data were mean-centered before partial least squares (PLS) analysis. All models were internally and externally validated. The internal validation was based on full cross-validation (CV) using the random method.
The average spectrum of three measurements (Figure 1) was used as the final spectrum of each sample to assess the potential of prediction by NIRS. The PLS algorithm yielded the optimal models, characterized by a limited number of latent variables, low RMSEcv, high R2cal values, and superior predictive capabilities. A few outliers were identified through an analysis of leverage and studentized residuals, and these outliers were subsequently removed.
In this study, variable importance in projection (VIP)-based variable selection methods were employed, and custom routines were developed for this purpose using MATLAB v. 23.2 (The MathWorks, Natick, MA, USA).

2.5. Model Evaluation and Statistical Analysis

To assess the reliability of the PLS models, a cross-validation procedure was employed. This involved utilizing the leave-one-out method, where a single sample is removed, and the model is rebuilt without the sample. The assessment of the optimal calibration model between chemical reference values and NIRS data was conducted by considering the highest coefficient of determination (R2c) and the smallest root mean square error of calibration (RMSEc). The RMSEc was computed by considering the sample size, the reference analysis results, and the estimated outcomes obtained from the NIRS model. Furthermore, for external validation, the model was evaluated based on the values of R2p and RMSEp, with the goal of achieving the best possible model performance. The performance and accuracy of the models were evaluated by calculating the residual prediction deviation (RPD), as defined by Williams and Norris [29]. The RPD is computed as the ratio of the standard deviation of reference values to the RMSEc.
The calibration and validation datasets were randomly formed to quantify its R2 and RMSE as metric evaluations. To obtain real predictability, this performance evaluation was repeated five times for each dataset.
A comparison between the means of the observed and NIRS-predicted datasets was performed using a Student’s t-test at a 5% level of significance. The confidence interval was calculated as the mean ± standard error of the mean. Average of five determinations. The analysis was carried out using RBio software v.17 [30]. For CP, NDF, ADF, and DM, models were produced that predicted concentrations on a DM basis.

3. Results and Discussion

3.1. General

The wide variation within the evaluated chemical properties (CP, NDF, ADF, and DM) was used to develop NIRS calibration and prediction models based on NIRS and chemometric analysis. The calibration and validation results of NIRS for the chemical parameters of Cratylia are shown in Table 1 and Figure 2.

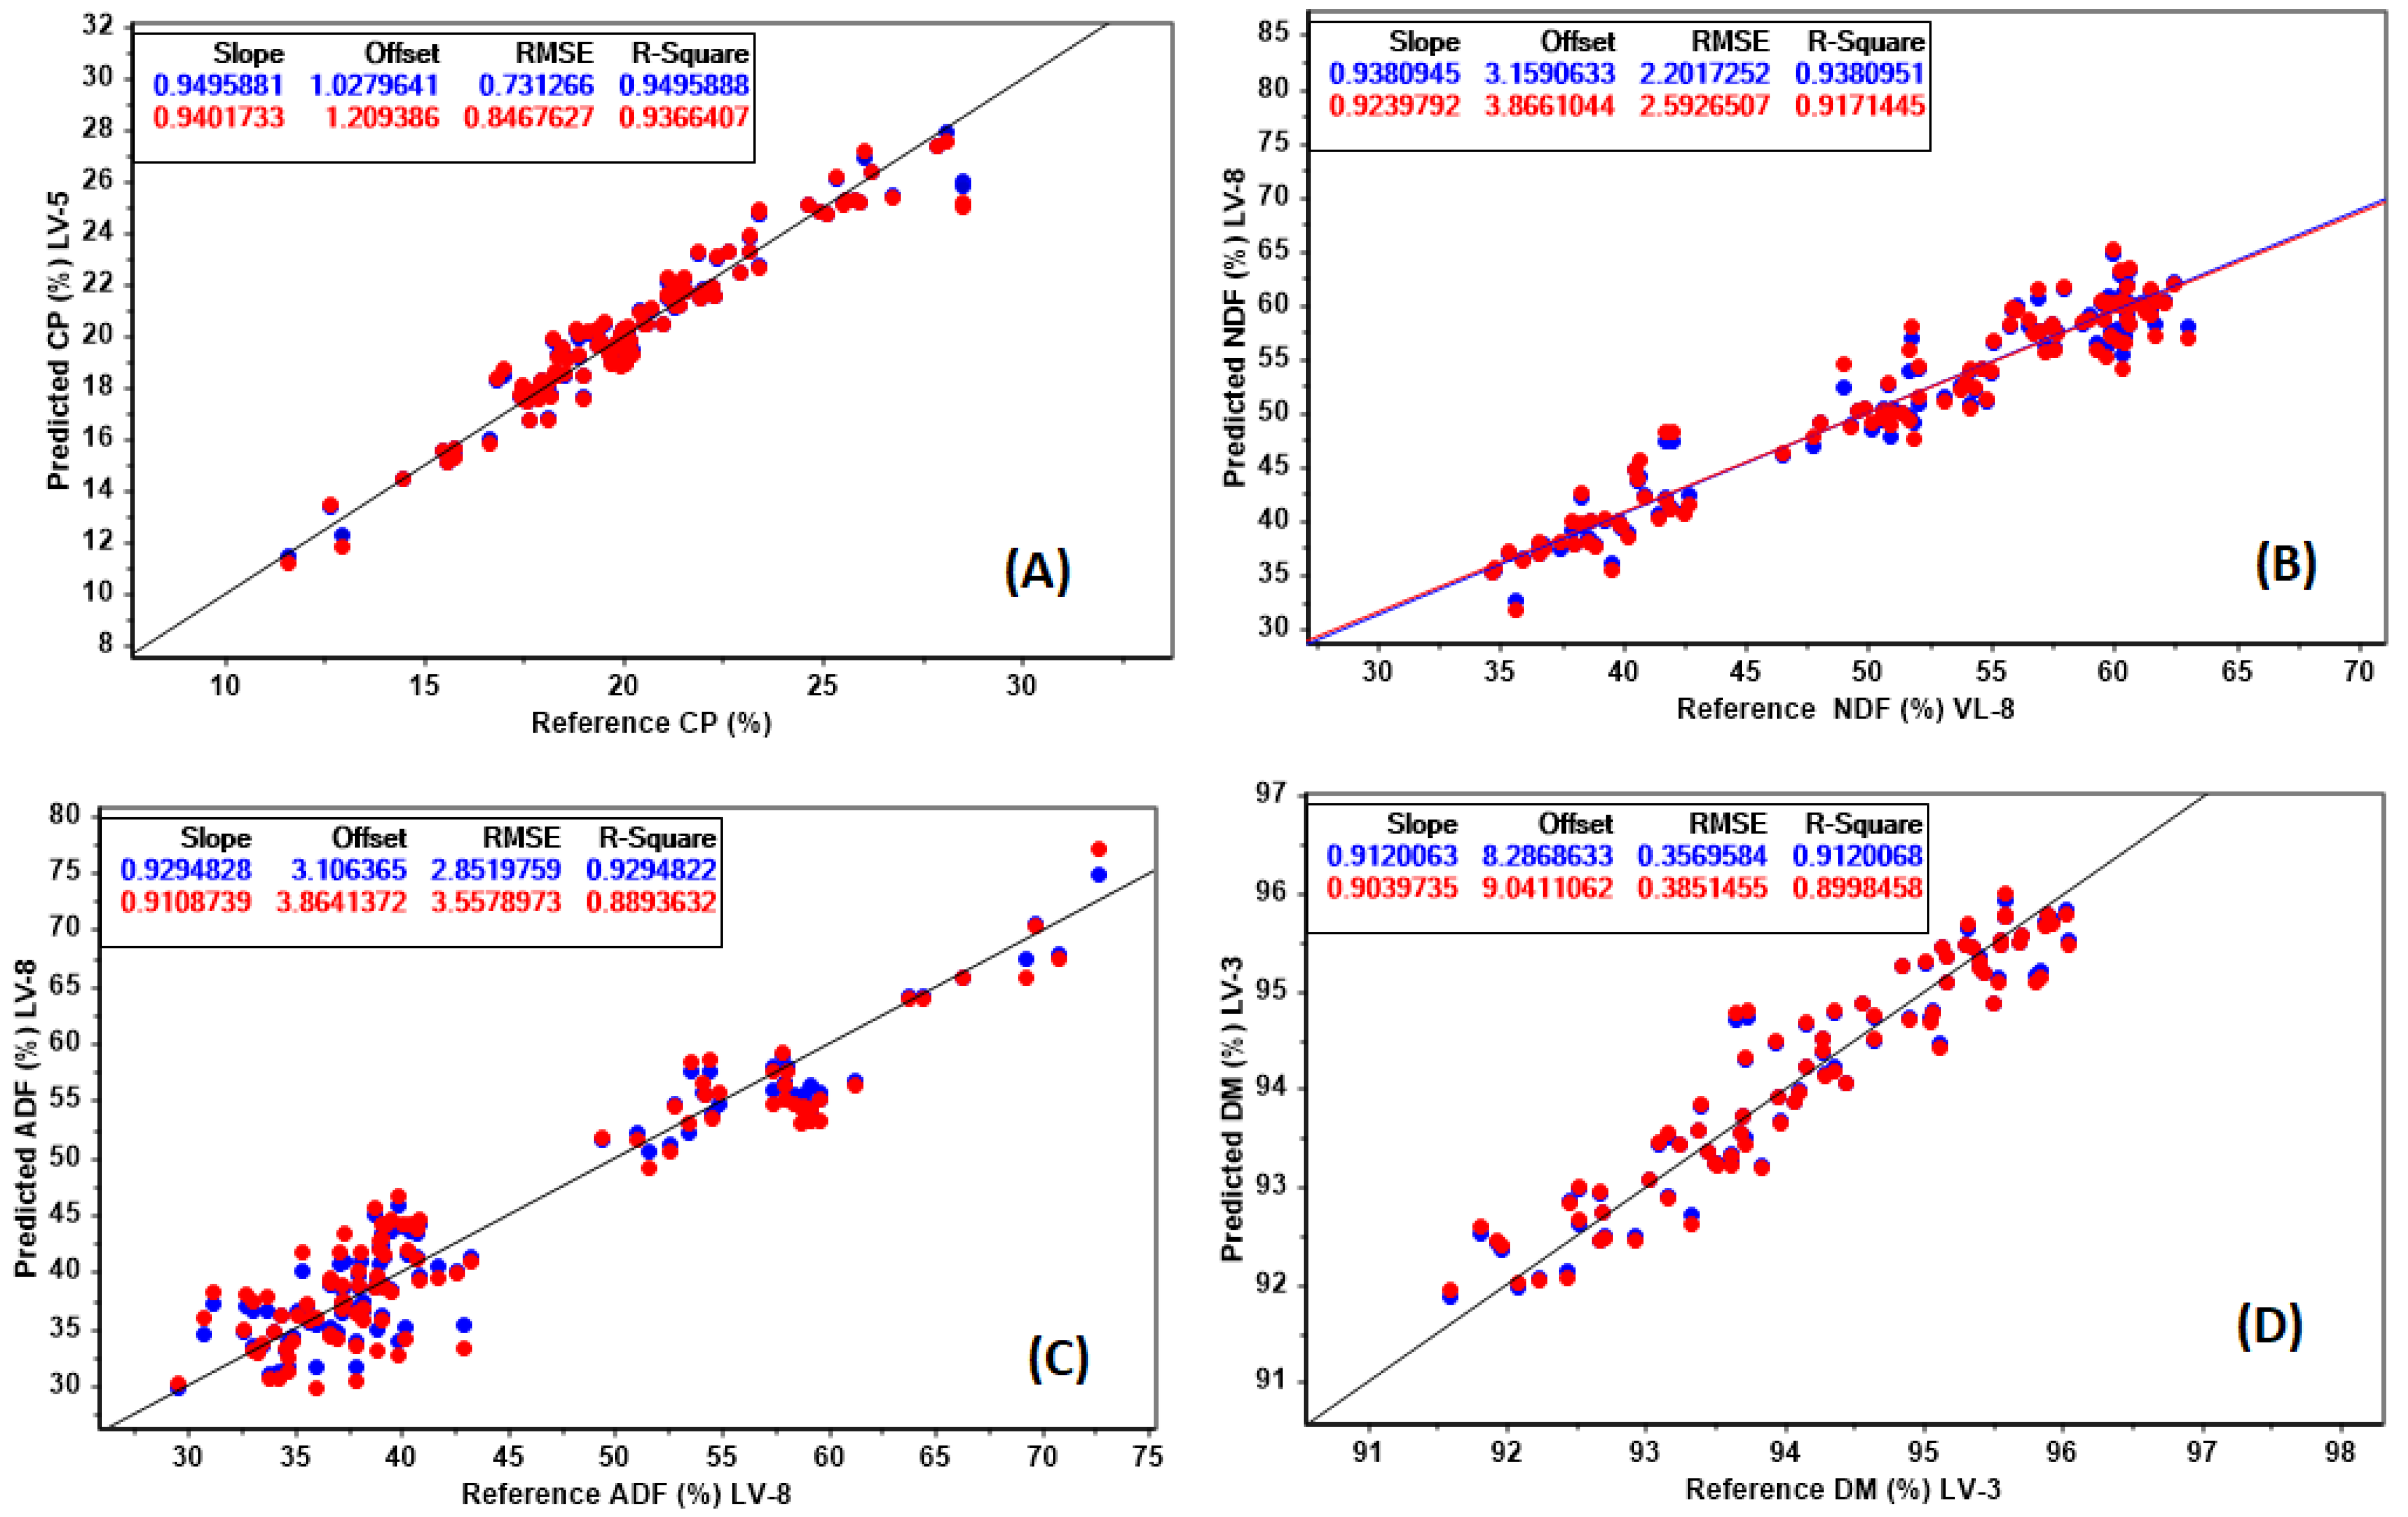
3.2. Calibration and Validation: R2, RMSEc and RMSEp

The RMSEc values were 0.73, 2.2, 2.85, and 0.35, while the RMSEp was 0.84, 2.59, 3.55, and 0.38 for the CP, NDF, ADF, and DM models, respectively (Figure 2). The results from the coefficient of determination (R2) for calibration (R2cal) and validation (R2val) also contributed to demonstrating the predictive ability of the evaluated models to estimate the chemical parameters. The R2 results for calibration were 0.94, 0.93, 0.92, and 0.91, whereas the results for validation were 0.93, 0.91, 0.88, and 0.89 for CP, NDF, ADF, and DM, respectively (Table 2). Williams et al. [31] determined that R2 results between 0.66 and 0.81 are considered approximate, 0.82 and 0.90, good, and above 0.91, excellent. Based on the calibration results of this research, CP, NDF, ADF, and DM fall in the excellent category. Nevertheless, the validation results were considered excellent for CP and NDF and good for ADF and DM. Even though the R2val was lower on ADF and DM, the results were still positive. Overall, the variables resulted in a low relative RMSEp, which was less than 10% of the mean observed values, and there were no significant differences between the mean values that were observed and those that were predicted (Table 3).
Results for the optimized VIP score−PLS models built with preprocessed spectra (SNV + first derivative Savitzky−Golay) are shown in Table 2. The VIP score is one of the most frequently used methods in chemometrics for variable selection. The number of variables utilized in constructing the models was significantly reduced, going from 1501 (representing the full spectra) down to a range of 50 to 130, which varied depending on each specific parameter. All VIP models were improved compared to full-spectra models, presenting lower LV and RMSEp. The potential to eliminate signals that lack information or are redundant can result in models that exhibit enhanced accuracy, resilience, and chemical interpretability, aligning with the principle of parsimony. This can be observed by comparing Table 1 and Table 2.
The regression vectors of PLS models were analyzed to determine the functional groups responsible for the relationships between each property and sample spectra. The process of calculating spectral frequencies based on optimal wavelengths aims to pinpoint and identify the crucial molecular bond regions within the spectrum. Thus contributing to establishing strong relationships between spectral data and the chemical composition of Cratylia. Although the allocation of molecular features to NIR spectra may cause some band overlapping, it was possible to identify the wavenumbers with the most positive coefficients and contribution to each model, as shown in Figure 3.
In the CP model (Figure 3A), the important spectral bands were identified at 7056, 6623 cm−1 (corresponding to the first overtone of N–H stretching), and 1734 cm−1 (representing the first overtone of C–H stretching), representing protein content.
The NDF, ADF, and DM consist of three main structural units: cellulose, hemicellulose, and lignin. Cellulose is a crystalline polymer of glucose [32], hemicellulose is an amorphous polymer of xylose and arabinose [33], and lignin is a complex polymer of aromatic alcohols [34]. Vibration bands associated with these chemical biomass components can be observed in Figure 3B–D. The spectral regions between 7200 and 6600, 6000 and 5500, 5400 and 4600, and 4600 and 4000 cm−1 can be attributed to O–H stretch first overtone, C–H stretch first overtone, O–H combination bands, and C–H combination band regions, respectively.
For NDF (Figure 3B), prominent peaks were observed at approximately 7000 cm−1 (related to the first overtone of O–H stretching), 5884 cm−1 (first overtone of C–H stretching), 4924 cm−1 (a combination of C–H stretching and CH2 deformation), and 4060 cm−1. Concerning ADF (Figure 3C), the most critical spectral variables included a wide band spanning from 7152 to 4240 cm−1 (associated with the first overtone of O–H stretching) and peaks at around 5940 cm−1 (first overtone of aromatic C–H stretching), 5292 cm−1 (a combination band of O–H stretching and O–H deformation), 4415 cm−1 (a combination of O–H and C–O stretching), 4290 cm−1 (a combination of C–H stretching and CH2 deformation), and 4230 cm−1 (a combination of C–H deformation and C–H stretching). In the DM model (Figure 3D), the most important bands were observed at 4436 cm−1 (a combination of O–H and C–O stretching), 4290 cm−1 (a combination of C–H stretching and CH2 deformation), 4230 cm−1 (a combination of C–H deformation and C–H stretching), and peaks at about 5940 cm−1 (first overtone of aromatic C–H stretching).
The coefficients for NDF, ADF, and DM models showed an obvious positive contribution at the peak of 4405 cm−1, which indicated that the distinct spectral region is possibly related to a C–H + O–H combination band attributed to cellulose and sugar.

3.3. Ratio of Performance to Deviation

The RPD results were higher than 3.0 for all the chemical properties evaluated (Table 3). This ratifies the accuracy and good predictive ability these models showed in external validation. Based on the literature, RPD equations greater than 2.4 are desirable, and equations lower than 1.5 are unusable [29]. The RPD measures the relationship strength between a constituent value and the error of the results predicted by NIRS [35]. Thus, the greater the RPD, the lower the predictive error [36]. The RPD results obtained were 4.8, 4.0, 3.5, and 3.4 for CP, NDF, ADF, and DM models, respectively. Thus, the results were considered excellent [31] for all developed models.
Mazabel et al. [37] built a chemometric model from Brachiaria humidicola and reported an RPD of 2.56 for CP in Colombia. The result was lower than other evaluated parameters, such as ADF (4.4), NDF (3.62), and IVDMD (3.63). However, the result was considered desirable based on the Williams and Norris [29] scale. The authors associated the lower prediction with a smaller sample size (n = 20) used for external validation. Nevertheless, the overall results were positive.

3.4. External Cross-Validation

The external validation for CP showed an R2 of 0.92 (and an RMSEp of 0.81 for Figure 4A). It is important to reemphasize that CP showed the highest RPD (Table 3), R2 (cal and val), and second-lowest RMSEc and RMSEp (Table 1 and Table 2, Figure 2A) among the four evaluated chemical properties. A similar characteristic was observed by Norman et al. [38] when evaluating 102 forage species in Australia. The authors associated better results for CP with the fact that there were different plant biotypes within the tested model. This was similar to the current research since the Cratylia plant materials used did not go through any breeding process and, therefore, had high genetic variability, which was visually observed in the field. Andueza et al. [39] also showed an increased predictive capacity of CP when evaluating plant materials with greater diversity in France (n = 1034).
The NDF had an external validation R2 of 0.89 and an RMSEp of 2.83 (Figure 4B). Norman et al. [38] found similar R2 (0.94) and RPD (3.9) when evaluating annual legumes. The same research observed an R2 (0.96) and RPD (5.8) for ADF. Although the R2 results for ADF and RMSEp (Figure 4C) in our research were a little lower for external validation, the current results fall in the category of good and excellent [31] for NDF and ADF, respectively. Serrano et al. [40] found external validation results with R2 (0.91) and RPD (3.48) for NDF, and R2 (0.93) and RPD (4.01) for CP when evaluating several pasture mixes (legumes and grasses) in Portugal. Both research works mentioned above align with the current results, supporting our findings.
Regarding the external validation in DM, the R2 result was 0.84 and the RMSEp was 0.42 (Figure 4D), considered in the good category of William’s scale [31]. The increased dispersion might be related to the lower number of samples used (n = 35) compared to the other chemical parameters (n = 45~47). Therefore, a lower plant variability was covered. Andrade Ribeiro et al. [41] evaluated the ability of NIRS to predict DM, CP, NDF, and ADF of Brachiaria brizantha cv. Piatã grass and found an R2val of 0.75, 0.94, 0.92, and 0.85 in Southern Brazil. Apart from the low R2 for DM, their RPD values were 2.01, 3.98, 3.49, and 2.56 for DM, CP, NDF, and ADF, respectively, which were also lower than our research. The authors associated the lower prediction capacity of the model with a lack of uniformity in the ground samples and the number of samples (n = 84). Oluk et al. [42] found an R2 of 0.76 when validating NIRS models to predict DM of Dalisgrass (Paspalum dilatatum) in Turkey. The RPD was somewhat lower (2.15) at validation and 2.66 at calibration. The authors found the same R2 (0.76) for DM when calibrating the model. Based on Williams et al. [31], these DM results would be considered approximate.
The selection of an optimum number of LV in the current research was achieved using the CV approach, which essentially solves two main purposes in PLS analysis. The first is the simplified assessment of the optimal PLS complexity, and the second is the measure for evaluating the PLS model performance when applied to a validation dataset [43]. In the cross-validation procedure, a portion of the samples (referred to as the test set) is taken out of the calibration set, and the PLS model is built using the remaining samples, which form the model building set [43]. Following its development, the model is utilized to predict the concentrations of the specific analytes of interest in the samples within the dataset.
Several factors, such as laboratory error, plant stage, maturity, and edaphoclimatic conditions, play an important role in developing NIRS models. The low error involved in the chemistry analysis and plant variability (genetic and of different growth stages) of the harvested material might have been the main factors leading to the success of the current models.

4. Conclusions

The obtained calibration models for CP, NDF, ADF, and DM showed validation errors like those obtained for the wet chemistry method, indicating the suitability of NIRS and the reliability of our developed models to predict the chemical properties of Cratylia argentea.
Once the model is fully composed and implemented into a laboratory routine, the time required to perform an analysis and obtain all results (CP, NDF, ADF, and DM) is less than 1 min. Therefore, adding more samples should improve the robustness of the model.
These results could assist livestock producers to expedite and cheapen the process of estimating the nutritive value of Cratylia argentea for cattle diet adjustment, as well as for researchers and breeding programs to assess the chemical parameters of Cratylia argentea in a timely manner.
Future research may evaluate the performance of current equations in different Cratylia cultivars to validate and establish new prediction models.

Author Contributions

Writing—original draft, L.F.A.; Visualization, L.F.A., E.P.B. and L.C.C.; Project administration, L.F.A.; Investigation, L.F.A., L.C.C., E.P.B. and W.J.R.M.; Supervision, Â.M.Q.L., W.J.R.M., E.P.B., K.T.d.S. and E.A.d.S.; Conceptualization, Â.M.Q.L. and L.C.C.; Resources, Â.M.Q.L., W.J.R.M. and K.T.d.S.; Writing—review and editing, Â.M.Q.L., W.J.R.M., M.L.F.S. and J.E.R.; Data Curation, L.C.C. and W.J.R.M.; Methodology, M.L.F.S.; Formal analysis, M.L.F.S.; Software, M.L.F.S. Funding acquisition, Â.M.Q.L. and J.E.R. All authors have read and agreed to the published version of the manuscript.

Funding

This work was supported by the Coordination for the Improvement of Higher Education Personnel of Education (CAPES, Brazil n°, 88887.667823/2022-00) and the Foundation for Food and Agriculture Research (FFAR, United States n°, DSnew-0000000028). The funding sources did not play any role in the design of the study, the collection and analysis of data, the decision to publish, or the preparation of the manuscript. The authors would also like to acknowledge the funding agencies, the National Council for Scientific and Technological Development (CNPq) and the Minas Gerais State Agency for Research and Development (FAPEMIG).

Data Availability Statement

Not applicable.

Conflicts of Interest

The authors declare no conflict of interest.

References

  1. Queiroz, L.P. O Gênero Cratylia Martius ex Bentham (Leguminosae Papilionoideae, Phaseoleae): Revisão Taxonômica e Aspectos Biológicos. Master’s Thesis, Universidade Estadual de Campinas, Campinas, Brazil, 1991; 129p. [Google Scholar]
  2. Queiroz, L.P.; Coradin, L. Biogeografía de Cratylia en áreas prioritarias para Coleta. In Memorias del Taller Potencial del Género Cratylia Como Leguminosa Forrajera; Pizarro, E.A., Coradin, L., Eds.; EMBRAPA/Cenargen/CPAC/CIAT: Brasilia, Brasil, 1996; pp. 1–28. [Google Scholar]
  3. Argel, P.; Gonzalez, J.; Lobo, M. Cratylia argentea: A Shrub Legume for Livestock Production in the Tropics. In Feeding Systems with Legumes to Intensify Dairy Farms; Holmann, F., Lascano, C., Eds.; Centro Internacional de Agricultura Tropical; Tropileche Consortium; International Livestock Research Institute: Cali, Colombia, 2004; pp. 150–154. [Google Scholar]
  4. Hohnwald, S.; Trautwein, J.; Camarão, A.P.; Wollny, C.B. Relative palatability and growth performance of capoeira species as supplementary forages in the NE-amazon. Agric. Ecosyst. Environ. 2016, 218, 107–115. [Google Scholar] [CrossRef]
  5. Raaflaub, M.; Lascano, C.E. The effect of wilting and drying on intake rate and acceptability by sheep of the shrub legume Cratylia argentea. Trop. Grassl. 1995, 29, 97–101. [Google Scholar]
  6. Matrangolo, W.J.R.; Brasileiro, B.P.; Silva, C.J.; Netto, D.A.M.; Mattar, E.P.L.; Frade, E.F.; Silva, I.H.F.; Silva, I.S.; Crivelaro, J.C.B.; Ribeiro, J.P.O.; et al. Aspectos de Cratylia argentea na região central de Minas Gerais e potencialidades em sistemas agrobiodiversos. In Cadernos de Agroecologia; Comunidaco Tecnico 233; Embrapa Milho e Sorgo: Sete Lagoas, MG, Brazil, 2018; p. 41. [Google Scholar]
  7. Gonzalez, J.; Di Palma, M.V.L.; Acuña, V.R.; Argel, P.J.; Hidalgo, C.A.; Romero, F.; Utilization of the shrub Cratylia argentea, cv. Veraniega as protein supplement for milking cows during the dry season in Costa Rica. In International Symposium on Silvopastoral Systems: Second Congress on Agroforestry and Livestock Production in Latin America; Ibrahim, M., Ed.; CATIE/IICA: Turrialba, Costa Rica, 2001; p. 478. [Google Scholar]
  8. Silva, M.E.; Araújo, J.V.; Silveira, W.F.; Carvalho, L.M.; Ribeiro, R.R. Effectiveness of cratylia argentea as an animal feed supplement in the control of gastrointestinal nematodes in sheep. Semin. CiÊNcias AgrÁRias 2018, 39, 657. [Google Scholar] [CrossRef]
  9. Valles-de la Mora, B.; Castillo-Gallegos, E.; Alonso-Díaz, M.; Ocaña-Zavaleta, E.; Jarillo-Rodríguez, J. Live-weight gains of Holstein × zebu heifers grazing a Cratylia argentea/Toledo-grass (Brachiaria brizantha) association in the mexican humid tropics. Agrofor. Syst. 2016, 91, 1057–1068. [Google Scholar] [CrossRef]
  10. Andersson, M.S.; Peters, M.; Schultze-Kraft, R.; Franco, L.H.; Lascano, C.E. Phenological, agronomic and forage quality diversity among germplasm accessions of the tropical legume shrub cratylia argentea. J. Agric. Sci. 2006, 144, 237–248. [Google Scholar] [CrossRef]
  11. Braga, E.; Braga Filho, E.; Silva, J.A.; Faturi, C.; Domingues, F.N.; Lourenço Júnior, J.D. Ruminal degradability of tropical leguminous plants from Eastern Amazonia. Semin. Ciências Agrárias 2018, 39, 845. [Google Scholar] [CrossRef]
  12. Jeong, S.-Y.; Lee, E.-J.; Ban, S.-E.; Lee, J.-W. Near infrared spectroscopy model for analyzing chemical composition of biomass subjected to Fenton oxidation and hydrothermal treatment. Renew. Energy 2021, 172, 1341–1350. [Google Scholar] [CrossRef]
  13. Guimarães, C.C.; Assis, C.; Simeone, M.L.; Sena, M.M. Use of near-infrared spectroscopy, partial least-squares, and ordered predictors selection to predict four quality parameters of sweet sorghum juice used to produce bioethanol. Energy Fuels 2016, 30, 4137–4144. [Google Scholar] [CrossRef]
  14. Moros, J.; Garrigues, S.; Guardia, M. de Vibrational Spectroscopy provides a green tool for multi-component analysis. Trends Anal. Chem. 2010, 29, 578–591. [Google Scholar] [CrossRef]
  15. Norris, K.H.; Barnes, R.F.; Moore, J.E.; Shenk, J.S. Predicting forage quality by infrared replectance spectroscopy. J. Anim. Sci. 1976, 43, 889–897. [Google Scholar] [CrossRef]
  16. Deinum, B.; Struik, P.C. Genetic variation in digestibility of forage maize (Zea mays L.) and its estimation by near infrared reflectance spectroscopy (NIRS). an analysis. Euphytica 1989, 42, 89–98. [Google Scholar] [CrossRef]
  17. Harris, P.A.; Nelson, S.; Carslake, H.B.; Argo, C.M.G.; Wolf, R.; Fabri, F.B.; Brolsma, K.M.; van Oostrum, M.J.; Ellis, A.D. Comparison of NIRS and wet chemistry methods for the nutritional analysis of Haylages for horses. J. Equine Vet. Sci. 2018, 71, 13–20. [Google Scholar] [CrossRef]
  18. Tibola, C.S.; de Miranda, M.Z.; Guarienti, E.M. Avaliação de Parâmetros de Qualidade de Trigo por Espectroscopia no Infravermelho Próximo. In Espectroscopia No Infravermelho Próximo Para Avaliar Indicadores De Qualidade Tecnológica e Contaminantes Em Grãos; Tibola, C.S., de Medeiros, E.P., Simeone, M.L.F., Eds.; Embrapa: Brasília, Brazil, 2018; pp. 95–125. [Google Scholar]
  19. Dillon, P. Achieving high dry-matter intake from pasture with grazing dairy cows. In Fresh Herb. Dairy Cattle Key to a Sustain; Elgersma, A., Dijkstra, J., Tamminga, S., Eds.; Springer: Food Chain, NY, USA, 2006; pp. 1–26. [Google Scholar] [CrossRef]
  20. Wilkinson, J.M.; Allen, J.D.; Tunnicliffe, R.; Smith, M.; Garnsworthy, P.C. Variation in composition of pre-grazed pasture herbage in the United Kingdom, 2006–2012. Anim. Feed Sci. Technol. 2014, 196, 139–144. [Google Scholar] [CrossRef]
  21. de Sá Júnior, A.; de Carvalho, L.G.; da Silva, F.F.; de Carvalho Alves, M. Application of the Köppen Classification for climatic zoning in the state of Minas Gerais, Brazil. Theor. Appl. Climatol. 2011, 108, 1–7. [Google Scholar] [CrossRef]
  22. Campos, A.; Silva, B.; Freitas, D.; Fernandes, M. Qualidade Física do Latossolo Vermelho Distrófico Cultivado com Milho. Available online: https://ainfo.cnptia.embrapa.br/digital/bitstream/item/203319/1/Circ-253.pdf (accessed on 30 August 2023).
  23. Santos, H.G.; Jacomine, P.K.T.; Anjos, L.H.C.; Oliveira, V.A.; Lumbreras, J.F.; Coelho, M.R.; Almeida, J.A.; Araujo Filho, J.C.; Oliveira, J.B.; Cunha, T.J.F. Brazilian Soil Classification System; Embrapa: Brasília, Brazil, 2018. [Google Scholar]
  24. Navas Panadero, A.; Daza Cárdenas, J.I.; Montaña Barrera, V. Desempeño de Bancos Forrajeros de Cratylia argentea (Desv.) kuntze, em suelos degradados em el Departamento de Casanare. Rev. De Med. Vet. 2020, 1, 29–42. [Google Scholar] [CrossRef]
  25. Silva, D.J.; Queiroz, A.C. Análise de Alimentos: Métodos Químicos e Biológicos, 3rd ed.; Universidade Federal de Viçosa: Viçosa, Brazil, 2006. [Google Scholar]
  26. AOAC. Official Methods of Analysis, 16th ed.; Association of Official Analytical Chemists: Arlington, VA, USA, 1995. [Google Scholar]
  27. Neto, M.; Simeone, M.L.; Guimarães, C.; Andrade, H.M.; Queiroz, L.; Simão, E.d.P. Predição do Teor de Carbono Total em Solos de Áreas Experimentais de Integração Lavoura- Pecuária por Meio da Espectroscopia NIR. Available online: https://www.embrapa.br/busca-de-publicacoes/-/publicacao/953275/predicao-do-teor-de-carbono-total-em-solos-de-areas-experimentais-de-integracao-lavoura-pecuaria-por-meio-da-espectroscopia-nir (accessed on 10 August 2023).
  28. Kennard, R.W.; Stone, L.A. Computer Aided Design of Experiments. Technometrics 1969, 11, 137–148. [Google Scholar] [CrossRef]
  29. Williams, P.C. Implementation of Near-Infrared Technology. In Near-Infrared Technology in the Agricultural and Food Industries, 2nd ed.; Williams, P.C., Norris, K., Eds.; American Association of Cereal Chemists: St. Paul, MN, USA, 2001; pp. 145–169. [Google Scholar]
  30. Bhering, L.L. Rbio: A Tool for Biometric and Statistical Analysis Using the R Platform. Crop Breed. Appl. Biotechnol. 2017, 17, 187–190. [Google Scholar] [CrossRef]
  31. Williams, P.; Manley, M.; Antoniszyn, J. Near Infrared Technology: Getting the Best Out of Light; PDK Grain: Nanaimo, BC, Canada, 2003. [Google Scholar]
  32. Pena, C.A.; Soto, A.; King, A.W.; Rodríguez, H. Improved reactivity of cellulose via its crystallinity reduction by nondissolving pretreatment with an ionic liquid. ACS Sustain. Chem. Eng. 2019, 7, 9164–9171. [Google Scholar] [CrossRef]
  33. Pauly, M.; Gille, S.; Liu, L.; Mansoori, N.; de Souza, A.; Schultink, A.; Xiong, G. Hemicellulose biosynthesis. Planta 2013, 238, 627–642. [Google Scholar] [CrossRef]
  34. Balakshin, M.; Capanema, E.A.; Zhu, X.; Sulaeva, I.; Potthast, A.; Rosenau, T.; Rojas, O.J. Spruce milled wood lignin: Linear, branched or cross-linked? Green Chem. 2020, 22, 3985–4001. [Google Scholar] [CrossRef]
  35. Williams, P.C.; Sobering, D.C. Comparison of commercial near infrared transmittance and reflectance instruments for analysis of whole grains and seeds. J. Near Infrared Spectrosc. 1993, 1, 25–32. [Google Scholar] [CrossRef]
  36. Murphy, D.J.; O’Brien, B.; O’Donovan, M.; Condon, T.; Murphy, M.D. A near infrared spectroscopy calibration for the prediction of fresh grass quality on Irish pastures. Inf. Process. Agric. 2022, 9, 243–253. [Google Scholar] [CrossRef]
  37. Mazabel, J.; Worthington, M.; Castiblanco, V.; Peters, M.; Arango, J. Using near infrared reflectance spectroscopy for estimating nutritional quality of brachiaria humidicola in breeding selections. Agrosystems Geosci. Environ. 2020, 3, e20070. [Google Scholar] [CrossRef]
  38. Norman, H.C.; Hulm, E.; Humphries, A.W.; Hughes, S.J.; Vercoe, P.E. Broad near-infrared spectroscopy calibrations can predict the nutritional value of >100 forage species within the Australian feedbase. Anim. Prod. Sci. 2020, 60, 1111. [Google Scholar] [CrossRef]
  39. Andueza, D.; Picard, F.; Jestin, M.; Andrieu, J.; Baumont, R. NIRS prediction of the feed value of temperate forages: Efficacy of four calibration strategies. Animal 2011, 5, 1002–1013. [Google Scholar] [CrossRef] [PubMed]
  40. Serrano, J.; Shahidian, S.; Carapau, Â.; Rato, A.E. Near-infrared spectroscopy (NIRS) and optical sensors for estimating protein and fiber in dryland Mediterranean Pastures. AgriEngineering 2021, 3, 73–91. [Google Scholar] [CrossRef]
  41. Andrade Ribeiro, M.C.; Loures Guerra, G.; Cano Serafim, C.; Nóbrega de Carvalho, L.; Galbeiro, S.; Vendrame, P.R.; Monteiro do Carmo, J.P.; Rodrigues Franconere, E.R.; Ferracini, J.G.; do Prado, I.N.; et al. Prediction models of the nutritional quality of fresh and dry Brachiaria Brizantha cv. Piatã Grass by near infrared spectroscopy. J. Appl. Anim. Res. 2023, 51, 193–203. [Google Scholar] [CrossRef]
  42. Oluk, A.C.; Yucel, H.; Bilgin, F.D.; Serbester, U. Estimation of forage quality by near infrared reflectance spectroscopy in dallisgrass, paspalum dilatatum, Poir. J. Near Infrared Spectrosc. 2022, 30, 189–196. [Google Scholar] [CrossRef]
  43. Kumar, K. Partial Least Square (PLS) Analysis. Resonance 2021, 26, 429–442. [Google Scholar] [CrossRef]
Figure 1. The mean FT-NIR spectra of Cratylia materials. Raw reflectance (R) data were converted to absorbance units (1/R). Each color represents a spectrum of Cratylia argentea samples.
Agronomy 13 02525 g001
Figure 2. Scatter plots of near-infrared reflectance spectroscopy (NIRS) predicted values vs. reference methods for calibration (blue) and cross-validation (red) samples in parameters of (A) crude protein (CP) %, (B) neutral detergent fiber (NDF) %, (C) acid detergent fiber (ADF) %, and (D) dry matter (DM) % in Cratylia argentea.
Agronomy 13 02525 g002
Figure 3. Regression coefficients of the PLS models for (A) CP, (B) NDF, (C) ADF, and (D) DM.
Agronomy 13 02525 g003
Figure 4. Scatter plots of near-infrared reflectance spectroscopy (NIRS) predicted values vs. reference methods for external cross-validation (black) samples in parameters of (A) crude protein (CP) %, (B) neutral detergent fiber (NDF) %, (C) acid detergent fiber (ADF) %, and (D) dry matter (DM) % in Cratylia argentea.
Agronomy 13 02525 g004
Table 1. Calibration and validation results of estimating the chemical properties of Cratylia argentea plants from NIR reflectance spectra using partial least squares regression.
Chemical Properties (%)N calSDMinMaxLVR2calRMSEcN valR2valRMSEp
CP1083.2711.59 ± 0.2428.51 ± 0.7660.940.66 ± 0.01470.930.83 ± 0.01
NDF1058.6633.89 ± 0.4164.15 ± 0.57100.932.15 ± 0.15450.912.71 ± 0.09
ADF10710.8729.55 ± 0.3272.69 ± 1.05100.922.85 ± 0.25450.883.55 ± 0.38
DM821.2191.59 ± 0.0196.05 ± 0.0130.910.36 ± 0.05350.890.39 ± 0.01
CP = crude protein, NDF = neutral detergent fiber, ADF = acid detergent fiber, DM = dry matter, N cal = calibration samples, SD = standard deviation, Min = minimum value, Max = maximum value, LV = latent variable, R2cal = determination coefficient of calibration, RMSEc = root mean squared error of calibration, N val = validation samples, R2val = determination coefficient of validation, RMSEp = root mean squared error of prediction.
Table 2. Optimized results of estimating the chemical properties of Cratylia argentea plants from NIR reflectance spectra using partial least squares regression after variable selection.
Chemical Properties (%)N calSDMinMaxLVR2calRMSEcN valR2valRMSEp
CP1083.2711.59 ± 0.2428.51 ± 0.7650.940.73 ± 0.01470.930.84 ± 0.01
NDF1058.6633.89 ± 0.4164.15 ± 0.5780.932.20 ± 0.12450.912.59 ± 0.08
ADF10710.8729.55 ± 0.3272.69 ± 1.0580.922.85 ± 0.23450.883.55 ± 0.35
DM821.2191.59 ± 0.0196.05 ± 0.0130.910.35 ± 0.03350.890.38 ± 0.01
CP = crude protein, NDF = neutral detergent fiber, ADF = acid detergent fiber, DM = dry matter, N cal = calibration samples, SD = standard deviation, Min = minimum value, Max = maximum value, LV = latent variable, R2cal = determination coefficient of calibration, RMSEc = root mean squared error of calibration, N val = validation samples, R2val = determination coefficient of validation, RMSEp = root mean squared error of prediction.
Table 3. Validation results were used to test the prediction accuracy of NIRS models for the chemical composition of Cratylia samples (%).
Measured MeanPredicted MeanBias *p Value +Relative RMSEp (%)RPD
CP20.12 ± 0.0320.04 ± 0.19−0.170.13993.854.8 ± 0.3
NDF41.62 ± 0.6242.07 ± 0.63−0.980.60264.314.0 ± 0.1
ADF44.25 ± 0.1044.68 ± 0.18−0.370.85436.343.5 ± 0.3
DM94.19 ± 0.0194.20 ± 0.010.170.50770.383.4 ± 0.3
CP = crude protein, NDF = neutral detergent fiber, ADF = acid detergent fiber, DM = dry matter, Bias is the measured mean minus the predicted mean; therefore, negative values indicate overestimation, and positive values indicate underestimation of the equation. * The probability of there being no significant difference between the measured mean and the predicted mean was analyzed using the student’s t-test. + Root mean square error of prediction is presented as a percentage of the measured mean for standardization. RPD = ratio of performance to deviation.
Disclaimer/Publisher’s Note: The statements, opinions and data contained in all publications are solely those of the individual author(s) and contributor(s) and not of MDPI and/or the editor(s). MDPI and/or the editor(s) disclaim responsibility for any injury to people or property resulting from any ideas, methods, instructions or products referred to in the content.

