Article

Insect Pollinator Monitoring in and around a Netted Plot of Apple Trees—Biosafety Implications for Genetically Engineered Fruit Trees

by
Michael Meissle
1,*,
Mario Waldburger
1,
Philippe Jeanneret
1,
Giovanni A. L. Broggini
2,3,
Andrea Patocchi
2 and
Jörg Romeis
1
1
Research Division Agroecology and Environment, Agroscope, Reckenholzstrasse 191, 8046 Zurich, Switzerland
2
Research Division Plant Breeding, Agroscope, Mueller-Thurgau-Strasse 29, 8820 Waedenswil, Switzerland
3
Molecular Plant Breeding, Institute of Agricultural Sciences, ETH Zurich, Universitaetstrasse 2, 8092 Zurich, Switzerland
*
Author to whom correspondence should be addressed.
Agronomy 2023, 13(1), 84; https://doi.org/10.3390/agronomy13010084
Submission received: 18 November 2022 / Revised: 21 December 2022 / Accepted: 22 December 2022 / Published: 27 December 2022

Abstract

:
The complete netting of orchards is one strategy to protect fruit trees from pest and pathogen damage by reducing insect movement. When the cultivated trees were derived from genetic engineering (GE), reduced pollinator movement may also reduce outcrossing to cultivated or wild non-GE trees. We report on a field study over four years in a plot of apple tress supplied with insect side nets and covered with hail nets that were closed from shortly before flowering to harvest. A reduced number of arthropods in general, and large bees in particular, were recorded inside the netted plot compared with outside. However, wild bees colonized the plot before the net was closed and built up populations inside. An additional experiment demonstrated that small bees were able to cross the hail net. While the nets were effective in excluding large bees as active pollen vectors, the proportion of small bees acting as such remained unquantified. Furthermore, a companion study showed occasional cross-pollination events through the netting. For the field release of GE apple trees, acceptable levels of outcrossing thus need to be defined.

1. Introduction

Apple production is constantly threatened by insect pests and pathogens, such as fire blight or scab, which require multiple applications of pesticides. Although natural resistance genes exist in wild apple species, using them for the conventional breeding of resistant cultivars is laborious, because of the self-incompatibility and the long generation time of apple. Genetic engineering (GE) offers smart solutions to rapidly transfer disease resistance genes from wild relatives into popular apple cultivars (cisgenesis) [1,2].
Apple is insect pollinated, mainly by honeybees, bumblebees, solitary bees and hoverflies, while pollen transfer by wind (wind pollination) is reported to be highly inefficient [3,4,5,6,7]. Bee pollinators are central-place foragers, i.e., they have a fixed nesting site (bee hive or nest in the ground or other structure) from which they forage and return, with foraging ranges between a few hundred meters and several kilometres, depending on the species [8,9]. Pollinators also transport pollen from flowers of apple trees to flowers of other cultivated or wild apple trees and pollinate them. In case pollinators would fertilize flowers on non-GE apple trees with pollen from GE trees, the embryos in the seeds of the apples of the recipient trees contain GE material, which might potentially lead to outcrossing.
Regulatory approval for the release of GE crops into the environment may require measures to minimize the risk of outcrossing to non-GE crops. In some jurisdictions, e.g., in Switzerland and the European Union, coexistence with other forms of agriculture, such as conventional or organic, needs to be ensured and contamination of the gene pool of naturally occurring wild relatives (e.g., Malus sylvestris) needs to be avoided [10,11]. Commercial apple orchards in Europe often are covered with hail nets to protect the trees during most of the growing season. Apple orchards also can be fitted with side-nets to protect against birds and larger insect pests, such as the codling moth and related species [12,13]. If movement of insects between orchards is reduced, it may also help to reduce pollen and pathogen movement (e.g., Erwinia amylovora, the causal agent of fire blight). A strategy involving fine-meshed netting of GE-apple orchards could thus be effective in reducing the risk of outcrossing.
For the current study, a completely netted plot of apple trees was established with the main aim to study field performance of the cisgenic, fire blight resistant ‘Gala Galaxy’ line C44.4.146 [2]. Because no prior knowledge about the effectiveness of netted orchards on reducing pollen dispersal was available, biosafety measures involved flower removal or emasculation of experimental and control plants so that no GE-pollen was released. The realized pollinations across the netting, however, was measured by Schlathölter et al. [14] using two cross-compatible non-GE apple varieties, one inside and one outside the netted plot. The netting reduced cross-pollinations effectively, but could not prevent them completely. While [14] focused on genetic analyses of apple seedlings to detect in- and outcrossing events, the aim of the current study was to quantify arthropod populations, particularly pollinators, within and outside the netted plot. Over a four-year period (2016–2019), arthropods were monitored with coloured pan traps and flower visitation observations, two methods that are often used to monitor flower-visiting arthropods [15,16,17,18,19,20]. The obtained data are discussed in the context of the cross-pollination data [14].

2. Materials and Methods

2.1. Netted Plot

The experimental field site is described in detail in [14]. In short, a netted plot (30 × 70 m) at Agroscope Reckenholz (Zurich, Switzerland; 47.4279° N, 8.5225° E) harboured trials with one cisgenic and six non-GE ‘Gala’ genotypes [2,14,21]. While flowers of all ‘Gala’ genotypes were removed or emasculated, 48 trees of the non-GE variety ‘Ladina’ were interplanted in 6 rows (8 trees per row) and allowed to flower without restrictions. Outside the netted plot, groups of 10 ‘Nicogreen’ trees each were established at different orientations and distances to the nearest ‘Ladina’ tree (group A: 15 m east, B: 8 m north, C: 117 m west, D: 72 m south, E: 8 m south) (Supplementary Materials, Figure S1). ‘Ladina’ and ‘Nicogreen’ are 100% cross-compatible and have a similar flowering time. The experimental setup was established on 10 May 2016 with two-year-old trees. In the year of establishment, flowering of ‘Ladina’ and ‘Nicogreen’ was delayed by 5–6 weeks compared to established apple trees in the region. In 2018, 7 ‘Nicogreen’ trees in group D had to be replaced after the winter with two-year-old (already flowering) trees.
Black insect netting (0.9 × 1 mm mesh size) was used for the sides of the netted plot. At the bottom, the netting was buried 30 cm deep to seal it against the ground. The roof (3.5 m height) consisted of black hail-protection nets (3 × 7 mm mesh size). In 2016, the hail nets were constructed as overlapping layers that open between the rows in case of snowfall. In 2017, the overlapping parts were twisted to improve the tightness of the netting. In 2018, the system was further improved with a construction where the different hail net layers were connected with continuous zippers all along the rows. On the longer sides of the plot, the hail netting was sewn to the insect netting, while on the shorter sides, the hail netting layers were spanned over the beams of the orchard construction. For access, a two-door interlock system was made of insect netting. The hail nets were opened after apple harvest (October) and closed before the beginning of the flowering period (Table 1). In 2017, the nets had to be opened for one (19–20 April) and two nights (26–28 April) to prevent damage by snowfall. Weather data (daily temperature and precipitation) during the sampling periods were available from a weather station approximately 350 m from the netted plot (Supplementary Materials File S1, Table S1).

2.2. Pan Trap Sampling and Arthropod Identification

Pan traps were installed between the apple trees. Four trapping stations in a diagonal line were established inside the netted plot and four stations were established aside the ‘Nicogreen’ groups around the netted plot (groups A–D, no station in row E, Figure S1). The stations consisted of a wooden post fitted with three plastic pots (diameter 14 cm, height 12 cm), each sprayed in- and outside with either blue, yellow, or white luminous colour (Sparvar, YC Nautica Sport Bern AG, Bern) to catch arthropods with different colour preferences. A 1 cm-opening below the rim of the pots, covered with fine plastic gauze, prevented overflow during rainfall (Figure S1). The pots were placed approximately 120 cm above the ground. Each pot was filled with ca. 800 mL tap water and 2–3 drops household detergent (Handy, Migros, Zurich, Switzerland). The traps were emptied twice per week and the collected arthropods were transferred to glass vials with 70% ethanol. After the hail nets were closed, sampling started immediately (2017, 2019), or after 2–2.5 weeks (2016, 2018) (Table 1). Trapping lasted 31 (2018) to 47 days (2019) until the end of the ‘Ladina’ and ‘Nicogreen’ flowering period. In 2019, trapping started already 2.5 weeks before the hail nets were closed to get an impression of arthropod activity before the closed space was created.
An additional experiment was conducted in 2020 to test if bees can pass through the hail nets used to cover the plot. Four trapping stations were installed on 16 March and operated until 8 May as described above (15 sample collections, 53 trap days). The traps were placed in a row of established high stem apple trees approximately 250 m away from the netted plot. In three of those stations, the pots were covered with hail net (as used for the netted plot), while pots of one station remained open.
All arthropods collected in the pan traps were sorted in taxonomic groups, as possible without detailed microscopic examination. Bees (Hymenoptera: Apidae) were further determined to species by Andreas Müller (Natur Umwelt Wissen GmbH, Zurich, Switzerland). The thorax width of all bees was determined using electronic callipers.

2.3. Flower Visitation Observations

Flower visitation observations were conducted on two days in each year (7/10 June 2016; 13/24 April 2017; 23/25 April 2018; 24/25 April 2019), when the weather was sunny to lightly clouded, warm, and with light wind [19]. On each day, two rounds of observations were conducted between 10:00 am and 5:30 pm. In each ‘Nicogreen’ group (A–E) outside the netted plot, four (out of ten) randomly selected trees were observed for 2 min per observation round (5 groups × 4 trees). Inside the netted plot, four ‘Ladina’ trees (out of eight) in five of the six rows were observed (5 rows × 4 trees). Total observation time per year was thus 320 min. Whole trees (all flowers) were observed for visiting arthropods by standing quietly approximately 1 m away from the trees. The following parameters were recorded: (1) number of flowers visited by apple pollinators, i.e., honeybees (Apis mellifera, Hymenoptera: Apidae), bumblebees (Bombus spp.: Apidae), other wild bees (Apidae), or hoverflies (Diptera: Syrphidae); (2) number of bee flies (Diptera, Brachycera: Bombyliidae), other small or large flies (Diptera: Brachycera), crane flies (Diptera, Nematocera: Tipulidae), ladybirds (Coleoptera: Coccinellidae) or other beetles (Coleoptera), parasitic wasps (Hymenoptera parasitica), lacewings (Neuroptera: Chrysopidae), or spiders (Araneae), observed on or in apple flowers; (3) presence of ants (Hymenoptera: Formicidae), pollen beetles (Coleoptera: Nitidulidae) and aphids (Hemiptera: Aphididae) on the trees (yes/no). In addition, the number of open flowers per tree was estimated.

2.4. Hand Collections

In addition to the experimental work described above, altogether eight bees, in particular large bees, also were collected sporadically by researchers working in the netted plot during the flowering period in the years 2016–2019. Furthermore, we conducted an additional planned hand collection of bees in 2020 when we searched for fresh bee nests on the ground and when we observed a number of small bees inside the netted plot lingering at the bottom meter of the insect side netting. Altogether 53 bees observed on the netting were collected by hand on 24 April 2020. The experimental setup of the netted plot in 2020 was as described above for 2018 and 2019. Hand-collected bees also were determined to species.

2.5. Data Analysis

Arthropod data were aggregated as needed across trap colours, trapping stations, sampling dates, years, sexes, and species for generating tables and figures. As a statistic to measure the similarity of the bee communities inside and outside the netted plot, we calculated the Sørensen index (SI) for all years pooled and for each year separately [22]:
SI = (2 × Ec)/(Ei + Eo)
where Ec is the number of species in common inside and outside the netted plot and Ei and Eo is the number of species inside and outside, respectively. As a measurement of species diversity, the Shannon index (H’) was calculated for bees collected inside and outside the netted plot [22]:
H’ = −∑pi × ln(pi)
where pi is the proportion of the entire community made up of species i. In addition, we also calculated the Evenness:
E = H’/ln S
where S is the total number of species.
Multivariate ordination plots with non-metric multidimensional scaling (NMDS) of bees collected 2016–2019 were created in R, version 4.2.1 [23]. One plot was based on yearly data, where the three traps per station (yellow, white, blue) and all sampling dates per year were pooled, resulting in one pooled sample per trapping station per year. For the species matrix and the analysis, male and female wild bees were treated separately. For Bombus spp., females and workers were differentiated and A. mellifera were all workers. For the environment matrix, the variables year and plot type (inside/outside the netted plot) were included. Species with less than 5 collected individuals over all years and traps were not considered in the analyses. Ordinations were calculated using the ‘metaMDS’ command from the package ‘vegan’, with maxit = 100, and k = 2. The function used sqrt transformation and Wisconsin double standardization and determined the best global solution with lowest stress values in 20 runs. Ordination plots were created using the ‘ordiplot’ function. For a second plot, data from each collection date were used as individual samples. Because of a high number of samples with no common species for this analysis, ‘metaMDS’ was performed with noshare = TRUE and k = 3 to find a converging solution.

3. Results

3.1. Arthropods Collected inside and outside the Netted Plot

During the sampling periods of the 4 years, altogether 29,304 arthropods were collected with the pan traps. Overall, inside the closed netted plot, 37% less arthropods were collected than outside (Figure 1A, Table S2). Arthropod numbers collected inside were lower than those outside in all of the 4 years (Figure 1B). Most arthropods were collected outside in 2017 (5942 individuals), lowest numbers were collected inside in 2018 (1252). Numbers of collected arthropods both inside and outside the netted plot were overall stable from the start to the end of the sampling periods (linear regression over all years, p ≥ 0.2, Figure S2A). Furthermore, linear regression of trap days (x) with the ratio of all arthropods collected outside/inside (y) revealed no significance (p = 0.4) and an almost horizontal trend line (y = 0.013x + 1.6; R2 = 0.01) (Figure S2B). This indicates that the relationship of arthropods collected outside and inside the netted plot did not change systematically during the course of the collection period.
Most of the collected arthropods (20,006) belong to the order of Diptera, with the majority being undetermined flies (Brachycera) and midges (Nematocera) (Figure 1A, Table S2). Diptera also included assassin flies (Asilidae), frit flies (Chloropidae), and crane flies (Tipulidae). Hoverflies (Syrphidae), which are listed as pollinators of apple, were only collected in small numbers, i.e., none inside the netted plot and 25 outside. Hymenoptera and Coleoptera were the second most collected orders (3069 and 2814, respectively). Within the Hymenoptera, bees (Apidae), the main pollinators of apple, were collected most frequently, followed by parasitic wasps (Hymenoptera parasitica), ants (Formicidae), sawflies (Symphyta), and others. Coleoptera consisted of sap beetles (Nitidulidae), rove beetles (Staphylinidae), and other beetles including Curculionidae, Alticini, and Coccinellidae. Altogether 1385 springtails (Collembola) and 1146 thrips (Thysanoptera) were collected, as well as 709 Hemiptera, such as aphids and related taxa (Sternorrhyncha), bugs (Heteroptera), and leafhoppers (Cicadomorpha, Cicadellidae). In addition, spiders (Araneae) were collected occasionally (125 individuals) and some butterflies and moths (Lepidoptera), booklice (Psocoptera), lacewings (Neuroptera), plant hoppers (Orthoptera), and mites (Acarina) were found (50 individuals altogether). The yearly catches of all taxa can be found in the Supplementary Materials, Table S2.
Most arthropod taxa collected in pan traps showed lower numbers inside the netted plot compared to outside (Figure 1A), while the reduction ranged from 17% (parasitic wasps and Symphyta) to 100% (Syrphidae and Bombus spp.). Three taxa, however, showed higher numbers inside the netted plot: Tipulidae, Collembola, and Araneae. When we look at the yearly data of those three taxa, different patterns emerge (Figure 1C–E). Tipulidae showed large variations over the years, especially outside the netted plot, where catches ranged from 2 individuals in 2017 to 75 individuals in 2019. In contrast, Collembola were found in the pan traps in high numbers (>1000) only in the year of establishment of the apple plot (2016) inside the net, while numbers were much lower in the following years inside (3–33) and in all years outside (15–48). Finally, Araneae showed similar numbers inside and outside the netted plot in 2016 and 2019, while spiders collected inside in 2017 and 2018 were approximately double than those collected outside.

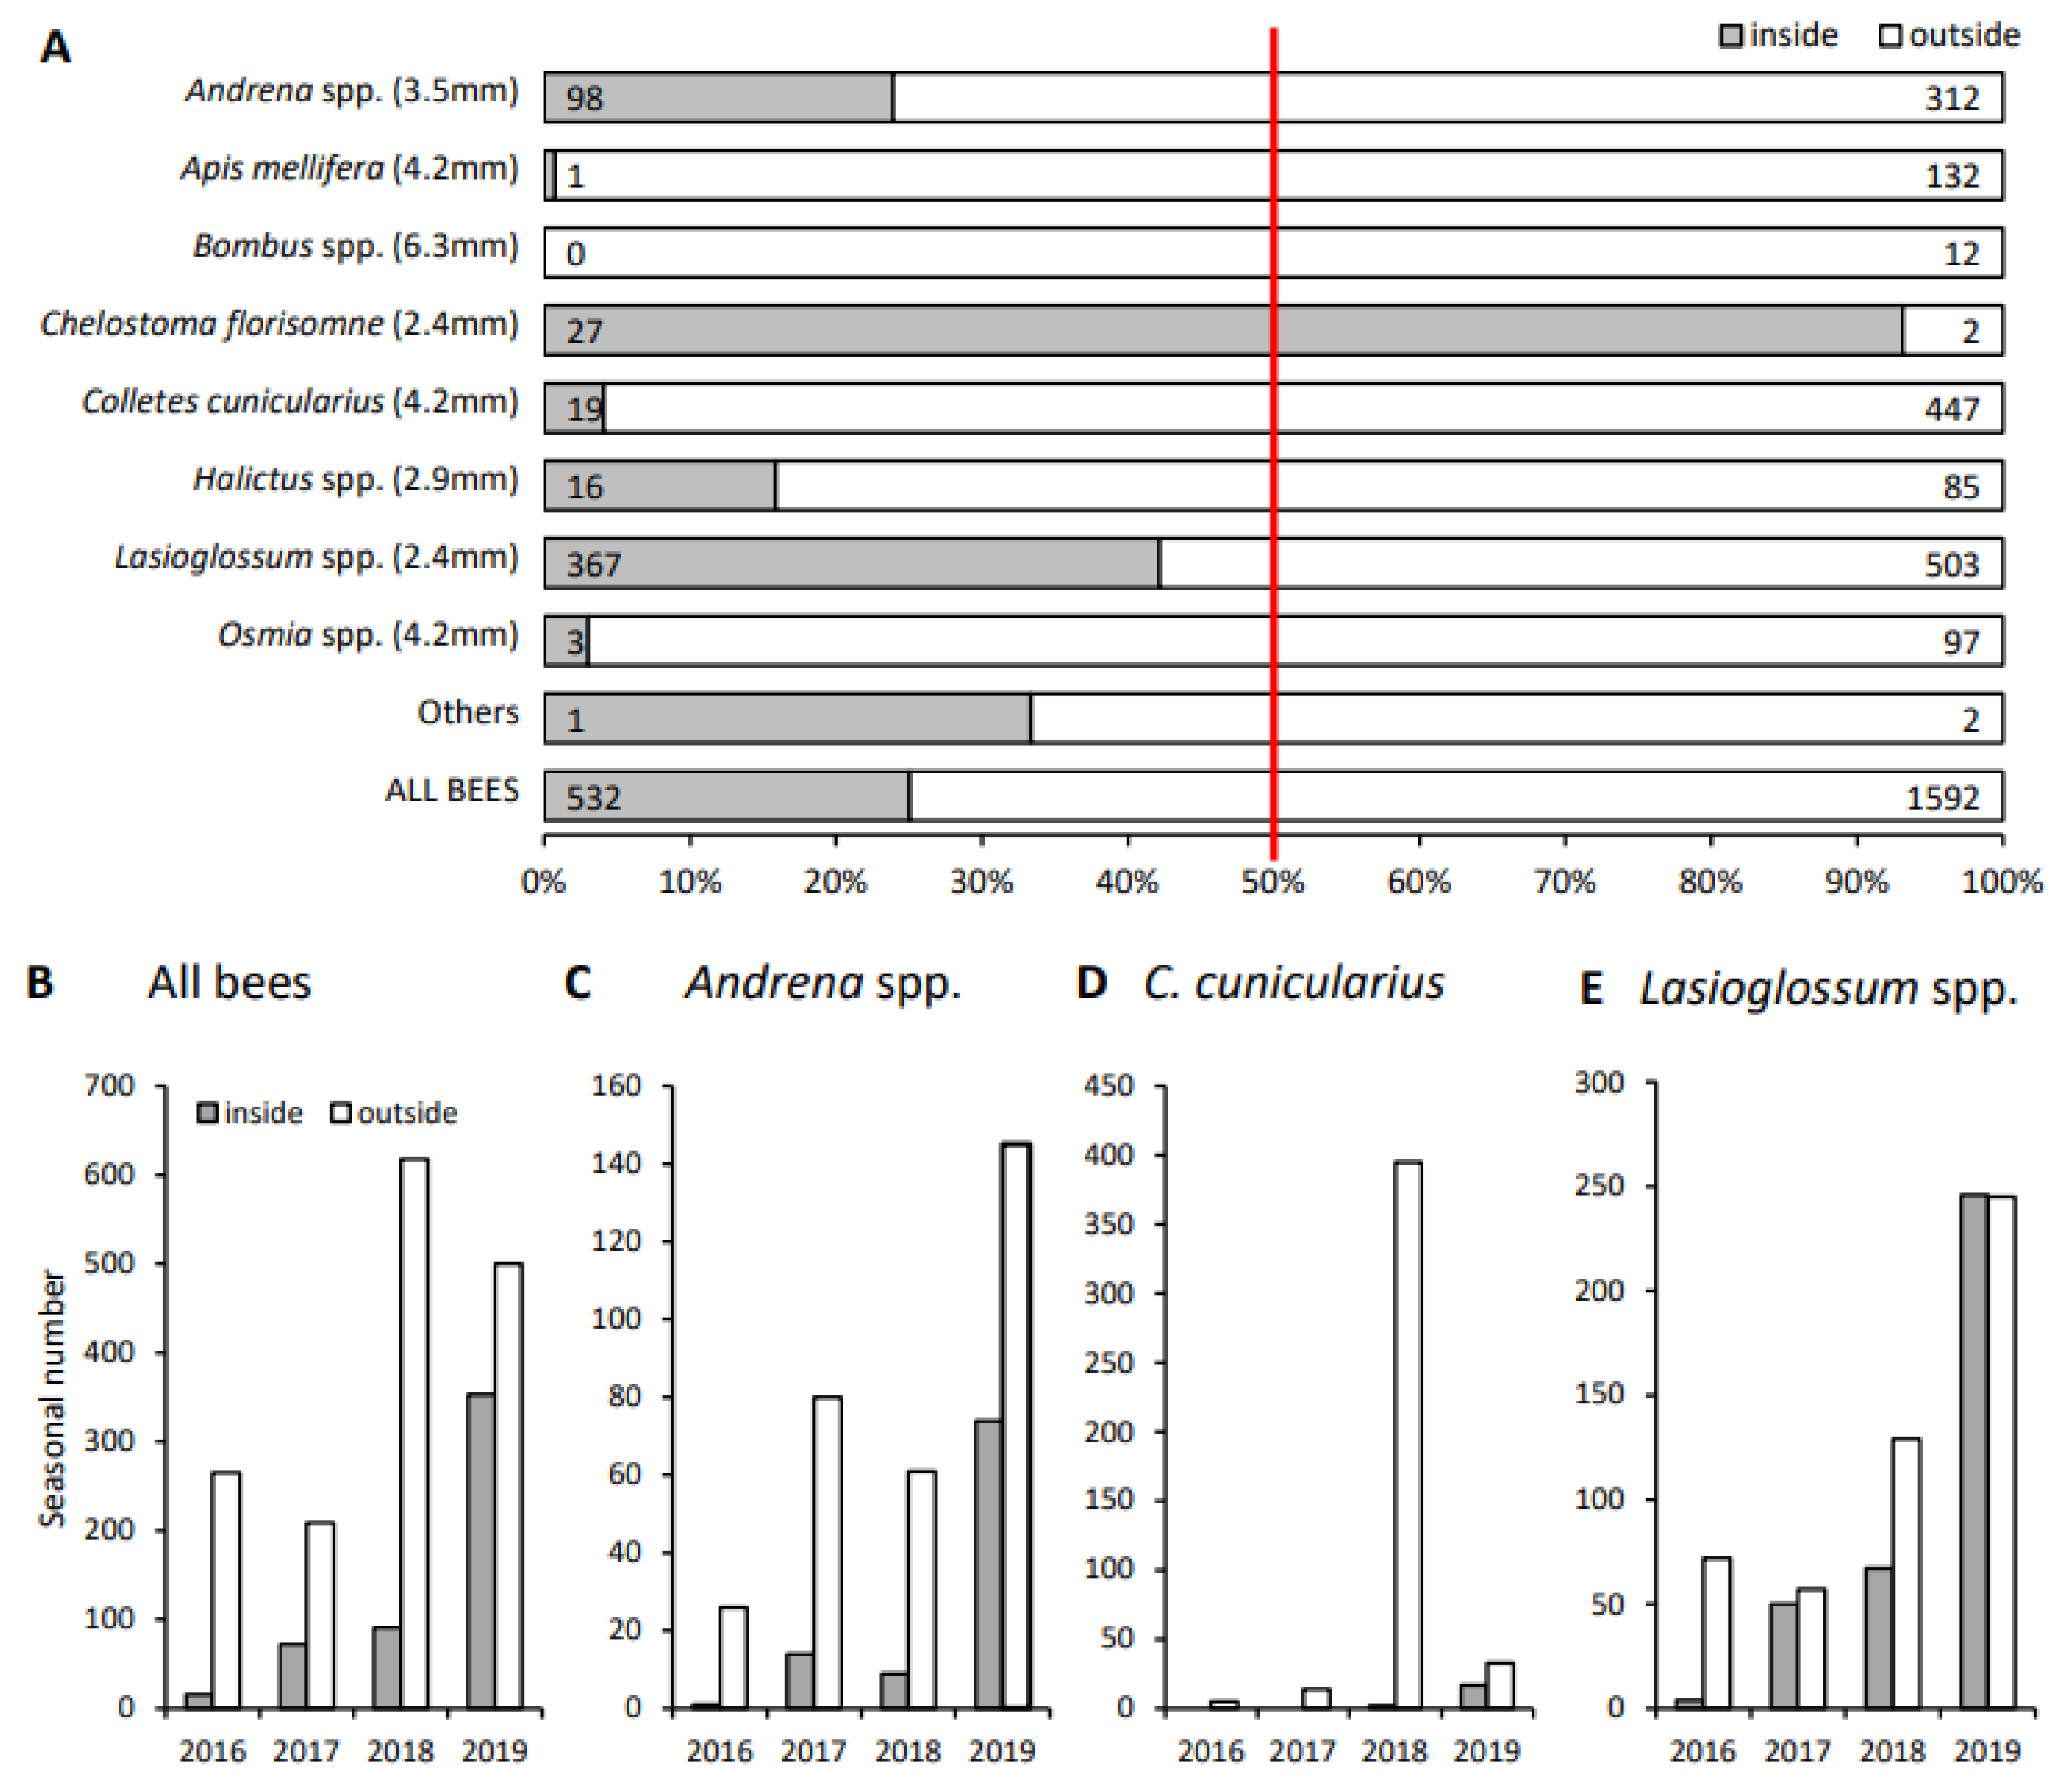
3.2. Bees Collected inside and outside the Netted Plot

After the net was closed, the colour traps collected 2124 bees from 53 species when all catches inside and outside from the years 2016 to 2019 were combined. Outside, 1592 individuals from 46 species and inside, 532 individuals from 30 species were collected. This indicates that the netting reduced bee numbers by 67%. Most collected bees were Lasioglossum spp. (14 species), followed by Colletes cunicularius, Andrena spp. (21 species), A. mellifera, Halictus spp. (3 species), Osmia spp. (4 species), Chelostoma florisomne, and Bombus spp. (5 species) (Figure 2A). The yearly catches of all bee species can be found in Supplementary Materials, Table S3.
Outside the netted plot, the number of all bees combined fluctuated over the years with lowest numbers collected in 2017 (209 individuals) and highest numbers collected in 2018 (618 individuals) (Figure 2B). Inside the plot, bee numbers increased continuously from 2016 (72 individuals) to 2019 (353 individuals) (Figure 2B).
Large bees (average thorax width > 4 mm), including A. mellifera, Bombus spp., C. cunicularius, and Osmia spp., were almost absent inside the netted plot (Figure 2A,D). Middle sized Andrena spp. (width 3.5 mm) and Halictus spp. (width 2.9 mm) were found more frequently inside the plot, but numbers were generally lower than outside (Figure 2A,C). Small bees (width 2.4 mm) were abundant inside, with Lasioglossum spp. showing almost equal numbers inside and outside (Figure 2E) and C. florisomne being collected almost exclusively inside (Figure 2A).
The histogram of bees inside and outside the netted plot based on actually measured thorax width of each individual bee (Figure 3) also shows that bees larger than 3 mm width were collected in highly reduced numbers inside (81 individuals) compared to outside (984 individuals). Smaller bees (≤3 mm) were collected frequently inside (450) and outside (608) the netted plot.
Outside the netted plot, the total number of collected species varied little over the years (ranging from 24 to 30), while inside, the species number increased from 8 in 2016 to 22 in 2019 (Table 2). This is reflected in the Sørensen index, which increased over time from 0.34 in 2016 to 0.69 in 2019, indicating higher similarity of bee communities inside and outside the plot over time. The Shannon index for the individual years indicates higher species diversity of bees collected outside than inside, except for 2018, where high numbers of C. cunicularius dominated the samples from outside. Accordingly, Evenness was lowest outside in 2018 and highest inside in 2017. Over all years, the Shannon index was 20% higher outside than inside. Similarly, bee communities collected outside showed 10% higher Evenness compared with communities collected inside.
In the ordination plot of yearly data that was created for the bees collected inside and outside the netted plot between 2016 and 2019 (Figure 4), bee communities inside (on the left side of the plot) separated well from those outside (right-side) on the first dimension (NDMS1). In addition, years separated on the second dimension (NMDS2), with 2016 on the bottom, 2018 and 2019 on the top and 2017 in between. When each collection date was used as an individual sample, the ordination plot shows a comparable pattern regarding the position of the centroids for plot types (inside/outside) and years (Figure S3).

3.3. Bees Collected before the Net Was Closed

In 2019, coloured pan traps were operated already 2.5 weeks before the net was closed to get an impression which bees have colonized the apple plot before the isolated space was created. The results revealed that many bees were active before the net was closed (Figure 5), since we collected 432 Andrena spp., 342 Lasioglossum spp., 209 C. cunicularius, 26 Megachile spp., 6 A. mellifera, and 5 others. The total number of bees collected at the trapping stations inside the (open) netted plot was 28% lower than the number collected outside. For the full species list see Supplementary Materials, Table S3.

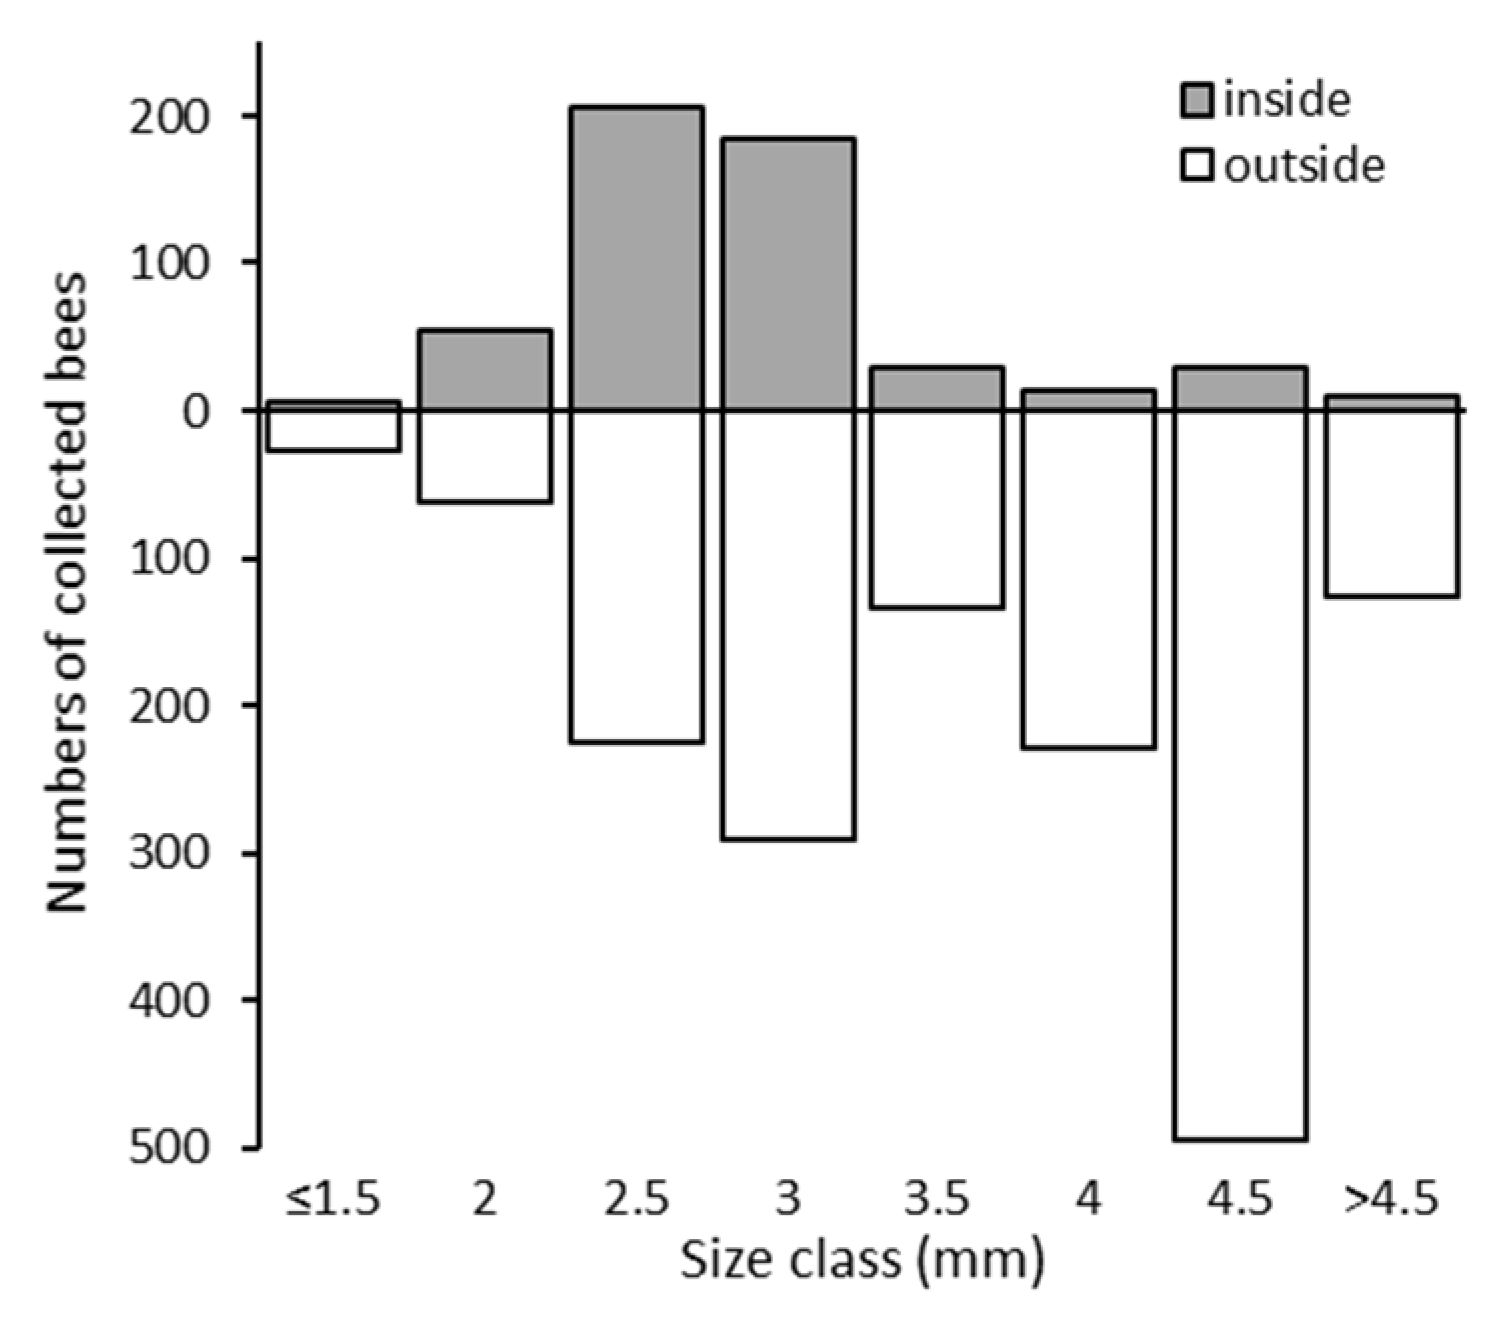
3.4. Capability of Bees to Pass the Hail Net

In the additional experiment conducted in 2020, the pots of three trapping stations were covered with the same material used for the hail net (3 × 7 mm mesh size) of the netted plot, while the pots of one station remained open. In the 53 days of trapping, 169 bees were collected in the station without netting: 50 Andrena spp. (32 males, 18 females, average thorax width 3.5 mm), 3 A. mellifera workers (4.2 mm), 1 Bombus sylvarum female (6.8 mm), 88 C. cunicularius (77 males, 12 females, 4.2 mm), 11 Halticus spp. females (3.3 mm), 15 Lasioglossum spp. females (2.3 mm), and 1 Osmia bicornis male (3.3 mm). In contrast, the three stations covered with netting collected only 19 bees, which were all small: 18 Lasioglossum spp. females (2.3 mm) and 1 small O. bicornis male (2.9 mm). The species list of this experiment can be found in Supplementary Materials, Table S4.

3.5. Flower Visitation Observations

During the flower visitation observations in 2016–2019, flowers outside the netted plot were visited by honeybees (A. mellifera), bumblebees (Bombus spp.), other bees (Apidae), and Syrphidae (hoverflies) (Figure 6A). Inside, no flower visits were observed in 2016–2018. In 2019, four wild bees were observed to visit a total of 25 flowers. It has to be noted that one bee can visit many flowers during a single foraging flight and inside the netted plot, one O. bicornis bee was observed to visit 19 flowers in a row. Outside, several arthropods from other taxa, e.g., flies (Diptera, Brachycera) or beetles (Coleoptera), were observed in or on the apple flowers, while much fewer arthropods (except Araneae) were observed inside (Figure 6B). In addition, ants (Formicidae) and pollen beetles (Nitidulidae) were present on apple trees both inside and outside, while aphids (Aphididae) were only recorded in very small numbers on trees outside (Figure 6C). Altogether, more than 22,500 flowers were observed. During the observation period, the ‘Ladina’ trees inside the netted plot had 32% more open flowers than the ‘Nicogreen’ trees outside (Figure 6D).

3.6. Hand Collections

Two honeybees (A. mellifera) and one Halictus tumulorum were detected by coincidence and collected inside the netted plot in 2016, three bumblebees (Bombus spp.) were collected at the end of the flowering period in 2018, and two bees (Lasioglossum laticeps, O. bicornis) were collected after the flower observations inside the netted plot in 2019.
Hand collections of small bees from the side netting of the plot in 2020 revealed 5 H. tumulorum, 1 Sphecodes punctipes, and several Lasioglossum spp. (37 L. pauxillum, 4 L. glabriusculum, 4 L. politum, 2 L. villosulum) (see Supplementary Materials, Table S5).

4. Discussion

4.1. Fewer Arthropods in Netted Plot

Overall, fewer arthropods were collected inside the netted plot of apple trees compared to outside. Most of the approximately 20 distinguished arthropod taxa showed lower abundance inside with a few exceptions (Tipulidae, Collembola, Araneae). When looking at bees as important pollinators of apple, we also recorded lower numbers in the netted plot, in particular large species with a thorax width > 3 mm were reduced dramatically. Inside the netted plot, there were no bumblebees in the colour traps (but 3 hand collected ones), and only one honeybee in 2016. The Shannon index also shows a lower species diversity of bees inside the netted plot compared with outside, yet Evenness values suggest a more balanced community in three out of four years inside compared to outside, but not when all years were combined. Hoverflies, another important pollinator group, were never observed or trapped inside.
One obvious explanation for reduced arthropod catches inside the netted plot is that the netting prevented arthropod movement. First, the insect netting on the sides of the plot (mesh size 0.9 × 1 mm, approximately 3.5 m height) prevented even smaller arthropods that move mainly horizontally near the ground from entering the plot. Second, the hail net covering the plot (mesh size 3 × 7 mm) prevented larger species to enter from the top.
Nevertheless, the net construction did not prevent movement of apple pollinators completely for the following reasons: First, in 2016 and 2017, the hail net was constructed as overlapping spanned bands (twisted in 2017), which represented a less efficient insect barrier than in the last two years, where the bands were connected by zippers. This difference in net construction, however, seemed to have had little effect on total bee catches. In all years, fewer bees were collected inside the netted plot than outside and numbers of collected bees inside were higher in the last two years than in the first two years. Second, the nets were checked regularly and occasionally small holes in the side and hail net and crevices in the spanned hail net were detected and immediately repaired. In fact, the spanned hail net may have acted as a Malaise trap (funnel) for insects (Supplementary Materials, Figure S4A). The three bumblebees collected in 2018 likely have entered the netted plot in such a way. Third, small bee species were able to pass the hail net, as shown in the additional experiment in 2020 for Lasioglossum species and small O. bicornis males. It has to be noted, however, that the additional experiment was carried out in 1.2 m above the ground, while the netted construction had a height of approximately 3.5 m. Furthermore, field collected Halictus spp. with a thorax width up to 4 mm were able to pass the hail net in an experiment with hail net dividing a transparent plastic cylinder and light and honey solution offered at the other side of the net (Gilliéron et al., unpublished data).
Netting of orchards has been used in horticulture to protect various crops against damage by birds, bats, hail, wind, frost, and sunburn [12,13]. In addition, finer netting has been used to exclude pest insects and to prevent spread of disease-vectors between different orchards [12,13]. Experiments in apple orchards demonstrated that several pests and pathogens, including Cydia pomonella L. (Lepidoptera: Tortricidae) and other fruit moths, Halyomorpha halys (Stål) (Hemiptera: Pentatomidae), Drosophila suzukii (Matsumara) (Diptera: Drosophilidae), or E. amylovora can be excluded successfully from netted fruit orchards, which reduced the need for pesticide applications [12,13,24,25]. If netting is applied during the flowering stage to prevent pollinator movement, one needs to ensure, however, that pollination inside the netted orchard is secured, e.g., by releasing (pathogen free) bumblebees or other bees and that sources of compatible pollen (e.g., for apple, cultivars with different S-alleles) are available.
While the netting prevented movement of arthropods, the traps installed inside the netted plot may have contributed to the reduction of abundances compared to outside. With an assumed limited movement of arthropods through the netting and the traps collecting arthropods continuously, the space within the netted plot may have been deprived of arthropods over time. Regression analysis of all years, however, revealed stable abundance of arthropods both inside and outside the netted plot and no significant difference in the ratio of inside and outside catches over the course of the sampling periods (Supplementary Materials, Figure S2). Thus, our data provide no evidence for a trap effect.

4.2. Netted Plot Provides Habitat for Arthropods

While most arthropods were collected in reduced numbers in the netted plot, springtails (Collembola), crane flies (Tipulidae) and spiders (Araneae) were collected in increased numbers. Collembola were collected in high numbers inside the netted plot only in 2016, the year when the field site was established. Most likely, the landscaping work necessary to establish the plot with the newly planted trees led to increased movement activity of Collembola. In the following years, only few springtails were present in the colour traps. In contrast, populations of crane flies and spiders increased over the years. One hypothesis is that the netted plot represented a predator-free space for these arthropods, as birds and other larger predators were excluded. Differences in microclimatic conditions inside and outside the netted plot might also have influenced population dynamics of arthropods. As we did not record climatic conditions in a comparable way inside and outside the net, we can only speculate on potential effects. It has been reported, however, that hail netting in apple orchards reduced light levels and wind speed, and may, under certain conditions, change temperature and humidity [26,27].
Populations of several bee species, such as Lasioglossum spp., increased over time and C. florisomne were almost exclusively collected inside the netted plot. In 2016, when the plot was established, the lowest number of bees was collected inside. However, more bees were collected in the last 2 years than in the first 2 years, also outside the netted plot. Possibly the growing trees with more flowers (inside and outside) became generally more attractive to bees, which led to more bees being finally collected in the colour traps placed close to the flowering trees. Furthermore, the apple plot provided large areas of open soil between the rows and along the side-nets, which might have attracted wild bee species that need open soil for nesting (Figure S4B). The Sørensen index shows that bee communities inside and outside the netted plot became more similar over the years, which was driven by increasing numbers of species collected inside. Overall, however, the ordination plot illustrates that the bee communities inside and outside differed. In addition, bee communities differed over the four years. The year of establishment of the plot (2016), when the newly planted trees flowered one month later than apple trees in the region, and the trapping was also shifted accordingly, was most distinct from the other years. 2018 and 2019 were close together and 2017 was in between 2016 and 2018/2019. The axis of the plot explaining most of the variation in the bee community data (NMDS1) is well described by the netted plot (inside/outside), while the years line up along the second axis (NMDS2). Both factors (plot and year) can thus be considered important drivers for the composition of bee communities.
When comparing seasonal sums of arthropod collections over the years, one needs to be aware that the length of the sampling periods was not identical for each year (ranging from 31 days in 2018 to 47 days in 2019) and that apple flowering and thus sampling in 2016 started more than one month later than in the following years. In addition, differences in weather conditions among the years likely influenced arthropod activity (Table S1). Average temperature during the sampling period in 2016 and 2018 was ca. 5 °C higher than in 2017 and 2019 and total precipitation ranged from 6 mm in 2018 to 320 mm in 2016. For example, in 2017, when we collected the lowest number of bees, there was frost, snow, and low overall temperature. Meteorological data and differences in sampling periods, however, cannot fully explain the population dynamics discussed above.
Our colour trap collection in 2019 before the hail net was closed showed clearly that many arthropods, including bees, were active and thus able to colonize the netted plot before the net was closed. Some of those species likely foraged and reproduced in the netted plot and built up populations over time. In addition to apple flowers, also other flowering plants were present inside the netted plot, although at low abundance, because of regular mowing. In 2019, altogether 9 different flowering plant species were observed over the course of the observation period: Veronica persica, Bellis perennis, Taraxacum officinalis, Lamium purpureum, Cardamine hirsuta, Cardamine pratensis, Senecio vulgaris, Geranium dissectum, and Stellaria media. Additionally, fresh bee nests in open soil were observed, mainly along the netting facing South (Supplementary Materials, Figure S4B). Bees collected by hand near those nests were mainly represented by different small Lasioglossum species (Table S5).
Netted orchards may be helpful in excluding larger key pests and pollinators, but they may also provide a favourable habitat for other pests. Indications for potential problems with woolly aphids Eriosoma lanigerum (Hausmann) (Hemiptera: Aphidiidae), apple leaf blister mites Eriophyes mali Nalepa (Acari: Eriophyidae), and apple leaf miner Leucoptera malifoliella O. Costa (Lepidoptera: Lyonetiidae) were found in netted apple orchards in Switzerland and Germany [13,25], albeit not in our netted plot. Rigden [26] also reported some pest problems under netting in orchards in Australia, e.g., a build-up of oriental tip moth Grapholita molesta (Lepidoptera: Tortricidae) populations in stone fruits, or longicorn beetles Strongylurus sp. (Coleoptera: Cerambycidae) in lychee. While the exclusion of insect vectors and microclimatic changes in netted orchards can help in reducing pathogen pressure, e.g., apple scab [25], other pathogens might benefit from changes in climatic conditions, e.g., Glomerella Leaf Spot disease [28].

4.3. Evidence for Pollen Flow through the Netting

Our study suggests that bee movement through the netting is limited (particularly for larger bees), but not prevented completely. In contrast, small bees up to 3 mm thorax width were shown to be able to pass the hail net. With respect to GE apple, one aim of a completely netted orchard is to limit outcrossing to neighbouring orchards or wild apple trees. For the last two years of the experimental field study described here, Schlathölter et al. [14] examined cross-pollinations through the netting by molecular analyses of seedlings derived from apples collected from ‘Ladina’ trees inside and ‘Nicogreen’ trees outside the netted plot. Pollination frequency from ‘Ladina’ trees inside, to ‘Nicogreen’ trees outside was low. Only 26 of 4500 ‘Nicogreen’ seedlings were fertilized by ‘Ladina’ pollen (0.6%), suggesting high efficacy of the netting in reducing pollen movement. On the other hand, 298 seedlings (2018) and 730 seedlings (2019) were obtained from ‘Ladina’ apples, which were generated by pollen originating from outside the netted plot. Of those seedlings, 48% (2018) and 75% (2019) were fertilized by ‘Nicogreen’ trees next to the netted plot, while the remaining seedlings must have been fertilized from trees further away. The relatively low total number of seeds from ‘Ladina’ apples indicates that most flowers inside the netted plot remained unfertilized. Because only ‘Ladina’ trees were allowed to flower inside the netted plot, pollen from outside was needed for successful fertilizations. In summary, the outcrossing study [14] demonstrated that netting reduced pollen movement substantially, but occasional outcrossing occurred. Because apple is insect pollinated, and wind pollination plays a minor role [3,4,5,6,7], we conclude from the data by Schlathölter et al. [14] that at least some pollinators must have passed the net barrier. The typical foraging range of most bee species is a few hundred meters, but some individuals may also travel in the kilometer range [8,9], which could explain ‘Ladina’ pollinations from trees that should be more than 300 m away.
It has to be noted that the number of bees collected inside the netted plot in the current study cannot be used as a direct indicator for the number of bees moving through the net barrier. Numbers of pollinators crossing the net can be assumed to be much lower because most likely traps mainly collected bees from resident populations inside the netted plot, which may never have crossed the net barrier. Furthermore, because no flowers of apple cultivars compatible with ‘Ladina’ were present inside the netted plot, a huge number of unfertilized open flowers were present. Thus, few bee individuals crossing the netting and carrying pollen from outside may have fertilized a large number of flowers, as indicated by the flower visitation observations in 2019. The fact that relatively few ‘Ladina’ apples and seeds were harvested demonstrates that the movement of pollinators across the netting was highly limited. The results by Schlathölter et al. [14] are corroborated by the results of the present study, showing that the netting may reduce the movement of bees substantially, but not prevent it completely, in particular not in the case of small bees.

4.4. Limitations of the Study

Although we placed multiple trapping stations inside and outside the netted plot and recorded arthropods over four years, the study cannot be considered replicated, because only one netted plot was available and thus the data of the different trapping stations were not independent. For this reason, we decided to present our results in a descriptive way without statistical hypothesis testing.
During the flower visitation observations, hoverflies and bumblebees were observed frequently, but only outside the netted plot. While solitary bees were collected by the trapping stations in high numbers, only few hoverflies (25) and bumblebees (12) were observed in the traps, and also exclusively outside the netted plot. While pan traps and flower visitation observations delivered principally the same results, colour traps may not be an optimal method to record hoverflies and bumblebees and the data from the flower observations might be more informative for those pollinator groups. The fact that some arthropods will be underrepresented in pan trap catches, even when combing different coloured traps, is well known [20].
Although regression analyses did not indicate a trapping effect, it remains unclear to what extend populations, in particular inside the netted plot, were affected by the continuous trapping. Furthermore, the actual number of arthropods that crossed the hail nets remains unknown and thus also the effect of the modification of the system to zippers to better close the hail nets after the first two years of the experiment remains unknown. The modified system, however, did not lead to systematically lower numbers of arthropods (or bees) collected inside the netted plot. Clearly, this modification, as well as the twisting of the hail nets in 2017, prevented the entry of honeybees into the netted plot.

5. Conclusions

In an apple plot supplied with insect side netting and hail netting that was closed during the flowering period, a reduced number of arthropods in general, and large bees in particular, were recorded inside the plot compared with outside. However, we showed that small bee species were able to cross the hail net. In addition, our study suggests that bees colonized the plot, mainly before the nets were closed in spring, and built up populations inside the plot over the years. This indicates that bee captures inside the netted plot cannot be directly linked with pollen flow as the proportion of bees crossing the net barrier compared with those collected from resident populations remains unclear. Data from a corresponding outcrossing experiment, however, suggest that only few pollinators carrying fertile pollen crossed the netting. For the biosafety of experimental and commercial releases of GE apple trees, netted orchards are certainly an effective means of reducing pollen flow. However, even if much care is taken that the netting remains intact and tightly closed as in the present study, individual cross-pollination events between trees inside and outside the netted plot cannot be prevented completely. A strategy involving netting plus buffer distances to other apple orchards could further reduce the risk of gene flow. For the field release of GE apple trees, acceptable levels of outcrossing thus need to be defined.

Supplementary Materials

The following supporting information can be downloaded at: https://www.mdpi.com/article/10.3390/agronomy13010084/s1, File S1: Supplementary Tables and Figures, Table S1: Average temperature and total precipitation, Table S2: Yearly abundance of different arthropod taxa, Table S3: Yearly abundance of bee species, Table S4: Bee species collected in pan traps covered with hail net and in open traps, Table S5: Hand-collected bees from inside the netted plot, Figure S1: Aerial photograph of the experimental area, Figure S2: Arthropod numbers per sampling date, Figure S3: Ordination plot with data from each collection date, Figure S4: Net construction and bee nest; File S2: Full dataset.

Author Contributions

Conceptualization: M.M., J.R., A.P. and G.A.L.B.; Funding acquisition and project administration: J.R., A.P. and G.A.L.B.; Methodology, investigation, and validation: M.M., M.W. and J.R.; Formal analysis, data curation, and visualization: M.M. and P.J.; Supervision and writing—original draft preparation: M.M. and J.R.; Writing—review and editing: M.M., P.J., M.W., G.A.L.B., A.P. and J.R. All authors have read and agreed to the published version of the manuscript.

Funding

This project was funded by the Swiss Expert Committee for Biosafety (Grant number: 04.1240.PZ/Q042-1221).

Data Availability Statement

The data presented in this study are available in Supplementary Materials, File S2.

Acknowledgments

We are grateful to Andreas Müller (Natur Umwelt Wissen GmbH) for identifying bees and for valuable information on bee ecology. We further thank the horticulture team, the field management team, and Susanne Brunner for establishing and maintaining the netted plot and the experimental field site. Further thanks go to Julia Nafzger, Samuel Faust and Amanda Schneller for help in trap maintenance. Finally, we acknowledge Matthias Albrecht for fruitful discussions on sampling methodology and bee ecology and for valuable comments on an earlier draft of this manuscript.

Conflicts of Interest

The authors declare no conflict of interest.

References

  1. Vanblaere, T.; Szankowski, I.; Schaart, J.; Schouten, H.; Flachowsky, H.; Broggini, G.A.L.; Gessler, C. The development of a cisgenic apple plant. J. Biotechnol. 2011, 154, 304–311. [Google Scholar] [CrossRef] [PubMed]
  2. Kost, T.D.; Gessler, C.; Jänsch, M.; Flachowsky, H.; Patocchi, A.; Broggini, G.A.L. Development of the first cisgenic apple with 441 increased resistance to fire blight. PLoS ONE 2015, 10, e0143980. [Google Scholar] [CrossRef] [PubMed] [Green Version]
  3. Klein, A.M.; Vaissière, B.E.; Cane, J.H.; Steffan-Dewenter, I.; Cunningham, S.A.; Kremen, C.; Tscharntke, T. Importance of pollinators in changing landscapes for world crops. Proc. Royal Soc. B 2007, 274, 303–313. [Google Scholar] [CrossRef] [PubMed] [Green Version]
  4. Ramírez, F.; Davenport, T.L. Apple pollination: A review. Sci. Hortic. 2013, 162, 188–203. [Google Scholar] [CrossRef]
  5. Pardo, A.; Borges, P.A.V. Worldwide importance of insect pollination in apple orchards: A review. Agric. Ecosyst. Environ. 2020, 293, 106839. [Google Scholar] [CrossRef]
  6. Roquer-Beni, L.; Alins, G.; Arnan, X.; Boreux, V.; García, D.; Hambäck, P.A.; Happe, A.K.; Klein, A.M.; Miñarro, M.; Mody, K.; et al. Management-dependent effects of pollinator functional diversity on apple pollination services: A response–effect trait approach. J. Appl. Ecol. 2021, 58, 2843–2853. [Google Scholar] [CrossRef]
  7. Garratt, M.P.D.; Breeze, T.D.; Boreux, V.; Fountain, M.T.; McKerchar, M.; Webber, S.M.; Coston, D.J.; Jenner, N.; Dean, R.; Westbury, D.B.; et al. Apple pollination: Demand depends on variety and supply depends on pollinator identity. PloS ONE 2016, 11, e0153889. [Google Scholar] [CrossRef] [Green Version]
  8. Greenleaf, S.S.; Williams, N.M.; Winfree, R.; Kremen, C. Bee foraging ranges and their relationship to body size. Oecologia 2007, 153, 589–596. [Google Scholar] [CrossRef]
  9. Zurbuchen, A.; Landert, L.; Klaiber, J.; Müller, A.; Hein, S.; Dorn, S. Maximum foraging ranges in solitary bees: Only few individuals have the capability to cover long foraging distances. Biol. Conserv. 2010, 143, 669–676. [Google Scholar] [CrossRef]
  10. Federal Assembly of the Swiss Confederation. Federal Act of 21 March 2003 on Non-Human Gene Technology (Gene Technology Act, GTA). SR 814.91. 2003. Available online: https://www.fedlex.admin.ch/eli/cc/2003/705/en (accessed on 26 December 2022).
  11. European Parliament. Directive 2001/18/EC of the European Parliament and of the Council of 12 March 2001 on the deliberate release into the environment of genetically modified organisms and repealing Council Directive 90/220/EEC. 2001. Available online: http://data.europa.eu/eli/dir/2001/18/2021-03-27 (accessed on 26 December 2022).
  12. Chouinard, G.; Firlej, A.; Cormier, D. Going beyond sprays and killing agents: Exclusion, sterilization and disruption for insect pest control in pome and stone fruit orchards. Sci. Hortic. 2016, 208, 13–27. [Google Scholar] [CrossRef]
  13. Zwahlen, D.; Kuster, T.; Kuske, S. Insektennetz im Apfelanbau: Kaum Auswirkungen auf Mikroklima und Fruchtqualität. Schweiz. Z. Für Obs.-Und Weinbau 2017, 5, 8–11. [Google Scholar]
  14. Schlathölter, I.; Dalbosco, A.; Meissle, M.; Knauf, A.; Dallemulle, A.; Keller, B.; Romeis, J.; Broggini, G.A.L.; Patocchi, A. Low outcrossing from an apple field trial protected with nets. Agronomy 2021, 11, 1754. [Google Scholar] [CrossRef]
  15. Bosch, J.; Blas, M. Foraging behaviour and pollinating efficiency of Osmia cornuta and Apis mellifera on almond (Hymenoptera, Megachilidae and Apidae). Appl. Entomol. Zool. 1994, 29, 1–9. [Google Scholar] [CrossRef] [Green Version]
  16. Monzón, V.H.; Bosch, J.; Retana, J. Foraging behavior and pollinating effectiveness of Osmia cornuta (Hymenoptera: Megachilidae) and Apis mellifera (Hymenoptera: Apidae) on “Comice” pear. Apidologie 2004, 35, 575–585. [Google Scholar] [CrossRef] [Green Version]
  17. Campbell, J.W.; Hanula, J.L. Efficiency of Malaise traps and colored pan traps for collecting flower-visiting insects from three forested ecosystems. J. Insect Conserv. 2007, 11, 399–408. [Google Scholar] [CrossRef]
  18. Westphal, C.; Bommarco, R.; Carré, G.; Lamborn, E.; Morison, N.; Petanidou, T.; Potts, S.G.; Roberts, S.P.M.; Szentgyörgyi, H.; Tscheulin, T.; et al. Measuring bee diversity in different European habitats and biogeographical regions. Ecol. Monogr. 2008, 78, 653–671. [Google Scholar] [CrossRef] [Green Version]
  19. Klein, A.-M.; Brittain, C.; Hendrix, S.D.; Thorp, R.; Williams, N.; Kremen, C. Wild pollination services to California almond rely on semi-natural habitat. J. Appl. Ecol. 2012, 49, 723–732. [Google Scholar] [CrossRef]
  20. Vrdoljak, S.M.; Samways, M.J. Optimising coloured pan traps to survey flower visiting insects. J Insect Conserv 2012, 16, 345–354. [Google Scholar] [CrossRef]
  21. Schlathölter, I.; Meissle, M.; Boeriis, T.; Heimo, D.; Studer, B.; Broggini, G.A.L.; Romeis, J.; Patocchi, A. No adverse dietary effect of a cisgenic fire blight resistant apple line on the non-target arthropods Drosophila melanogaster and Folsomia candida. Ecotoxicol. Env. Saf. 2022, 241, 113749. [Google Scholar] [CrossRef]
  22. Southwood, T.R.E. Ecological Methods–With Particular Reference to the Study of Insect Populations, ELBS ed.; University Printing House: Cambridge, UK, 1978. [Google Scholar]
  23. R Core Team. R: A Language and Environment for Statistical Computing; R Foundation for Statistical Computing: Vienna, Austria, 2021; Available online: https://www.R-project.org/ (accessed on 26 December 2022).
  24. Candian, V.; Pansa, M.G.; Santoro, K.; Spadaro, D.; Tavella, L.; Tedeschi, R. Photoselective exclusion netting in apple orchards: Effectiveness against pests and impact on beneficial arthropods, fungal diseases and fruit quality. Pest Manag. Sci. 2020, 76, 179–187. [Google Scholar] [CrossRef]
  25. Schluchter, M.; Späth, S.; Buchleither, S. Four-year experiences with exclusion netting row covers in an organic apple orchard: Handling, relevant pests and diseases. In Proceedings of the 20th International Conference on Organic Fruit-Growing, Online, 21–23 February 2022; pp. 94–100. [Google Scholar]
  26. Rigden, P. To Net or Not to Net, 3rd ed. The State of Queensland, Department of Primary Industries and Fisheries. 2008. Available online: https://www.daf.qld.gov.au/__data/assets/pdf_file/0009/72954/Orchard-Netting-Report.pdf (accessed on 26 December 2022).
  27. Mupambi, G.; Anthony, B.M.; Layne, D.R.; Musacchi, S.; Serra, S.; Schmidt, T.; Kalcsits, L.A. The influence of protective netting on tree physiology and fruit quality of apple: A review. Sci. Hortic. 2018, 236, 60–72. [Google Scholar] [CrossRef]
  28. Bogo, A.; Trezzi Casa, R.; Rufato, L.; Gonçalves, M.J. The effect of hail protection nets on Glomerella leaf spot in ‘royal Gala’ apple. Crop Prot. 2012, 31, 40–44. [Google Scholar] [CrossRef]
Figure 1. Arthropods collected in coloured pan traps placed inside and outside the netted plot of apple trees during the flowering period in the years 2016–2019. (A) Relative abundance of different arthropod taxa. The red line indicates equal numbers inside and outside. Absolute numbers are displayed in the bars. The lower panels represent yearly numbers of (B) all arthropods, (C) crane flies (Tipulidae), (D) springtails (Collembola), and (E) spiders (Araneae).
Agronomy 13 00084 g001
Figure 2. Bees (Hymenoptera: Apidae) collected in coloured pan traps placed inside and outside the netted plot of apple trees during the flowering period in the years 2016–2019. (A) Relative abundance of different genera or species. The red line indicates equal numbers inside and outside. Absolute numbers are displayed in the bars. The average thorax width (mm) is given next to species names. The lower panels represent yearly numbers of (B) all bees, (C) Andrena spp., (D) Colletes cunicularius, and (E) Lasioglossum spp.
Agronomy 13 00084 g002
Figure 3. Histogram of the thorax width distribution of bees collected in coloured pan traps placed inside (grey) and outside (white) the netted plot of apple trees during the flowering period in the years 2016–2019. Size classes represent the upper boundary of each class.
Agronomy 13 00084 g003
Figure 4. Ordination plot with non-metric multidimensional scaling (NMDS) of bees collected in coloured pan traps placed inside (circles) and outside (triangles) the netted plot of apple trees during the flowering period in the years 2016–2019 (different colours). Each data point represents the seasonal sum of one trapping station. Species with less than 5 collected individuals over all years and traps were not considered. For abbreviations of species names see Supplementary Materials, Table S3. The centroids of each year and the plot type (in/out) are indicated in boxes.
Agronomy 13 00084 g004
Figure 5. Abundance of different bee genera or species collected from 18 March to 5 April 2019 in coloured pan traps placed inside and outside a netted plot of apple trees before the hail net was closed (approximately 2 weeks before apple flowering started).
Agronomy 13 00084 g005
Figure 6. Flower visitation observations inside and outside the netted plot of apple trees during the flowering period in the years 2016–2019. (A) relative numbers of observed apple flowers visited by apple pollinators, (B) numbers of other arthropods observed in or on flowers, (C) numbers of trees infested with ants (Formicidae), pollen beetles (Nitidulidae), or aphids (Aphididae), and (D) estimated total numbers of open flowers on the observed trees. The red line indicates equal numbers inside and outside. Absolute numbers are displayed in the bars.
Agronomy 13 00084 g006
Table 1. Dates when hail nets were closed, traps were filled for the first time (start trapping), start and end of apple flowering, and last collection of sampled material. The number of sample collections (how often the traps were emptied), and the trapping days per year are also given.
YearDate Nets
Closed
Start
Trapping
Start
Flowering
End
Flowering
Last
Collection
No. Sample CollectionsTrap Days
201622 April9 May1 June13 June24 June1346
20174 April4 April7 April16 May15 May1241
201823 March6 April21 April8 May7 May931
2019 15 April5 April20 April17 May22 May1347
1 Additional trapping before hail netting was closed: start 18 March, last collection 5 April, 5 sample collections, 18 trap days.
Table 2. Species numbers, Sørensen index, Shannon index, and Evenness of bee communities collected in coloured pan traps placed inside and outside the netted plot of apple trees during the flowering period in the years 2016–2019.
Plot2016201720182019All Years
Species numberOutside2730242746
Inside816152230
Common species 613101724
Sørensen index (SI) 0.340.570.510.690.63
Shannon index (H’)Outside2.272.671.432.132.44
Inside1.652.221.611.641.94
HmaxOutside3.303.403.183.303.83
Inside2.082.772.713.093.40
Evenness (E)Outside0.690.790.450.650.64
Inside0.790.800.600.530.57
Disclaimer/Publisher’s Note: The statements, opinions and data contained in all publications are solely those of the individual author(s) and contributor(s) and not of MDPI and/or the editor(s). MDPI and/or the editor(s) disclaim responsibility for any injury to people or property resulting from any ideas, methods, instructions or products referred to in the content.

