Article

Genetic Diversity and Population Structure in Bread Wheat Germplasm from Türkiye Using iPBS-Retrotransposons-Based Markers

1
Department of Field Crops, Faculty of Agriculture, Ataturk University, 25240 Erzurum, Turkey
2
Department of Field Crops, Faculty of Agriculture, Necmettin Erbakan University, 42310 Konya, Turkey
3
Department of Biosystems Engineering, Faculty of Environmental and Mechanical Engineering, Poznań University of Life Sciences, Wojska Polskiego 50, 60-627 Poznań, Poland
4
Field and Horticultural Crops Research Department, Kurdistan Agricultural and Natural Resources Research and Education Center, Agricultural Research, Education and Extension Organization (AREEO), Sanandaj 6616936311, Iran
5
Department of Geoecology and Geoinformation, Institute of Biology and Earth Sciences, Pomeranian University in Słupsk, Partyzantów 27, 76-200 Słupsk, Poland
*
Authors to whom correspondence should be addressed.
Agronomy 2023, 13(1), 255; https://doi.org/10.3390/agronomy13010255
Submission received: 10 December 2022 / Revised: 11 January 2023 / Accepted: 12 January 2023 / Published: 14 January 2023

Abstract

:
This study investigated the genetic diversity and population structure of 63 genotypes from Turkish bread wheat germplasm using iPBS-retrotransposons primers. The thirty-four iPBS primers produced a total of 1231 polymorphic bands, ranging from 8 (iPBS-2375) to 60 (iPBS-2381) alleles per marker, with an average number of 36.00 alleles. The polymorphism information content (PIC) per marker varied between 0.048 (iPBS 2087) and 0.303 (iPBS 2382), with an average of 0.175. The numbers of effective alleles (ne), genetic diversity of Nei (h), and Shannon’s information index (I) value were calculated as 1.157, 0.95, and 0.144, respectively. The greatest genetic distance (0.164) was between Eastern Anatolia Agricultural Research Institute genotypes and Çukurova Agricultural Research Institute genotypes. The unweighted pair-group method with arithmetic mean (UPGMA) dendrogram placed the 63 wheat genotypes into three clusters. The percentage of genetic diversity explained by each of the three main coordinates of the basic coordinate analysis was determined to be 44.58, 12.08, and 3.44, respectively. AMOVA (Analysis of Molecular Variance) showed that the variation within populations was 99% and that between populations was 1%. The result of genetic structure analysis suggests that the greatest value of K was calculated as 3. The F-statistic (Fst) value was determined as 0.4005, 0.2374, and 0.3773 in the first to third subpopulations, respectively. Likewise, the expected heterozygosity values (He) were determined as 0.2203, 0.2599, and 0.2155 in the first, second, and third subpopulations, respectively. According to the information obtained in the study, the most genetically distant genotypes were the G1 (Aksel 2000) and G63 (Karasu 90) genotypes. This study provided a deep insight into genetic variations in Turkish bread wheat germplasm using the iPBS-retrotransposons marker system.

1. Introduction

Wheat (Triticum aestivum L.) is hexaploid (2 n = 6 x = 42) (Bhatta, 2017) and one of the most important foods in human nutrition all over the World [1]. It is also the staple diet for the majority of the global population, containing carbohydrates, protein, minerals, B-group vitamins, dietary fiber, etc. [2]. Wheat can be grown in different climatic zones ranging from the Caspian Sea to China [3]. The presumed center of wheat origin and diversity is situated in the Fertile Crescent [4], which includes part of present-day Turkey [5]. Thus, the diversity of wheat in Turkey has a global role in providing important genetic resources for wheat improvement. In recent years, there has been a rapid increase in the number of varieties released in Turkey, and there are now 201 officially listed bread wheat varieties [6]. Turkey, particularly Southeast Anatolia, is known as the primary gene center of wheat diversification as well as the area of first wheat domestication around 10,000 BP [7,8,9,10,11]. Turkish wheat variations have received a great deal of attention since the beginning of the 20th century. Exploration and collection missions were mounted, and the collected germplasm was evaluated in different countries [8,12,13].
World annual wheat production was realized at 777 million tons in 2021, but world wheat demand is expected to be 1 billion tons by the year 2024 [14]. Wheat annual average production has entered a period of stagnation and declining in recent years due to biotic and abiotic stressors posing serious threats on wheat cultivation [15]. In order to use gene resources effectively in wheat breeding to produce tolerant genotypes, it is important to know the characteristics of existing gene resources and to carry out targeted breeding studies. Germplasm characterization is considered a prerequisite for breeding activities as it facilitates the introduction of novel genetic variations to the breeders that can be used for marker-assisted breeding [16].
Conventional breeding methods are largely employed to improve plant resistance against these stress factors. The process of cultivating plants has resulted in a narrowing of the genetic base in several crop types, including wheat [17]. Such a narrow genetic base poses a serious threat to sustainable production, which is very important for the rapidly increasing global population and the changing climate conditions due to global warming in recent years [18].
Genetic diversity is the basis for the long-lasting success of breeding programs, and modeling genetic diversity with various methods can reveal possible adaptations to different regions. The study of genetic variation also allows the identification of genetic characters associated with important breeding targets [19]. Different genetic materials are used in wheat breeding programs; they are used to expand the existing genetic basis [20]. Evaluation of variation in germplasm is an important step in breeding programs because it can help select varieties and lines with higher diversity and better performance under certain conditions [21,22]. Molecular markers are widely used to reveal wheat genetic diversity [18,20]. Molecular markers have become important tools for breeding studies and allow breeding studies to be concluded in a shorter time. Molecular markers are independent of environmental conditions, providing a direct estimation of genetic variation at the DNA level. Thanks to scientific studies, molecular markers with different properties have been developed over time [23,24]. Various methods have used molecular markers, including amplified fragment length polymorphisms (AFLPs) [25], random amplified polymorphic DNA (RAPD) [26], start codon targeted markers (SCoT) [27], single nucleotide polymorphism (SNP) [28], inter simple-sequence repeat (ISSR) [29], simple-sequence repeats (SSR) [30], expressed sequence tag (EST) [31], next generation sequencing (NGS) [20], diversity Arrays Technology (DArT) [32] and single nucleotide polymorphism (SNP) [33], all to assess the genetic diversity and associations among several Triticum species.
Retrotransposons (RTNs) are an important source of plant genetic variation, and in many plants with large genomes, over 50% of the nuclear DNA is made by retrotransposons [34]. The inter-primer binding site (iPBS) method has been verified to be an influential DNA fingerprinting technique with no need for previous knowledge of a sequence. iPBS-retrotransposons are the only retrotransposon-based marker system that has allowed polymorphism visualization throughout the plant kingdom. iPBS-retrotransposon DNA markers have been successfuly utilized in assessing genetic diversity [35]. The iPBS-retrotransposon marker has been demonstrated by many studies, and there are studies on genetic diversity for these markers [16,24]. Previously, different molecular markers have been used for the molecular characterization of wheat germplasm [16]. However, there are limited studies on the characterization of wheat populations using iPBS-retrotransposons. Therefore, the present study aimed to genetically characterize and determine the population structure of the Turkish bread wheat genotypes for the evaluation of genetic diversity. In order for breeding studies to be sustainable, it is necessary to identify, define, and use genetic resources. We believe that the findings from the study will help with the use, development, and conservation of local varieties that can adapt to changing environmental conditions.

2. Materials and Methods

2.1. Plant Materials

A total of 63 bread wheat genotypes, which were also evaluated based on early and late drought resistance under dry conditions and whose brief characteristics are presented in Table 1, were used as plant material in the study [36,37,38] and are available in the National Gene Bank of Turkey. Forty-three of these genotypes are included in the national cultivar list of 2007 and recommended for dry agricultural areas of Türkiye but Bezostaja 1 and Karasu 90 are recommended for irrigated agricultural areas. Twenty of them consist of registered or local varieties that have been grown or are still being grown under dry farming conditions. The plants were grown for tissue sampling in the greenhouse of Atatürk University, Department of Field Crops, Faculty of Agriculture.

2.2. DNA Isolation and Quantification

Young leaves of wheat (Triticum aestivum L.) with approximately 14-day-old plants were ground in liquid nitrogen at the molecular biology and genetics laboratory of Ataturk University. The collective DNA of 63 individuals per participation was then prepared using the DNA extraction method described in [39].
The quality of the DNA was determined by electrophoresis using agarose gel at 1% concentration. A NanoDrop ND-1000 UV/Vi’s spectrophotometer device (Thermo Fisher Scientific Company, Waltham, MA, USA) was used to determine the DNA concentrations.

2.3. PCR and iPBS Marker Analyses

Genetic diversity analyses were performed with iPBS primers available from Sigma Aldrich (Castle Hill, NSW, Australia). In the present study, 34 iPBS primers developed by Kalendar et al. [40] were used (Table 2). PCR Amplification was performed in a thermos cycler (SensoQuest Labcycler) and was conducted in a 10 µL reaction mixture comprising 25 ng template DNA, 0.5 U Taq polymerase, 0.25 mM dNTP, 1 µM (20 pmol) primer, 1X buffer, and 2 mM MgCl2. The PCR thermal cycling profile was as follows: initial denaturation for 3 min at 95 °C; 38 cycles of 95 °C for 60 s, 50–60 °C for 60 s, 72 °C for 120 s; and a final extension at 72 °C for 10 min [41]. All PCR amplification products were resolved in agarose gel at 1.5% concentration at 100 V for 105 min. Finally, gels were visualized under UV light and photographed by digital camera (Model Nikon Coolpix500) [42].

2.4. Data Scoring and Analysis

The DNA bands were scored using TotalLab TL120 software (TotalLab Ltd., Gosforth, Newcastle upon Tyne, UK). For the iPBS amplification products, a band is scored “1” or absent “0” for each locus. Only clear, strong bands were scored, while faint, weak bands were ignored. The Numerical Taxonomy and Multivariate Analysis System for personal computer (NTSYSpc) v2.0 programs based on the Dice similarity matrix [43] were used to determine the genetic similarities between the varieties. A UPGMA (unweighted pair group method with arithmetic mean) dendrogram was created with the NTSYSpc V.2.0 program. In addition, molecular variance (AMOVA) and PCoA (Principal Coordinate Analysis) analyses were performed using the Genalex 6.5 program [44]. PIC (Polymorphism Information Content value) was used to assess the diversity of each iPBS marker [45]. The POPGEN v.1.32 program was used to determine the effective number of alleles (ne), Nei genetic diversity (h), and Shannon’s information index (I) [46]. The Structure v.2.3.4 program was used to determine the genetic structures of the varieties [47]. Evanno’s ∆K [48] and Structure Harvester [49] methods were used to estimate the most expected K value. The favorable numbers of clusters (K subpopulations) were estimated (1–10) by repeating the analysis three times, according to the report of Evanno et al. [48] Using this method, Markov chain Monte Carlo (MCMC) posterior probabilities were estimated. The MCMC chains were run with a 10,000-iteration burn-in period, followed by 100,000 iterations using a model allowing for admixture and correlated allele frequencies.

3. Results

3.1. Polymorphism Revealed by iPBS Primers

Sufficiently clear and scoreable bands were obtained from all primers included in the study. With these 34 primers, 1231 visible and scoreable bands were generated. The number of alleles in the primers varied between 8 (iPBS 2375) and 60 (iPBS 2381) (mean 36). When the analysis was performed with the iPBS markers, the PIC varied between 0.048 (iPBS 2087) and 0.303 (iPBS 2382) (mean 0.175). Major allele frequency ranged from 0.032 (iPBS-2228) to 0.888 (iPBS-2087). The mean major allele frequency was 0.193 (Table 3).

3.2. Genetic Diversity

The number of effective alleles (ne), genetic diversity of Nei (h), and Shannon’s information index (I) value of the wheat varieties are presented in Table 4. The greatest ne (1.323), h (0.266), and I (0.182) values were observed in the iPBS-2383 primer. The lowest ne (1.060), h (0.06), and I (0.038) values were observed in the iPBS-2087 primer. The mean ne, h, and I value were calculated as 1.157, 0.95, and 0.144, respectively.

3.3. Cluster Analysis, Principal Coordinate Analysis (PCoA) and Genetic Distance for iPBS-Retrotransposon Markers

The unweighted pair-group method with arithmetic mean (UPGMA) dendrogram placed the 63 wheat genotypes into three clusters. Clusters I, II, and III included 14 (22.25%), 14 (22.25%), and 35 (55.5%) genotypes, respectively. (Figure 1). Cluster I contained 14 wheat genotypes, including G50, G51, G52, G53, G55, G54, G56, G57, G58, G59, G60, G61, G62, and G63. Cluster II contained 14 wheat genotypes, including G36, G37, G38, G39, G40, G41, G43, G44, G42, G45, G46, G47, G48, and G49. In addition, Cluster III contained 35 wheat genotypes, including G1, G2, G3, G4, G5, G6, G7, G26, G8, G9, G11, G12, G14, G13, G15, G17, G20, G21, G26, G19, G18, G27, G29, G30, G31, G33, G34, G32, G28, G35, G25, G22, G24, G23, and G10.
Principal coordinate analysis (PCoA) revealed the relative h values between the varieties, revealing three distinct groups. The result showed that the grouping pattern of the PCoA analysis corresponded with cluster analysis (Figure 2). The percentage of genetic diversity explained by each of the three main coordinates of the basic coordinate analysis was determined as 44.58, 12.08, and 3.44, respectively, and these first three components explained 60.10% of the variation (Table 5). AMOVA (Analysis of Molecular Variance) was used to detect the total variation and showed that the variation within populations was 99% and that between populations was 1% (Table 6).

3.4. Population Genetic Structure Analysis for iPBS Markers

To understand the population structure among the 63 wheat varieties, we divided each entry into corresponding subgroups using the model-based approach in the STRUCTURE software. The ∆K value is used to calculate the optimal K value. An iPBS-retrotransposon was used for the STRUCTURE analysis, where the number of groups (K) varied from 1 to 10. The estimated ∆K value was 927.4 for the 63 wheat genotypes, which represented the three subpopulations (Figure 3). The result of genetic structure analysis suggests that the greatest value of K was calculated as 3 (Group A [red], Group B [green], and Group C [blue]) (membership probability <0.8) (Figure 4). At K = 3, group A included 15 wheat genotypes: G57, G53, G55, G54, G58, G51, G52, G48, G56, G45, G59, G46, G43, G49, and G60. Group B contained 13 wheat genotypes, including G4, G5, G8, G9, G7, G2, G6, G11, G14, G3, G12, G13, and G10. Group C included 11 genotypes, counting G33, G31, G30, G34, G32, G27, G35, G29, G28, G23, and G25. Furthermore, G50, G44, G47, G61, G63, G62, G42, G41, G15, G17, G20, G1, G24, G22, G26, G39, G36, G19, G21, G40, G18, G38, G16, and G37 were placed in mixed groups (38.09%; membership probability <0.8). The F-statistic (Fst) value was determined as 0.4005, 0.2374, and 0.3773 in the first to third subpopulations, respectively. Likewise, the expected heterozygosity values (He) were determined as 0.2203, 0.2599, and 0.2155 in the first to third subpopulations, respectively (Table 7 and Table 8).

4. Discussion

The determination of genetic variation and population structure in plants is important for the future and progress of plant breeding programs [50]. A rational study has been documented for the characterization of the bread wheat genotype and its wild relatives using several types of molecular markers [51]. Molecular markers such as iPBS play a critical role in the selection of targeted parents, independent of external ecological factors, to reveal the genetic relationships among plant species. Along with the role of retrotransposons in the diversification of genetic material, it is stated that retrotransposon activation is one of the key factors involved in host adaptation to ecological differences [52]. The iPBS markers used in our study helped identify wheat (Triticum aestivum L.) accessions at the molecular level. The obtained data provided important information about the genetic relationships among wheat accessions. The information obtained by the iPBS marker system indicates that it can be usefully used for diversity studies and genetic analysis of wheat accessions. Similarly, Nadeem [16] used the iPBS marker system for the molecular characterization of bread wheat landraces and cultivars. In addition, Demirel, [53] used iPBS-retrotransposon markers for the molecular characterization of emmer and durum wheat.
Total and polymorphic bands reported in this study were higher than Nadeem [16] and Demirel [53] using iPBS markers, as well as Kumar et al. [54] using ISSR markers, Alshehri et al. [55] using SCoT and ISSR primers, and Çifçi and Yağdi [56] using RAPD markers. The PIC value is an important piece of information in scoring the efficacy of polymorphic loci and demonstrating the discriminative power of a primer [57]. In our study, the PIC varied between 0.048 (iPBS-2087) and 0.279 (iPBS 2380 and iPBS 2381) (mean 0.175). In a similar study of wheat in which iPBS markers were used, PIC values were reported between 0.12 and 0.25 (mean 0.19) [53]. The results differ from those of [58], who found PIC values between 0.306 and 0.913 (mean 0.660) in their study with iPBS-retrotransposons in wheat. In addition, PIC values ranged from 0.702 to 0.11, and the mean PIC value was 0.42 via Nadeem [16], who used the iPBS marker for the molecular characterization of 74 bread wheat accessions, including a total of 54 landraces and 20 commercial cultivars. This suggests that the difference in results between studies is probably due to the different genotypes and the use of fewer markers by other researchers.
The mean number of effective alleles (ne), genetic diversity of Nei (h), and Shannon’s information index (I) value of the wheat varieties were calculated as 1.157, 0.95, and 0.144, respectively. In a similar study conducted in wheat, the mean ne, h, and I values were 1.950, 0.489, and 0.502, respectively [58]. These values were higher than in our study. A higher number of effective alleles is an indication of higher genetic variation and is therefore always desirable. In a study conducted by Kumar et al. [54] and Nadeem [16], higher gene diversity was observed for the primers producing higher alleles. In addition, Shannon’s information index is one of the important criteria that distinguishes genetic variation within a population and makes variation more meaningful. Shannon’s mean information index observed in the present report was lower than Nadeem’s [16] and Demirel’s [53]. The presence of lower values for various diversity indices in this study might be due to differences in germplasm. The Nei’s genetic distance revealed G1 (Aksel 200) and G63 (Karasu 90) as genetically distinct accessions. Therefore, Aksel and Karasu accessions can be used for future bread wheat breeding. Arystanbekkyzy et al. [58] stated that genetically distinct accessions can be helpful to start breeding activities for favorable traits.
The UPGMA dendrogram placed the 63 wheat genotypes into three clusters. Clusters I, II, and III included 14 (22.25%), 14 (22.25%), and 35 (55.5%) genotypes, respectively. The UPGMA analysis showed admixture of accessions because accessions from various provinces were grouped under the same sub-groups. This result was similar to Nadeem [16]. Uncovering genetic variations occurring between populations of plant species and the information obtained are valuable for breeding and conservation of genetic resources [59]. The population structure within each wheat genotype or cultivar can be used to make crossbreeding studies more efficient. There was concordance between the population structure identified in this study and distance-based clustering from principal coordinate analysis (PCoA). In our study, it can be thought that intraspecies crossings may produce stronger hybrids due to greater genetic distances. During this study, winter and alternative bread wheat genotypes were used as plant material. Therefore, calculated diversity indices among genotypes showed the presence of fewer genetic variations. Our result is in contrast with Nadeem [16] and Demirel [53]. This can be due to the use of different genetic materials. In addition, Keser et al. [6] evaluated 22 registered winter bread wheat varieties developed for rainfed conditions under dryland conditions and presented the pedigree information of the varieties, of which 17 genotypes were common with our study. Based on pedigree information of varieties, cv. Sonmez-2001 was originated from cv. Bezostaya-1. In our study, cv Sonmez-2001 fell into a different PCoA group than cv. Bezostaya-1. There could be two explanations for this phenomenon. One could be due to the limitations of iPBS markers. There could be similar mobility or a similar pattern of retrotransposon elements in these cultivars. Therefore, iPBS markers could not sufficiently differentiate between these two genotypes or identify genetic differences as these genotypes are in the genic region of the genome. A second explanation would be that iPBS markers work well. These two genotypes could be different genotypically. As it was seen in the pedigree of cv. Sonmez-2001, we see the contribution of other four genotypes (Tevere/3/Kremena/Lovrin-29/4/Katya-1) into the Sonmez-2001 genotypic background. Indeed, cv Sonmez-2001 has been genetically separated from Bezostaya in every generation.
During this study, bread wheat cultivars were used as plant material. Therefore, calculated diversity indices among cultivars showed the presence of higher genetic variations among cultivars. PCoA analysis was also performed to reveal genetic relationships among wheat inclusions, and in the first three axes, PCoA analysis explained 60.10% of the total variation. As a result of the PCoA analysis, it is stated that the data obtained from this matrix is generally safe if the axes explain 25% or more of the total variation [60]. The PCoA analysis supported the clustering of the model-based structure algorithm and separated the Turkish bread wheat germplasm into three populations.
The AMOVA results revealed that the maximum genetic variations in Turkish bread wheat germplasm are present within the population. The result from the molecular analysis of variance (99%) revealed high variation among wheat accessions. Many factors, such as pollination patterns of species, selection, gene flow between locations, and variation in genotypes, affect the variation [41]. Thus, it is stated that Turkish bread wheat germplasm has a great level of genetic variation within the population that can be helpful for the breeding of this crop in the future. The findings revealed that wheat genotypes were divided into three groups according to genetic structure analysis. The results of the AMOVA were supported by previous studies as they also revealed higher genetic variations within populations [16,61].
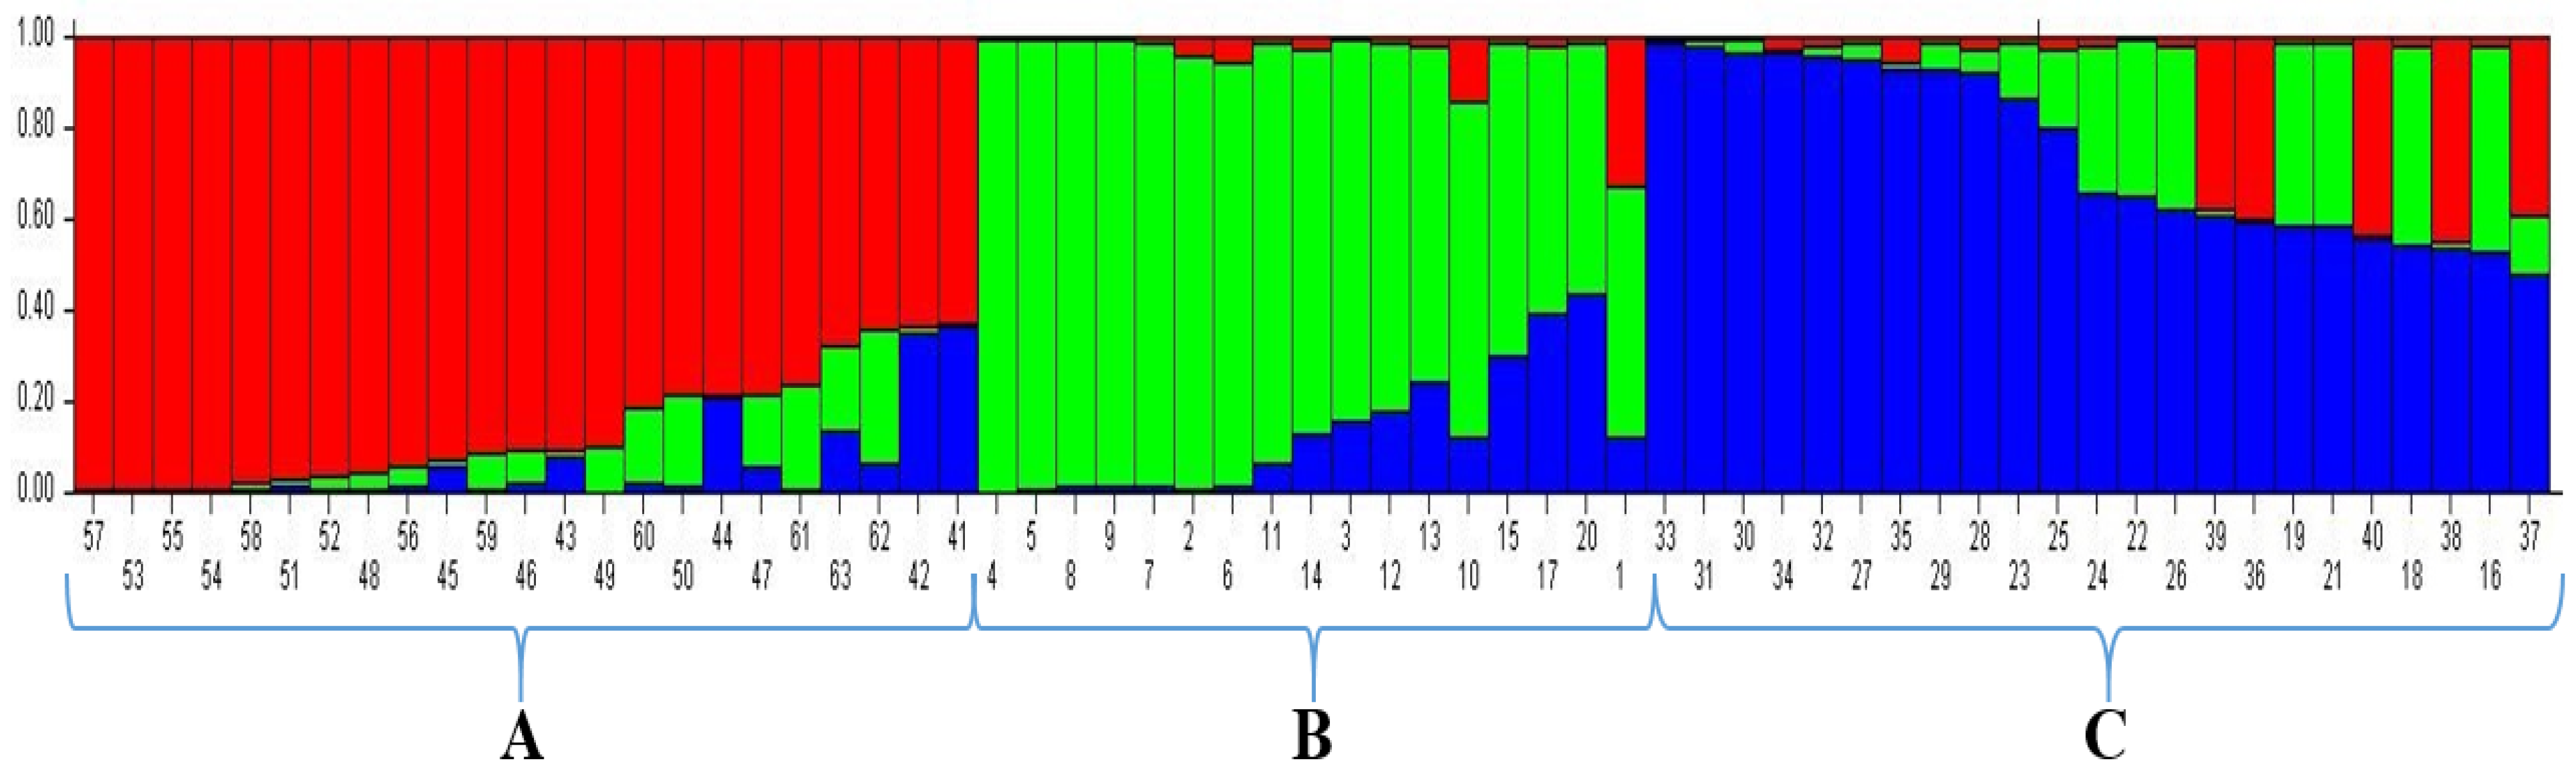
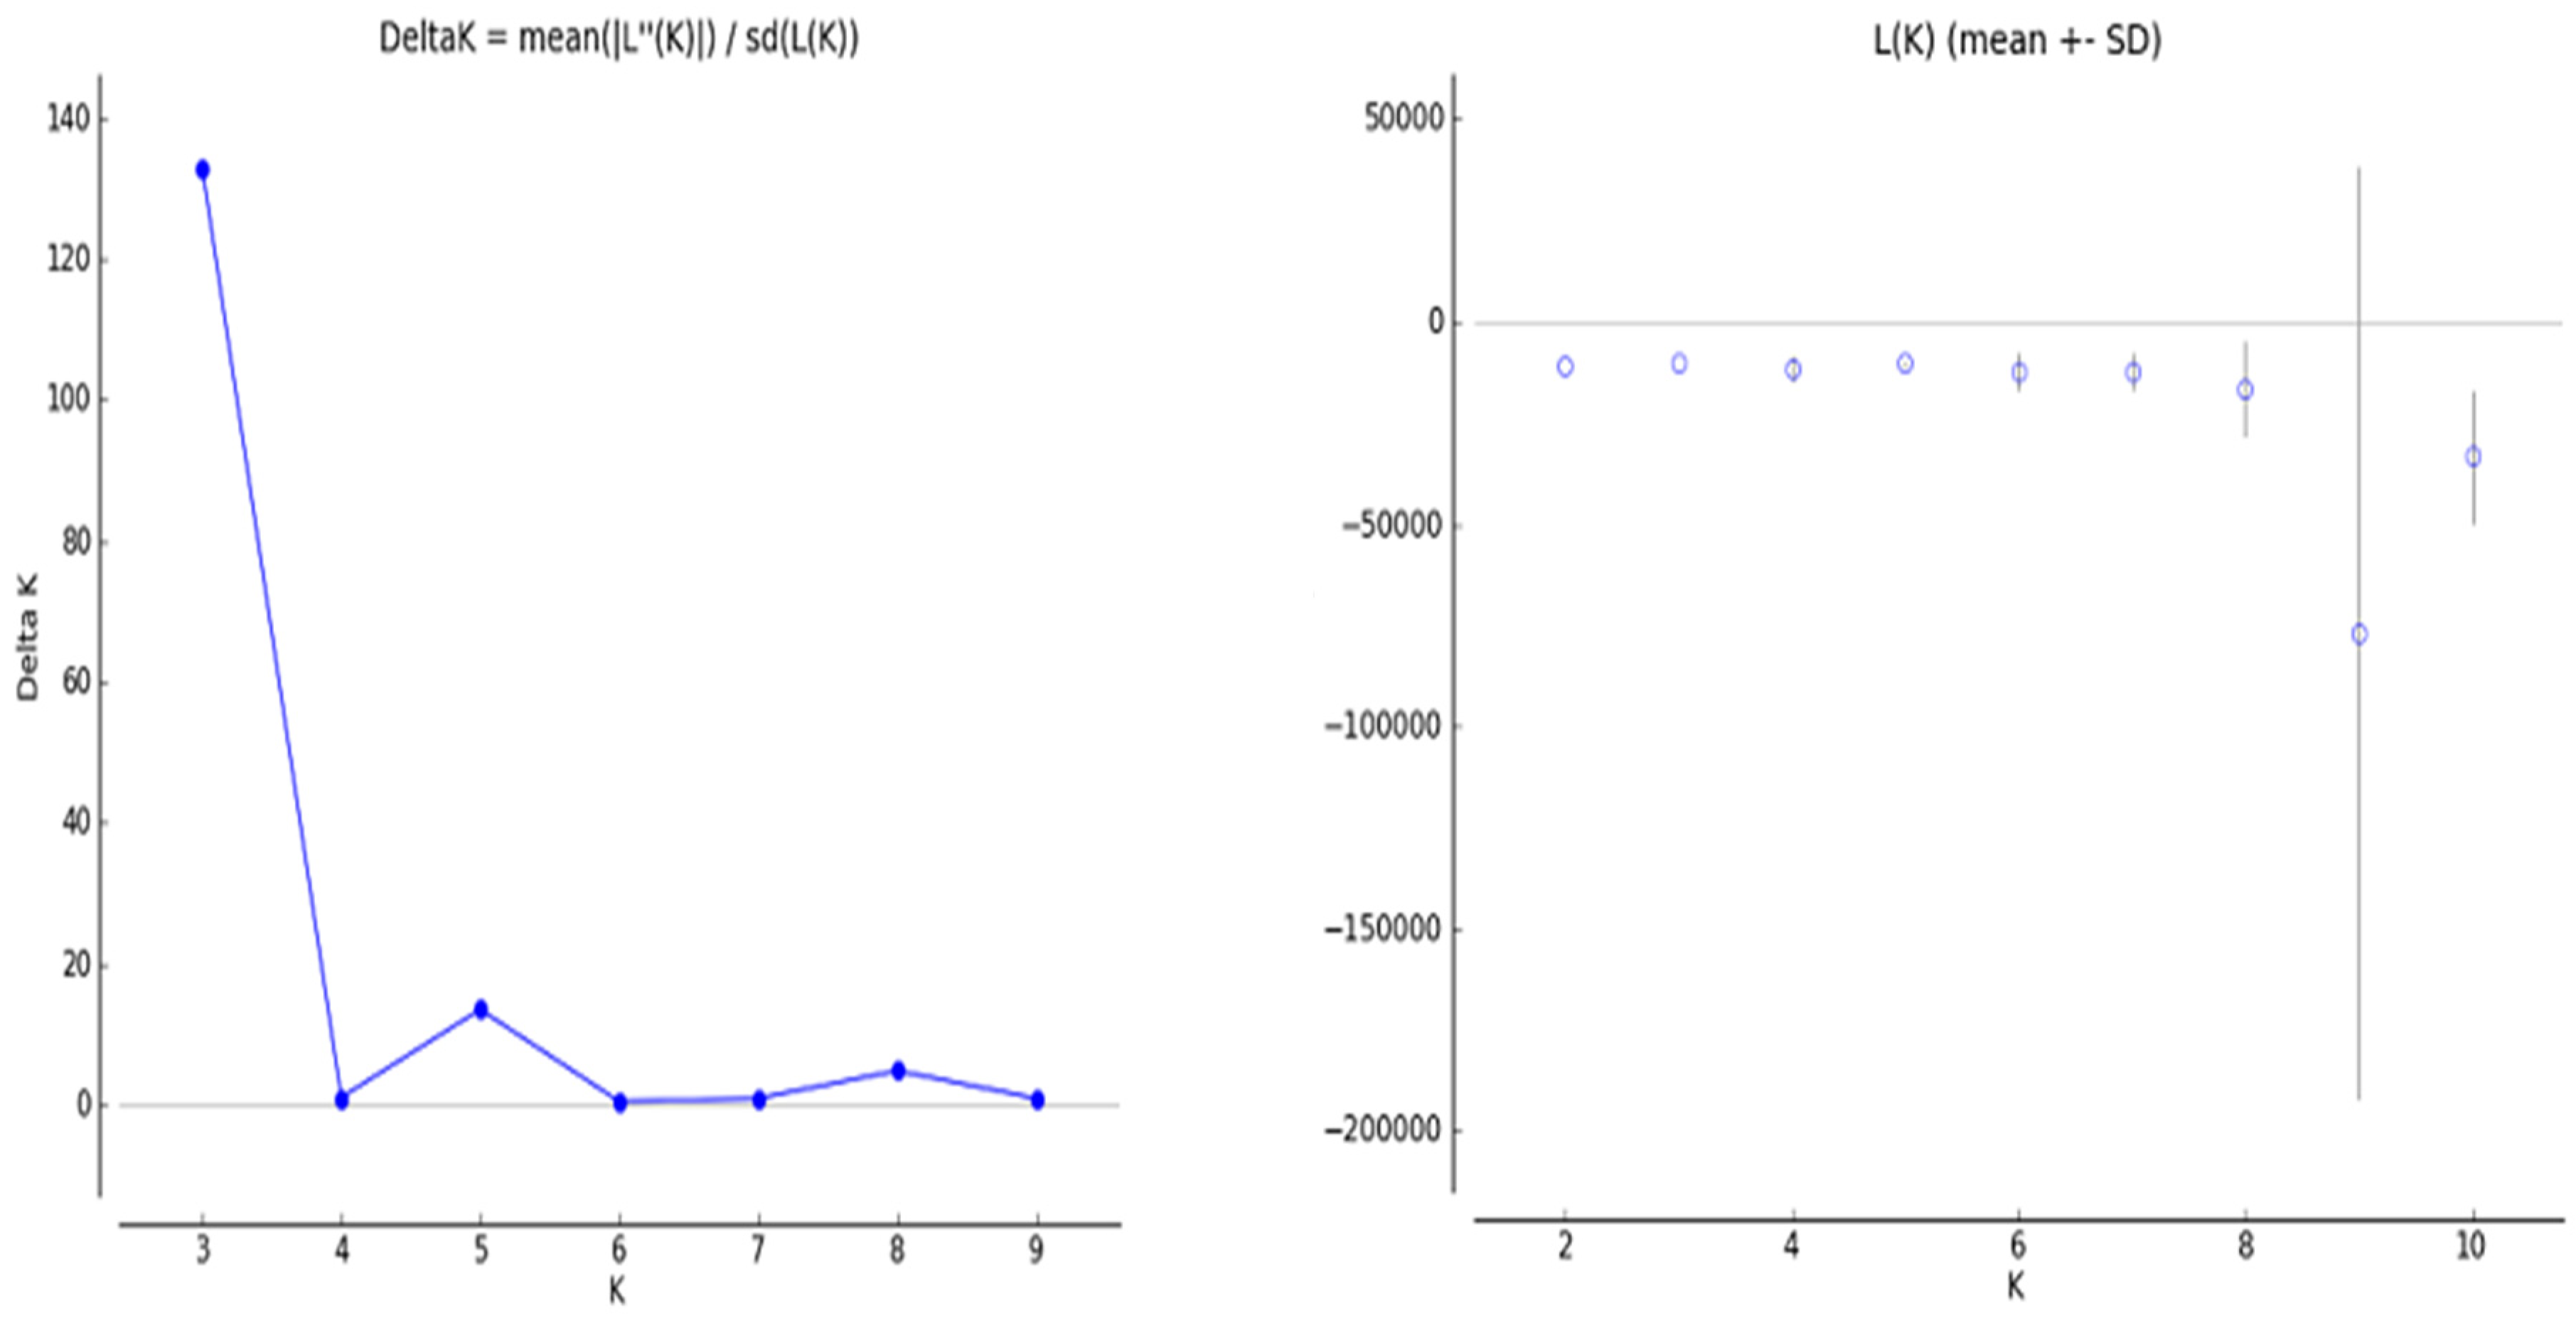
The structure algorithm has been proven more trustworthy and informative compared to other clustering algorithms [62]. Recently, it has become important to understand population structure, which allows for the selection of various parents for use in breeding programs and the mapping of marker-trait relationships. Analysis of population structure is an important tool for estimating the levels of similarity between individuals and subpopulations, or, in other words, for understanding population structure. The model-based structure algorithm grouped 63 bread wheat accessions into three populations on the basis of their collection points. Population A was found to be larger than population B and C by accounting for 23.80% (15 genotypes) of its accessions. Population B accounted for a total of 13 accessions (20.63%), and population C was found to be the lowest. The other two populations accounted for a total of 11 accessions (17.46%), as well as mixed groups with 38.09% and a total of 24 accessions (membership probability <0.8). Cömertpay et al. [35] showed that in the STRUCTURE analysis, the number of groups (K) varied from 1 to 10. The estimated ∆K value was 302.29 for the 81 rice accessions, which represented the three subpopulations. The population structure analysis revealed that all of the varieties used in this study were derived from three subpopulations, or three gene pools. Throughout the evolutionary process, varieties accumulate several living mutations that form the basis of genetic diversity. Moreover, forces such as recombination, random drift, and natural selection shape the genetic makeup of populations. The results show that mixed groups have the highest amount, an indication that genotypes have crossing with each other over the years and how narrow range of the genetic pool.

5. Conclusions

Determining and revealing genetic diversity for plant breeding is extremely important, and there are many tools and methods to reveal this diversity. However, it is very important information to reveal the genetic distance of genotypes or accessions that have not been adequately defined or are not yet known in plant breeding programs. Although classical breeding studies have been successfully applied to many plant species and cultivars, molecular markers provide invaluable information for shortening the breeding period and for more reliable cultivar development studies. In addition, the determination of genetic distance between cultivars by molecular markers makes an important contribution to the creation of new populations and the emergence of heterosis and high-yielding cultivars. Evaluation of genetic variation among wheat genotypes is important for breeding programs and the sustainability of genetic diversity, as well as for the conservation and breeding of existing genetic material. Genetic diversity studies with the use of molecular markers provide essential and critical information about population structure. Molecular markers with high informative power, such as iPBS, have been preferred in the research of wheat population structure and genetic diversity in recent years, and their strength cannot be ignored. In conclusion, in this study, we tried to generate pre-breeding data for the selection of suitable parents that can be used in breeding studies via the iPBS-retrotransposon marker system. According to the obtained data, we demonstrated that the iPBS marker system is a method that provides easy and important information to determine the variation between wheat accessions. Population A from structure clustering was found to be more diverse, and accessions belonging to this population should be considered for future wheat breeding. According to the information obtained in the study, the most genetically distant genotypes were G1 (Aksel 2000) and G63 (Karasu 90) accessions, which can be used for future bread wheat breeding. It is thought that in future breeding programs, the agronomic and morphological characteristics of these genotypes can be evaluated according to their responses to stress factors. The data obtained reveals the diversity in wheat genotypes/varieties collected from different regions of Turkey and will provide integrity in wheat identification studies while forming the basis for wheat breeding/crossbreeding programs to be implemented in the coming years.

Author Contributions

Conceptualization, K.H., A.Ö. and A.T.; methodology, K.H., A.T., G.N., M.N., T.W., and M.P.; software, K.H. and A.T.; validation, G.N., M.N., T.W., and M.P.; formal analysis, K.H., G.N., M.N., T.W., and M.P.; investigation, K.H. and A.T.; resources, K.H., A.Ö., A.T., and M.N.; data curation, K.H. and A.T.; writing—original draft preparation, K.H., A.T., G.N., M.N., T.W., and M.P.; writing—review and editing, K.H., A.T., G.N., M.N., T.W., and M.P.; visualization, K.H. and A.T.; supervision, K.H. and G.N.; project administration, A.T. and M.N. All authors have read and agreed to the published version of the manuscript.

Funding

This research received no external funding.

Institutional Review Board Statement

Not applicable.

Informed Consent Statement

All data needed to conduct this study is provided within the manuscript.

Data Availability Statement

Not applicable.

Conflicts of Interest

The authors declare no conflict of interest.

References

  1. Kumar, A.; Sengar, R.; Rao, V.P.; Shukla, G.; Dixit, R.; Singh, R. Assessment of genetic diversity in bread wheat (Triticum aestivum L.) using RAPD markers. J. Appl. Nat. Sci. 2017, 9, 1751–1755. [Google Scholar] [CrossRef] [Green Version]
  2. Adhikari, B.M.; Bajracharya, A.; Shrestha, A.K. Comparison of nutritional properties of Stinging nettle (Urtica dioica) flour with wheat and barley flours. Food Sci. Nutr. 2016, 4, 119–124. [Google Scholar] [CrossRef] [PubMed]
  3. Novoselović, D.; Bentley, A.R.; Šimek, R.; Dvojković, K.; Sorrells, M.E.; Gosman, N.; Horsnell, R.; Drezner, G.; Šatović, Z. Characterizing Croatian wheat germplasm diversity and structure in a European context by DArT markers. Front. Plant Sci. 2016, 7, 184. [Google Scholar] [CrossRef] [Green Version]
  4. Feldman, M.; Millet, E. The contribution of the discovery of wild emmer to an understanding of wheat evolution and domestication and to wheat improvement. Isr. J. Plant Sci. 2001, 49 (Suppl. 1), 25–36. [Google Scholar] [CrossRef]
  5. Morgounov, A.; Keser, M.; Kan, M.; Küçükçongar, M.; Özdemir, F.; Gummadov, N.; Muminjanov, H.; Zuev, E.; Qualset, C. Wheat landraces currently grown in Turkey: Distribution, diversity, and use. Crop Sci. 2016, 56, 3112–3124. [Google Scholar] [CrossRef] [Green Version]
  6. Keser, M.; Gummadov, N.; Akin, B.; Belen, S.; Mert, Z.; Taner, S.; Topal, A.; Yazar, S.; Morgounov, A.; Sharma, R.C. Genetic gains in wheat in Turkey: Winter wheat for dryland conditions. Crop J. 2017, 5, 533–540. [Google Scholar] [CrossRef]
  7. Diamond, J. Location, location, location: The first farmers. Science 1997, 278, 1243–1244. [Google Scholar] [CrossRef]
  8. Harlan, J.R. Collection of crop plants in Turkey, 1948. J. Agron. 1950, 42, 258–259. [Google Scholar] [CrossRef]
  9. Heun, M.; Schafer-Pregl, R.; Klawan, D.; Castagna, R.; Accerbi, M.; Borghi, B.; Salamini, F. Site of einkorn wheat domestication identified by DNA fingerprinting. Science 1997, 278, 1312–1314. [Google Scholar] [CrossRef] [Green Version]
  10. Lev-Yadun, S.; Gopher, A.; Abbo, S. The cradle of agriculture. Science 2000, 288, 1602–1603. [Google Scholar] [CrossRef]
  11. Nesbitt, M.; Samuel, D. Wheat domestication: Archaeobotanical evidence. Science 1998, 279, 1431. [Google Scholar] [CrossRef]
  12. Gökgöl, M. Turkish Wheats, Vol. I. Ministry of Agriculture, Yesilkoy Seed Breeding Institute Publications No. 7; Devlet Press: Istanbul, Turkey, 1935. (In Turkish) [Google Scholar]
  13. Zhukovskyi, P.; Kipcak, C.; Nouruzhan, H.; Türkistanli, S. Ecological types and economic importance of Turkish durum wheat, agricultural structure of Turkey. In Turkish Sugar Beet Plants Publications; MacMillan Publishing Company: New York, NY, USA, 1951; pp. 158–214. [Google Scholar]
  14. Leśniowska-Nowak, J.; Okoń, S.; Wieremczuk, A. Molecular diversity analysis of genotypes from four Aegilops species based on retrotransposon–microsatellite amplified polymorphism (REMAP) markers. Cereal Res. Commun. 2021, 49, 37–44. [Google Scholar] [CrossRef]
  15. Iizumi, T.; Ali-Babiker, I.-E.A.; Tsubo, M.; Tahir, I.S.; Kurosaki, Y.; Kim, W.; Gorafi, Y.S.; Idris, A.A.; Tsujimoto, H. Rising temperatures and increasing demand challenge wheat supply in Sudan. Nat. Food 2021, 2, 19–27. [Google Scholar] [CrossRef]
  16. Nadeem, M.A. Deciphering the genetic diversity and population structure of Turkish bread wheat germplasm using iPBS-retrotransposons markers. Mol. Biol. Rep. 2021, 48, 6739–6748. [Google Scholar] [CrossRef]
  17. Morgante, M.; Salamini, F. From plant genomics to breeding practice. Curr. Opin. Biotechnol. 2003, 14, 214–219. [Google Scholar] [CrossRef] [PubMed]
  18. Tehseen, M.M.; Istipliler, D.; Kehel, Z.; Sansaloni, C.P.; da Silva Lopes, M.; Kurtulus, E.; Muazzam, S.; Nazari, K. Genetic diversity and population structure analysis of Triticum aestivum L. Landrace panel from Afghanistan. Genes 2021, 12, 340. [Google Scholar] [CrossRef]
  19. Pour-Aboughadareh, A.; Poczai, P.; Etminan, A.; Jadidi, O.; Kianersi, F.; Shooshtari, L. An Analysis of Genetic Variability and Population Structure in Wheat Germplasm Using Microsatellite and Gene-Based Markers. Plants 2022, 11, 1205. [Google Scholar] [CrossRef]
  20. Tehseen, M.M.; Tonk, F.A.; Tosun, M.; Amri, A.; Sansaloni, C.P.; Kurtulus, E.; Yazbek, M.; Al-Sham’aa, K.; Ozseven, I.; Safdar, L.B. Genome-wide association study of resistance to PstS2 and Warrior races of Puccinia striiformis f. sp. tritici (stripe rust) in bread wheat landraces. Plant Genome 2021, 14, e20066. [Google Scholar] [CrossRef] [PubMed]
  21. Karakaya, O.; Yaman, M.; Balta, F.; Yilmaz, M.; Balta, M.F. Assessment of genetic diversity revealed by morphological traits and ISSR markers in hazelnut germplasm (Corylus avellana L.) from Eastern Black Sea Region, Turkey. Genet. Resour. Crop Evol. 2022, 1–13. [Google Scholar] [CrossRef]
  22. Pour-Aboughadareh, A.; Ahmadi, J.; Mehrabi, A.; Moghaddam, M.; Etminan, A. Evaluation of agro-morphological diversity in wild relatives of wheat collected in Iran. J. Agr. Sci. Technol. 2017, 19, 943–956. [Google Scholar]
  23. Özkan, G.; Haliloğlu, K.; Türkoğlu, A.; Özturk, H.I.; Elkoca, E.; Poczai, P. Determining Genetic Diversity and Population Structure of Common Bean (Phaseolus vulgaris L.) Landraces from Türkiye Using SSR Markers. Genes 2022, 13, 1410. [Google Scholar] [CrossRef] [PubMed]
  24. Öztürk, H.İ.; Dursun, A.; Hosseinpour, A.; Haliloğlu, K. Genetic diversity of pinto and fresh bean (Phaseolus vulgaris L.) germplasm collected from Erzincan province of Turkey by inter-primer binding site (iPBS) retrotransposon markers. Turk. J. Agric. For. 2020, 44, 417–427. [Google Scholar] [CrossRef]
  25. Vieira, E.A.; Carvalho, F.I.F.D.; Bertan, I.; Kopp, M.M.; Zimmer, P.D.; Benin, G.; Silva, J.A.G.D.; Hartwig, I.; Malone, G.; Oliveira, A.C.D. Association between genetic distances in wheat (Triticum aestivum L.) as estimated by AFLP and morphological markers. Genet. Mol. Biol. 2007, 30, 392–399. [Google Scholar] [CrossRef] [Green Version]
  26. Marić, S.; Bolarić, S.; Martinčić, J.; Pejić, I.; Kozumplik, V. Genetic diversity of hexaploid wheat cultivars estimated by RAPD markers, morphological traits and coefficients of parentage. Plant Breed. 2004, 123, 366–369. [Google Scholar] [CrossRef]
  27. Abdel-Lateif, K.; Hewedy, O. Genetic diversity among Egyptian wheat cultivars using SCoT and ISSR markers. SABRAO J. Breed. Genet. 2018, 50, 36–45. [Google Scholar]
  28. Würschum, T.; Langer, S.M.; Longin, C.F.H.; Korzun, V.; Akhunov, E.; Ebmeyer, E.; Schachschneider, R.; Schacht, J.; Kazman, E.; Reif, J.C. Population structure, genetic diversity and linkage disequilibrium in elite winter wheat assessed with SNP and SSR markers. Theor. Appl. Genet. 2013, 126, 1477–1486. [Google Scholar] [CrossRef]
  29. Nazarzadeh, Z.; Onsori, H.; Akrami, S. Genetic diversity of bread wheat (Triticum aestivum L.) genotypes using RAPD and ISSR molecular markers. J. Genet. Resour. 2020, 6, 69–76. [Google Scholar]
  30. Asmamaw, M.; Keneni, G.; Tesfaye, K. Genetic diversity of Ethiopian durum wheat (Triticum durum Desf.) landrace collections as reveled by SSR markers. Adv. Crop Sci. Technol. 2019, 7, 413. [Google Scholar] [CrossRef]
  31. Elshafei, A.A.; Afiah, S.A.E.-A.; Al-Doss, A.A.; Ibrahim, E.I. Morphological variability and genetic diversity of wheat genotypes grown on saline soil and identification of new promising molecular markers associated with salinity tolerance. J. Plant Interact. 2019, 14, 564–571. [Google Scholar] [CrossRef] [Green Version]
  32. El Messoadi, K.; El Hanafi, S.; Gataa, Z.E.; Kehel, Z.; Tadesse, W. Genome wide association study for stripe rust resistance in spring bread wheat (Triticum aestivum L.). J. Plant Pathol. 2022, 104, 1049–1059. [Google Scholar] [CrossRef]
  33. Wang, S.; Wong, D.; Forrest, K.; Allen, A.; Chao, S.; Huang, B.E.; Maccaferri, M.; Salvi, S.; Milner, S.G.; Cattivelli, L. Characterization of polyploid wheat genomic diversity using a high-density 90,000 single nucleotide polymorphism array. Plant Biotechnol. J. 2014, 12, 787–796. [Google Scholar] [CrossRef] [PubMed] [Green Version]
  34. Bennetzen, J.L. Transposable element contributions to plant gene and genome evolution. Plant Mol. Biol. 2000, 42, 251–269. [Google Scholar] [CrossRef]
  35. Comertpay, G.; Baloch, F.S.; Derya, M.; Andeden, E.E.; Alsaleh, A.; Surek, H.; Özkan, H. Population structure of rice varieties used in Turkish rice breeding programs determined using simple sequence repeat and inter primer binding site retrotransposon data. GMR 2016, 15, 1–15. [Google Scholar] [CrossRef] [PubMed]
  36. Öztürk, A.; Aydin, M. Physiological characterization of Turkish bread wheat genotypes for resistance to late drought stress. Turk. J. Agric. For. 2017, 41, 414–440. [Google Scholar] [CrossRef]
  37. Öztürk, A.; Bayram, S.; Halİloğlu, K.; Aydin, M.; Çağlar, Ö.; Bulut, S. Characterization for drought resistance at early stages of wheat genotypes based on survival, coleoptile length, and seedling vigor. Turk. J. Agric. For. 2014, 38, 824–837. [Google Scholar] [CrossRef]
  38. Öztürk, A.; Taşkesenligil, B.; Haliloğlu, K.; Aydin, M.; Çağlar, Ö. Evaluation of bread wheat genotypes for early drought resistance via germinationunder osmotic stress, cell membrane damage, and paraquat tolerance. Turk. J. Agric. For. 2016, 40, 146–159. [Google Scholar] [CrossRef]
  39. Zeinalzadehtabrizi, H.; Hosseinpour, A.; Aydin, M.; Haliloglu, K. A modified genomic DNA extraction method from leaves of sunflower for PCR based analyzes. J. Biol. Environ. Sci. 2015, 7, 222–225. [Google Scholar]
  40. Kalendar, R.; Antonius, K.; Smýkal, P.; Schulman, A.H. iPBS: A universal method for DNA fingerprinting and retrotransposon isolation. Theor. Appl. Genet. 2010, 121, 1419–1430. [Google Scholar] [CrossRef]
  41. Hosseinpour, A.; Karahan, F.; İlhan, E.; İlçim, A.; Haliloğlu, K. Genetic structure and diversity of Adonis L.(Ranunculaceae) populations collected from Turkey by inter-primer binding site (iPBS) retrotransposon markers. Turk. J. Bot. 2019, 43, 585–596. [Google Scholar] [CrossRef]
  42. Kizilgeci, F.; Bayhan, B.; Türkoğlu, A.; Haliloglu, K.; Yildirim, M. Exploring genetic diversity and Population structure of five Aegilops species with inter-primer binding site (iPBS) markers. Mol. Biol. Rep. 2022, 49, 8567–8574. [Google Scholar] [CrossRef]
  43. Dice, L.R. Measures of the amount of ecologic association between species. Ecology 1945, 26, 297–302. [Google Scholar] [CrossRef]
  44. Peakall, R.; Smouse, P.E. GENALEX 6: Genetic analysis in Excel. Population genetic software for teaching and research. Mol. Ecol. Notes 2006, 6, 288–295. [Google Scholar]
  45. Anderson, J.A.; Churchill, G.; Autrique, J.; Tanksley, S.; Sorrells, M. Optimizing parental selection for genetic linkage maps. Genome 1993, 36, 181–186. [Google Scholar] [CrossRef] [PubMed]
  46. Yeh, F.C.; Yang, R.; Boyle, T.B.; Ye, Z.; Mao, J.X. POPGENE, the user-friendly shareware for population genetic analysis. Mol. Biol. Biotechnol. Cent. Univ. Alta. Can. 1997, 10, 295–301. [Google Scholar]
  47. Pritchard, J.K.; Stephens, M.; Rosenberg, N.A.; Donnelly, P. Association mapping in structured populations. Am. J. Hum. Genet. 2000, 67, 170–181. [Google Scholar] [CrossRef] [PubMed] [Green Version]
  48. Evanno, G.; Regnaut, S.; Goudet, J. Detecting the number of clusters of individuals using the software STRUCTURE: A simulation study. Mol. Ecol. 2005, 14, 2611–2620. [Google Scholar] [CrossRef]
  49. Earl, D.A.; VonHoldt, B.M. Structure harvester: A website and program for visualizing structure output and implementing the Evanno method. Conserv. Genet. Resour. 2012, 4, 359–361. [Google Scholar] [CrossRef]
  50. Yaman, M. Evaluation of genetic diversity by morphological, biochemical and molecular markers in sour cherry genotypes. Mol. Biol. Rep. 2022, 49, 5293–5301. [Google Scholar] [CrossRef]
  51. Abbasi Holasou, H.; Rahmati, F.; Rahmani, F.; Imani, M.; Talebzadeh, Z. Elucidate genetic diversity and population structure of bread wheat (Triticum aestivum L.) cultivars using IRAP and REMAP markers. J. Crop Sci. Biotechnol. 2019, 22, 139–151. [Google Scholar] [CrossRef]
  52. Casacuberta, E.; González, J. The impact of transposable elements in environmental adaptation. Mol. Ecol. 2013, 22, 1503–1517. [Google Scholar] [CrossRef]
  53. Demirel, F. Genetic diversity of Emmer wheats using iPBS markers. Avrupa Bilim Teknol. Derg. 2020, 20, 640–646. [Google Scholar]
  54. Kumar, A.; Sharma, A.; Sharma, R.; Srivastva, P.; Choudhary, A. Exploration of wheat wild relative diversity from Lahaul valley: A cold arid desert of Indian Himalayas. Cereal Res. Commun. 2022, 50, 305–320. [Google Scholar] [CrossRef]
  55. Alshehri, M.; Alzahrani, O.; Aziza, A.; Alasmari, A.; Ibrahim, S.; Bahattab, O.; Osman, G.; Alshamari, A.; Alduaydi, S. Correlation and genetic analyses of different characteristics in Saudi Arabian wheat reveal correlation networks and several trait-associated markers. JAPS J. Anim. Plant Sci. 2020, 30, 1486–1497. [Google Scholar]
  56. Çifçi, E.A.; Yağdi, K. Study of genetic diversity in wheat (Triticum aestıvum) varities using random amplified polymorphic DNA (RAPD) analysis. Turk. J. Field Crop. 2012, 17, 91–95. [Google Scholar]
  57. Guo, X.; Elston, R. Linkage information content of polymorphic genetic markers. Hum. Hered. 1999, 49, 112–118. [Google Scholar] [CrossRef]
  58. Arystanbekkyzy, M.; Nadeem, M.A.; Aktas, H.; Yeken, M.Z.; Zencirci, N.; Nawaz, M.A.; Ali, F.; Haider, M.S.; Tunc, K.; Chung, G. Phylogenetic and taxonomic relationship of turkish wild and cultivated emmer (Triticum turgidum ssp. dicoccoides) revealed by iPBSretrotransposons markers. Int. J. Agric. Biol. 2019, 21, 155–163. [Google Scholar]
  59. Ellstrand, N.C.; Elam, D.R. Population genetic consequences of small population size: Implications for plant conservation. Annu. Rev. Ecol. Evol. 1993, 24, 217–242. [Google Scholar] [CrossRef]
  60. Mohammadi, S.A.; Prasanna, B. Analysis of genetic diversity in crop plants—Salient statistical tools and considerations. Crop Sci. 2003, 43, 1235–1248. [Google Scholar] [CrossRef] [Green Version]
  61. Mourad, A.M.; Belamkar, V.; Baenziger, P.S. Molecular genetic analysis of spring wheat core collection using genetic diversity, population structure, and linkage disequilibrium. BMC Genom. 2020, 21, 434. [Google Scholar] [CrossRef] [PubMed]
  62. Bouchet, S.; Pot, D.; Deu, M.; Rami, J.F.; Billot, C.; Perrier, X.; Rivallan, R.; Gardes, L.; Xia, L.; Wenzl, P. Genetic structure, linkage disequilibrium and signature of selection in sorghum: Lessons from physically anchored DArT markers. PLoS ONE 2012, 7, e33470. [Google Scholar] [CrossRef] [PubMed]
Figure 1. Dendrogram of 63 wheat genotypes generated with data from 34 inter-Primer Binding Site (iPBS) primers.
Agronomy 13 00255 g001
Figure 2. Principal coordinates analysis (PCoA) calculated from the pooled data of thirty-four inter-Primer Binding Site (iPBS) primers in 63 wheat varieties. Ari: Anatolia Agricultural Research Institute, Bri: Bahri Dağdaş International Agricultural Research Institute, Cri: Çukurova Agricultural Research Institute, Ear: Eastern Anatolia Region, Eari: Eastern Anatolia Agricultural Research Institute, Car: Central Anatolia Region, Sri: Sakarya Agricultural Research Institute, Fci: Field Crops Central Research Institute, Tri: Trakya Agricultural Research Institute.
Agronomy 13 00255 g002
Figure 3. Genetic structure of varieties according to iPBS data (the wheat varieties given in K = 3 (Figure 4) are presented in Table 7).
Agronomy 13 00255 g003
Figure 4. Line graphs from the mixture model of Ln P (D) and ∆K for wheat populations.
Agronomy 13 00255 g004
Table 1. Some information about the bread wheat varieties used in the study.
Code NumberGenotype/Variety NameVariety Owner Organization/OriginSeason of Sowing
Varieties included in the 2007 national variety list
G1Aksel 2000Field Crops Central Research Institute.Alternative
G2AlparslanEastern Anatolia Agricultural Research Institute.Winter
G3Altay 2000Anatolia Agricultural Research Institute.Winter
G4Atlı 2002Field Crops Central Research Institute.Alternative
G5Aytın 98Anatolia Agricultural Research Institute.Winter
G6Bağcı 2002Bahri Dağdaş International Agricultural Research Institute.Alternative
G7Bayraktar 2000Field Crops Central Research Institute.Alternative
G8Bolal 2973Anatolia Agricultural Research Institute.Alternative
G9Çetinel 2000Anatolia Agricultural Research Institute.Winter
G10Dağdaş 94Bahri Dağdaş International Agricultural Research Institute.Alternative
G11Demir 2000Field Crops Central Research Institute.Alternative
G12Doğankent 1Çukurova Agricultural Research Institute.Summery
G13Doğu 88Eastern Anatolia Agricultural Research InstituteWinter
G14Gerek 79Anatolia Agricultural Research InstituteWinter
G15Gün 91Field Crops Central Research Institute.Winter
G16Harmankaya 99Anatolia Agricultural Research InstituteWinter
G17İkizce 96Field Crops Central Research Institute.Alternative
G18İzgi 2001Anatolia Agricultural Research Institute.Winter
G19Karahan 99Bahri Dağdaş International Agricultural Research Institute.Winter
G20Kate A-1Trakya Agricultural Research Institute.Winter
G21Kıraç 66Anatolia Agricultural Research Institute.Winter
G22Kırgız 95Anatolia Agricultural Research Institute.Winter
G23Kırkpınar 79Trakya Agricultural Research Institute.Alternative
G24Kutluk 94Anatolia Agricultural Research Institute.Winter
G25LancerEastern Anatolia Agricultural Research Institute.Winter
G26MızrakField Crops Central Research Institute.Alternative
G27MüfitbeyAnatolia Agricultural Research Institute.Winter
G28NenehatunEastern Anatolia Agricultural Research Institute.Winter
G29Palandöken 97Eastern Anatolia Agricultural Research Institute.Winter
G30Pamukova 97Sakarya Agricultural Research Institute.Summery
G31PehlivanTrakya Agricultural Research Institute.Winter
G32ProstorTrakya Agricultural Research Institute.Winter
G33Seri 82Çukurova Agricultural Research Institute.Winter
G34Soyer02Anatolia Agricultural Research Institute.Winter
G35Sönmez 2001Anatolia Agricultural Research Institute.Winter
G36Sultan 95Anatolia Agricultural Research Institute.Winter
G37Süzen 97Anatolia Agricultural Research Institute.Winter
G38TosunbeyField Crops Central Research Institute.Winter
G39TürkmenField Crops Central Research Institute.Alternative
G40UzunyaylaField Crops Central Research Institute.Alternative
G41Yakar 99Field Crops Central Research Institute.Alternative
G42Zencirci 2002Field Crops Central Research Institute.Alternative
Old cultivars and local genotypes not included in the 2007 national cultivar list
G43Ak-702Anatolia Agricultural Research Institute.Winter
G44Ak buğdayCentral Anatolia RegionWinter
G45Ankara 093/44Field Crops Central Research Institute.Winter
G46ConkesmeEastern Anatolia RegionAlternative
G47Haymana 79Field Crops Central Research Institute.Winter
G48Kılçıksız buğdayCentral Anatolia RegionWinter
G49KırikEastern Anatolia RegionAlternative
G50Kırmızı KılçıkEastern Anatolia RegionAlternative
G51Kırmızı YerliEastern Anatolia RegionAlternative
G52Koca buğdayCentral Anatolia RegionWinter
G53Köse 220/39Field Crops Central Research Institute.Alternative
G54OrsoSakarya Agricultural Research Institute.Alternative
G55Özlü buğdayCentral Anatolia RegionWinter
G56Polatlı KösesiCentral Anatolia RegionAlternative
G57Sert buğdayCentral Anatolia RegionWinter
G58Sürak 1593/51Field Crops Central Research Institute.Winter
G59TirEastern Anatolia RegionWinter
G60Yayla 305Anatolia Agricultural Research Institute.Winter
G61ZerinCentral Anatolia RegionAlternative
G62Bezostaja 1Sakarya Agricultural Research Institute.Winter
G63Karasu 90Eastern Anatolia Agricultural Research Institute.Winter
Table 2. List of 34 iPBS-retrotransposon primers with their sequences used to elucidate genetic diversity among 63 bread wheat genotypes.
MarkerPrimers Sequences (5′ → 3′)MarkerPrimers Sequences (5′ → 3′)
iPBS-2075CTCATGATGCCAiPBS-2298AGAAGAGCTCTGATACCA
iPBS-2077CTCACGATGCCAiPBS-2375TCGCATCAACCA
iPBS-2079AGGTGGGCGCCAiPBS-2376TAGATGGCACCA
iPBS-2080CAGACGGCGCCAiPBS-2377ACGAAGGGACCA
iPBS-2087GCAATGGAACCAiPBS-2380CAACCTGATCCA
iPBS-2217ACTTGGATGTCGATACCAiPBS-2381GTCCATCTTCCA
iPBS-2221ACCTAGCTCACGATGCCAiPBS-2382TGTTGGCTTCCA
iPBS-2225AGCATAGCTTTGATACCAiPBS-2383GCATGGCCTCCA
iPBS-2228CATTGGCTCTTGATACCAiPBS-2384GTAATGGGTCCA
iPBS-2231ACTTGGATGCTGATACCAiPBS-2385CCATTGGGTCCA
iPBS-2242GCCCCATGGTGGGCGCCAiPBS-2386CTGATCAACCCA
iPBS-2251GAACAGGCGATGATACCAiPBS-2387GCGCAATACCCA
iPBS-2270ACCTGGCGTGCCAiPBS-2388TTGGAAGACCCA
iPBS-2271GGCTCGGATGCCAiPBS-2389ACATCCTTCCCA
iPBS-2274ATGGTGGGCGCCAiPBS-2390GCAACAACCCCA
iPBS-2276ACCTCTGATACCAiPBS-2391ATCTGTCAGCCA
iPBS-2278GCTCATGATACCAiPBS-2392TAGATGGTGCCA
Table 3. Thirty-four iPBS primers used in the detection of polymorphism among 63 wheat varieties (Triticum aestivum L.).
MarkerNumber of AllelesMajor Allele FrequencyPIC *MarkerNumber of AllelesMajor Allele FrequencyPIC *
iPBS-2075330.1590.220iPBS-2298500.0630.187
iPBS-2077350.1270.219iPBS-237580.4440.220
iPBS-2079310.2860.169iPBS-2376160.4130.131
iPBS-2080400.1430.225iPBS-2377390.1590.223
iPBS-2087180.4760.048iPBS-2380470.1900.279
iPBS-2217360.2380.089iPBS-2381600.0320.279
iPBS-2221480.0950.152iPBS-2382320.2060.303
iPBS-2225390.1590.170iPBS-2383350.1590.128
iPBS-2228590.0320.242iPBS-2384370.2540.128
iPBS-2231210.2860.128iPBS-2385480.0630.146
iPBS-2242230.1900.170iPBS-2386310.2860.058
iPBS-2251180.3490.115iPBS-2387470.0950.160
iPBS-2270220.3020.140iPBS-2388410.1110.178
iPBS-2271300.1590.157iPBS-2389380.1430.187
iPBS-2274410.3020.074iPBS-2390260.2060.123
iPBS-2276280.1430.257iPBS-2391510.1270.262
iPBS-2278490.0950.190iPBS-2392540.0630.207
Mean/Total36/12310.1930.175
* PIC polymorphism information content.
Table 4. Summary statistics for mean values for wheat varieties (Triticum aestivum L.) assessed with iBPS primers.
MarkerNe *H ***I **MarkerNe *H ***I **
iPBS-20751.2050.1170.174iPBS-22981.1940.1180.177
iPBS-20771.1900.1140.174iPBS-23751.0970.0550.082
iPBS-20791.1230.0760.119iPBS-23761.0830.0540.086
iPBS-20801.1700.0990.148iPBS-23771.2150.1250.186
iPBS-20871.0600.0380.060iPBS-23801.2670.1550.233
iPBS-22171.0860.0570.093iPBS-23811.2550.1500.226
iPBS-22211.1290.0810.128iPBS-23821.2740.1670.254
iPBS-22251.1530.0960.147iPBS-23831.3230.1820.266
iPBS-22281.2550.1560.237iPBS-23841.1170.0740.115
iPBS-22311.0790.0480.074iPBS-23851.1350.0820.127
iPBS-22421.1770.1050.159iPBS-23861.0630.0420.069
iPBS-22511.0750.0480.076iPBS-23871.1450.0920.144
iPBS-22701.0810.0560.093iPBS-23881.1600.1000.155
iPBS-22711.1920.1120.167iPBS-23891.1400.0830.124
iPBS-22741.0720.0490.080iPBS-23901.1090.0660.101
iPBS-22761.2180.1200.175iPBS-23911.1820.1070.162
iPBS-22781.1580.0970.150iPBS-23921.1610.0970.149
Mean/Total 1.1570.0950.144
* Ne effective numbers of alleles, ** I Shannon’s information index, and *** He gene diversity.
Table 5. PCoA analysis of wheat varieties.
Axis123
%44.5812.083.44
Cum %44.5856.6560.10
Table 6. AMOVA of wheat varieties using inter-Primer Binding Site (iPBS) marker.
SourceDegree of Freedom (df)Sum of Squares (SS)% of Total Variance
Among Pops84.1191%
Within Pops5426.75499%
Total6230.873100%
Table 7. Membership coefficients of three subpopulations of wheat varieties.
Subpopulation Subpopulation
Code NumberIIIIIICode NumberIIIIII
G10.3270.5460.127G330.0070.0050.989
G20.0370.9500.013G340.0220.0100.968
G30.0060.8310.163G350.0530.0120.935
G40.0040.9890.007G360.3970.0080.594
G50.0070.9790.014G370.3900.1290.481
G60.0550.9270.018G380.4430.0200.537
G70.0110.9730.016G390.3770.0100.613
G80.0060.9790.015G400.4350.0050.559
G90.0060.9760.017G410.6220.0070.371
G100.1370.7380.125G420.6350.0110.354
G110.0080.9220.070G430.9010.0160.083
G120.0080.8130.179G440.7790.0130.208
G130.0150.7400.245G450.9270.0120.061
G140.0270.8390.135G460.9060.0700.024
G150.0090.6890.302G470.7790.1620.059
G160.0210.4500.530G480.9570.0330.010
G170.0160.5880.396G490.8950.1000.005
G180.0200.4350.545G500.7820.2000.017
G190.0110.4000.589G510.9710.0120.017
G200.0110.5480.440G520.9610.0250.014
G210.0140.3980.588G530.9890.0070.004
G220.0050.3420.653G540.9860.0090.004
G230.0120.1170.871G550.9880.0070.006
G240.0210.3150.664G560.9360.0490.014
G250.0230.1750.802G570.9910.0050.004
G260.0200.3520.628G580.9740.0170.009
G270.0090.0360.955G590.9090.0810.010
G280.0240.0490.927G600.8110.1620.027
G290.0090.0610.930G610.7630.2280.008
G300.0060.0260.968G620.6420.2910.067
G310.0050.0100.986G630.6740.1870.140
G320.0180.0210.961
Table 8. Expected heterozygosity (He) and Fst values in three wheat subpopulations.
Subpopulation (K)Expected Heterozygosity (He)Fst
10.22030.4005
20.25990.2374
30.21550.3773
Mean0.23190.3384
Disclaimer/Publisher’s Note: The statements, opinions and data contained in all publications are solely those of the individual author(s) and contributor(s) and not of MDPI and/or the editor(s). MDPI and/or the editor(s) disclaim responsibility for any injury to people or property resulting from any ideas, methods, instructions or products referred to in the content.

