Article

Salicylic Acid Improves Agro-Morphology, Yield and Ion Accumulation of Two Wheat (Triticum aestivum L.) Genotypes by Ameliorating the Impact of Salt Stress

by
Syeda Afia Fairoj
1,
Md. Moshiul Islam
1,*,
Md. Ariful Islam
2,
Erin Zaman
1,
Milia Bente Momtaz
3,
Md. Saddam Hossain
1,
Nilufar Akhtar Jahan
2,
Shahjadi-Nur-Us Shams
1,
Tahmina Akter Urmi
4,
Md Asadujjaman Rasel
1,5,
Md. Arifur Rahman Khan
1,
Mohammed Zia Uddin Kamal
6,
G. K. M. Mustafizur Rahman
6,
Md. Nasimul Bari
1,
M. Moynul Haque
1 and
Yoshiyuki Murata
7
1
Department of Agronomy, Faculty of Agriculture, Bangabandhu Sheikh Mujibur Rahman Agricultural University, Gazipur 1706, Bangladesh
2
Department of Agriculture, Bangabandhu Sheikh Mujibur Rahman Science and Technology University, Gopalganj 8100, Bangladesh
3
Cotton Research Training and Seed Multiplication Farm, Sreepur, Gazipur 1744, Bangladesh
4
Department of Soil Science, Faculty of Agriculture, Bangladesh Agricultural University, Mymensingh 2202, Bangladesh
5
Bangladesh Sugarcrop Research Institute, Ishwardi, Pabna 6600, Bangladesh
6
Department of Soil Science, Faculty of Agriculture, Bangabandhu Sheikh Mujibur Rahman Agricultural University, Gazipur 1706, Bangladesh
7
Graduate School of Environmental and Life Science, Okayama University, 1-1-1 Tsushima-Naka, Okayama 700-8530, Japan
*
Author to whom correspondence should be addressed.
Agronomy 2023, 13(1), 25; https://doi.org/10.3390/agronomy13010025
Submission received: 29 October 2022 / Revised: 5 December 2022 / Accepted: 15 December 2022 / Published: 22 December 2022

Abstract

:
Wheat growth, development and yield are severely affected by a wide range of abiotic stresses, and salt stress is a vital and increasing abiotic stress. Salicylic acid (SA) is a phenolic phytohormone involved in plant physiological processes. Hence, we have conducted an experiment to explore the roles of exogenous SA in mitigating salt stress in two wheat genotypes. There were eight treatments comprising (i) control, (ii) 0.5 mM SA, (iii) 1.0 mM SA, (iv) 1.5 mM SA, (v) salinity (12 dS m−1), (vi) salinity + 0.5 mM SA, (vii) salinity + 1.0 mM SA and (viii) salinity + 1.5 mM SA with two wheat genotypes viz G 200-4 and BARI gom-25. The experiment was laid out in a completely randomized design with five replications. During the vegetative stage, salt stress significantly reduced the relative water content (RWC), photosynthetic rate, stomatal conductance and growth characteristics of both wheat genotypes, while the exogenous application of SA in salt-stressed plants significantly improved the RWC, gas exchange activities and growth performance of both the genotypes. The leaf chlorophyll content was also degraded due to salinity treatment, although it was mitigated by the exogenous application of SA. The imposition of salt significantly reduced the number of days required for maturity, yield-contributing characteristics and the yield of both the wheat genotypes. Salt stress also significantly increased Na+ concentrations and the Na+/K+ ratio, while the K+ concentrations was decreased significantly in both the wheat genotypes. However, the exogenous application of SA in salt-stressed plants significantly reduced the salt stress effects and increased the growth and yield of wheat genotypes by enhancing RWC, gas exchange activities and photosynthetic pigments and maintaining lower Na+ concentrations and a Na+/K+ ratio. Therefore, the findings of this study suggested that the exogenous application of SA improved the salt tolerance of both wheat genotypes.

1. Introduction

Wheat (Triticum aestivum L.) is among the foremost important cereal crops of the planet. About 1.2 billion to 2.5 billion people are “wheat-dependent” or “wheat-consuming” around the world, respectively, and for this reason, wheat is called the “stuff of life” [1]. Wheat ranks as the second major cereal crop in Bangladesh, but wheat production is not satisfactory in the coastal areas of Bangladesh. Wheat production in the country is far below the annual requirement. Therefore, the existing cropping pattern of the saline-prone area could be changed by the establishment of wheat in the pattern, which is essential for the utilization of coastal land and for matching food demand to the increasing population of the country.
Salinity is a major abiotic stress reducing the productivity of agricultural crops. Salinity affects plant growth and development in two main ways: osmotic stress and ion toxicity [2]. Osmotic stress is caused mainly by Na+ and Cl in the soil solution, which reduces the availability of water to roots [3]. When plant roots uptake Na+ and/or Cl and these ions accumulate to pernicious levels in leaves, ion toxicity occurs [3]. Salinity reduces the growth of a plant through osmotic effects and reduces the ability of plants to take up water; this causes a reduction in growth. Thus, reduced water uptake is the common feedback of plants subjected to salinity stress [4]. Lower water status in a plant body slows the rate of cell division and expansion mainly through a loss of turgor [5,6]. It affects almost every aspect of the morphology, both the external and internal physiology of plants, and significantly reduces the yield. High salinity in soil badly affects the quality and quantity of crop production [7] by inhibiting seed germination, seedling growth and developmental phases due to the cumulative influences of higher osmotic potential and the toxicity of specific ions [7,8]. Salinity restricts growth and production by affecting physiological processes, including the modification of ion balance, mineral nutrition, water status, stomatal behavior and photosynthetic efficiency and oxidative damage due to the manufacture of higher levels of reactive oxygen species (ROS) and variations in antioxidant enzymes [9,10,11].
Salicylic acid (SA) is phenolic in nature and is held by plants [12]. It has been seen as an endogenous regulator in plants since discovering that it is involved in many plant physiological processes like photosynthesis, transpiration, nutrient uptake, chlorophyll synthesis, protein synthesis and transport [13]. SA treatment significantly increased quantities of endogenous salicylic acid, enhanced antioxidant enzymes and the contents of non-enzymatic compounds, improved the ratio of potassium to sodium and increased plant growth, resulting in improved abiotic tolerance [14,15,16,17]. However, Abdi et al. [13] concluded that the influence of salicylic acid is mainly dependent on the concentration, plant species and application type. It is reported that SA at low doses seems to play a helpful role in plant metabolism [18]. It is a cell reinforcement compound that controls plant development [12]. Salicylic acid promotes the leaf area of plants and increases the dry biomass of shoots and roots [12,13]. The knowledge of alterations in physiological processes mediated by NaCl and SA may provide a basis to enhance the productivity of wheat plants in areas adversely affected by salt stress.
Among abiotic stresses, salt stress is an environmental constraint that affects approximately 20% of global cultivable land and is increasing continuously due to change in climate and human activities [19,20]. Different environmental stresses, including salinity, can cause about 50% of production losses [4]. On the other hand, the world’s food supply needs to be increased by up to 70% by 2050 to ensure global food security for the ever-increasing population of the globe [21]. Therefore, it is now of prime importance to increase the salt tolerance of crops to ensure global food security. Hence, it is the right time for precise research planning to cope with increasing salinity problems. With this view, plant researchers are searching for salt-stress-tolerant crops and also trying to find out the ways to make plants adaptive under salt stress. The determination of different traits related to salt-stress tolerance might be used as a selection criterion to enhance wheat adaptation to salt-stress conditions. Although the stress-mitigating roles of SA has been largely analyzed in several crop species; however, many aspects of exogenous SA-mediated salinity tolerance in wheat remain elusive. Regarding this scenario, the present work was therefore intended to observe the adverse effects of salinity stress on wheat and also to examine the potential roles of SA on the mitigation of salinity stress on wheat production. Our hypothesis was that SA application could improve the salinity tolerance of wheat.

2. Materials and Methods

2.1. Experimental Site

The experiment was conducted at the Department of Agronomy, Bangabandhu Sheikh Mujibur Rahman Agricultural University (BSMRAU), Gazipur, during the winter season of 2020–2021. The site is located in the Madhupur tract in Agro-Ecological Zone (AEZ) 28 at geographic coordinates 24°05′ north latitude and 90°16′ east longitude, with an elevation of 8.4 m above the mean sea level. The experimental site is situated in a sub-tropical climate zone characterized by heavy rainfall during the month from May to September and scanty rainfall during the rest of the year.

2.2. Planting Materials and Treatment

One advanced line (G200-4) and one check variety (BARI gom-25) of wheat were used as planting materials for the experiment [22]. The advanced lines of wheat were selected from a previous study and found to be tolerant to salinity at the 12 dS m−1 level. Thus, the planting materials consisted of G 200-4 (advanced line) and BARI gom-25 (a high-yielding salt-tolerant variety) as the check variety of wheat. The salinity (NaCl) comprises one level (12 dS m−1), and the salicylic acid (SA) was exogenously applied at the 0.5, 1 and 1.5 mM levels [12,17]. Therefore, the treatment combinations were: control (T1) (only nutrient solution); 0.5 mM SA (T2); 1.0 mM SA (T3); 1.5 mM SA (T4); 12 dS m−1 NaCl (T5); 12 dS m−1 NaCl + 0.5 mM SA (T6); 12 dS m−1 NaCl + 1.0 mM SA (T7); 12 dSm−1 NaCl + 1.5 mM SA (T8). The experiment was conducted in a completely randomized design (CRD) wth five replications.

2.3. Treatment Imposition

After germination, seedlings were transplanted to 20 L pots. The pots were irrigated with full-strength Hoagland nutrient solution [23] until 25 days of sowing (DS). After 25 days of sowing (at tillering stage), treatments of saline water (12 dS m−1) were added to the pots through a modified Hoagland solution. Before the application of such high concentrations (12 dS m−1) of saline water, the plants were irrigated with 4 dS m−1 and 8 dS m−1 solutions for 7 days in order to protect the plants from osmotic shock. Simultaneously, foliar applications of SA (0.5, 1.0 and 1.5 mM) were sprayed individually as per the treatments of the experiment. The electrical conductivity (EC) and pH (6.5) of the nutrient solution were kept constant throughout the period of the experiment, measured by an EC-meter (Hanna HI 4321, Merck Pty. Ltd., an affiliate of Merck KGaA, Darmstadt, Germany) and a pH meter (Hanna HI 2211, Merck Pty. Ltd., an affiliate of Merck KGaA, Darmstadt, Germany), respectively.

2.4. Estimation of Relative Water Content

Relative water content (RWC) was measured using the fully expanded uppermost leaves of each genotype under both control and salt-stress conditions at noon. Immediately after cutting at the base of the lamina, leaves were sealed within plastic bags and kept in the icebox, then quickly transferred to the laboratory. The fresh weight of leaf from each treatment was recorded just after removal from the polythene bag. Turgid weight (TW) was obtained after soaking leaves in distilled water in beakers for 24 h at room temperature (about 20 °C) and under low-light conditions in the laboratory. After soaking, leaves were quickly and carefully blotted dry with tissue paper to determine turgid weight. The dry weight (DW) of leaf was obtained after oven-drying the leaf samples for 72 h at 70 °C. The RWC was calculated in the following equation according to Schonfeld et al. [24]:
RWC   ( % ) = [ FW DW TW DW ] × 100
where FW = fresh weight (mg), DW = dry weight (mg), and TW = turgid weight (mg)

2.5. Gas Exchange Characteristics

Gas exchange measurements, such as photosynthetic rate (Pn) and stomata conductance (Gs), were recorded. The fully expanded uppermost leaves of each genotype of all the treatments were used in gas exchange measurements. A Li-COR, 6400 portable photosynthetic system (Li-COR, Lincon, NE, USA) was used at an atmospheric CO2 concentration of 360 µmol air mol−1 (360 ppm). All measurements were taken on a sunny day between 11:00 am to 13:00 am when photosynthetica1ly active radiation (PAR) intensity was between 1100 and 1200 µmol m−2 s−1.

2.6. Determination of Photosynthetic Pigment

Chlorophyll concentration (SPAD value) was measured from a fully expanded third leaf of each plant using a chlorophyll meter, also known as Soil Plant Analysis Development (SPAD) (SPAD-502, Minolta Co., Ltd., Osaka, Japan). SPAD values were recorded at 38, 45, 52, 59, 66, 73, 80 and 87 days after sowing.

2.7. Collection of Growth and Yield Data

Dry matter partitioning was done at 60 days after sowing, and for dry matter partitioning, plant samples were collected from five replications of all treatments. After collecting samples, the data of different morphological parameters like plant height, total tillers per plant, leaves per plant, leaf area and dry weight per plant were recorded individually from plants of all treatments. Dry weight (DW) per plant was obtained after oven-drying the plant samples for 72 h at 70 °C. Dates of maturity were recorded when plants went to their maturity stage and were gray in color.
In addition, after harvesting, data of yield and yield-contributing parameters like plant height, total tillers per plant, effective tillers per plant, spike length, spikelets per spike, filled grains per spike, unfilled grains per spike, thousand-grain weight, grain yield per plant and straw yield per plant were recorded. Grain weight per plant was adjusted for 12% moisture content.

2.8. Determination of Na and K Ion Concentration

After harvest, plants were separated into roots and leaves and oven-dried at 70 °C for 3 days. Powdered plant materials (0.5 g) were digested with a HNO3:HClO4 (5:1 v/v) acid mixture at 220 °C for 1.5–2 h according to the method of Rahman et al. [25] with slight modification. From the digested solution, Na and K contents were quantified by an atomic absorption spectrophotometer (Perkin-Elmer Analyst Model 2380, Perkin-Elmer Corp, Buckinghamshire, UK). The analyses were performed for five replications of all treatment.

2.9. Statistical Analysis

To assess the effects of different treatments, data were statistically analyzed using the analysis of variance (ANOVA) technique with the help of statistical analysis package program statistix-10. The statistical differences between mean values were compared by a least significant difference (LSD) test with a 5% level of significance.

3. Results

3.1. Relative Water Content

The analysis of variance showed that mean squares due to variety (V), salinity (S), salicylic acid (SA) and their interactions were significant (p ≤ 0.05 or p ≤ 0.01) for relative water content (RWC), photosynthetic rate and stomatal conductance (Table 1). During the sole application of SA, the highest relative water content of BU 2008-4 (86.573%) and BARI gom-25 (84.698%) were observed at T3 (1 mM SA) treatment (Table 2). However, the lowest relative water content of BU 2008-4 (73.640%) and BARI gom-25 (63.458%) were found at T5 (12 dS m−1 salinity). Under saline conditions, the foliar application of SA enhanced the relative water content of salinity-stressed wheat, and the maximum relative water content of BU 2008-4 (80.450%) and BARI gom-25 (69.323%) were observed with the T7 (12 dSm−1 NaCl + 1 mM SA) treatment.

3.2. Photosynthetic Rate

The photosynthetic rate of wheat genotypes varied due to salinity and the exogenous application of SA (Table 2). In the absence of salinity, the highest photosynthetic rate of BU 2008-4 (16.440 µmol m−2s−1) and BARI gom-25 (15.698 µmol m−2s−1) were recorded with the T3 (1 mM SA) treatment. Contrary, the lowest photosynthetic rate of BU 2008-4 (12.268 µmol m−2s−1) and BARI gom-25 (12.085 µmol m−2s−1) were obtained with the 12 dS m−1 saline treatment (T5). On the other hand, the foliar application of SA to salt-stressed wheat increased the photosynthetic rate by ameliorating the negative effect of NaCl. Thus, the maximum photosynthetic rates of saline-stressed BU 2008-4 (13.175 µmol m−2s−1) and BARI gom-25 (12.710 µmol m−2s−1) were observed with the T7 (12 dSm−1 NaCl + 1 mM SA) treatment.

3.3. Stomatal Conductance

During the application of solely SA, the highest stomatal conductance of BU 2008-4 (0.267 mmol m−2s−1) and BARI gom-25 (0.248 mmol m−2s−1) were observed with 1 mM SA (Table 2). Contrarily, salinity stress at 12 dS m−1 reduced the stomatal conductance of wheat, and the lowest stomatal conductance of BU 2008-4 (0.185 mmol m−2s−1) and BARI gom-25 (0.185 mmol m−2s−1) were found with salinity stress. During the amelioration of saline stress through the application of SA, the highest stomatal conductance of BU 2008-4 (0.205 mmol m−2s−1) and BARI gom-25 (0.171 mmol m−2s−1) were recorded with T7 (12 dSm−1 NaCl + 1 mM SA) treatment.

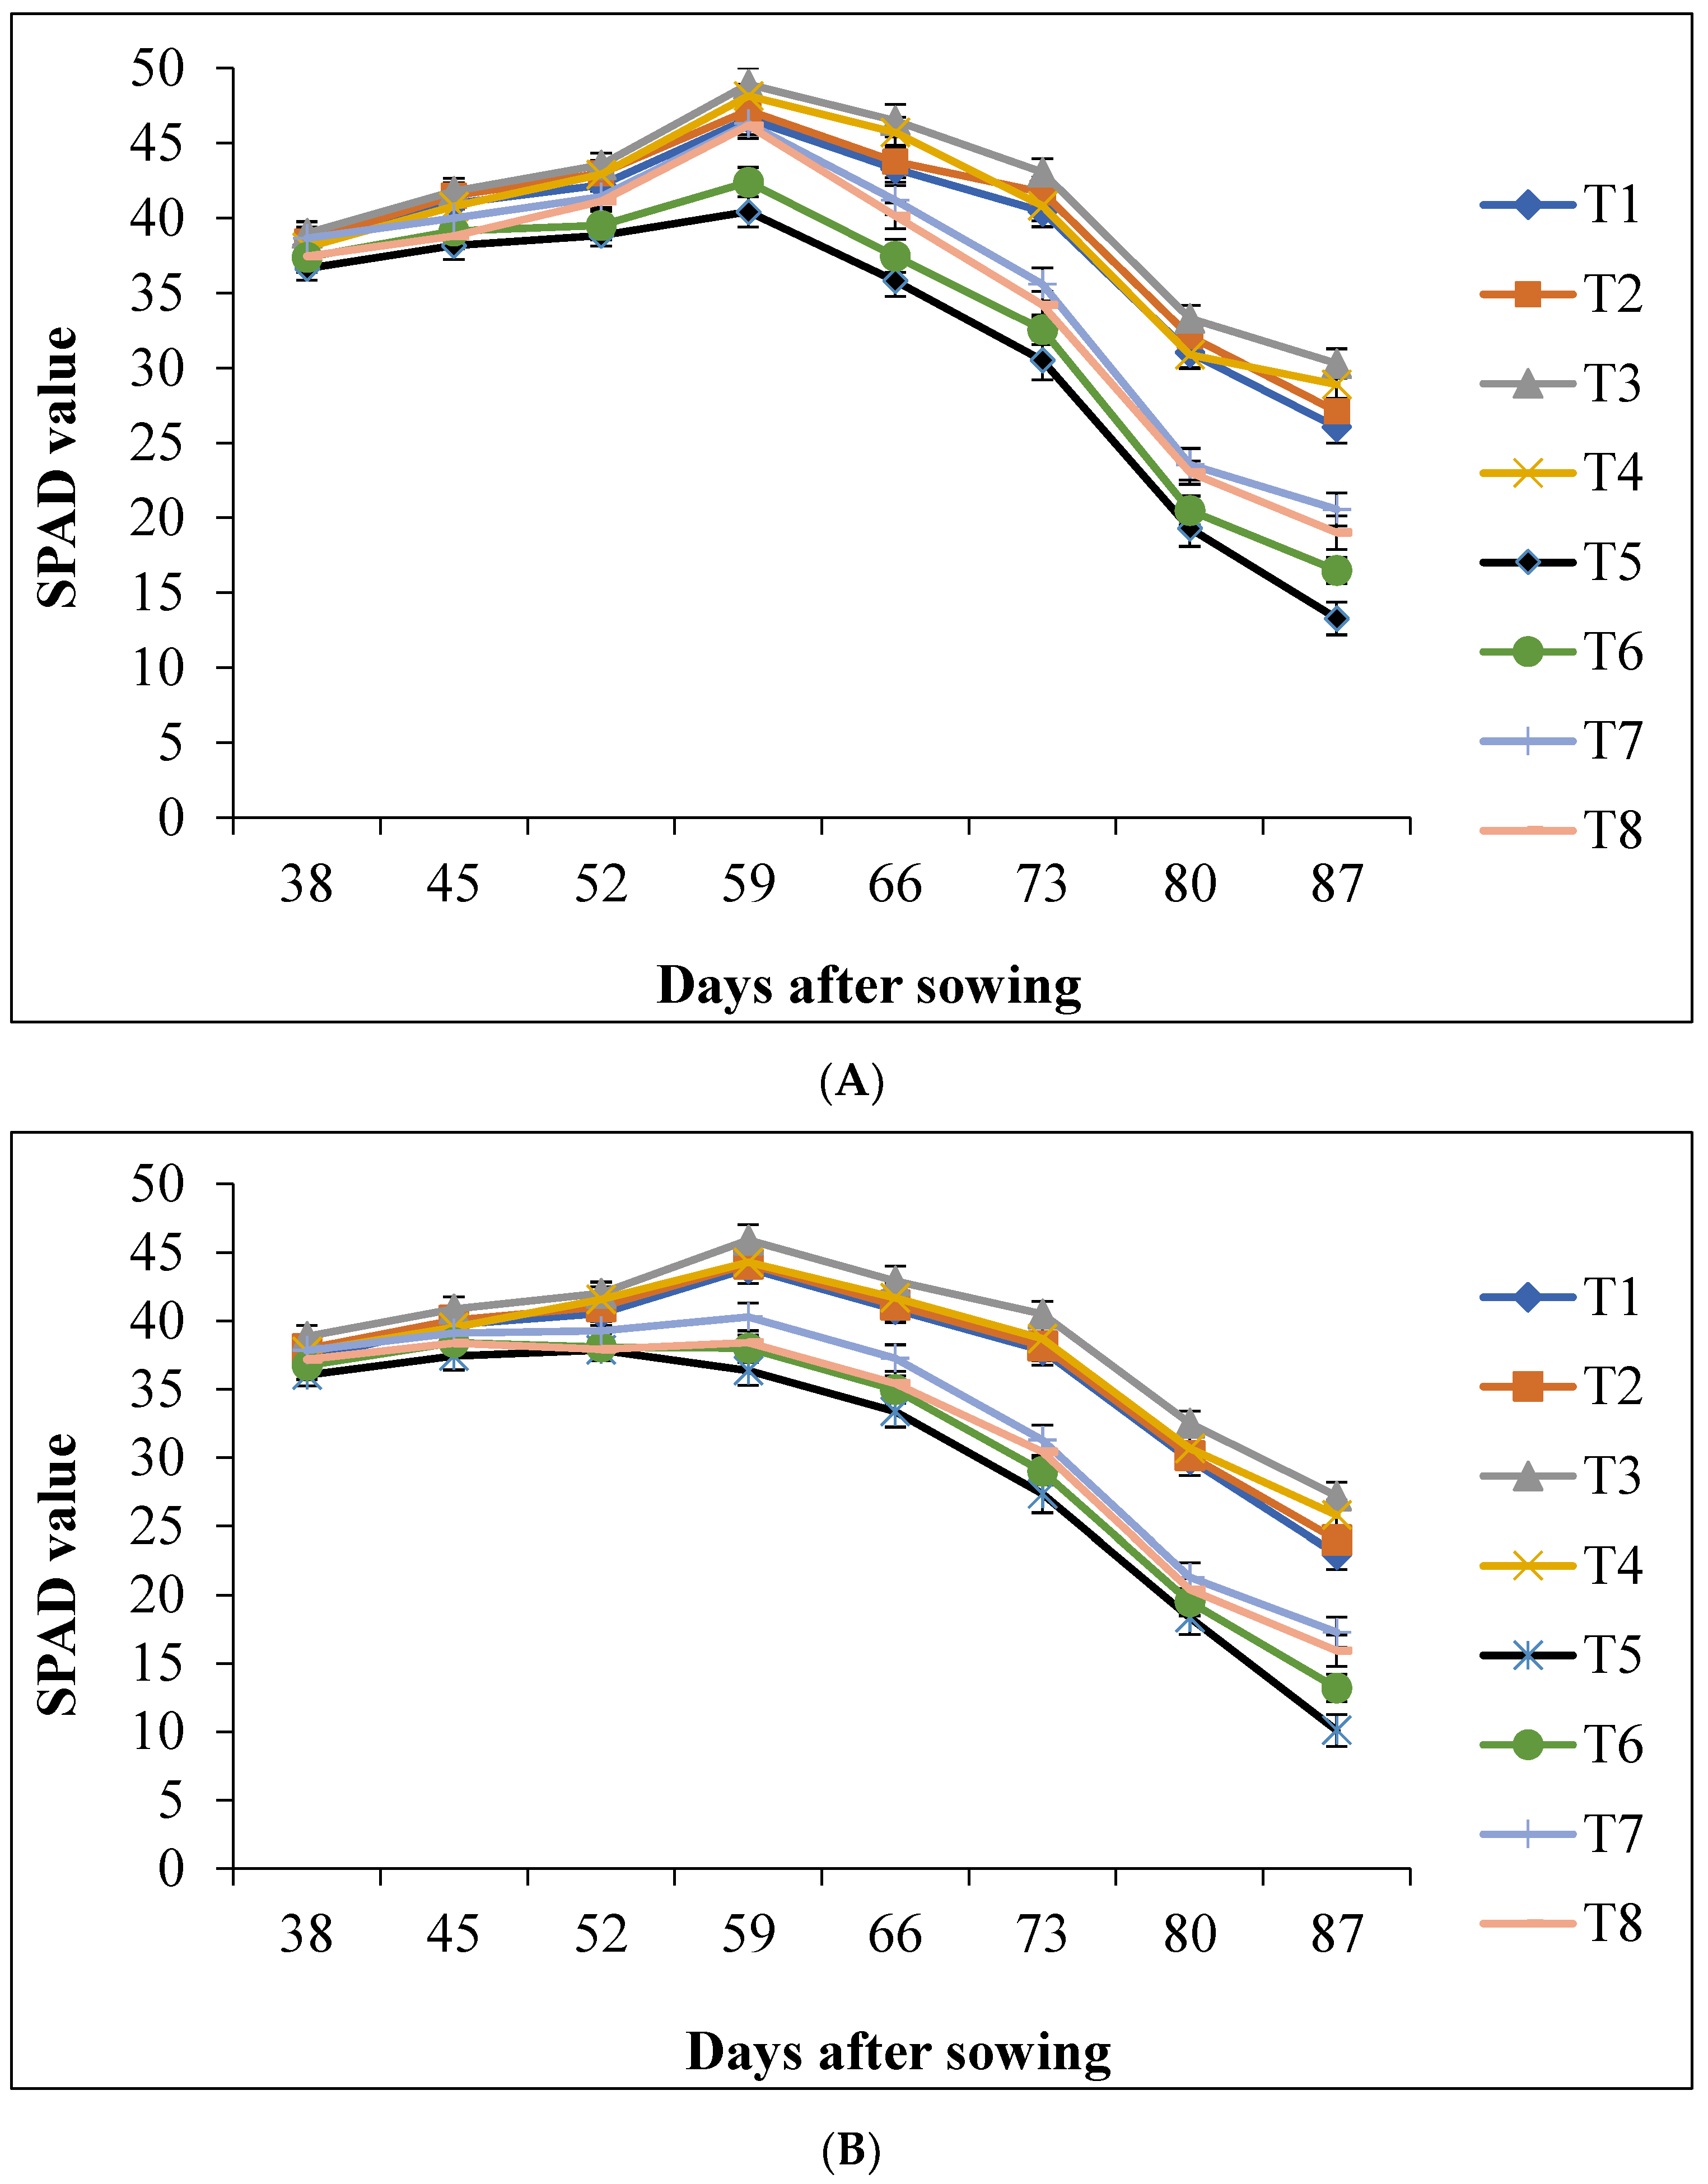
3.4. Chlorophyll Content (SPAD)

The analysis of variance showed that mean squares due to variety (V), salinity (S), salicylic acid (SA) and their interactions were significant (p ≤ 0.05 or p ≤ 0.01) for chlorophyll content (SPAD) at different days after sowing (DAS) (Table 3). The SPAD value of wheat leaves increased with the passage of time up to 59 DAS, then declined gradually (Figure 1A,B). At 59 DAS, the maximum SPAD value for G 200-4 (50.0) and BARI gom-25 (46.0) were found with 1.0 mM SA application. However, salinity significantly reduced the formation of chlorophyll in both the genotypes. On the other hand, the application of SA enhanced the SPAD value of saline-stressed wheat genotypes. During the combined application of salinity and SA, the maximum SPAD value for G 200-4 (46.0) and BARI gom-25 (41.0) were observed with the T7 (12 dSm−1 NaCl + 1.0 mM SA) treatment at 59 DAS of wheat.

3.5. Growth and Biomass of Wheat

The analysis of variance showed that mean squares due to variety (V), salinity (S), salicylic acid (SA) and their interactions were significant (p ≤ 0.05 or p ≤ 0.01) for all characteristics (Table 4). During the application of solely SA, the highest plant height of G 200-4 (71.80 cm) and BARI gom-25 (72.33 cm) were observed with 1.0 mM SA (Table 5). Salinity stress significantly reduced plant height, and the lowest plant height for both genotypes was found with 12 dS m−1. However, the exogenous application of 0.5, 1.0 and 1.5 mM SA to salt-stressed plants enhanced plant height by 7.6, 13.9 and 8.0% for G 200-4 and 7.4, 13.9 and 9.4% for BARI gom-25 compared to plant height in plants treated with salinity alone (Table 5). Salinity also reduced the number of tillers per plant of G 200-4 and BARI gom-25 by 14.2 and 28.0% compared to control. On the other hand, the exogenous application of SA to salt-stressed plants enhanced number of tillers per plant; the highest for G 200-4 (6.01) and for BARI gom-25 (4.89) were recorded with the T7 (12 dSm−1 NaCl + 1.0 mM SA) treatment (Table 5). Table 5 shows that, during the application of solely SA, the highest number of leaves were recorded in G 200-4 (35.50) and BARI gom-25 (36.02) with T3 (1.0 mM SA). Salt stress decreased the number of leaves per plant of G 200-4 and BARI gom-25 by 22.7 and 28.0% compared to control. The exogenous application of SA reduced the effect of salt stress; hence, the highest number of leaves per plant of saline-affected G 200-4 (32.50) and BARI gom-25 (28.61) were recorded with the T7 (12 dS m−1 NaCl + 1.0 mM SA) treatment. Considering salinity at 12 dS m−1, the leaf areas of G 200-4 and BARI gom-25 were reduced by 14 and 23.3%, respectively, compared to control. The application of 0.5, 1.0 and 1.5 mM SA, however, improved the leaf area of saline-affected wheat by 9.1, 20.4 and 17.9% for G 200-4 and 7.4, 16.7 and 15.1% for BARI gom-25 (Table 5). With the absence of salinity, the maximum dry weight per plant of G 200-4 (7.64 g) and BARI gom-25 (6.89 g) were found to be from the 1 mM SA (T3)-treated control plants. Compared to control, the dry weight of G 200-4 and BARI gom-25 were reduced by 23.6 and 39.0% under 12 dS m−1 salinity. On the other hand, the exogenous application of 0.5, 1.0 and 1.5 mM SA to salinity-stressed plants enhanced dry weight by 6.8, 21.1 and 12.4% for G 200-4 and 12.3 and 14.7 and 10.5% for BARI gom-25, compared to plants treated with salinity alone (Table 5).

3.6. Days to Maturity

The results showed that salinity significantly affected the days to maturity of wheat genotypes (Table 5). During the application of solely SA, the highest days to maturity of G 200-4 (104 days) and BARI gom-25 (105 days) were observed with T4 (1.5 mM SA). Contrarily, the lowest days to maturity of G 200-4 (100 days) and BARI gom-25 (98 days) were observed with 12 dS m−1 salinity. The application of SA however, increased the days to maturity of saline-affected wheat. During combined treatment, the highest days to maturity of G 200-4 (103 days) and BARI gom-25 (102 days) were observed with the T8 (12 dS m−1 NaCl + 1.5 mM SA) application.

3.7. Yield-Contributing Parameters and Yield of Wheat

The analysis of variance showed that mean squares due to variety (V), salinity (S), salicylic acid (SA) and their interactions were significant (p ≤ 0.05 or p ≤ 0.01) for all yield-contributing parameters and yield (Table 6). Without salinity stress, the highest plant height of G 200-4 (82.93 cm) and BARI gom-25 (85.90 cm) were observed with 1.0 mM SA (T3) (Table 7). The pllant height of G 200-4 and BARI gom-25 were reduced to 60.83 and 55.70 cm, respectively, under 12 dS m−1 salinity. During the combined application of salinity and SA, the highest plant height of G 200-4 (68.96 cm) and BARI gom-25 (63.90 cm) were recorded with T7 (12 dSm−1 NaCl + 1.0 mM SA). During the application of solely SA, the highest number of total tillers per plant of G 200-4 (7.88) and BARI gom-25 (7.29) were observed with the T4 (1.5 mM SA) treatment (Table 7). Salinity reduced the number of total tillers per plant of G 200-4 and BARI gom-25 by 18.5 and 26.4%, respectively, compared to control. On the other hand, the application of 0.5, 1.0 and 1.5 mM SA on salt-stressed plants substantially increased the number of total tillers per plant by 2.0, 9.6 and 9.6% for G 200-4 and 0.9, 6.9 and 4.5% for BARI gom-25 in comparison with salt-treated plants. In case of the application of solely SA, the highest number of effective tillers per plant of G 200-4 (6.93) and BARI gom-25 (6.55) were recorded with 1.0 mM SA (T3) (Table 7). Salt treatment considerably reduced the number of effective tillers per plant in both genotypes. However, the exogenous application of 0.5, 1.0 and 1.5 mM SA enhanced the number of effective tillers per plant by 9.3, 14.6 and 11.6 for G 200-4 and 13.1, 16.5 and 12.5% for BARI Gom-25 compared to the salt-treated plants. Under non-saline conditions, the highest spike length of G 200-4 (11.23 cm) and BARI gom-25 (10.98 cm) were observed from 1.0 mM SA-treated control plants (Table 7). Salt stress caused a significant reduction in spike length by 16.5% in G 200-4 and by 17.9% in BARI gom-25 compared to control plants. In contrast, the exogenous application of 0.5, 1.0 and 1.5 mM SA enhanced spike length by 1.8, 20.1 and 16.1% for genotype G 200-4 and 9.6, 14.0 and 7.6% for BARI Gom-25 compared to the salt-treated plants.
With 12 dS m−1 salinity, the number of spikelets per spike of G 200-4 and BARI gom-25 were reduced by 13.3 and 17.1%, respectively, compared to control (Table 7). The application of 0.5, 1.0 and 1.5 mM SA on salt-stressed wheat, however, enhanced the number of spikelets per spike by 6.0, 9.8 and 9.2% for G 200-4 and 7.4, 11.0 and 10.99% for BARI gom-25. Salinity stress reduced the number of filled grains per spike by 17.7% for G 200-4 and 19.4% for BARI gom-25 compared to control plants. On the other hand, the exogenous application of different doses of SA enhanced the number of filled grains per spike. However, the highest percent increment of filled grains per spike of G 200-4 (23.9%) and BARI Gom-25 (26.8%) were observed with the T7 (12 dS m−1 NaCl + 1.0 mM SA) treatment. Under non-saline conditions, the lowest number of unfilled grains per spike of G 200-4 (0.12) and BARI gom-25 (0.21) were recorded with 1.0 mM SA. Salinity stress reduced the number of unfilled grains per spike by 98.6% for G 200-4 and and 114.4% for BARI gom-25 in comparison with control. On the other hand, the exogenous application of SA at 0.5, 1.0 and 1.5 mM on salt-stressed wheat reduced the number of unfilled grains per spike by 13.3, 53.6 and 40.7% for G 200-4 and 10.1, 36.9 and 28.7% for BARI gom-25.
The thousand-grain weight of wheat genotypes also decreased due to salinity (Table 7). Salinity stress reduced the 1000-grain weight by 21.4% for G 200-4 and 24.2% for BARI gom-25 compared to control. However, the foliar application of SA enhanced the 1000-grain weight of salt-stressed wheat, while the maximum 1000-grain weight of G 200-4 (43.79 g) and BARI gom-25 (37.40 g) were observed with the T7 (12 dSm−1 NaCl + 1.0 mM SA) treatment. The grain yield of wheat genotypes varied due to salinity and the exogenous application of SA (Table 7). In the absent of salinity, the highest grain yield per plant of G 200-4 (13.41 g) and BARI gom-25 (12.50 g) were recorded with the T3 (1.0 mM SA) treatment. Contrarily, the lowest grain yield per plant of G 200-4 (8.24 g) and BARI gom-25 (7.18 g) were obtained with 12 dS m−1 saline treatment (T5). However, the foliar application of SA to salt-stressed wheat increased grain yield by ameliorating the negative effect of NaCl. Thus, the maximum grain yield of saline-stressed G 200-4 (9.94 g) and BARI gom-25 (8.66 g) were observed with the T7 (12 dSm−1 NaCl + 1.0 mM SA) treatment, which were 20.6% higher in G 200-4 and 20.4% higher in BARI gom-25 compared to salt-stressed plants. The lowest straw yield per plant of G 200-4 (7.09 g) and BARI gom-25 (6.88 g) were obtained with T5 (12 dS m−1 salinity). During combined treatment, the maximum straw yield of G 200-4 (8.44 g) and BARI gom-25 (7.91 g) were recorded with the T7 (12 dSm−1 NaCl + 1.0 mM SA) treatment.

3.8. Ion Accumulation

The analysis of variance showed that mean squares due to variety (V), salinity (S), salicylic acid (SA) and their interactions were significant (p ≤ 0.05 or p ≤ 0.01) for sodium (Na+) and potassium (K+) content in leaves and roots and for their ratio (Table 8). The Na+ concentration in the leaves and roots of both the genotypes were enhanced after the imposition of salt treatment by 92.0 and 20.9% for G 200-4 and 99.6 and 28.5% for BARI gom-25 compared to control plants. On the other hand, the exogenous application of 0.5, 1.0 and 1.5 mM SA to salinity-stressed plants markedly decreased Na+ concentration in leaves (by 21.9, 39.9 and 27.8%) and in roots (by 11.8, 30.5 and 19.6%) for G 200-4 and in leaves (by 23.4, 37.9 and 30.7%) and in roots (by 9.2, 31.5 and 29.1%) for BARI gom-25 compared to salt-treated plants (Table 9). In contrast, due to the imposition of salinity, K+ concentrations in the leaves and roots of both genotypes were reduced by 31.6 and 42.7% for G 200-4 and 36.9 and 49.9% for BARI gom-25 compared to control plants. During the amelioration of saline stress through the application of SA, the highest K+ content in the leaves of G 200-4 (403.2 mM) and BARI gom-25 (383.3 mM) and in the roots of G 200-4 (219.2 mM) and BARI gom-25 (183.7 mM) were recorded with the T7 (12 dS m−1 NaCl + 1.0 mM SA) treatment. The exogenous application of SA had decreased the Na+/K+ ratio in the leaves and roots of both genotypes of wheat under saline and non-saline conditions. During the absence of salinity, the lowest Na+/K+ ratio in the leaves of G 200-4 (0.181) and BARI gom-25 (0.156) and in the roots of G 200-4 (0.411) and BARI gom-25 (0.436) was observed with T3 (1.0 mM SA). On the other hand, salinity stress increased the Na+/K+ ratio in the leaves and roots of wheat and the highest Na+/K+ ratio in leaves of G 200-4 (0.619) and BARI gom-25 (0.675), and in the roots of G 200-4 (1.413) and BARI gom-25 (1.829), the highest ratio was found with T5 (12 dS m−1 salinity). During the combined treatment of SA and salinity, the lowest Na+/K+ ratio in the leaves of G 200-4 (0.306) and BARI gom-25 (0.353) and in ratio of the roots of G 200-4 (0.823) and BARI gom-25 (1.068) was recorded with the T7 (12 dSm−1 NaCl + 1.0 mM SA) treatment.

4. Discussions

4.1. Relative Water Content and Gas Exchange Activities

Although the stress-mitigating roles of SA has largely been analyzed in several crop species, many aspects of exogenous SA-mediated salinity tolerance in wheat remain elusive. In the present study, salinity significantly affected the relative water content (RWC), stomatal conductance and photosynthetic capacity of wheat genotypes (Table 2). In contrast, the exogenous application of SA enhanced RWC and the gas exchange characteristics of wheat. RWC exactly reflects the balance between water absorbed by a plant and water consumed through transpiration [26]. SA might elevate the membrane damages caused by salt stress, hence minimizing water loss by facilitating the adjustment of optimal water status inside the plant tissues by reducing the transpiration rate. Wheat plants exposed to water stress reduced RWC and stomatal conductance compared to those grown under well-watered conditions (Table 2). Stomatal conductance is considered one of the earliest responses to water stress [27], while the decrease in the photosynthetic rate was associated with the stomatal conductance under water stress. The exogenous application of SA alleviated the negative effects of water stress on leaf photosynthesis by increasing RWC and stomatal conductance (Table 2; [28]). As a result, the enhancement of the effects of SA on the RWC and stomatal conductance enhanced its effects on Rubisco enzyme activity and upregulated photosynthetic enzyme activities at the chloroplast level [29].

4.2. Chlorophyll Content (SPAD)

Saline treatment significantly reduced the formation of photosynthetic attributes, such as chlorophyll content, in both genotypes (Figure 1A,B). Our findings are also supported by many other researchers, who have reported that photosynthetic pigments are highly sensitive to salt stress, which inhibits photosynthesis through directly worsening the leaf chlorophyll content or by feigning a photosynthetic apparatus [17,30,31]. Moreover, the higher level of salt in leaves accelerates the activity of chlorophyll-degrading enzymes, namely chlorophyllase, which inhibits chlorophyll synthesis, leading to a decrease in chlorophyll content [32,33]. It was reported that the longer the exposure to salinity stress the higher the decrease in the SPAD value [27]. Our results showed that the application of SA increased the chlorophyll content of saline-affected wheat (Figure 1A,B). SA might assist photosynthesis through the protection of chloroplast pigments from the toxicity probably induced by salinity [34,35]. The application of SA promote a pre-adaptive reaction to salt stress, resulting in the encouragement of defensive responses to photosynthetic pigments, therefore preserving membrane straightness in plants, which reinforces the growth of the plant [5]. Many researchers also observed a significant improvement in chlorophyll content with the application of SA in other plants [30,36,37,38].

4.3. Growth and Biomass of Wheat

The results of our study showed that salinity stress caused a significant reduction in the growth and biomass of both wheat genotypes (Table 5) which might be due to the adverse effect of this salt on the rate of photosynthesis and the reduction of carbohydrates and growth hormones [39]. Salt stress reduced the required number of days for maturity and thus reduced the crop height and leaf area (Table 5; [40]). A reduction in plant height probably resulted from the slow growth caused by osmotic stress imposed by a high concentration of salts in the root zone [30]. Salinity-induced reduction in plant height is a common phenomenon and was also reported earlier for different crops [13,41,42]. Enteshari and Sharifian [43] reported that the cell wall thickening and inhibition of cell elongation were the most common effects, resulting in a reduction in growth and the development of shoots under saline conditions. Salinity reduced tiller numbers, thereby affecting plant growth and productivity (Table 5; [36]). Salt stress during tiller emergence can inhibit their formation and can cause their abortion at later stages. The inhibition of the formation of leaf primordia under salinity stress might be the reason for a lower number of leaves.

4.4. Yield-Contributing Parameters and Yield of Wheat

Table 7 shows that salinity stress caused a significant reduction in yield-contributing parameters and the yield of both wheat genotypes. Salt stress reduced the number and size of leaves, which decreased the rate of photosynthesis, therefore hampering the supply of carbohydrates to meristematic tissues, and finally slowed plant biomass production and yield [44]. Salt stress reduces the availability of soil water, water content in tissue, water-use efficiency, water potential, rate of transpiration, root respiration, hydraulic conductance of root, cell turgidity and osmolyte accumulations, thereby reducing the rate of photosynthesis, biomass accumulation and source–sink activity and finally reduces the yield of crops [2,45]. During the reproductive stage, the unavailability of sufficient photo-assimilates due to salt stress might be the cause of a lower yield of wheat (Table 7 and [46]). However, the exogenous application of SA on salt-stressed G 200-4 and BARI gom-25 reduced the adverse effects of salt stress, which was reflected by a higher yield compared to the plants treated with solely salinity (Table 7 and [47]). Silva et al. [48] stated that SA has the potential to exert a suppressive or stimulative effect on various growth aspects of crops through their direct interference with the enzymatic activities in charge of biosynthesis and/or the catabolism of growth-promoting and -inhibiting substances. SA might improve plant hormonal status, which improves photosynthesis, transpiration and stomatal conductance in plants under stress situations and provides a higher yield. It is reported that SA might act as an endogenous growth controller that increases the leaf area and large-scale production [49,50,51]. Our findings revealed that the SA concentration to achieve the highest number of effective tillers per plant, spike length, spikelets per spike and yield were 1 mM (Table 4 and Table 6). However, in our study, SA at 1 mM concentration was found to be most effective for both wheat genotypes (Table 5 and Table 7). Many researchers reported that a mild dose of SA enhanced the growth and productivity of different crops, whereas a high dose of SA caused an inhibitory effect on the growth of crops [52,53]. Usually, a low dose of SA can improve plant tolerance to adverse conditions; however, a high dose of SA can promote oxidative stress [54,55,56].

4.5. Ion Accumulation

Table 9 shows that salt stress significantly increased Na+ concentrations, decreased K+ concentrations and increased the Na+/K+ ratio in the leaves and roots of both wheat genotypes. Due to excess salinity, plants uptake excessive amount of Na+ ions and inhibit the absorption of essential plant nutrients, leadin to nutrient imbalance in the plants [57,58]. Nutrient imbalance due to salt stress leads Na+ to substitute K+ from the essential binding sites. It is reported that the presence of optimal K+ concentration boosts pyruvate kinase activity up to 400 times, while the substitution of K+ by Na+ causes inhibition of up to 92% [59]. Moreover, optimal K+ concentration regulates peptidyl transferase activity in eukaryotic ribosomes [60]. It was reported that the translocation of K+ from roots to shoots caused increases in the growth and development of wheat [61]. In contrast, excessive Na+ induces Ca2+ deficiency, which leads to lesions on the aerial parts of a plant and reduces leaf dry weight. Excessive Na+ also induces K+ deficiency, leading to reduced shoot growth [61]. However, the exogenous application of SA decreased Na+ concentrations and increased K+ concentrations in the leaves and roots of salt-stressed G 200-4 and BARI gom-25, which resulted in a lowered Na+/K+ ratio (Table 9). The exogenous application of SA on salt-stressed plants might prevent the uptake of excessive salt by inhibiting the influx of passive Na+, eventually enhancing the transportation of other essential ions from roots to shoots to maintain a balanced Na+/K+ ratio [62]. Moreover, SA enhances the H+-ATPase activity in the plasma membrane, which plays a vital role in the higher absorption of K+, Ca2+ and Mg2+ under salt stress and modulates the Na+/K+ ratio to improve salt tolerance [18,63].

5. Conclusions

In the present study, we explored the exogenous SA-induced salt tolerance in wheat. The data of this study clearly revealed that wheat plants suffered from relative water content; gas exchange activities; and growth, yield and chlorophyll reduction, as well as ionic stress from salt exposure. However, the exogenously applied SA increased the salinity tolerance of G 200-4 and BARI gom-25, particularly by reducing the negative effects of salts. These results showed that the spraying of wheat plants with SA improved morpho-physiology, yield components and yield and ion accumulation under saline and non-saline conditions. Therefore, further inclusive research is necessary to explore endogenous SA synthesis, along with better morpho-physiology and the ionic homeostasis of wheat, which is vital to future sustainable crop productivity.

Author Contributions

Conceptualization, M.M.I. and S.A.F.; methodology, M.M.I., M.N.B., G.K.M.M.R., M.M.H. and S.A.F.; validation, M.M.I., M.N.B., G.K.M.M.R. and S.A.F.; formal analysis, S.A.F., T.A.U., E.Z. and M.S.H.; investigation, S.A.F. and T.A.U.; data curation, M.M.I. and S.A.F., S.-N.-U.S., M.B.M. and N.A.J.; writing—original draft preparation, S.A.F., M.M.I., M.A.R.K. and M.A.I.; writing—review and editing, M.Z.U.K., M.A.R., M.M.H. and Y.M.; visualization, M.M.I. and S.A.F.; supervision, M.M.I. and M.N.B.; project administration, M.M.I.; funding acquisition, M.M.I. All authors have read and agreed to the published version of the manuscript.

Funding

This research received no external funding.

Institutional Review Board Statement

Not applicable.

Informed Consent Statement

Not applicable.

Data Availability Statement

The data are contained within the article.

Acknowledgments

Authors would like to extend their sincere appreciation to the Department of Agronomy, Bangabandhu Sheikh Mujibur Rahman Agricultural University, Bangladesh, for the technical support of the research work.

Conflicts of Interest

The authors declare that they have no conflict of interest.

Abbreviations

BSMRAUBangabandhu Sheikh Mujibur Rahman Agricultural University
SASalicylic acid
mMMillimolar
dSm−1Decisiemens per meter
cmCentimeter
G 200-4Genotype 200-4
BARIBangladesh Agricultural Research Institute
Na+Sodium ion
K+Potassium ion
ClChloride ion
ROSReactive oxygen species
NaClSodium chloride
cmCentimeter
LSD Least significant difference
SPADSoil plant analysis development
DASDays after sowing
Ca2+Calcium ion
Mg2+Magnesium ion
CRDCompletely randomized design
DSDays of sowing
ECElectrical conductivity
pHPotential of Hydrogen
DWDry weight
HNO3Nitric acid
HCLO4Perchloric acid
v/vVolume/volume
ANOVAAnalysis of variance
RWCRelative water content
PnPhotosynthetic rate
GsStomatal conductance
AEZAgro-ecological zone

References

  1. Tubiello, F.N.; Salvatore, M.; Rossi, S.; Ferrara, A.; Fitton, N.; Smith, P. The FAOSTAT database of greenhouse gas emissions from agriculture. Environ. Res. Lett. 2013, 8, 015009. [Google Scholar] [CrossRef]
  2. Dos Santos, T.B.; Ribas, A.F.; De Souza, S.G.H.; Budzinski, I.G.F.; Domingues, D.S. Physiological Responses to Drought, Salinity, and Heat Stress in Plants: A Review. Stresses 2022, 2, 113–135. [Google Scholar] [CrossRef]
  3. Morad, M.; Sara, S.; Mohammad, D.; Javad, R.M.; Majid, R. Effect of salicylic acid on alleviation of salt stress on growth and some physiological traits of wheat. Int. J. Biosci. 2013, 3, 20–27. [Google Scholar] [CrossRef]
  4. EL Sabagh, A.; Islam, M.S.; Skalicky, M.; Ali Raza, M.; Singh, K.; Anwar Hossain, M.; Hossain, A.; Mahboob, W.; Iqbal, M.A.; Ratnasekera, D.; et al. Salinity stress in wheat (Triticum aestivum L.) in the changing climate: Adaptation and management strategies. Front. Agron. 2021, 3, 661932. [Google Scholar] [CrossRef]
  5. Alsahli, A.; Mohamed, A.K.; Alaraidh, I.; Al-Ghamdi, A.; Al-Watban, A.; El-Zaidy, M.; Alzahrani, S.M. Salicylic acid alleviates salinity stress through the modulation of biochemical attributes and some key antioxidants in wheat seedlings. Pak. J. Bot. 2019, 51, 1551–1559. [Google Scholar] [CrossRef] [PubMed]
  6. Mguis, K. Morphological, eco-physiological and nutritional behavior of three accessions of Aegilops geniculata (Roth) and a durum wheat cultivar subjected to saline stress. Ph.D. Thesis, University Tunisia, Tunis, Tunisia, 2010. [Google Scholar]
  7. Abhinandan, K.; Skori, L.; Stanic, M.; Hickerson, N.; Jamshed, M.; Samuel, M.A. Abiotic stress signaling in wheat–an inclusive overview of hormonal interactions during abiotic stress responses in wheat. Front. Plant Sci. 2018, 9, 734. [Google Scholar] [CrossRef] [PubMed] [Green Version]
  8. Muhammad, Z.; Hussain, F. Effect of NaCl salinity on the germination and seedling growth of seven wheat genotypes. Pak. J. Bot. 2012, 44, 1845–1850. [Google Scholar]
  9. Ashraf, M. Biotechnological approach of improving plant salt tolerance using antioxidants as markers. Biotechnol. Adv. 2009, 27, 84–93. [Google Scholar] [CrossRef]
  10. Rahnama, A.; James, R.A.; Poustini, K.; Munns, R. Stomatal conductance as a screen for osmotic stress tolerance in durum wheat growing in saline soil. Funct. Plant Biol. 2010, 37, 255–263. [Google Scholar] [CrossRef]
  11. Muchate, N.S.; Nikalje, G.C.; Rajurkar, N.S.; Suprasanna, P.; Nikam, T.D. Plant salt stress: Adaptive responses, tolerance mechanism and bioengineering for salt tolerance. Bot. Rev. 2016, 82, 371–406. [Google Scholar] [CrossRef]
  12. Pirasteh-Anosheh, H.; Ranjbar, G.; Hasanuzzaman, M.; Khanna, K.; Bhardwaj, R.; Ahmad, P. Salicylic acid-mediated regulation of morpho-physiological and yield attributes of wheat and barley plants in deferring salinity stress. J. Plant Growth Regul. 2022, 41, 1291–1303. [Google Scholar] [CrossRef]
  13. Abdi, N.; Van Biljon, A.; Steyn, C.; Labuschagne, M.T. Salicylic acid improves growth and physiological attributes and salt tolerance differentially in two bread wheat cultivars. Plants 2022, 11, 1853. [Google Scholar] [CrossRef] [PubMed]
  14. Chen, S.; Zimei, L.; Cui, J.; Jiangang, D.; Xia, X.; Liu, D.; Yu, J. Alleviation of chilling induced oxidative damage by salicylic acid pretreatment and related gene expression in eggplant seedlings. Plant Growth Regul. 2011, 65, 101–108. [Google Scholar] [CrossRef]
  15. Kang, G.; Li, G.; Zheng, B.; Han, Q.; Wang, C.; Zhu, Y.; Guo, T. Proteomic analysis on salicylic acid-induced salt tolerance in common wheat seedlings (Triticum aestivum L.). Biochim. Biophys. Acta—Proteins Proteom. 2012, 1824, 1324–1333. [Google Scholar] [CrossRef]
  16. Li, G.; Peng, X.; Wei, L.; Kang, G. Salicylic acid increases the contents of glutathione and ascorbate and temporally regulates the related gene expression in salt-stressed wheat seedlings. Gene 2013, 529, 321–325. [Google Scholar] [CrossRef]
  17. Farzana, S.; Rasel, M.; Tahjib-Ul-Arif, M.; Hossain, M.A.; Azam, M.G.; Al Galib, M.A.; Mahamud, A.G.M.S.U.; Hossain, M.A. Salicylic acid and thiourea ameliorate the negative impact of salt stress in wheat (Triticum aestivum L.) seedlings by up-regulating photosynthetic pigments, leaf water status, and antioxidant defense system. J. Phytol. 2021, 13, 130–145. [Google Scholar] [CrossRef]
  18. Abdel-Lattif, H.M.; Abbas, M.S.; Taha, M.H. Effect of salicylic acid on productivity and chemical constituents of some wheat (Triticum aestivum L.) varieties grown under saline conditions. J. Anim. Plant Sci. 2019, 29, 1054–1064. [Google Scholar]
  19. Morton, M.J.; Awlia, M.; Al-Tamimi, N.; Saade, S.; Pailles, Y.; Negrao, S.; Tester, M. Salt stress under the scalpel–dissecting the genetics of salt tolerance. Plant J. 2019, 97, 148–163. [Google Scholar] [CrossRef] [Green Version]
  20. Arora, N.K. Impact of climate change on agriculture production and its sustainable solutions. Environ. Sustain. 2019, 2, 95–96. [Google Scholar] [CrossRef] [Green Version]
  21. FAO. High Level Expert Forum-How to Feed the World in 2050. In Economic and Social Development; Food and Agricultural Organization of the United Nations: Rome, Italy, 2009. [Google Scholar]
  22. Ashik, T.; Islam, M.M.; Rana, M.S.; Jahan, K. Evaluation of salinity tolerant wheat (Triticum aestivum L.) Genotypes through Multivariate Analysis of Agronomic Traits. Agric. Sci. Digest. 2021, 1–7. [Google Scholar] [CrossRef]
  23. Hoagland, D.R.; Arnon, D.I. The water-culture method for growing plants without soil. Circ. Calif. Agric. Exp. Stn. 1950, 347, 32. [Google Scholar]
  24. Schonfeld, M.A.; Johnson, R.C.; Carver, B.F.; Mornhinweg, D.W. Water relations in winter wheat as drought resistance indicator. Crop. Sci. 1988, 28, 526–531. [Google Scholar] [CrossRef]
  25. Rahman, A.; Nahar, K.; Hasanuzzaman, M.; Fujita, M. Calcium supplementation improves Na+/K+ ratio, antioxidant defense and glyoxalase systems in salt-stressed rice seedlings. Front. Plant Sci. 2016, 7, 609. [Google Scholar] [CrossRef] [PubMed]
  26. Fardaus, J.; Matin, M.A.; Hasanuzzaman, M.; Hossain, M.S.; Nath, S.D.; Hossain, M.A.; Rohman, M.M.; Hasanuzzaman, M. Exogenous salicylic acid-mediated physiological responses and improvement in yield by modulating antioxidant defense system of wheat under salinity. Not. Sci. Biol. 2017, 9, 219–232. [Google Scholar] [CrossRef] [Green Version]
  27. Waqas, M.; Yaning, C.; Iqbal, H.; Shareef, M.; Rehman, H.; Yang, Y. Paclobutrazol improves salt tolerance in quinoa: Beyond the stomatal and biochemical interventions. J. Agron. Crop. Sci. 2017, 203, 315–322. [Google Scholar] [CrossRef]
  28. El-Bially, M.; Saudy, H.; El-Metwally, I.; Shahin, M. Efficacy of ascorbic acid as a cofactor for alleviating water deficit impacts and enhancing sunflower yield and irrigation water–use efficiency. Agric. Water Manag. 2018, 208, 132–139. [Google Scholar] [CrossRef]
  29. Rahneshan, Z.; Nasibi, F.; Moghadam, A.A. Effects of salinity stress on some growth, physiological, biochemical parameters and nutrients in two pistachio (Pistacia vera L.) rootstocks. J. Plant Interact. 2018, 13, 73–82. [Google Scholar] [CrossRef] [Green Version]
  30. Biswas, D.; Mannan, M.A.; Karim, M.A.; Miah, M.Y. Amelioration of salinity tolerance in foxtail millet by applying plant growth regulators. Bangladesh Agron. J. 2019, 22, 25–39. [Google Scholar] [CrossRef]
  31. Sharma, A.; Kumar, V.; Shahzad, B.; Ramakrishnan, M.; Sidhu, G.P.S.; Bali, A.S.; Handa, N.; Kapoor, D.; Yadav, P.; Khanna, K.; et al. Photosynthetic response of plants under different abiotic stresses: A review. J. Plant Growth Regul. 2020, 39, 509–531. [Google Scholar] [CrossRef]
  32. Ashraf, M.H.P.J.C.; Harris, P.J. Photosynthesis under stressful environments: An overview. Photosynthetica 2013, 51, 163–190. [Google Scholar] [CrossRef]
  33. Kordrostami, M.; Rabiei, B.; Kumleh, H.H. Biochemical, physiological and molecular evaluation of rice cultivars differing in salt tolerance at the seedling stage. Physiol. Mol. Biol. Plants 2017, 23, 529–544. [Google Scholar] [CrossRef] [PubMed]
  34. Foyer, C.H.; Shigeoka, S. Understanding oxidative stress and antioxidant functions to enhance photosynthesis. Plant Physiol. 2011, 155, 93–100. [Google Scholar] [CrossRef] [PubMed] [Green Version]
  35. Amin, A.A.; Abd El-Kader, A.A.; Abouziena, H.F.; El-Awadi, M.; Gharib, F.A. Effects of benzoic acid and thiourea on growth and productivity of wheat (Triticum aestivum L.) plants. Int. Sci. Res. J. 2016, 72, 132–149. [Google Scholar]
  36. Suhaib, M.; Ahmad, I.; Munir, M.; Iqbal, M.B.; Abuzar, M.K.; Ali, S. Salicylic acid induced and ionic efficiency in wheat under salt stress. Pak. J. Agric. Sci. 2018, 31, 79–85. [Google Scholar] [CrossRef]
  37. Khan, M.I.; Shoukat, M.A.; Cheema, S.A.; Ali, S.; Azam, M.; Rizwan, M.; Al-Wabel, M.I. Foliar-and soil-applied salicylic acid and bagasse compost addition to soil reduced deleterious effects of salinity on wheat. Arab. J. Geosci. 2019, 12, 78. [Google Scholar] [CrossRef]
  38. Loutfy, N.; Sakuma, Y.; Gupta, D.K.; Inouhe, M. Modifications of water status, growth rate and antioxidant system in two wheat cultivars as affected by salinity stress and salicylic acid. J. Plant Res. 2020, 133, 549–570. [Google Scholar] [CrossRef]
  39. Mazher, A.A.; El-Quesni, E.F.; Farahat, M.M. Responses of ornamental and woody trees to salinity. World J. Agric. Sci. 2007, 3, 386–395. [Google Scholar]
  40. Ahmad, M.; Shahzad, A.; Iqbal, M.; Asif, M.; Hirani, A.H. Morphological and molecular genetic variation in wheat for salinity tolerance at germination and early seedling stage. Austral. J. Crop. Sci. 2013, 7, 66–74. [Google Scholar]
  41. Sanaullah, T.; Wahid, A.; Sadia, B.; Hanif, A.; Maqbool, N.; Arshad, T.; Kabir, Z. Exogenous application of thiourea ameliorates salt stress effects by alleviation of oxidative damage in hybrid maize. J. Agric. Sci. Technol. 2016, 6, 220–231. [Google Scholar] [CrossRef]
  42. Khanam, T.; Akhtar, N.; Halim, M.A.; Hossain, F. Effect of irrigation salinity on the growth and yield of two Aus rice cultivars of Bangladesh. Jahangirnagar Univ. J. Biol. Sci. 2018, 7, 1–12. [Google Scholar] [CrossRef] [Green Version]
  43. Enteshari, S.; Sharifian, S. Influence of salicylic acid on growth and some biochemical parameters in a C4 plant (Panicum miliaceum L.) under saline conditions. Afr. J. Biotechnol. 2012, 11, 621–627. [Google Scholar] [CrossRef]
  44. Hussain, H.A.; Hussain, S.; Khaliq, A.; Ashraf, U.; Anjum, S.A.; Men, S.; Wang, L. Chilling and drought stresses in crop plants: Implications, cross talk, and potential management opportunities. Front. Plant Sci. 2018, 9, 393. [Google Scholar] [CrossRef] [PubMed]
  45. Khataar, M.; Mohammadi, M.H.; Shabani, F. Soil salinity and matric potential interaction on water use, water use efficiency and yield response factor of bean and wheat. Sci. Rep. 2018, 8, 2679. [Google Scholar] [CrossRef] [PubMed] [Green Version]
  46. Sharbatkhari, M.; Shobbar, Z.S.; Galeshi, S.; Nakhoda, B. Wheat stem reserves and salinity tolerance: Molecular dissection of fructan biosynthesis and remobilization to grains. Planta 2016, 244, 191–202. [Google Scholar] [CrossRef] [PubMed]
  47. Nie, W.; Gong, B.; Chen, Y.; Wang, J.; Wei, M.; Shi, Q. Photosynthetic capacity, ion homeostasis and reactive oxygen metabolism were involved in exogenous salicylic acid increasing cucumber seedlings tolerance to alkaline stress. Sci. Hortic. 2018, 235, 413–423. [Google Scholar] [CrossRef]
  48. Silva, A.A.R.D.; Lima, G.S.D.; Azevedo, C.A.V.D.; Veloso, L.L.D.S.A.; Gheyi, H.R. Salicylic acid as an attenuator of salt stress in soursop. Rev. Caatinga. 2020, 33, 1092–1101. [Google Scholar] [CrossRef]
  49. Desoky, E.S.M.; Merwad, A.R.M. Improving the salinity tolerance in wheat plants using salicylic and ascorbic acids. J. Agric. Sci. 2015, 7, 203. [Google Scholar] [CrossRef] [Green Version]
  50. Jini, D.; Joseph, B. Physiological mechanism of salicylic acid for alleviation of salt stress in rice. Rice Sci. 2017, 24, 97–108. [Google Scholar] [CrossRef]
  51. Fardus, J.; Matin, M.A.; Hasanuzzaman, M.; Hossain, M.A.; Hasanuzzaman, M. Salicylic acid-induced improvement in germination and growth parameters of wheat under salinity stress. J. Anim. Plant Sci. 2018, 28, 197–207. [Google Scholar]
  52. Iqbal, M.; Ashraf, M. Wheat seed priming in relation to salt tolerance: Growth, yield and levels of free salicylic acid and polyamines. Ann. Bot. Fenn 2006, 43, 250–259. [Google Scholar]
  53. Khan, M.I.R.; Fatma, M.; Per, T.S.; Anjum, N.A.; Khan, N.A. Salicylic acid-induced abiotic stress tolerance and underlying mechanisms in plants. Front. Plant Sci. 2015, 6, 462. [Google Scholar] [CrossRef] [PubMed] [Green Version]
  54. Guo, Q.; Meng, L.; Mao, P.C.; Jia, Y.Q.; Shi, Y.J. Role of exogenous salicylic acid in alleviating cadmium-induced toxicity in Kentucky bluegrass. Biochem. Syst. Ecol. 2013, 50, 269–276. [Google Scholar] [CrossRef]
  55. Koc, E.; Ustun, A.S.; Celik, N. Effect of exogenously applied salicylic acid on cadmium chloride-induced oxidative stress and nitrogen metabolism in tomato (Lycopersicon esculentum L.). Turk. J. Biol. 2013, 37, 361–369. [Google Scholar]
  56. Yan, S.; Dong, X. Perception of the plant immune signal salicylic acid. Curr. Opin. Plant Biol. 2014, 20, 64–68. [Google Scholar] [CrossRef] [Green Version]
  57. Assaha, D.V.; Ueda, A.; Saneoka, H.; Al-Yahyai, R.; Yaish, M.W. The role of Na+ and K+ transporters in salt stress adaptation in glycophytes. Front. Physiol. 2017, 8, 509. [Google Scholar] [CrossRef] [Green Version]
  58. Sa, G.; Yao, J.; Deng, C.; Liu, J.; Zhang, Y.; Zhu, Z.; Zhang, Y.; Ma, X.; Zhao, R.; Lin, S.; et al. Amelioration of nitrate uptake under salt stress by ectomycorrhiza with and without a Hartig net. New Phytol. 2019, 222, 1951–1964. [Google Scholar] [CrossRef]
  59. Hafez, E.M. Influence of salicylic acid on ion distribution, enzymatic activity and some agromorphological characteristics of wheat under salt-affected soil. Egypt. J. Agron. 2016, 38, 455–469. [Google Scholar] [CrossRef] [Green Version]
  60. Abbas, M.; Nawaz, S.; Ahmed, N.; Abbas, G.; Usman, M.; Bashir, H.M.N.; Ali, A. Salicylic acid in amelioration of salt tolerance in wheat (Triticum aestivum L.) under in vitro conditions. Int. J. Earth Sci. 2016, 3, 44–49. [Google Scholar]
  61. Noreen, S.; Fatima, K.; Athar, H.U.R.; Ahmad, S.; Hussain, K. Enhancement of physio-biochemical parameters of wheat through exogenous application of salicylic acid under drought stress. J. Anim. Plant Sci. 2017, 27, 153–163. [Google Scholar]
  62. Liu, S.; Dong, Y.; Xu, L.; Kong, J. Effects of foliar applications of nitric oxide and salicylic acid on salt-induced changes in photosynthesis and antioxidative metabolism of cotton seedlings. Plant Growth Regul. 2014, 73, 67–78. [Google Scholar] [CrossRef]
  63. Nazar, R.; Iqbal, N.; Syeed, S.; Khan, N.A. Salicylic acid alleviates decreases in photosynthesis under salt stress by enhancing nitrogen and sulfur assimilation and antioxidant metabolism differentially in two mungbean cultivars. J. Plant Physiol. 2011, 168, 807–815. [Google Scholar] [CrossRef] [PubMed]
Figure 1. Chlorophyll content (SPAD) of G 200-4 (A) and BARI gom-25 (B) over time under salicylic acid application for wheat grown under non-saline and saline conditions. The vertical bar indicates average data of five independent replicates (n = 5). Error bars represent standard error.
Agronomy 13 00025 g001
Table 1. Analysis of the variance of the data of relative water content, photosynthetic rate and stomatal conductance of wheat under non-saline, saline conditions and different salicylic acid levels.
Sources of VariationDFMean Square Values
Relative Water Content (%)Photosynthetic Rate (µmol m−2s−1)Stomatal Conductance (mmol m−2s−1)
Variety (V) 1586.094 *3.20192 *0.0096 *
Salinity (S)12738.63 *166.201 *0.093 *
Variety × salinity1322.988 *0.389 *0.0008 *
Salicylic acid (SA)360.2644 *1.677 *0.0005 *
Variety × SA30.420683 *0.051 *0.000008 *
Salinity × SA317.1832 *0.025 *0.00009 *
V × S × SA30.0311 **0.0018 *0.00004 **
Error481.645640.5760.00005
* and ** indicate significance at 0.05 and 0.01 levels of probability, respectively.
Table 2. Foliar application of salicylic acid regulates the relative water content, photosynthetic rate and stomatal conductance of wheat under non-saline and saline conditions.
VarietyTreatmentRelative Water Content (%)Photosynthetic Rate (µmol m−2s−1)Stomatal Conductance (mmol m−2s−1)
BU 200-4ControlT184.025 cd15.654 ab0.258 c
0.5 mM SAT285.368 ab16.005 ab0.261 b
1 mM SAT386.573 a16.440 a0.267a
1.5 mM SAT484.853 bc15.740 ab0.263 b
Salinity (12 dS m−1)T573.640 h12.268 cd0.185 j
Salinity + 0.5 mM SAT677.883 g12.520 cd0.192 h
Salinity + 1 mM SAT780.450 f13.175 c0.205 g
Salinity + 1.5 mM SAT874.485 h12.360 cd0.189 i
BARI gom-25ControlT182.753 e15.110 b0.241 f
0.5 mM SAT283.798 cde15.380 b0.244 e
1 mM SAT384.698 bc15.698 ab0.248 d
1.5 mM SAT483.333 de15.238 b0.245 e
Salinity (12 dS m−1)T563.458 k12.085 d0.155 m
Salinity + 0.5 mM SAT667.433 j12.230 cd0.160 l
Salinity + 1 mM SAT769.323 i12.710 cd0.171 k
Salinity + 1.5 mM SAT864.064 k12.133 d0.159 l
Data are presented with mean values of five independent replicates (n = 5). Differences among the treatments were analyzed by Tukey’s test: p < 0.05. Different letters in the same column indicate significant differences, and the same letter indicates no significant differences between the treatments.
Table 3. Analysis of variance of the data on the chlorophyll content (SPAD) of wheat under non-saline, saline conditions and different salicylic acid levels at different days after sowing.
Sources of VariationDFMean Square Values
38 DAS45 DAS52 DAS59 DAS66 DAS73 DAS80 DAS87 DAS
Variety (V) 14.46314.78450.8690 *305.988 *173.712 *165.573 *30.581 *160.643
Salinity (S)114.30761.898129.795 *414.631 *630.010 *1236.40 *1789.29 *1866.28 *
Variety × salinity10.054 *1.102 *0.4196 *22.920 **0.203 *3.950 *1.82 **0.0627 *
Salicylic acid (SA)36.625 *5.478 *8.312 *38.171 *40.645 *35.274 *26.103 *101.445 *
Variety × SA30.143 **0.041 **0.650 *4.568 *3.531 *0.448 *0.1704 *0.0092 *
Salinity × SA30.560 *0.735 *1.431 *7.321 *2.965 *5.576 *4.870 *7.755 *
V × S × SA30.201 **0.121 *1.392 *1.625 **0.1363 **0.739 **2.373 *0.0092 **
Error482.7311.5181.6332.1111.7201.6301.1260.514
* and ** indicate significance at 0.05 and 0.01 levels of probability, respectively.
Table 4. Analysis of variance of the data of agro-morphological characteristics of wheat under non-saline, saline conditions and different salicylic acid levels at the vegetative stage (60 days after sowing).
Sources of VariationDFMean Square Values
Plant Height (cm)No of Tillers/PlantLeaf Number/PlantLeaf Areas (cm2)Dry Weight (g)/PlantDays to Maturity
Variety (V)1151.936 *7.459 *22.314 *3139.64 *13.829 *0.0156 *
Salinity (S)12464.75 *36.466 *777.503 *20908.4 *71.170 *141.016 *
Variety × salinity1193.106 **1.880 *58.122 *261.711 **1.425 *19.141 *
Salicylic acid (SA)3116.341 *3.307 *69.951 *2307.60 *3.228 *12.516 *
Variety × SA30.296 *0.027 *0.596 *18.822 *0.173 *0.057 *
Salinity × SA33.554 *0.174 *13.708 *512.809 *0.152 *16.474 *
V × S × SA30.334 **0.014 **0.758 **0.659 *0.046 *0.599 *
Error481.5350.0370.3772.74060.0511.036
* and ** indicate significance at 0.05 and 0.01 levels of probability, respectively.
Table 5. Foliar application of salicylic acid regulates agro-morphological parameters of wheat under non-saline and saline conditions at vegetative stage (60 days after sowing).
VarietyTreatmentPlant Height (cm)No of Tillers/PlantLeaf Number/PlantLeaf Area (cm2)Dry Weight (g)/PlantDays to Maturity
BU 200-4ControlT165.90 d6.00 de33.00 cd106.26 g6.13 c103.50 b
0.5 mM SAT267.95 bc6.50 c33.25 c139.00 c6.74 b102.50 c
1 mM SAT371.80 a7.25 a35.50 a146.05 a7.64 a102.00 c
1.5 mM SAT468.93 b7.25 a34.50 b141.66 b7.36 a104.00 a
Salinity (12 dS m−1)T555.60 gh5.15 fg25.50 i90.42 i4.68 g99.50 e
Salinity + 0.5 mM SAT659.85 f5.40 f26.75 h98.65 h5.00 f100.50 d
Salinity + 1 mM SAT763.33 e6.01 de32.50 d108.90 f5.67 e102.00 c
Salinity + 1.5 mM SAT860.05 f5.78 e31.25 e106.57 g5.26 f102.50 c
BARI gom-25ControlT166.58 cd5.81 e33.42 c98.69 h5.91 de105.00 a
0.5 mM SAT268.12 bc6.22 d34.16 b129.31 e6.12 c103.50 b
1 mM SAT372.33 a6.81 b36.02 a134.52 d6.89 b102.75 c
1.5 mM SAT469.12 b6.80 b35.55 a130.59 e6.42 c105.00 a
Salinity (12 dS m−1)T549.36 j4.18 i23.16 k75.66 l3.61 j97.75 f
Salinity + 0.5 mM SAT653.02 i4.35 i24.22 j81.25 k3.81 ij99.25 e
Salinity + 1 mM SAT756.22 g4.89 gh28.61 f88.32 j4.31 h101.25 c
Salinity + 1.5 mM SAT854.01 hi4.81 h27.66 g87.10 j4.01 i101.75 cd
Data are presented with mean values of five independent replicates (n = 5). Differences among the treatments were analyzed by Tukey’s test: p < 0.05. Different letters in the same column indicate significant differences, and the same letter indicates no significant differences between the treatments.
Table 6. Analysis of variance of the data of yield-contributing parameters and yield of wheat under non-saline, saline conditions and different salicylic acid levels.
Sources of VariationDFMean Square Values
Plant Height (cm)Total Tillers Per PlantEffective Tillers Per PlantSpike Length (cm)No. of Spikelets/SpikeFilled Grains/SpikeUnfilled Grains/SpikeThousand-Grain Weight (g)Grain Yield (g)/PlantStraw Yield (g)/Plant
Variety (V) 130.802 *6.663 *3.432 *6.3397 *41.433 *222.700 *0.167500.948 *16.221 *5.475 *
Salinity (S)15322.80 *41.845 *46.581 *22.369 *70.241 *434.592 *0.880 *1655.63 *242.888 *543.123 *
Variety × salinity1257.282 **1.095 *0.084 *1.804 *0.925 *0.000004 **0.042 *0.323 *0.570 *12.531 *
Salicylic acid (SA)3103.695 *0.893 *1.215 *3.229 *4.226 *121.780 *0.110 *35.379 *5.759 *4.051 *
Variety × SA37.881 *0.066 *0.004 *0.086 *0.020 *0.00005 *0.002 *1.086 *0.069 *0.025 *
Salinity × SA332.565 *0.024 *0.303 *0.686 *1.462 *15.506 *0.032 *4.729 *0.146 *0.028 *
V × S × SA34.156 **0.004 *0.023 *0.162 *0.003 **0.00002 **0.002 *0.064 *0.0101 **0.063 **
Error481.7560.05410.0220.05110.3411.0160.0031.1670.1760.135
* and ** indicate significant at 0.05 and 0.01 levels of probability respectively.
Table 7. Effects of salicylic acid on yield contributing parameters and yield of wheat under non-saline and saline conditions.
VarietyTreatmentPlant Height (cm)Total Tillers/PlantEffective Tillers/PlantSpike Length (cm)No. of Spikelets/SpikeFilled Grains/SpikeUnfilled Grains/SpikeThousand-Grain Weight (g)Grain Yield (g)/PlantStraw Yield (g)/Plant
BU 200-4ControlT179.21 d7.14 bc6.29 c10.64 cd19.02 bc41.99 c0.27 ef50.37 c12.01 cd12.08 f
0.5 mM SAT279.59 d7.33 b6.88 a10.92 bc19.56 ab43.11 b0.19 gh52.29 b12.67 b12.33 ef
1 mM SAT382.93 b7.63 a6.93 a11.23 a19.87 a46.73 a0.12 h54.30 a13.41 a13.16 cd
1.5 mM SAT480.49 cd7.88 a6.28 c10.74 bc19.06 bc42.93 bc0.25 efg50.91 c12.96 ab12.79 de
Salinity (12 dS m−1)T560.83 g5.82 e4.55 g8.88 h16.49 f34.55 g0.53 bc39.61 h8.24 hi7.09 jk
Salinity + 0.5 mM SAT667.81 e5.93 e4.98 f10.28 e17.48 e36.85 f0.46 cd41.81 g8.70 h7.29 ijk
Salinity + 1 mM SAT768.96 e6.38 d5.22 e10.67 cd18.11 de42.82 bc0.25 efg43.79 f9.94 f8.44 g
Salinity + 1.5 mM SAT867.69 e6.38 d5.08 ef10.31 e18.01 de39.69 d0.32 e42.53 g9.34 g7.77 hi
BARI gom-25ControlT181.85 bc6.88 c6.00 d10.24 e17.60 e38.26 e0.31 e45.20 e11.42 e13.55 bc
0.5 mM SAT284.95 a6.97 c6.35 bc10.72 bc18.22 de39.38 d0.25 efg46.30 e11.80 de13.91 b
1 mM SAT385.90 a7.26 b6.55 b10.98 ab18.40 cd43.00 b0.21 fg48.50 d12.50 bc14.72 a
1.5 mM SAT480.00 cd7.29 b5.90 d10.41 de17.81 de39.20 de0.25 efg46.05 e12.06 cd14.06 b
Salinity (12 dS m−1)T555.70 h5.06 g4.00 h8.41 i14.60 h30.82 i0.67 a34.25 k7.18 k6.88 k
Salinity + 0.5 mM SAT662.55 fg5.11 g4.53 g9.22 g15.68 g33.12 h0.60 ab35.83 j7.59 jk7.06 jk
Salinity + 1 mM SAT763.90 f5.41 f4.66 g9.59 f16.21 fg39.09 de0.42 d37.40 i8.66 h7.91 h
Salinity + 1.5 mM SAT861.55 g5.29 fg4.50 g9.06 gh16.20 fg35.96 f0.48 cd37.30 i8.01 ij7.55 hij
Data are presented with mean values of five independent replicates (n = 5). Differences among the treatments were analyzed by Tukey’s test: p < 0.05. Different letters in the same column indicate significant differences, and the same letter indicates no significant differences between the treatments.
Table 8. Analysis of variance of the data of leaves’ and roots’ Na+ and K+ content and the Na+/K+ ratio of wheat under non-saline, saline conditions and different salicylic acid levels.
Sources of VariationDFMean Square Values
%Na+%K+Na+/K+
LeavesRootsLeavesRootsLeavesRoots
Variety (V) 1280.206 *2421.61 *718.935 *2843.74 *0.00395 *0.413 *
Salinity (S)175,872.3 *35,653.5 *336,840.0 *529,799.0 *1.209 *9.351 *
Variety × salinity1346.322 *387.114 *7703.73 *6158.93 *0.0122 *0.339 *
Salicylic acid (SA)37779.93 *16,360.4 *4174.71 *8035.60 *0.0978 *0.692 *
Variety × SA323.4053 *371.237 *61.1594 *74.001 *0.0001 *0.0168 *
Salinity × SA32686.11 *955.824 *2345.17 *2379.39 *0.0541 *0.129 *
V × S × SA376.9926 *204.659 *66.5672 **187.345 *0.00032 **0.0091 *
Error4860.4481144.617387.27625.3130.000870.0040
* and ** indicate significance at 0.05 and 0.01 levels of probability, respectively.
Table 9. Foliar application of salicylic acid regulates leaves’ and roots’ Na+ and K+ content and Na+/K+ ratio of wheat under non-saline and saline conditions.
VarietyTreatmentsmM (Na+)mM (K+)Na+/K+
LeavesRootsLeavesRootsLeavesRoots
BU 200-4ControlT1106.7 hi214.7 cde483.4 c320.6 e0.221 h0.670 g
0.5 mM SAT290.9 jk174.4 ijk493.5 bc359.7 d0.184 hij0.485 h
1 mM SA T389.3 jk159.3 k494.4 bc388.0 b0.181 ij0.411 h
1.5 mM SAT492.2 j160.0 k491.8 bc377.5 c0.188 hij0.424 h
Salinity (12 dS m−1)T5204.9 b259.5 b330.7 gh183.7 i0.619 b1.413 c
Salinity + 0.5 mM SAT6160.1 cd228.9 c355.4 fg193.8 h0.450 cd1.181 d
Salinity + 1 mM SAT7123.2 g180.5 hij403.2 d219.2 g0.306 g0.823 f
Salinity + 1.5 mM SAT8148.0 e208.8 def381.2 de199.8 h0.388 ef1.045 e
BARI gom-25ControlT1109.2 h222.7 cd512.3 ab312.0 f0.213 hi0.714 g
0.5 mM SAT290.3 jk186.7 ghi521.7 a348.9 c0.173 j0.535 h
1 mM SA T381.4 k161.8 k522.5 a370.9 a0.156 j0.436 h
1.5 mM SAT496.4 ij165.3 jk521.2 a362.3 b0.185 hij0.456 h
Salinity (12 dS m−1)T5217.9 a286.2 a323.0 h156.4 k0.675 a1.829 a
Salinity + 0.5 mM SAT6167.0 c259.8 b346.1 fgh166.3 j0.483 c1.562 b
Salinity + 1 mM SAT7135.4 f196.2 fgh383.3 d183.7 i0.353 f1.068 e
Salinity + 1.5 mM SAT8151.1 de202.8 efg357.1 ef165.8 j0.423 de1.223 d
Data are presented with mean values of five independent replicates (n = 5). Differences among the treatments were analyzed by Tukey’s test: p < 0.05. Different letters in the same column indicate significant differences, and the same letter indicates no significant differences between the treatments.
Disclaimer/Publisher’s Note: The statements, opinions and data contained in all publications are solely those of the individual author(s) and contributor(s) and not of MDPI and/or the editor(s). MDPI and/or the editor(s) disclaim responsibility for any injury to people or property resulting from any ideas, methods, instructions or products referred to in the content.

