Article

Light Intensity and Growth Media Influence Growth, Nutrition, and Phytochemical Content in Trachyandra divaricata Kunth

by
Ayakha Tshayingwe
,
Muhali Olaide Jimoh
,
Avela Sogoni
,
Carolyn Margaret Wilmot
and
Charles Petrus Laubscher
*
Department of Horticultural Sciences, Faculty of Applied Sciences, Cape Peninsula University of Technology, Bellville, Cape Town 7535, South Africa
*
Author to whom correspondence should be addressed.
Agronomy 2023, 13(1), 247; https://doi.org/10.3390/agronomy13010247
Submission received: 10 November 2022 / Revised: 6 January 2023 / Accepted: 9 January 2023 / Published: 13 January 2023
(This article belongs to the Special Issue Growth Control of Plants on the Light Environment)

Abstract

:
Trachyandra divaricata (Sandkool) is one of the most abundant wild edible inflorescence vegetables in South Africa. The dearth of literature on its edibility, nutrient composition, and conservation has contributed to its underutilisation. This study investigated mineral and proximate content, phytochemical compositions, and growth response of T. divaricata to light intensity and soilless media. Treatments comprised four media (LECA clay, silica sand, peat, and vermiculite) which were subjected to different shade levels (no shade, 20, 40, 60, and 80%) created from a factory-made 20% density net by doubling (40%), tripling (60%), and quadrupling (80%). All treatments were irrigated with a standard nutrient solution. The results showed that the treatments impacted the yield of T. divaricata significantly in terms of biomass and flower buds, especially in plants cultivated in peat under normal greenhouse lighting (no shade). Conversely, plants developed significantly more specific leaf size and total chlorophyll content under shade levels (20, 40, 60, and 80%) in different growth media, even though the values were comparable among treatments. The highest Ca, Mg, Cu, Fe, and Mn levels were consistently recorded in flowers of T. divaricata grown in LECA clay under 80% shade level, while other minerals varied in tested treatments. The peat medium under 20% shade optimised the neutral detergent fibre (NDF) and acid detergent fibre (ADF) content of the flowers, whereas both fat and protein contents were greatly enhanced by peat and vermiculite, respectively, under the 80% shade. Consistently, the lowest phytochemical contents were recorded in LECA clay subjected to 80% shade, whereas the highest polyphenols and DPPH antioxidants were produced by silica sand medium treated with 20% shade. Both TEAC and FRAP antioxidants were improved significantly in LECA clay under no shade and the 60% shade level. However, both 20% and 60% shade levels enhanced the flavonol content significantly. On the basis of these findings, T. divaricata is a promising inflorescent vegetable that may be considered for domestication and further research due to its potential pharmacological and nutraceutical values.

1. Introduction

Plants are subjected to a variety of abiotic stresses such as variable light intensity, fluctuating temperatures, water scarcity, salinity, heavy metals, and mechanical injuries and herbivory [1,2]. In most cases, plants are subjected to multiple stresses at the same time, and thus they have evolved sophisticated defence mechanisms to recognise and adapt to a wide range of stresses [3]. Hence, understanding their physiological processes and defence mechanisms is of critical importance for plant science research. Light and moisture are two environmental factors that have a significant impact on plant growth and development [4]. Light is the second most important ecological factor influencing plant growth, production, and survival, as it plays a significant role in determining photosynthetic efficiency in plants [5]. Moisture, which is determined by soil structure, is one of the most important growth-limiting factors in crop production and one of the most important factors in physiological reactions [6].
Many studies have revealed that the quality and intensity of light received in a specific leaf area largely stimulates the growth and development and induces physiological alterations to chloroplast ultra-structure, which in turn affects the process of photosynthesis in plants [7,8,9]. Plants alter their morphology and physiological processes in response to changes in electromagnetic spectrum absorbed from incident light resulting in adaptation to different environmental conditions [10]. These changes are facilitated by pigmented photoreceptors that detect variations in light composition and induce photo-morphogenetic responses due to their absorption peaks in the blue/ultraviolet and red regions of the electromagnetic spectrum that influence growth and development [11]. However, this phenomenon varies from species to species. Kalaitzoglou et al. [12] reported lower chlorophyll content and plant growth in tomato plants cultivated under lower light absorbance, while Zhang et al. [13] on Mitragyna speciosa and Tran [14] on Fraxinus latifolia seedlings reported an unchanged chlorophyll content and growth parameters in lower light conditions.
The dynamics of seed germination, reproductive success, and productivity of cultivated and wild plants depends on the physicochemical components of the soil, which is determined by physical and biochemical properties of the soil [15,16]. These factors play a critical role in determining the relative performance of plants in terms of growth, yield, and productivity, as well as the composition of other plant species. In greenhouse and commercial cultivation, the use of soil as growth medium has resulted in soil-borne diseases, increased levels of acidity and salinity, poor aeration, and other adverse effects [17]. However, these adverse effects are mitigated by replacing soil with disease-free materials such as LECA clay, vermiculite, peat, silica sand, perlite, and rockwool, which are reusable and can provide effective aeration, anchorage, and support for plants [18]. Although Trachyandra species grow in sand dunes naturally [19,20], research has shown that plants can grow in other soils rather than their natural soils.
Given the rising demand for plant-based nutrients needed to meet the ever-increasing human population, the devastating effect of elevated light intensity on crop production necessitates a sustainable and innovative methods of crop production [21,22] in order to achieve nutrient diversity and food sufficiency. Wild vegetables have been reported to possess adaptive mechanisms under harsh conditions, making them a viable alternative to popular crops in affected areas [23]. These underutilised plants are high in nutrients and bioactive compounds, which are thought to be important mediators of a variety of health effects [24]. It is therefore important to investigate adaptive response of underutilised wild vegetables such as Trachyandra divaricata to determine optimal light condition that will enhance its antioxidant and nutritional content.
Trachyandra divaricata, commonly known as “Tumbling Starlily” or “Kus Waaibossieis” (Afrikaans), is a wild vegetable with edible flowers. The plant belongs to the Asphodelaceae family and is largely distributed in sandy locations in most parts of South Africa [25]. It is a stout, tufted, rhizomatous perennial which produces fleshy leaves that grow up to 1 m long and a horizontal stalk that produces white to purple flowers [25]. According to ethnobotanical reports, the flower buds of this plant were eaten by the ancient Khoisan residents of South Africa in times of food scarcity [26,27]. Nowadays, the plant is underutilised, despite the increasing demands for plant-based nutrients, and there have been no studies on its nutrient profiles, pharmacological potential, and sustainable cultivation protocols developed for this species and its close relatives [19,20]. As a result, agronomical studies are required to support its domestication, encourage its consumption, and ensure its re-integration and long-term use in the household diet. Cultivating this wild vegetable for food production could be a panacea for a sustainable food security [28] and a viable strategy to mitigate elevated temperature as climate change becomes devastating amidst drought in Sub-Saharan Africa [29]. This will then create an inflorescent vegetable option and lessen overreliance on major vegetables such as potato, spinach, lettuce, and wheat, which has been the root cause of malnutrition affecting two billion people worldwide [30].
It therefore became pertinent to assess the impact of varied light intensity and soilless media as growth enhancers when used to improve the vegetative characteristics, nutritional properties, phytochemicals, and antioxidant potential of T. divaricata, with a focus on the inflorescence due to its documented consumption. Furthermore, the scarcity of research on the nutritional value of this wild vegetable has affected its food value and underutilisation among native households where the plant is endemic in South Africa. As a result, the findings of this study are expected to serve as a model for future researchers, food and pharmaceutical industries, households, and potential farmers interested in utilising T. divaricata for nutrient diversity and pharmaceutical precursors.

2. Materials and Methods

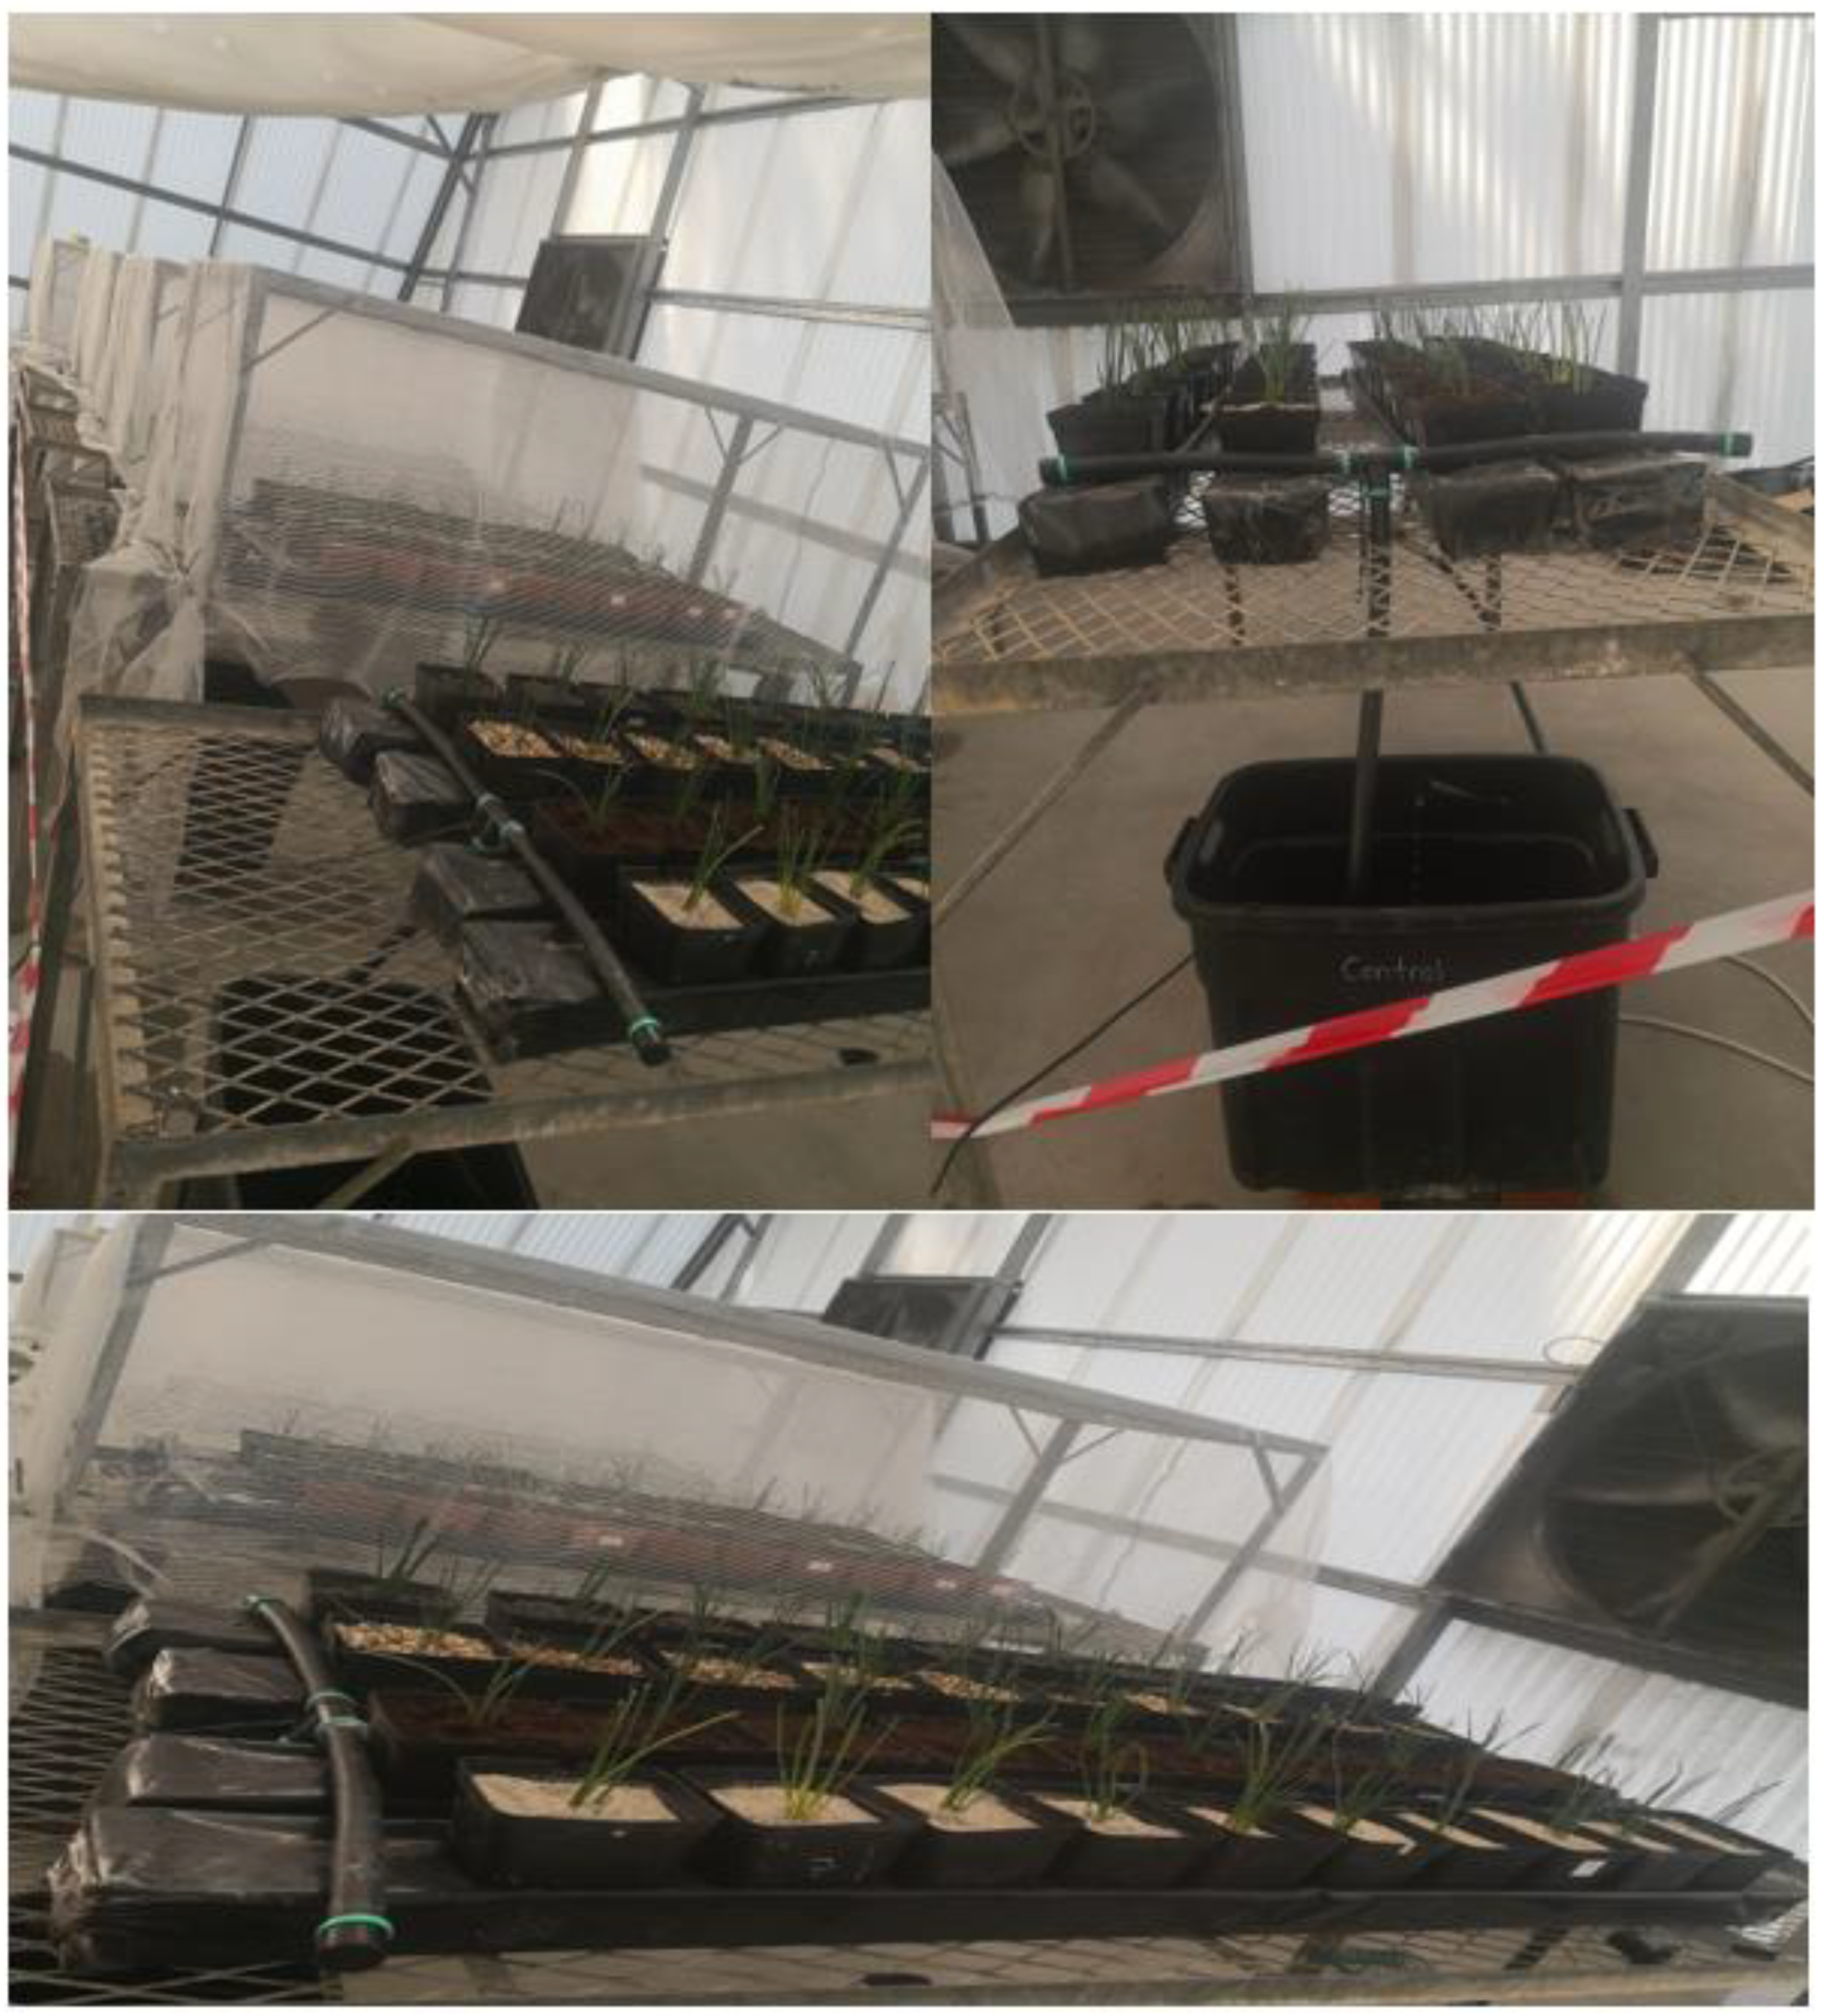
2.1. Experimental Location

The experiment was set up in a greenhouse facility of the Cape Peninsula University of Technology (CPUT), Bellville campus, South Africa (33°55′56′′ S and 18°38′25′′ E). During the day, temperatures range between 21 and 26 °C, and between 12 and 18 °C at night. The photosynthetic photon flux density (PPFD) peaks at 1020 mol/m2/s, with a mean value of 420 mol/m2/s per day, while the relative humidity of the greenhouse is about 60%.

2.2. Collection of Plant Materials and Experimental Design

The stalk of T. divaricata used was supplied by the CPUT nursery. The plant material was propagated using the division method described by Bulawa et al. [20]. Divided plantlets were transferred into 15 cm pots heaped with varying growth media (LECA clay, silica sand, peat, and vermiculite) and hardened off for two weeks under a shade cloth. The plants were then relocated to the site of the experiment.
The hydroponic system was set up following the work of Viljoen et al. [31] with minor modifications. Four identically built nutrient film technique (NFT) systems were used, with each system mounted on 2.5 m iron-meshed square tables that provided a flat surface. The NFT systems were numbered, and every system had its 50 L reservoir in which the nutrient solution was prepared. The reservoir was made of low-density polyethene. On each table, pots filled with different growth media were embedded in 5 square gutters made of polyvinyl chloride (PVC) on which shading percentages were applied (Table 1, Figure 1). Each system was constructed with 20 mm LDPE irrigation piping, 4 × 20 mm flow regulators, and 4 × 20 mm elbow irrigation fittings connected to a submersible pump (1 × 2000 L/h) with 2.5 m head facility. To prevent leakage, the gutters were sealed with adhesive materials made of PVC (Figure 1).

2.3. Treatments

Four growth media, namely, LECA clay, silica sand, peat, and vermiculite of different physicochemical properties and cation exchange capacity were used in this experiment [32,33,34]. LECA clay was supplied by Hydroponic.co.za (The Reserve 1, Unit 1 Capricorn Way Brackenfell, Western Cape 7560, South Africa). Depending on the mineral chemistry of the raw clay used for LECA production, the chemical content of LECA clay includes variable amount of hydrous aluminium silicates, alkaline metals, Fe, and Mg. Apart from these chemicals, other synthetic and natural additives such as shale, granite, fly ashes, and contaminated soils are incorporated to fortify LECA nowadays [35]. Silica sand (supplied by Consul Ltd., 1 Silica Rd, Primrose Park, Cape Town, 7764, South Africa) contains more than 80% by weight of silicon dioxide (SiO2), also known as silica [36], and could be a potent indicator of transpiration rate in plants [37,38]. The mechanical strength of vermiculite (purchased from Cape Agricultural Products Address,15 Sergeant St, Somerset West, Cape Town, 7130, South Africa) is responsible for its long-term use as hydroponic growth medium due to its chemical resistance to saturated solutions of organic nutrients [39]. Peat (also supplied by Cape Agricultural Products Address, 15 Sergeant St, Somerset West, Cape Town, 7130, South Africa) is formed from a heterogeneous mixture of partially decomposed plant materials, microbial remnants, and their secondary metabolites that were collected in a water-saturated environment due to suppressed decay under anaerobic and acidic conditions [40]. It has been reported in previous studies that peat has high adsorption capacity for heavy metals, having contained other competing metals, and can maintain the threshold pH for heavy metal uptake, thus being able to be used to remediate heavily polluted soils [41,42].
Silica sand and LECA clay were rinsed thoroughly with sterile water to clean impurities and other earthy materials. A shade net of 20% density used for this study was purchased from Stodels Garden Centre, Bellville branch, South Africa. Different levels of shading were created from the factory made 20% density net by doubling (40%), tripling (60%), and quadrupling (80%), and all these were used as light filters in the greenhouse. The nets were then used to cover the tables where pots of different growth media were arranged in a completely randomised design (CRD). The Nutrifeed standard fertiliser (10 g/5 L) purchased from Starke Ayres, Cape Town, South Africa, was used as a nutrient base for the treatments. The standard fertiliser contained N (65 mg/kg), Mg (22 mg/kg), Ca (70 mg/kg), S (75 mg/kg), K (130 mg/kg), P (27 mg/kg), Cu (20 mg/kg), Mo (10 mg/kg), Fe (1500 mg/kg), B (240 mg/kg), Zn (240 mg/kg), and Mn (240 mg/kg).

2.4. Determination of Plant Growth

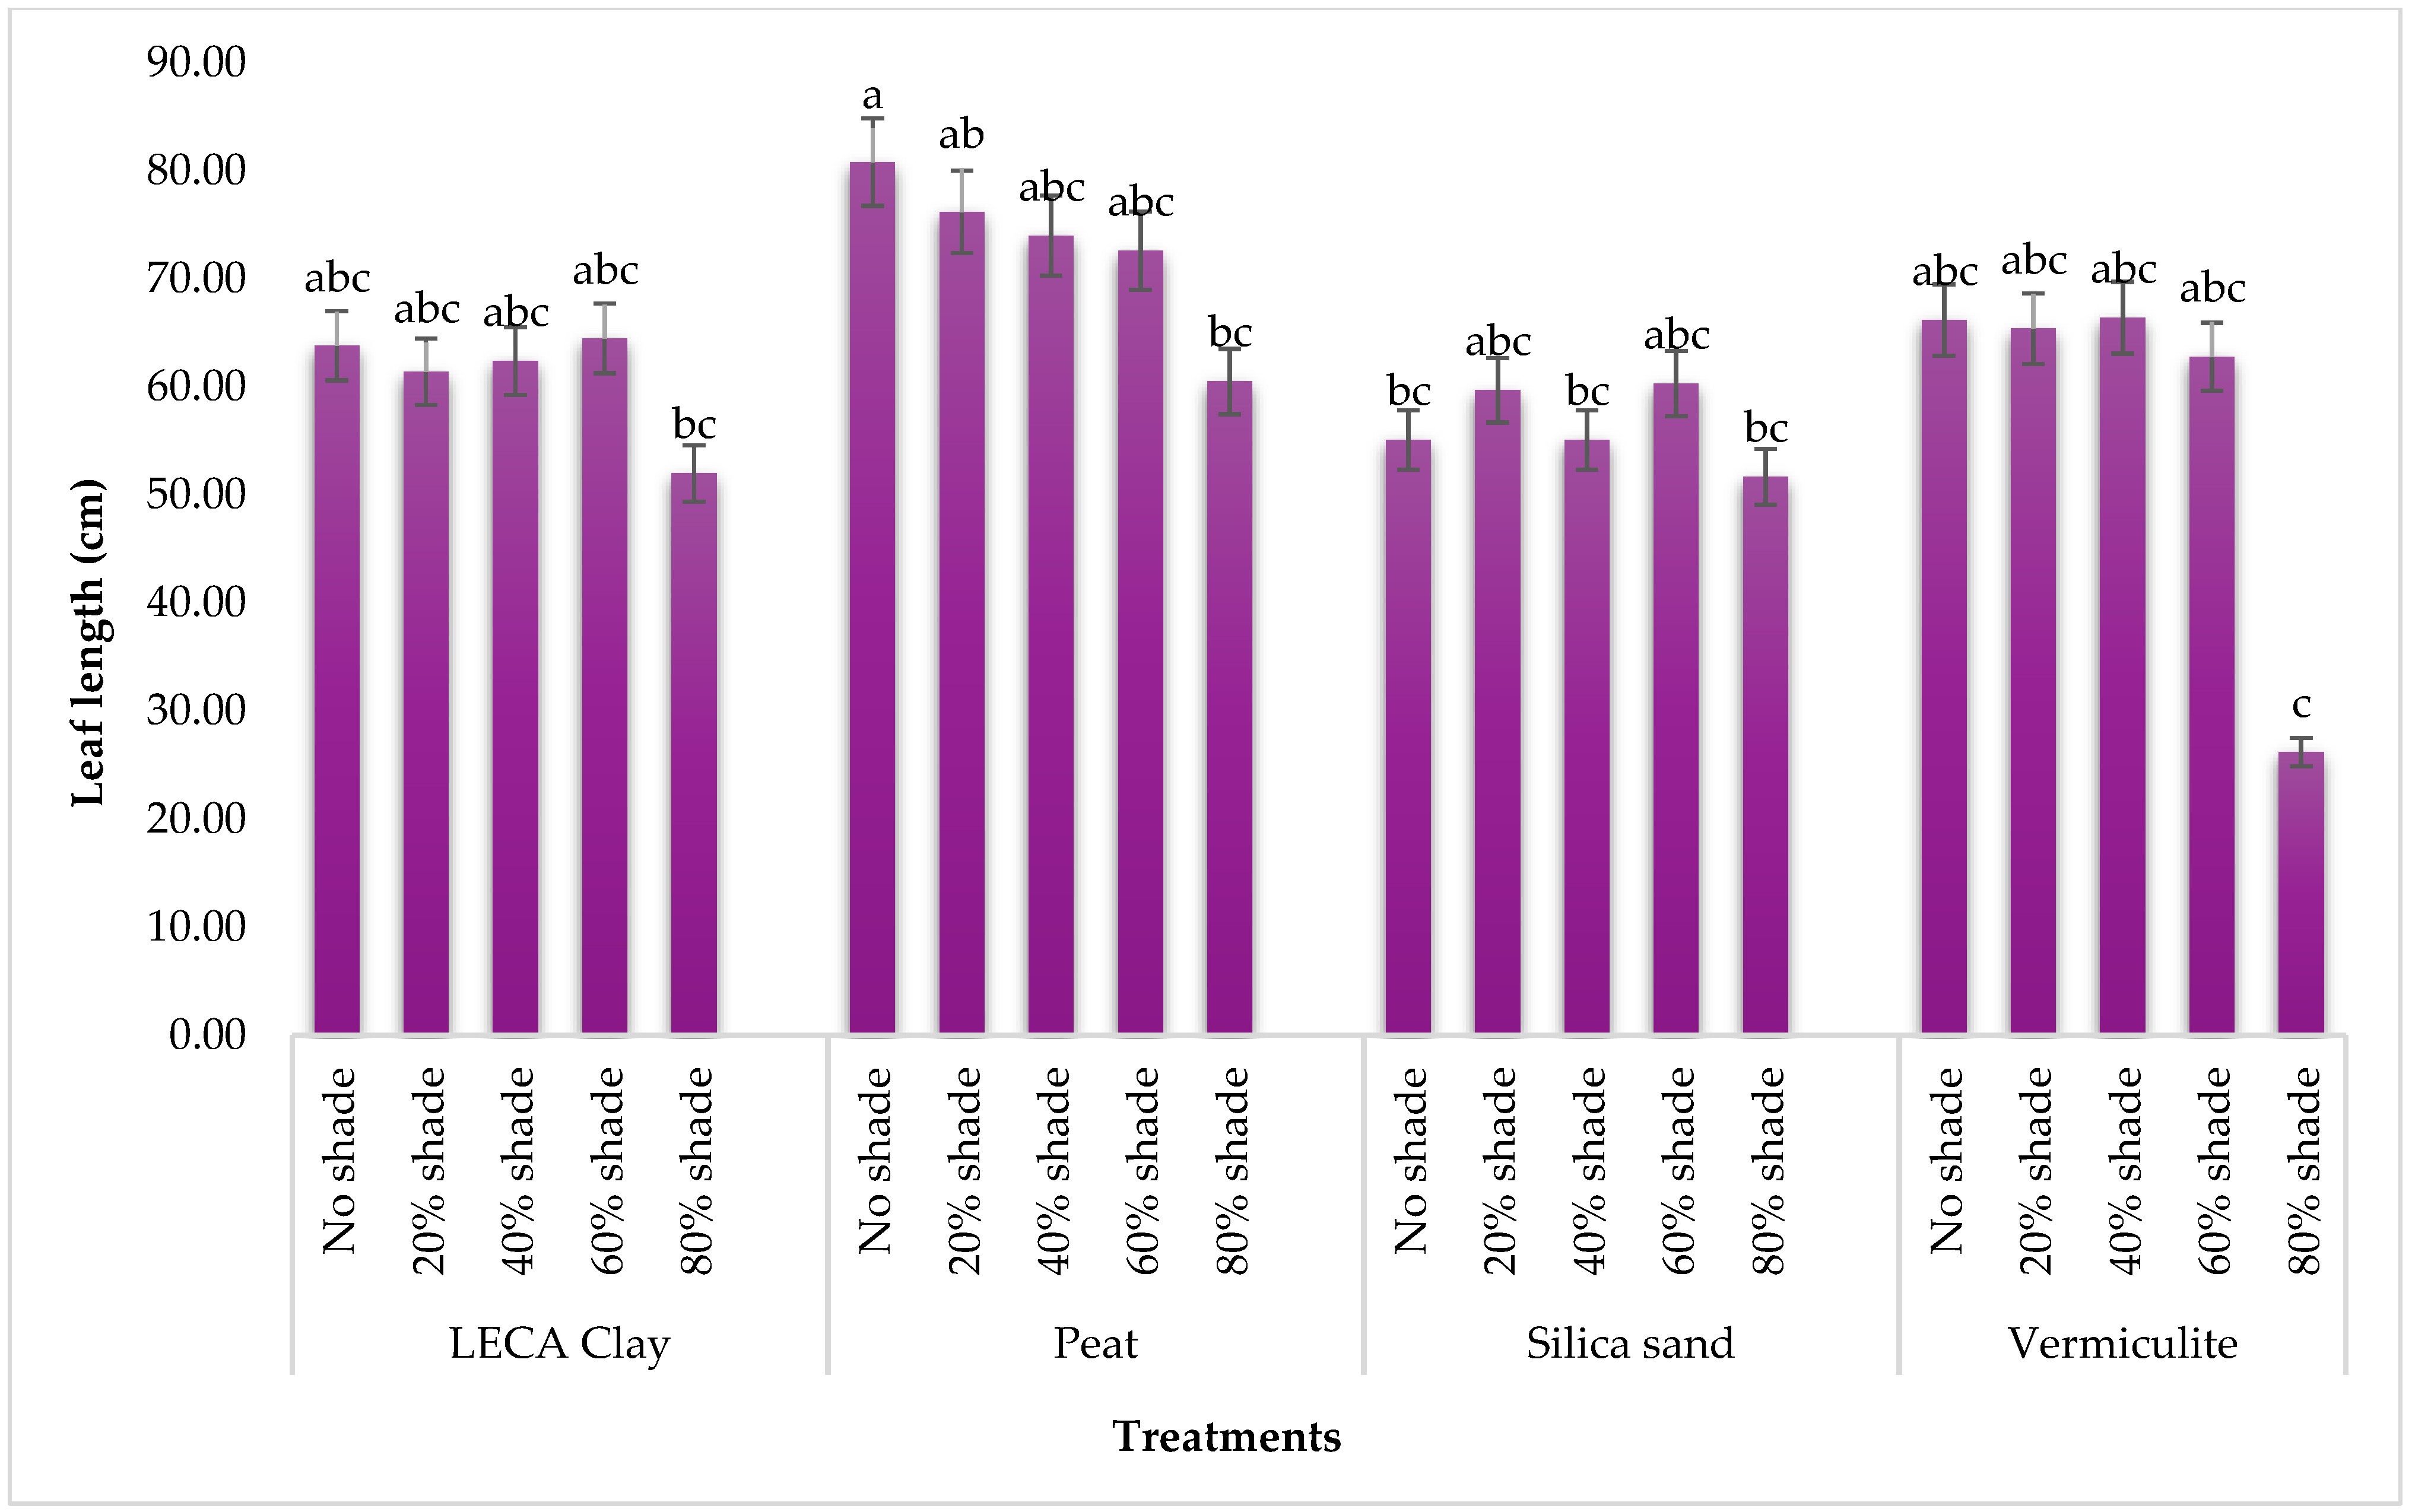
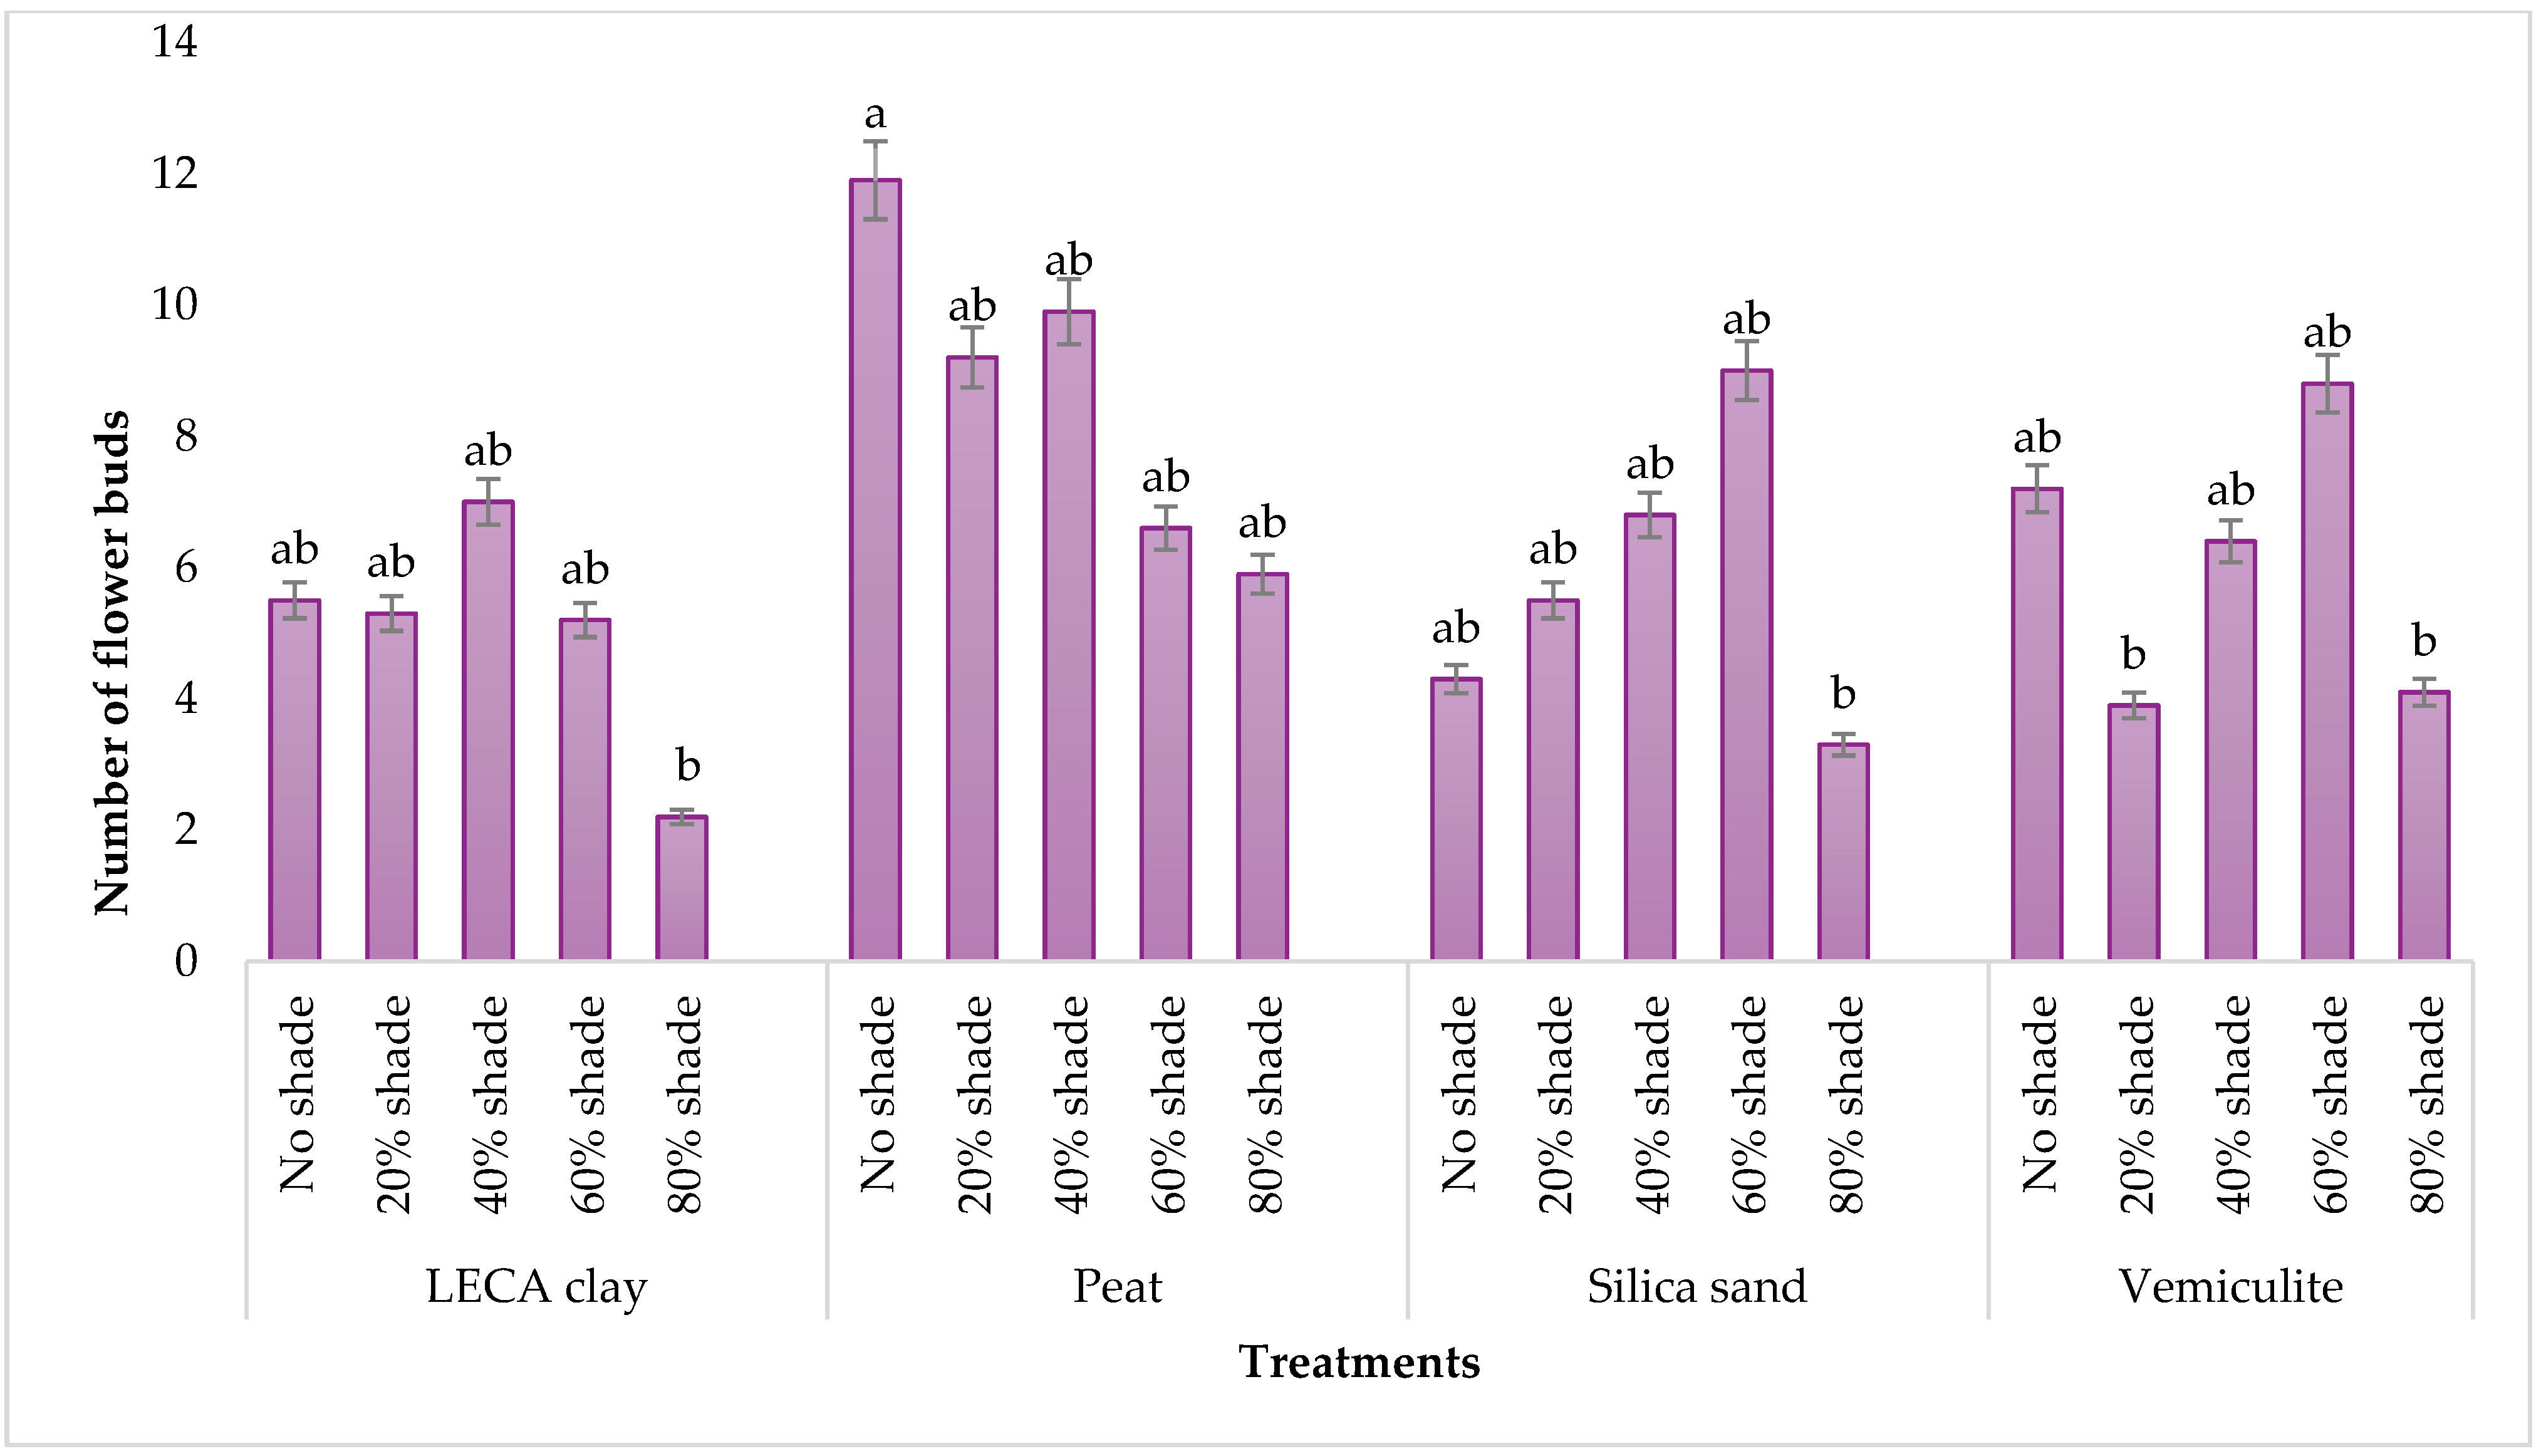
2.4.1. Leaf Length and the Number of Flower Buds
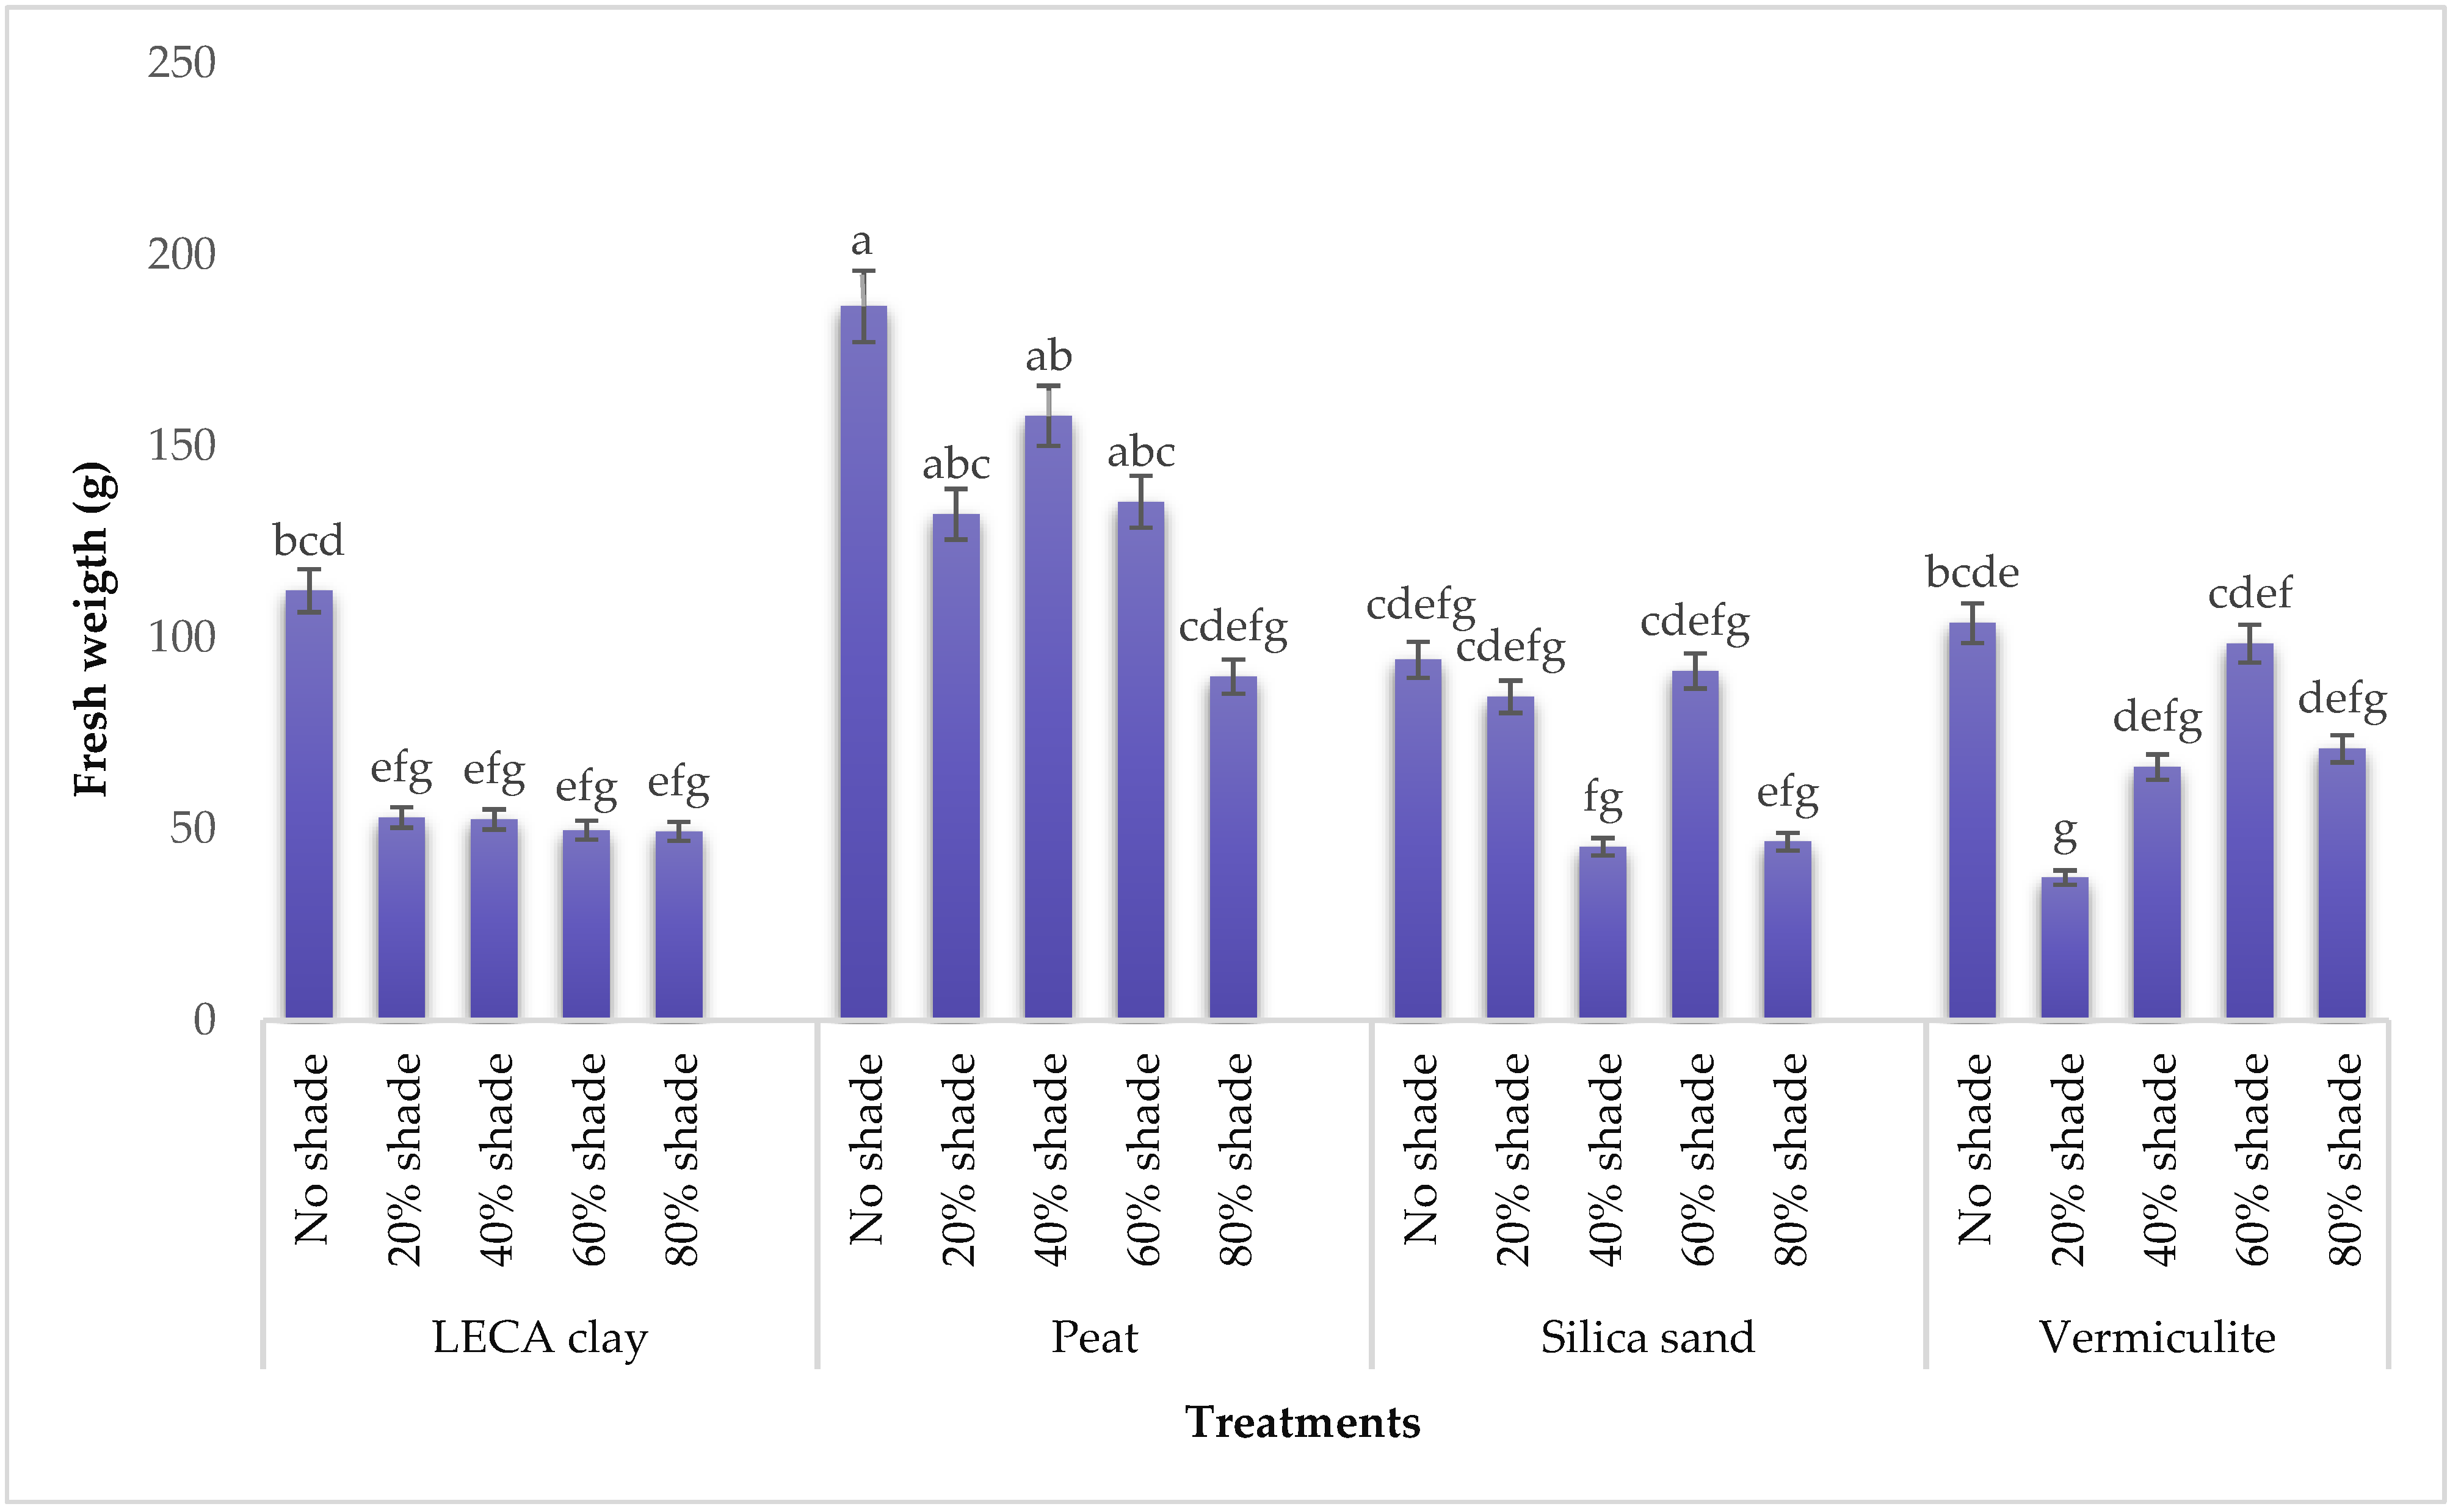
The number of flower buds and leaf size were used to measure new growth index. A metre tape was used to measure the leaf length from the substrate level to the tip of the tallest shoot every two weeks, while the number of flower buds were counted manually.

2.4.2. Plant Weight

After harvesting, plant weight was measured on an orthodox laboratory balance (RADWAG®Model PS 750.R2). Flower buds, shoots, and roots were sorted, and the fresh weight values of individual samples were recorded separately. The plant material was then oven-dried to a constant weight in a LABTECHTM model LDO 150F oven (Daihan Labtech India. Pty. Ltd. 3269 Ranjit Nagar, New Delhi, India) maintained at 40 °C. The difference in dry and fresh weight was estimated to be the amount of water stored in plant tissues.

2.5. Chlorophyll Concentration

The chlorophyll concentration was measured with a Soil Plant Analysis Development (SPAD-502 meter) purchased from Konica Minolta, Cape Town, South Africa. The SPAD-502 meter was used to calculate the mean chlorophyl readings of two fully developed leaves from each plant.

2.6. Mineral Analysis of Flower Buds

The mineral composition of flower buds harvested from each replicate treatment was analysed with the Inductively Coupled Plasma-Optical Emission Spectrometer (Varian Vista-MPX, Victoria 3170, Australia) as described by Jimoh et al. [43]. This analysis was carried out in the mineral analysis laboratory at the KwaZulu Natal’s Agriculture and Rural Development Department [44].

2.7. Proximate Analysis of Flower Buds

2.7.1. Moisture Content

The moisture content was estimated following modified procedures used by Olatunji and Afolayan. [45]. An empty porcelain bowl was weighed (W1) after drying in an oven set at 105 °C for one hour and chilled in a desiccator. One gram (W2) of the ground flower buds of T. divaricata was weighed in a porcelain bowl and dried to a constant weight in an oven kept at 105 °C. After cooling in a desiccator, the bowl and the plant material were re-weighed (W3). The moisture content was determined as given in the following equation:
%   Moisture   content = W 2 W 3 W 2 W 1 × 100

2.7.2. Crude Fat Content

The percentage crude fat content was analysed using the guidelines of the Association of Official Analytical Chemists (AOAC) [46]. One gram of pulverised sample was extracted in 100 mL of diethyl ether and shaken vigorously for 24 h on an orbital shaker. The extracted sample was filtered, and the filtrate was collected in a pre-weighed beaker. The ether extract was then homogenised with 100 mL diethyl ether, which was shaken on an orbital shaker for another 24 h, and the filtrate was collected in a beaker tagged (W1). The ether filtrate was evaporated to dryness in a water bath and oven (55 °C) before it was reweighed in another beaker labelled (W2). The crude fat content was determined from the equation below.
%   Crude   fat   content = W 2 W 1 original   weight   of   the   pulverised   sample × 100

2.7.3. Ash Content

The percentage ash content of the tested flower buds of T. divaricata was determined with a protocol developed by the AOAC [46]. Porcelain bowls tagged with sample were heated for 1 h in an oven kept at 105 °C. The crucibles were cooled in a desiccator and weighed (W1). Then, 1 g of ground flower buds was placed in a crucible and reweighed (W2). The crucible containing the plant sample was put in a muffle oven and heated to a temperature of 250 °C for 1 h. Thereafter, the temperature of the muffle oven was raised to 550 °C for 5 h to ash the samples completely. The porcelain bowls were chilled in a desiccator, and samples were weighed (W3). The ash content of the samples was estimated as
%   Ash   content = W 2 W 3 W 2 W 1 × 100

2.7.4. Crude Protein

The crude protein was determined by boiling 2 g of ground samples in a Kjeldahl flask filled containing 20 mL concentrated H2SO4 until a clear mixture was observed. A digestion tablet comprising 5.0 g of potassium sulphate, 0.15 g of copper sulphate, and 0.15 g titanium oxide was used as a catalyst. After digestion and filtration, the extracts were in a 250 mL flask. The aliquot with 50 mL of 45% NaOH was distilled further in a 500 mL round-bottomed flask, and 150 mL of the distillate was transferred into a flask filled with 100 mL of 0.1 M HCl. This was then titrated against 2.0 mol/L NaOH with methyl orange. The endpoint of titration was marked with a yellow colour change, and the percentage nitrogen equivalent was determined from the following formula.
%   N   equivalent = [ ( ml   std   acid   ×   N   of   acid ) ( ml   bank   ×   N   of   base ) ] ( ml   std   base   ×   N   of   base ) × 1.4007 original   weight   of   the   pulverised   sample  
where N = normality, and the percentage crude protein was obtained by multiplying the nitrogen value by a constant factor of 6.25 [47].

2.7.5. Neutral Detergent Fibre (NDF)

The neutral detergent fibre in the tested flower buds was calculated from this formula as reported by Idris et al. [47].
%   Neutral   Detergent   Fibre   =   ( W 1 + W 2 ) W 1 Weight   of   the   sample × 100

2.8. Phytochemicals and Antioxidant Assays

2.8.1. Preparation of Plant Samples

The plant materials (flower buds) were oven-dried for 7 days in an oven kept at 40 °C. Thereafter, the crispy dried flower buds were pulverised with an electric grinder into a fine material. One hundred milligrams of pulverised flower buds were extracted with 25 mL of 80% (v/v) ethanol for 50 min. After 5 min centrifugation at 4000× g rpm, the supernatants were collected used for further laboratory tests.

2.8.2. Polyphenol Assay

The total phenolic content was determined from the Folin–Ciocalteu assay as described by Sogoni et al. [48] with slight modification. The Folin–Ciocalteu reagent used was diluted with distilled water 10 times, and 25 μL of tested extracts was reacted with 125 μL Folin–Ciocalteu solution in a 96-well microplate. Thereafter, 7.5% Na2CO3 solution was added. The microplate was incubated at room temperature for 2 h. The absorbance of the pipetted mixture was read in a Multiskan spectrum plate reader (Thermo Electron Corporation, Waltham, MA, USA) at 765 nm. The phenolic content was expressed as mg gallic acid equivalent per g dry weight (mg GAE/g DW) extrapolated from the standard equation obtained from graded concentrations (0, 20, 50, 100, 250, and 500 mg/L) of gallic acid.

2.8.3. Determination of Flavonols

The flavonol content of the extracts was determined from graded quercetin standard (0, 5, 10, 20, 40, and 80 mg/L) prepared in 95% ethanol [49] of analytical grade. A volume of 12.5 μL of the extracted flower buds was reacted with 12.5 μL 0.1% HCl in 95% ethanol, and then 225 μL 2% HCl for each sample. Thereafter, the mixture was incubated at room temperature for 30 min. After incubation, absorbance was measured at 360 nm, and results were expressed as mg quercetin equivalent per g dry weight (mg QE/g DW) [49].

2.8.4. DPPH Free Radical Antioxidant Content

The 2,2-diphenyl-1-picrylhydrazyl (DPPH) radical was generated by preparing 0.135 mM DPPH in a dark bottle as described by Ohikhena et al. [50] with minor modifications. A volume of 300 μL of DPPH solution was mixed with graded concentrations of 6-hydrox-2,5,7,8-tetramethylchroman-2-20 carboxylic acid (Trolox standard) and incubated for 30 min. After incubation, absorbance of the mixture was measured at 517 nM, and results were expressed as μM/Trolox equivalent per g dry weight (μM TE/g DW).

2.8.5. Ferric Reducing Antioxidant Power (FRAP) Assay

The FRAP content of the extracted flower buds was determined using the method described by Jimoh et al. [51] with slight modification. A mixture of 3 mL iron (III) chloride hexahydrate (FeCl3·6H2O), 3 mL 2,4,6-tripyridyl-s-triazine (10 mM in 0.1 M hydrochloric acid), and 30 mL acetate buffer (0.3 M, pH 3.6) that was diluted with 6 mL distilled water was incubated at 37 °C for 30 min to form the FRAP reagent. Thereafter, 300 μL of the FRAP reagent was reacted with 10 μL of the extracted flower buds of T. divaricata in a 96-well microplate. At 593 nm, the absorbance of the pipetted mixture was measured in a Multiskan spectrum microplate reader. The FRAP content of the tested sample was extrapolated from an L-ascorbic acid standard graded from 0 to 100 μM and expressed as μM ascorbic acid equivalents (AAE) per g dry weight (μM AAE/g DW).

2.8.6. TEAC Free Radical Scavenging Activity

The TEAC assay was carried out by generating ABTS+ from potassium persulphate mixed with ABTS dissolved in a buffer. The assay was based on the ability of the tested plant samples of T. divaricata to scavenge the ABTS (2,2-azino-bis-3-ethylbenzothiazoline-6-sulfonic acid) radicals (ABTS+) relative to Trolox, a standard vitamin E antioxidant [52]. To ensure stability, the ABTS+ was diluted with 20 mM sodium acetate buffer (pH 4.5) at a wavelength of 734 nm and pH range 0.700 ± 0.02. About 3 mL ABTS+ was reacted with 20 μL of the samples, and absorbance of the solution was read at 734 nm after 10 min. The experiment was run in triplicate for each sample. The results are estimated as μmol TE/g dry weight of the plant sample, extrapolated from a Trolox calibration curve generated within a concentration range of 0–250 μM.

2.9. Statistical Analysis

The experimental data were analysed using two-way ANOVA, and Tukey’s least significant difference was used to compare means between treatments at the p ≤ 0.05 level of significance. STATISTICA version 13.5.0.17 computer software was used for all calculations.

3. Results

3.1. Effect of Growing Media and Shade Levels on Plant Growth

3.1.1. Leaf Length and Flower Bud Number

The results showed that Trachyandra divaricata growth response to varying media and shade levels was variable (Figure 2 and Figure 3). The leaf length and flower bud number were significantly affected by media and shade levels at p ≤ 0.05. The highest leaf length was recorded in plants grown in peat without shading, and this was comparable to most treatments but higher than the control. The lowest leaf length was recorded in plants grown in vermiculite under 80% shading. Likewise, the highest number of flower buds was again obtained from plants grown in peat without shading treatment, while the lowest number of flower buds was produced under 80% shade in plants grown with LECA clay, silica sand, and vermiculite. However, equivalent number of flower buds were produced in other treatments.

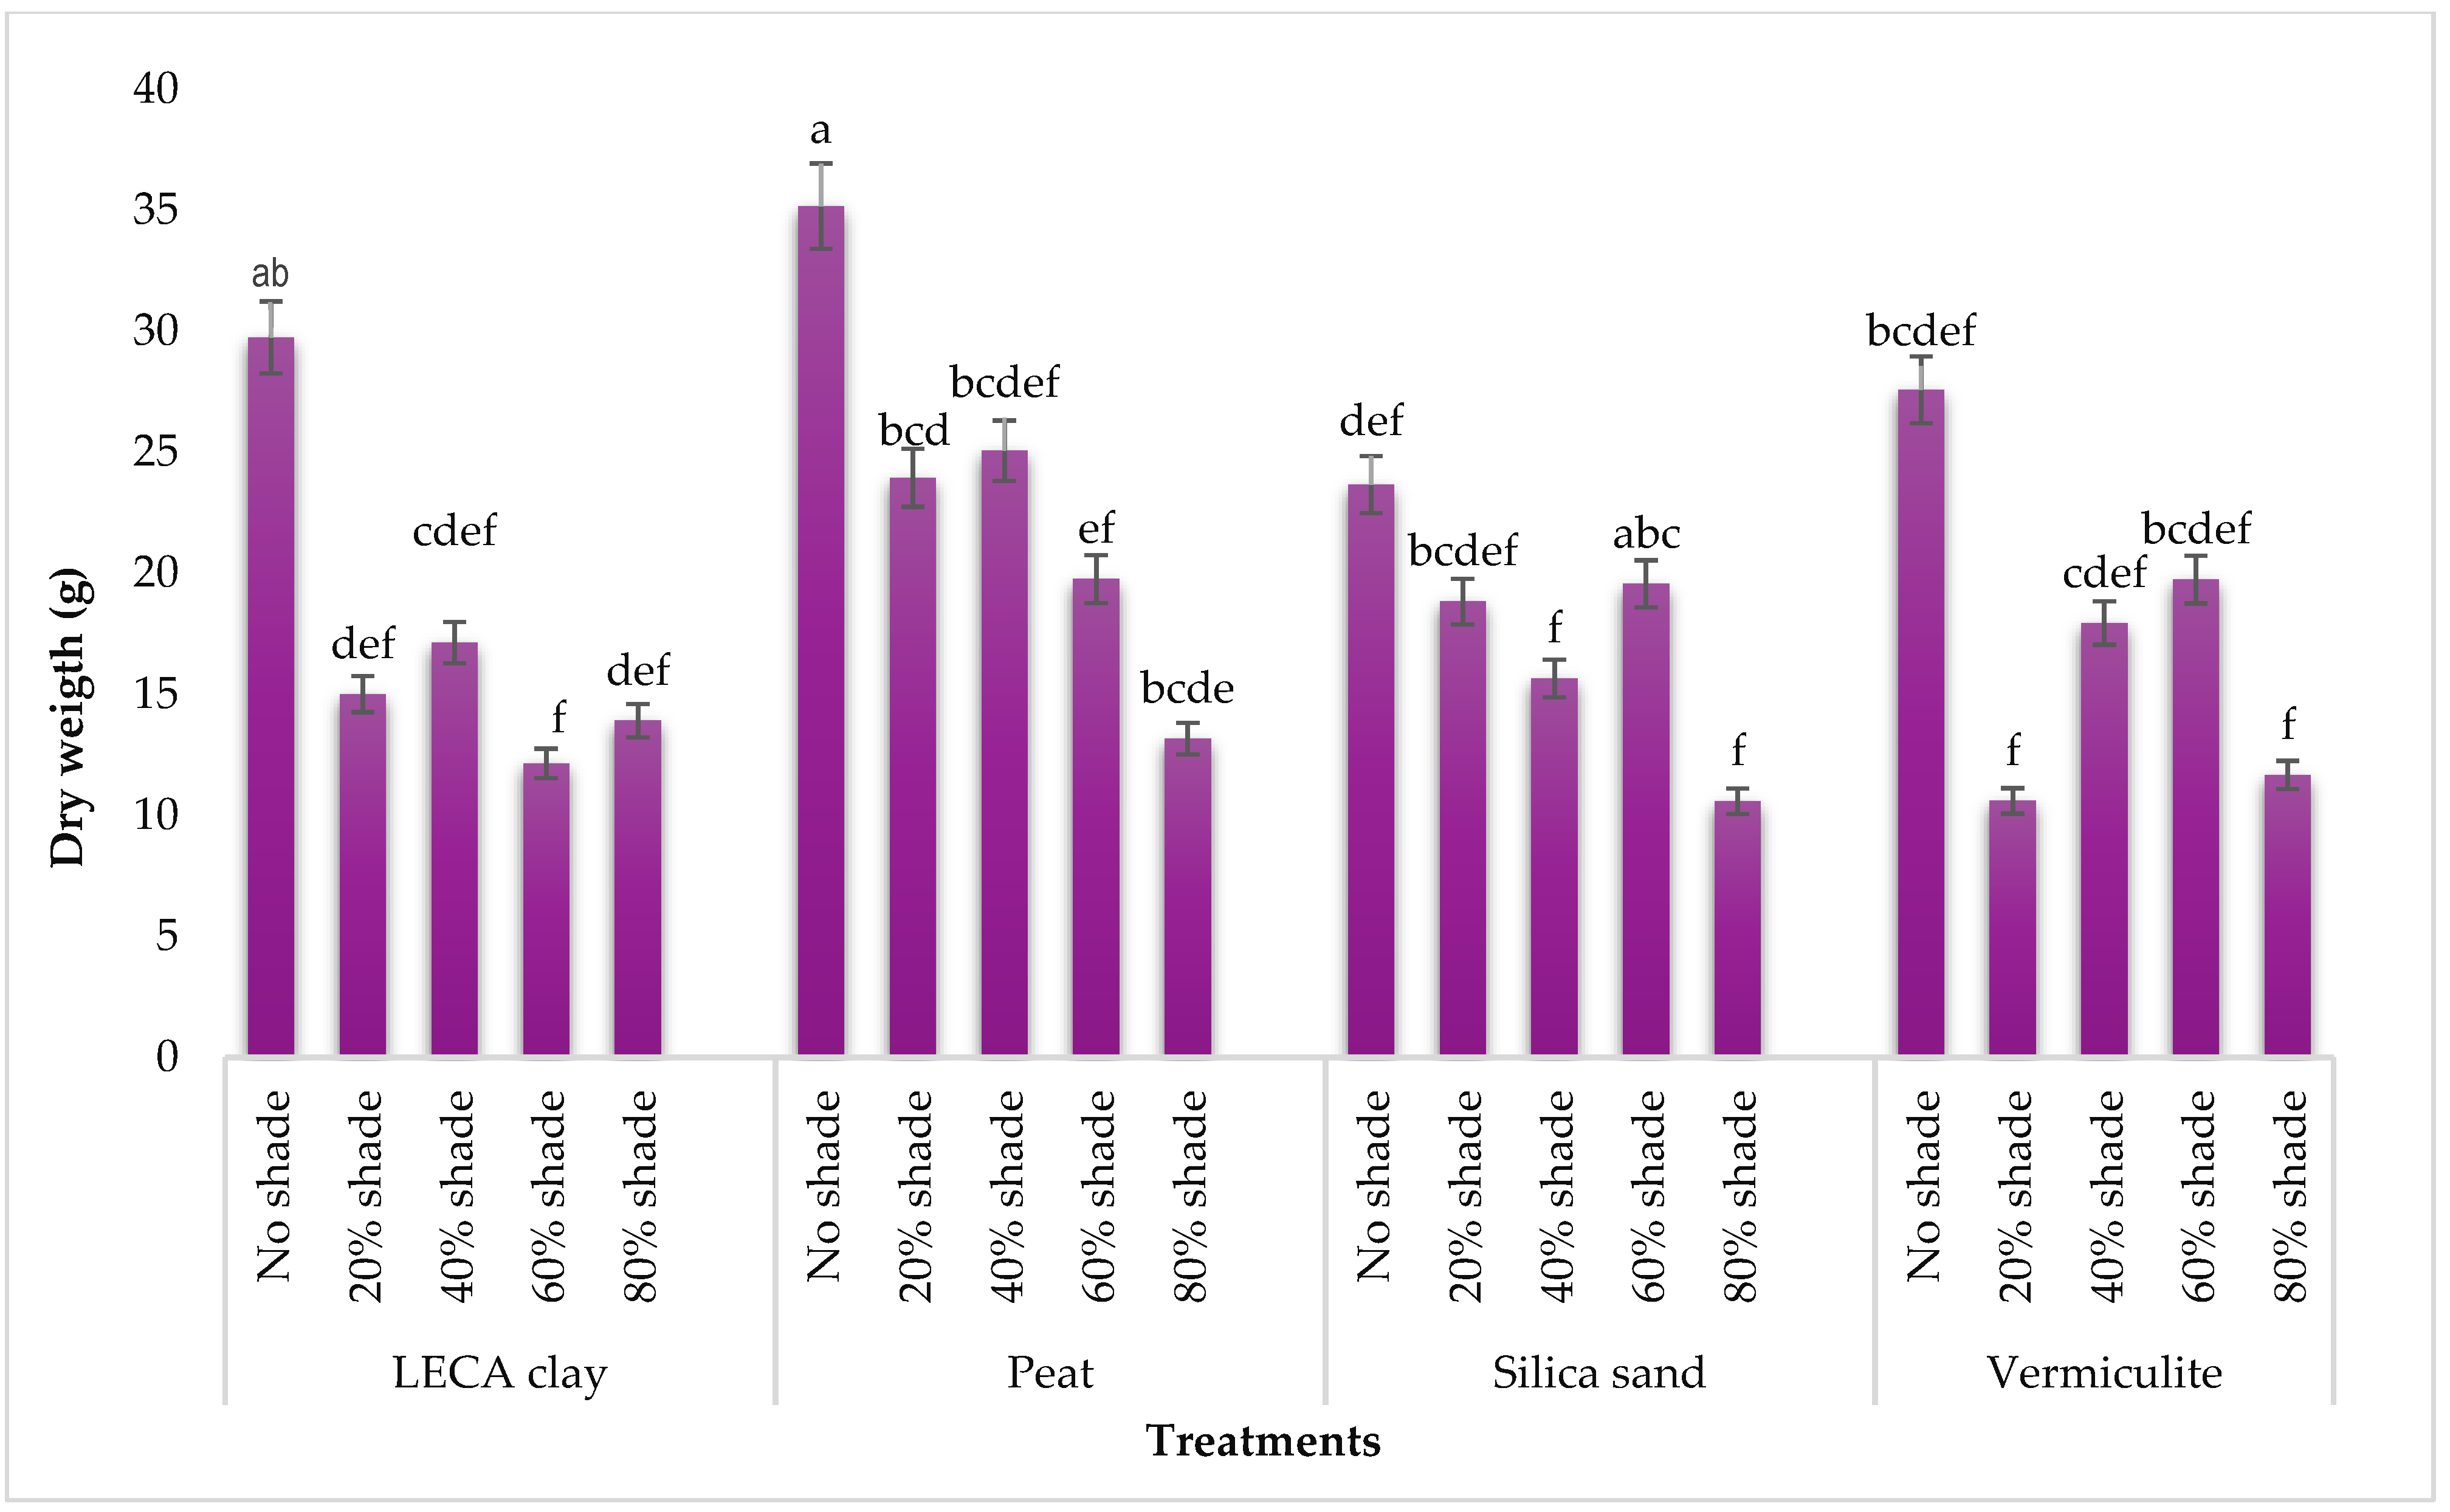
3.1.2. Total Fresh and Dry Weight of T. divaricata

Weight of fresh and dry T. divaricata varied significantly between treatments (Figure 4). The fresh weight was highest in plants cultivated in peat with no shade treatment. This was significantly higher than other treatments but was comparable to plants cultivated in peat under 20–60% shade treatment. The lowest fresh weight was obtained in plants grown in vermiculite under 20% shade. As for the dry weight, the same trend was observed, wherein the highest mean value was again obtained in peat with no shade; this was significantly higher than the control and all other treatments. The dry weight was lowest in silica sand under 80% shade treatment, which was significantly lower compared to the control and other treatments (Figure 5).

3.1.3. Effect of Growing Media and Shade Levels on Chlorophyll Content

The chlorophyll content in T. divaricata leaves varied considerably as the plant aged with respect to the growing media and shading levels. At weeks 2, 4, 6, 8, and 10, the highest mean values of chlorophyll content were recorded in LECA clay treated with different shade levels (Table 2). The 80% shade yielded the highest chlorophyll values at weeks 2, 4, and 6, whereas during weeks 8 and 10, the 60% and 20% shade levels produced the highest chlorophyll values. Surprisingly, at week 12, vermiculite treated with 80% shade produced the highest chlorophyl value, although this was comparable to most treatments (Table 2).

3.2. Effect of Growing Media and Shade Levels on Mineral Composition of Flower Buds

3.2.1. Macronutrients

The macronutrients in the flower buds of T. divaricata varied among treatments, as presented in Table 3. The main elements examined were calcium (Ca), K/Ca + Mg, magnesium (Mg), sodium (Na), phosphorous (P), potassium (K), and nitrogen (N). The highest Ca and Mg minerals were recorded at 80% shade in LECA clay, which was significantly higher than the control and other treatments. Interestingly, the highest K/Ca + Mg value was found in plants cultivated in LECA clay under 20% shading, which was significantly higher than all treatments. When assessing the accumulation of K, plants grown in peat under 20% shading had a higher yield than other treatments. The highest N yield was obtained in plants grown in vermiculite under 60% shading, while the highest yield in Mg was found in plants grown in LECA clay under 80% shading. Phosphorus and sodium had the highest yield in plants grown under 40% shading but differed in growth media (P—vermiculite, Na—Silica sand).

3.2.2. Micronutrients

Micronutrients in the flower buds of T. divaricata were significantly affected by media and shade levels (Table 4). The highest copper content was recorded in plants cultivated with LECA clay under 80% shading, although this value was comparable to most treatments. Plant samples grown in LECA clay under 80% shading had the highest yield of iron and manganese, and these values were significantly higher than other treatments. Conversely, the highest zinc content was obtained in plant grown in silica sand under 80% shading, and this was higher significantly than all treatments including the control.

3.3. Effect of Growing Media and Shade Levels on Proximate Composition of Flower Buds

The highest value of acid-detergent fibre (ADF) (41.17%) was recorded at 20% shade in peat medium, while the lowest value of 23.57% was found in LECA clay medium under 80% shade. Silica sand and LECA clay media treated with 80% shade had the highest ash content followed by 40% silica sand, whereas the lowest value was recorded in silica sand with no shade treatment, and the rest of the treatments had an equivalent effect on ash content (Table 5).
Furthermore, the highest value of fat content was found in peat soilless medium with 80% shade, while the lowest was recorded at 20% shade in peat medium. The highest amount of moisture content (11.53%) was recorded in peat medium with 60% shade, followed by vermiculite at 40% shade with the highest value of 11.37%, while the lowest was found at 80% shade in vermiculite medium, and all other treatments had equivalent effects.
The 20% shade combined with soilless growth media was the best treatment for non-detergent fibre (NDF) as the highest value was obtained in peat medium with 20% shade; however, NDF did not perform any better at 80% shade treatment, and the LECA clay medium had the lowest value at 80% shade. The highest value of protein content was recorded in vermiculite medium with 80% shade, whereas the lowest value was obtained in silica sand medium at 40% shade, while the rest of the treatments had comparable effects on the protein composition of T. divaricate flower buds (Table 5).

3.4. Effect of Growing Media and Shade on Phytochemicals and the Antioxidant Content of Flower Buds

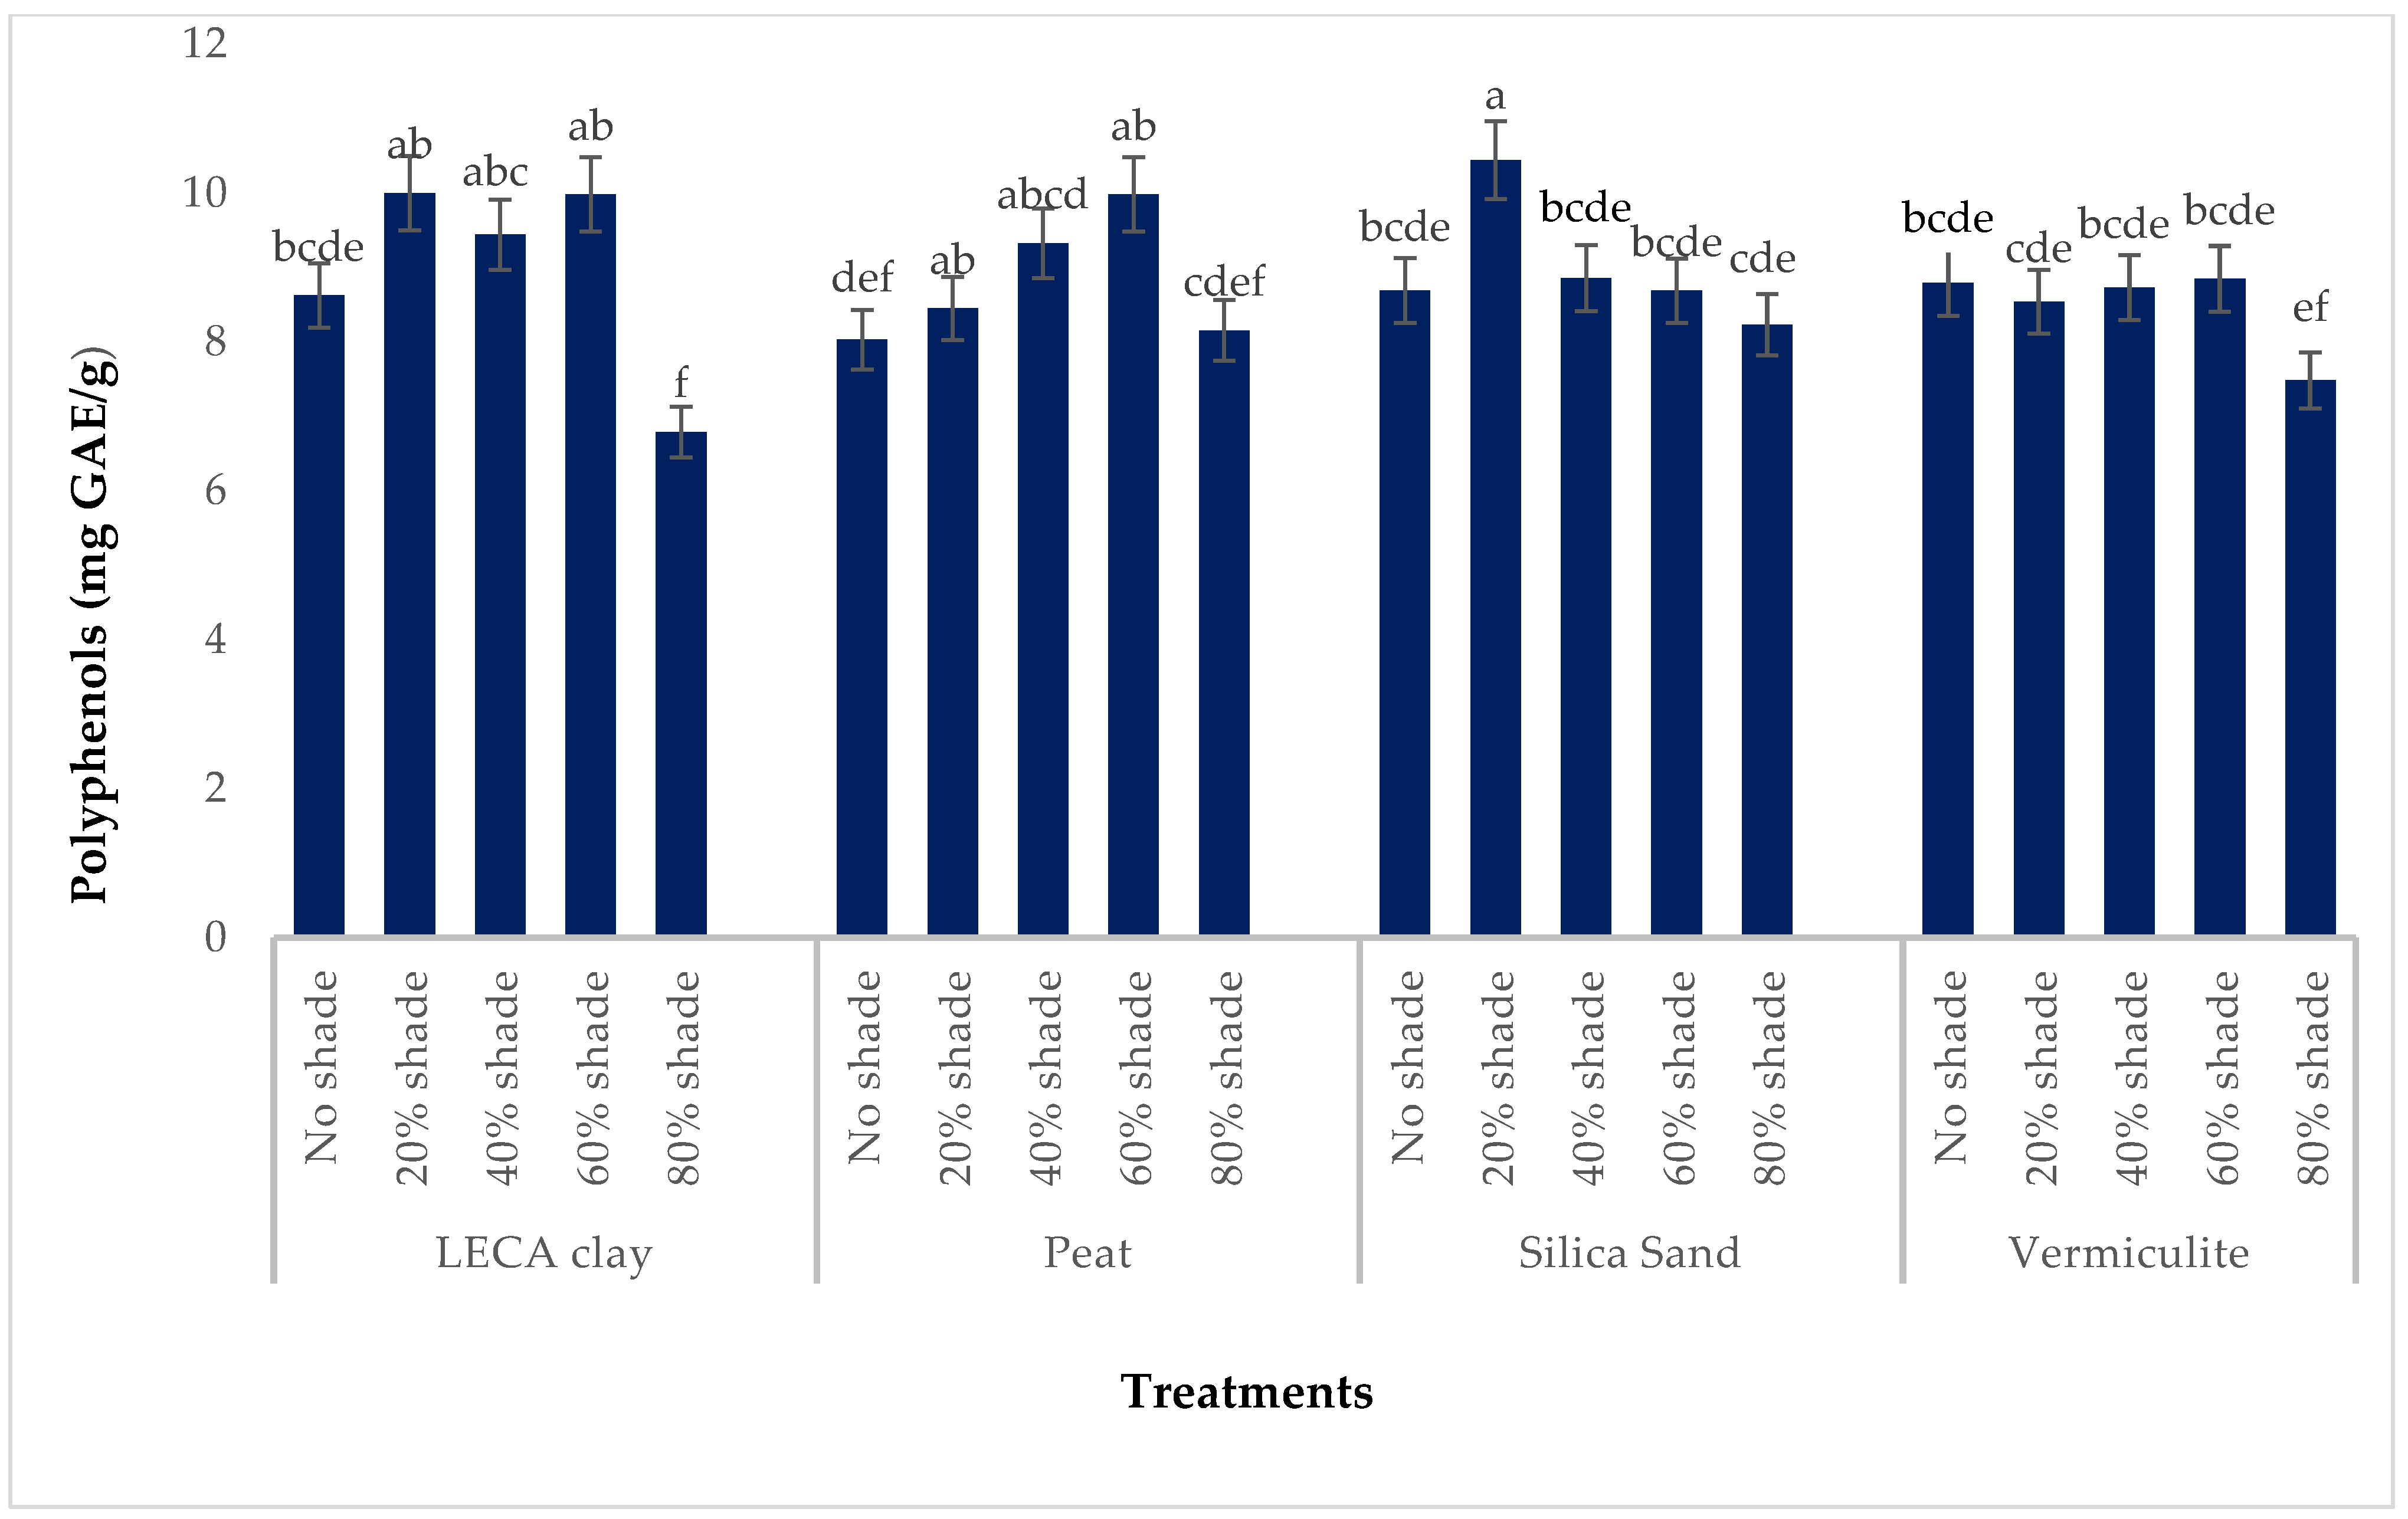
3.4.1. Total Polyphenols

Different growth media and shade levels affected the accumulation of polyphenols significantly in extracted flower buds of T. divaricata (Figure 6). The highest mean value of polyphenols (10.44 mg GAE/g) was recorded in plants cultivated in silica sand under 20% shade. However, this was not significantly different from the values obtained in LECA clay (20% and 60% shade levels) and peat (60% shade level). The lowest polyphenol content was recorded in plants grown in LECA clay under 80% shade, and this was significantly lower than the control and most treatments (Figure 6).

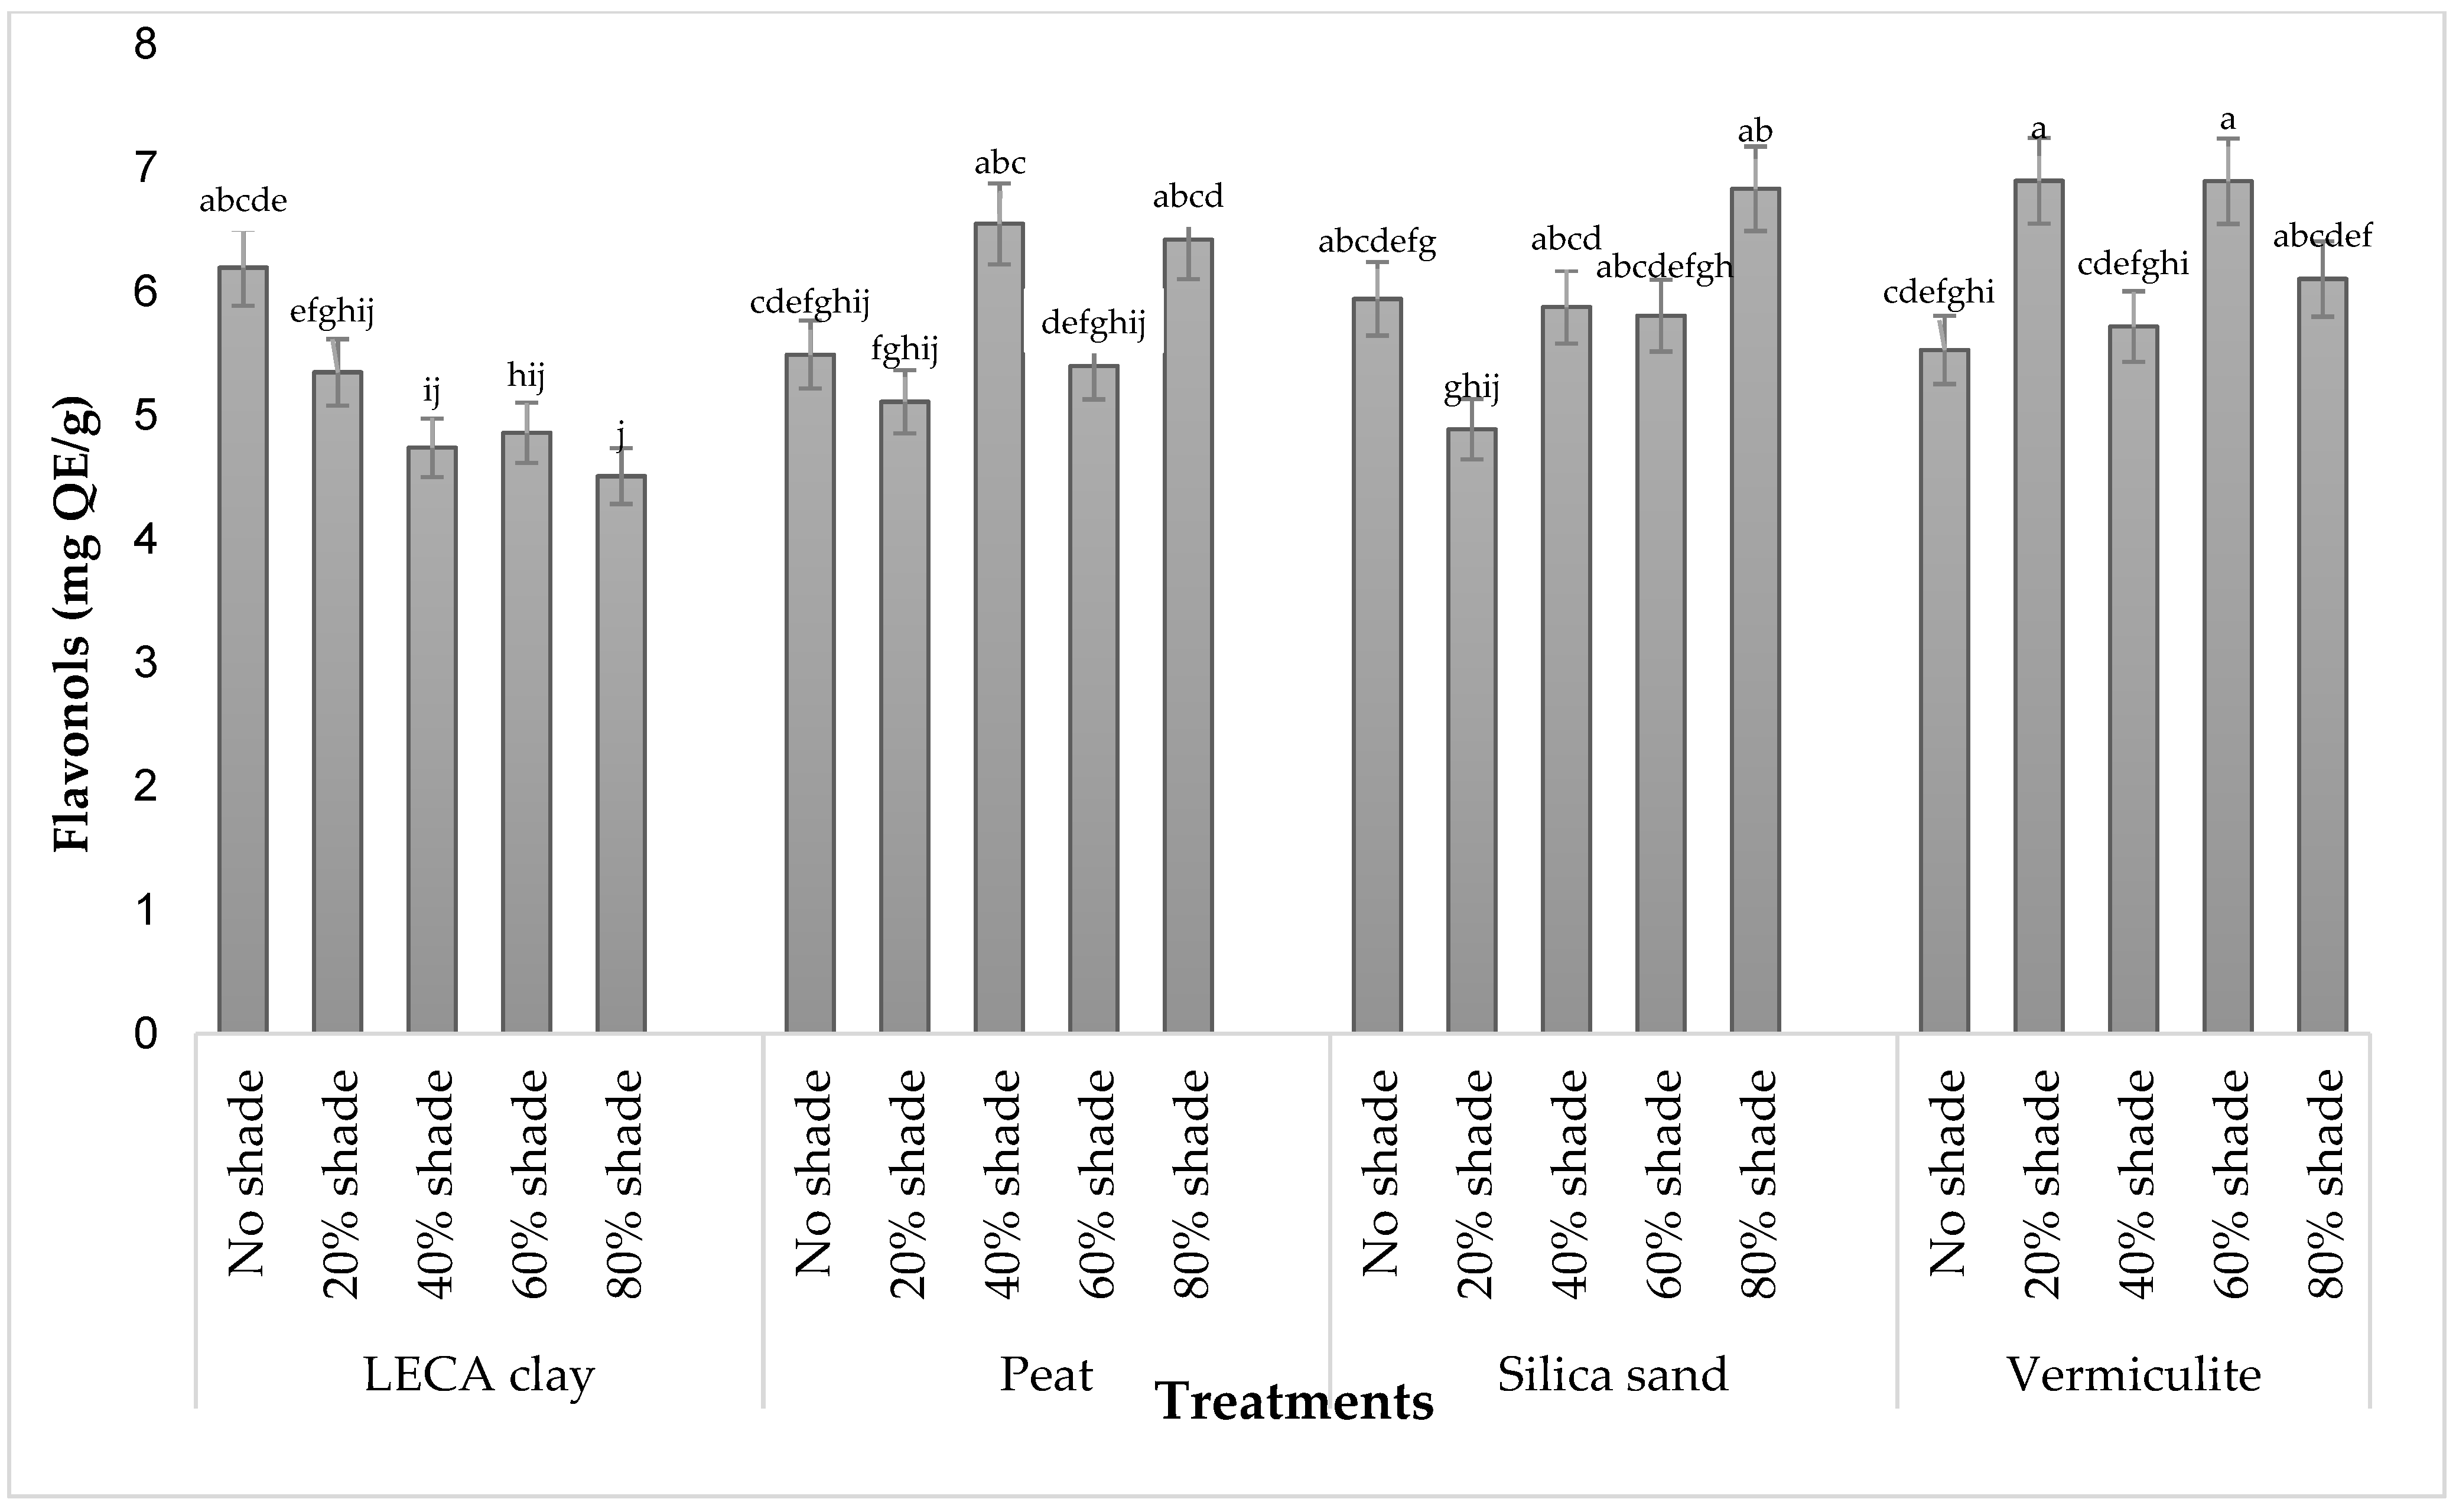
3.4.2. Total Flavonols

The highest flavonol content was recorded in the flower buds of plants grown in vermiculite under 20% and 60% shade levels, while LECA clay treated with 80% shade was the least effective (Figure 7). However, the highest content recorded in vermiculite under 20% and 60% was comparable to values obtained in vermiculite with 80% shade, silica sand with 40–80%, peat with 40 and 80%, and LECA clay with no shade treatment.

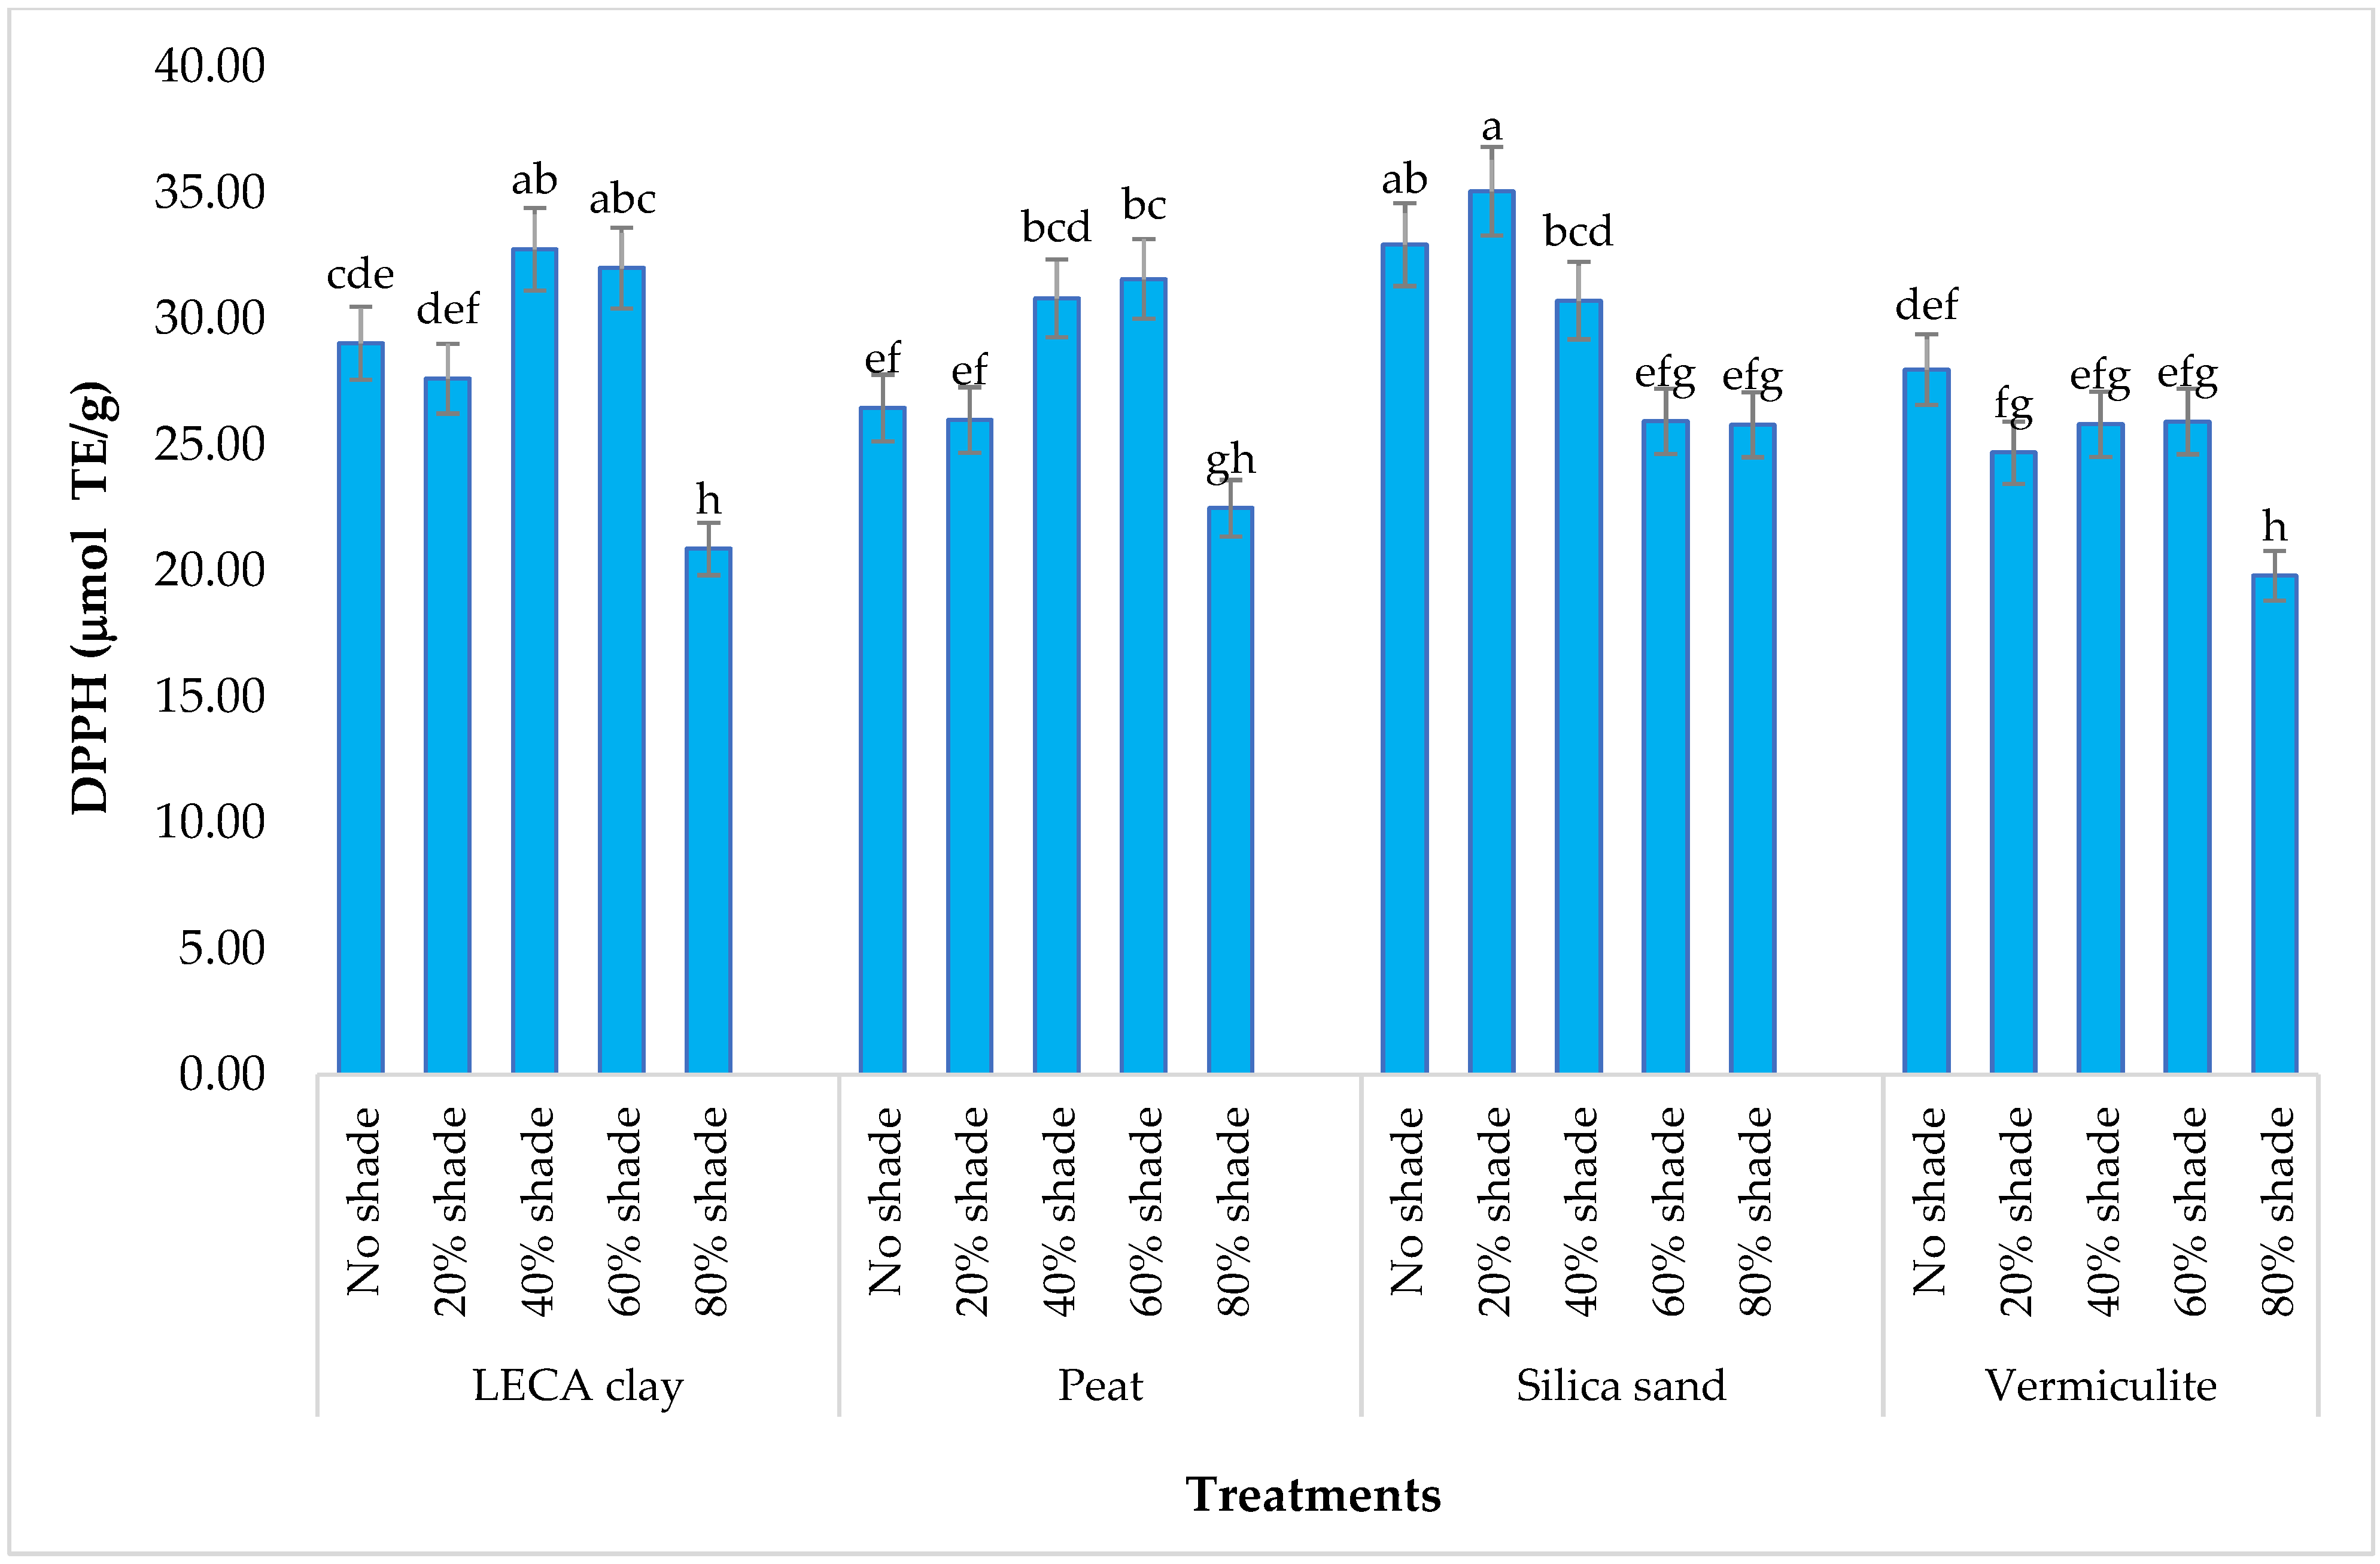
3.4.3. DPPH Antioxidant Content

The highest DDPH activity in flower buds of T. divaricata was recorded in plants cultivated in silica sand under 20% shade, and this was significantly higher than other treatments except silica with no shading and LECA clay with 40 and 60% shading. The lowest DPPH activity was recorded in plants treated with 80% shade levels in both LECA clay and vermiculite (Figure 8).

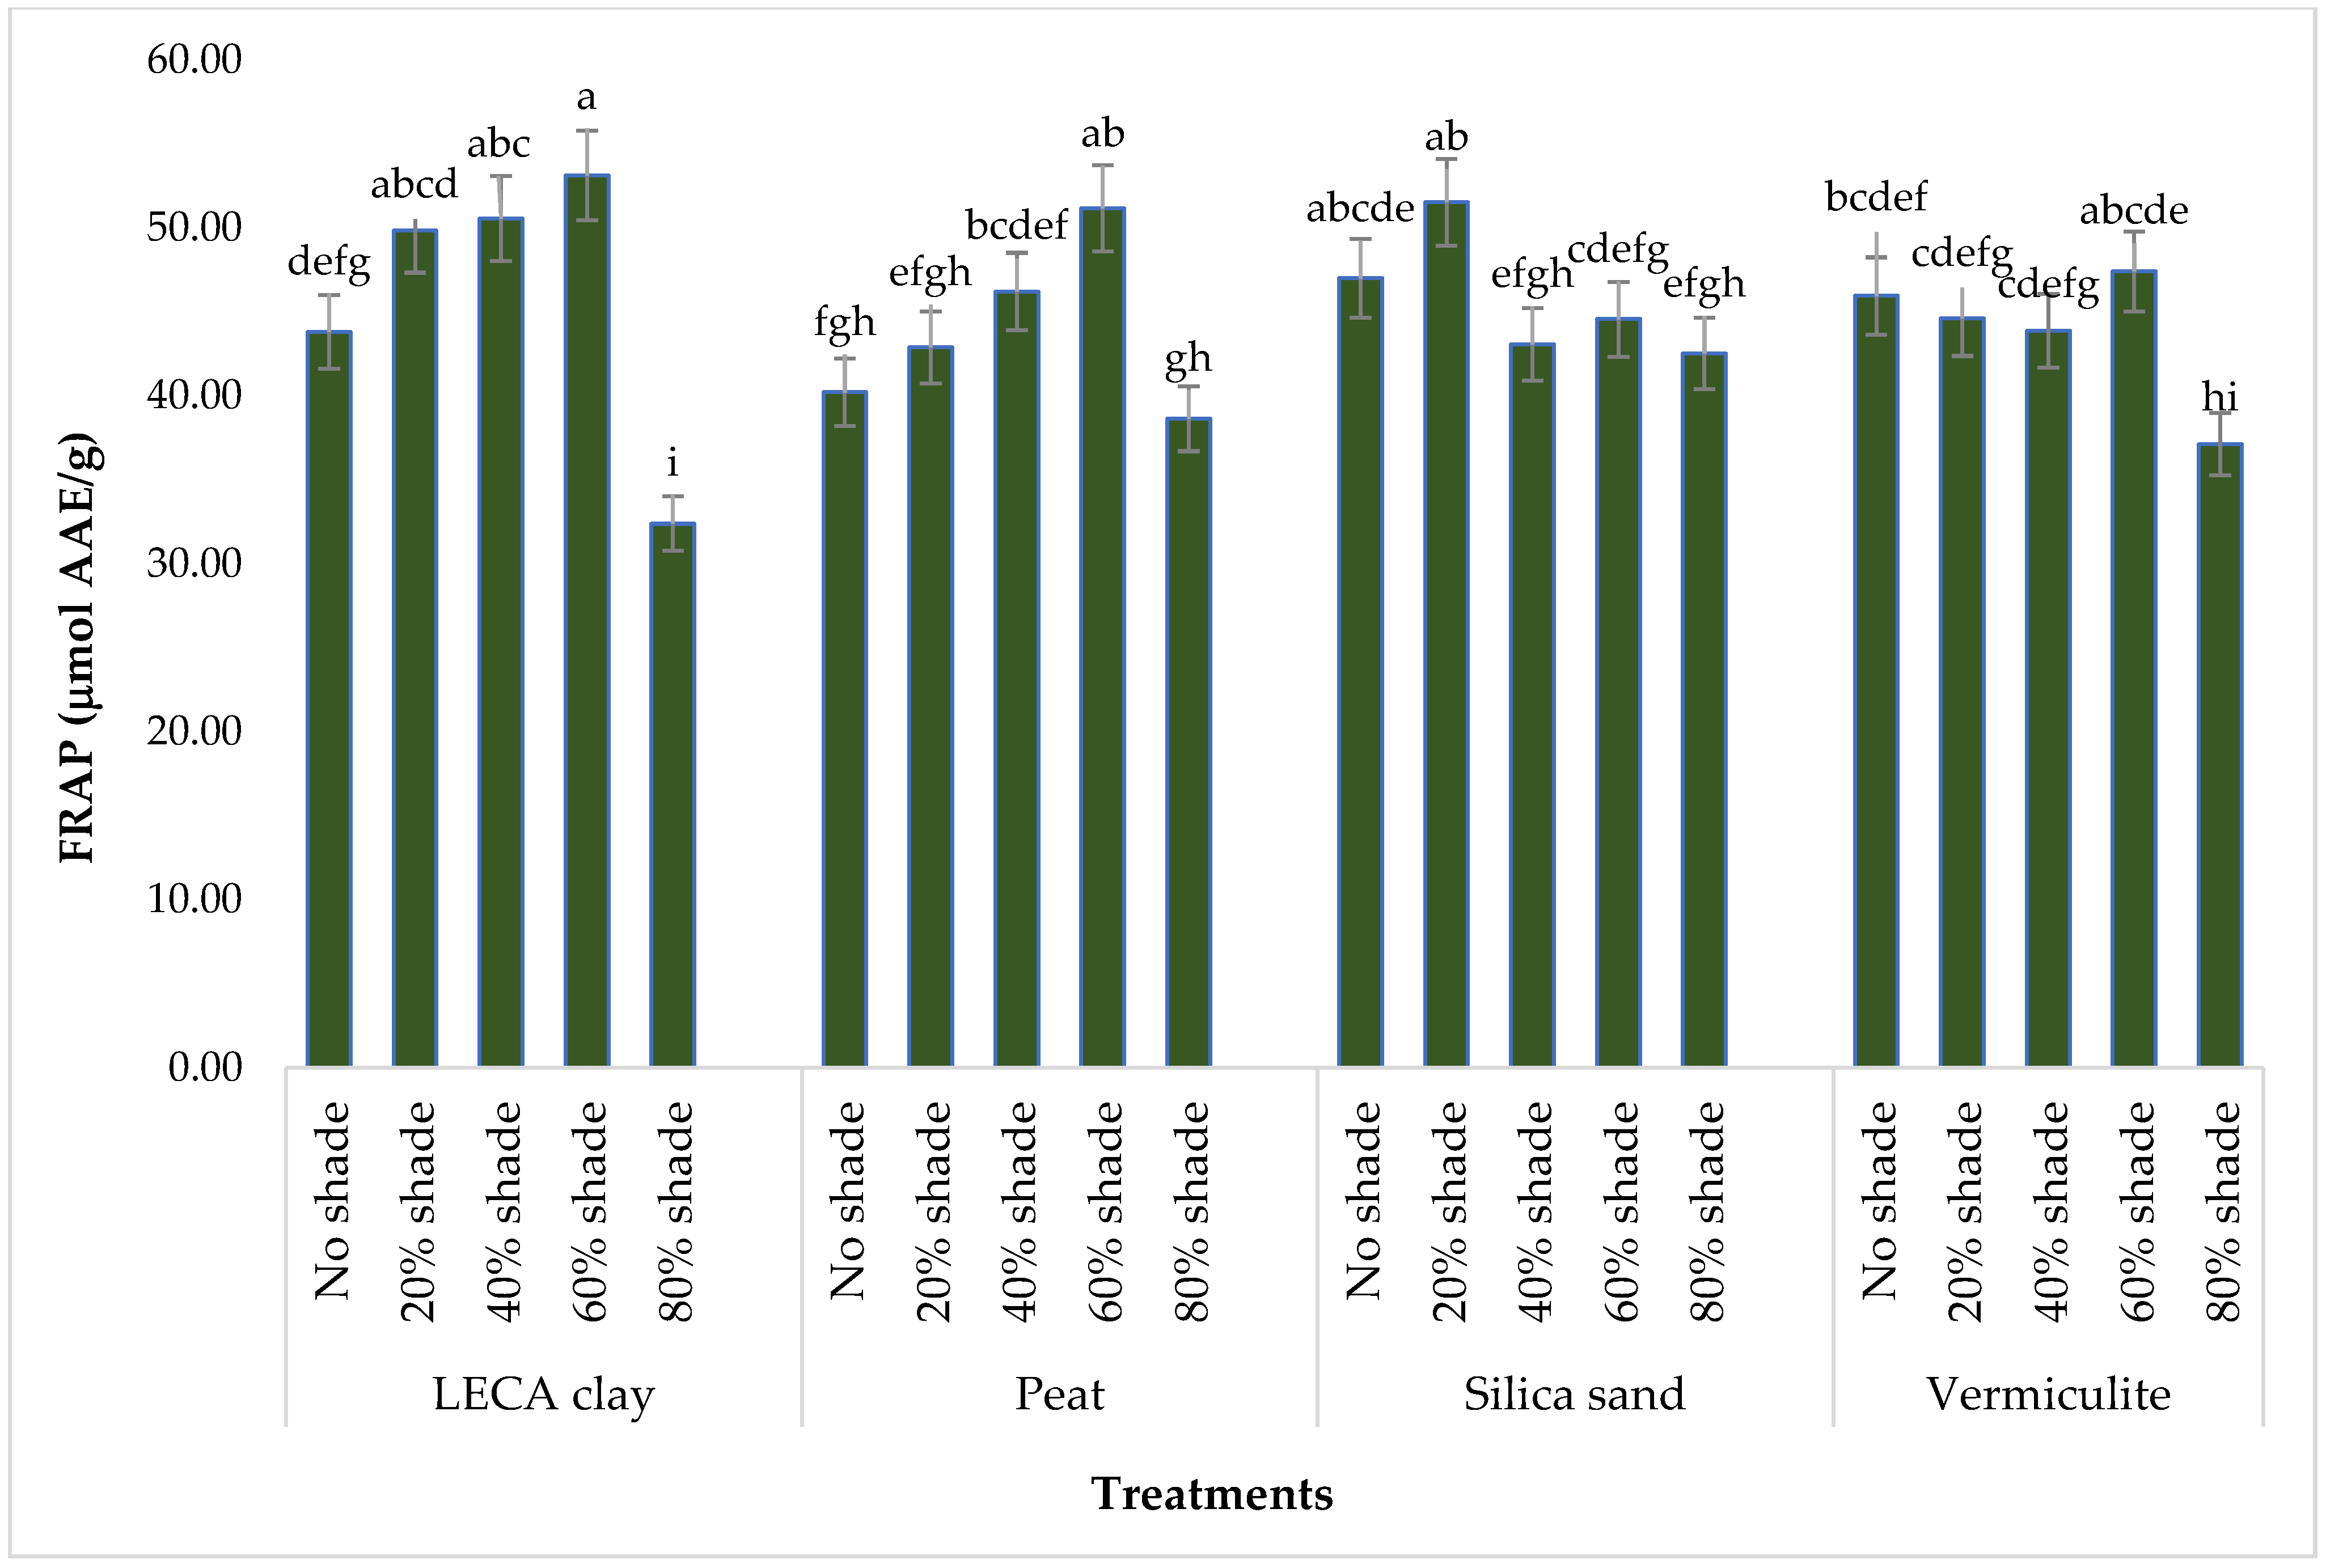
3.4.4. FRAP Antioxidant Content

The FRAP antioxidants in flower buds of T. divaricata showed significant variability in the tested samples (Figure 9). Plants grown in LECA clay under 60% shading had the highest FRAP content but did not differ significantly from FRAP values obtained in plants grown in silica sand (no shade and 20%), peat (60%), and LECA (20 and 40% shading). The least value was recorded in plants grown in LECA clay under 80% shading, and this was significantly lower than the control and all treatments.

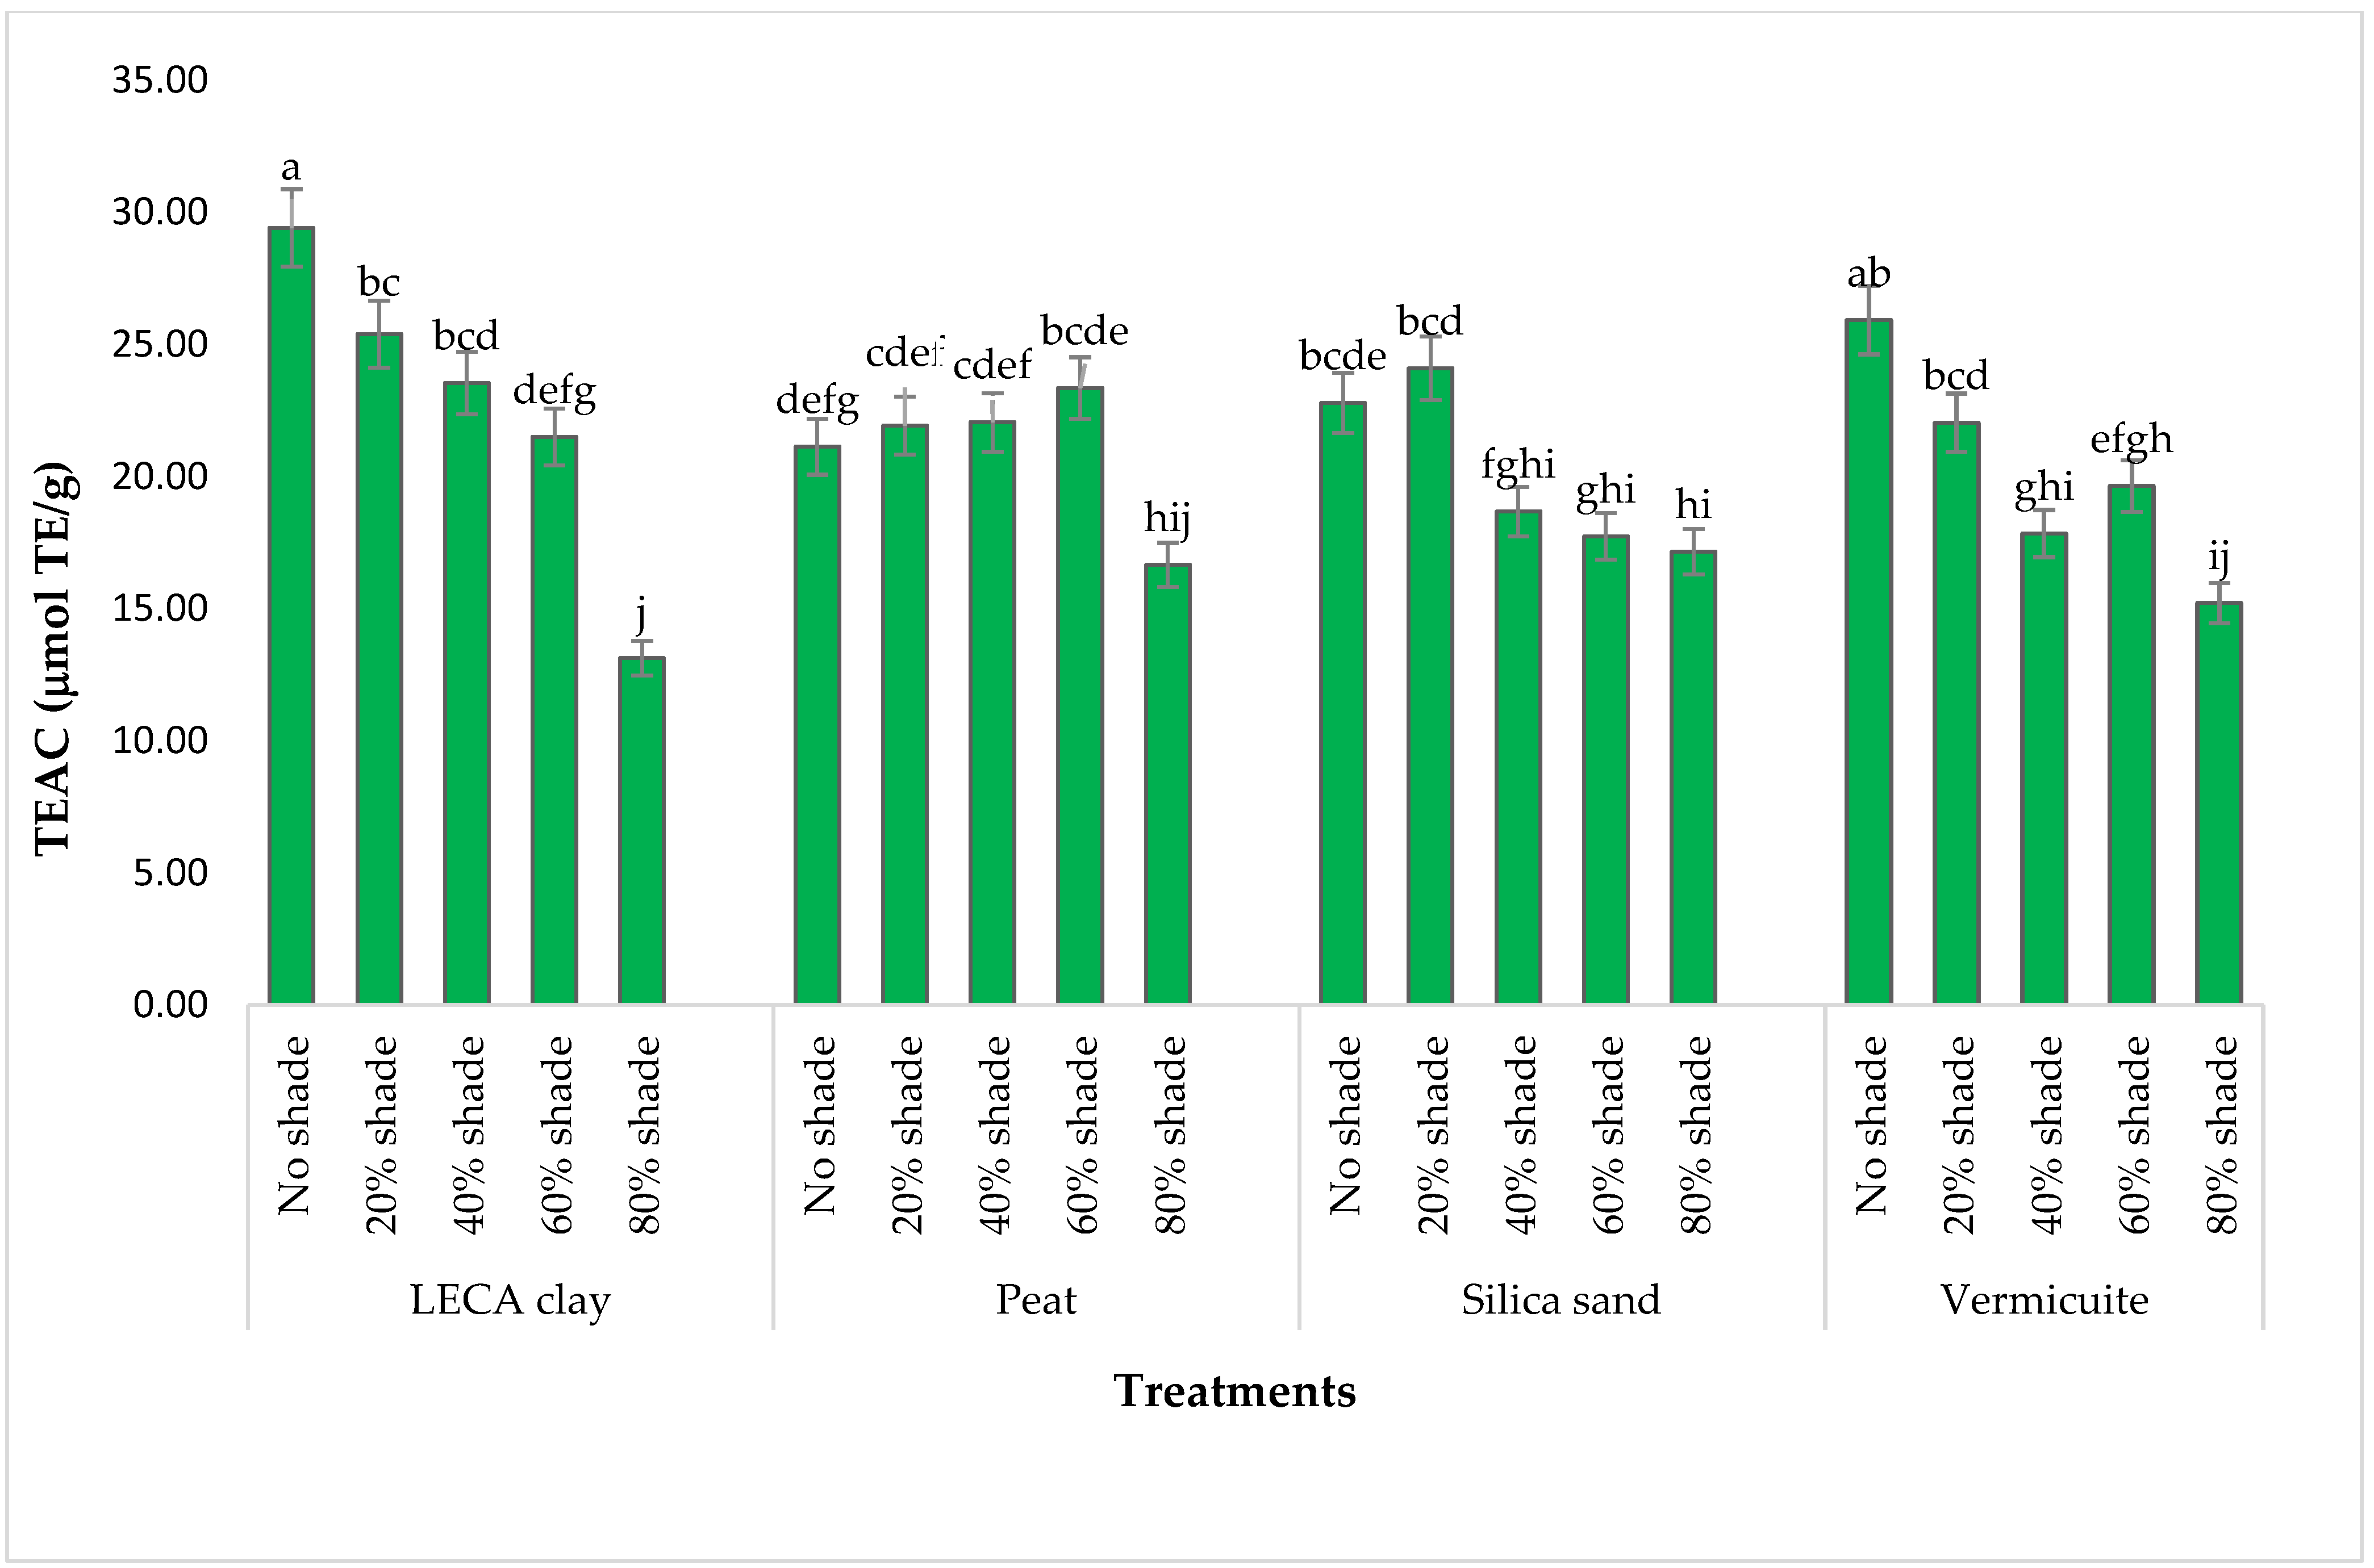
3.4.5. TEAC/ABTS Activity

Different growth media and shade levels had a significant effect on the estimated TEAC values (µmol TE/g) of T. divaricata flower buds (Figure 10). The LECA clay medium with no shade treatment yielded the highest mean value of TEAC, while the lowest was recorded in the 80%-shade-treated samples of the same medium. Samples of T. divaricata grown in vermiculite performed better than other treatments, especially under no shade, while variability was observed in the effects of other treatments on TEAC values of the experimented samples of T. divaricata (Figure 10).

4. Discussion

There is extensive literature on the reduction of growth caused by high light intensity in many plant species [53]. Nevertheless, Ncise et al. [6] and Appolloni et al. [54] reported that there are few studies conducted on the interactive effects of light intensity and media on plant growth, nutrition, and biosynthesis of secondary metabolites in edible inflorescence species. In the present study, the effects of the varying light intensity and growth media on the growth and phytochemicals in T. divaricata were evaluated. Plants cultivated in peat under normal greenhouse lighting (no shade) had the highest leaf number, flower buds, and fresh and dry weight compared with those grown under shade levels and varying growth media. Similar findings were observed on Mitragyna speciosa Korth by Zhang et al. [13], where height, average leaf size, and total leaf dry mass were increased in response to unshaded greenhouse conditions. In addition, peat has been reported to play a crucial role in water and nutrient retention in hydroponically grown plants [55]. Thus, an increase in plant growth parameters were observed in this media as compared to sand, LECA clay, and vermiculite. Conversely, plants developed significantly more specific leaf size and total chlorophyll content under shade levels. These findings are in contrast with those observed by Kalaitzoglou et al. [12] on shade climatic response of tomato plants, where lower light absorbance and lower chlorophyll content were recorded in shaded plants. This then indicates that T. divaricata optimises light captured and increases light efficiency to maximise photosynthesis and gain carbon under shaded conditions. This was also reported by Zhang et al. [13] on Mitragyna speciosa and Tran, [14] on Fraxinus latifolia seedlings under varying levels of light exposure.
Light has long been recognised as the most important factor influencing growth and mineral composition in plants [56]. These mineral nutrients are indispensable due to their major roles in the human diet [57]. Thus, there is a need to understand plants’ response to light intensity and growth media to enhance their nutritional value and supplement the world’s food and nutritional security. In this study, the nutritional composition of Trachyandra divaricata flower buds were evaluated due to their edibility. The results showed that all tested samples experienced significant variations, which indicates that light intensity and growth media modulate mineral composition in this species. As a result, most of the minerals found in plant samples exceeded the recommended dietary allowance (RDA).
Calcium (Ca) is responsible for bone and muscle formation and maintenance, as well as preventing osteopenia and osteoporosis in the body caused by some chemotherapeutic agents [58]. In the present study, only plants grown in LECA clay under 80% shading meet the RDA of 1000 mg for Ca, while K/Ca + Mg yield was well above the RDA value of 1956 mg/100 g, regardless of light intensity and growth media. These results substantiate earlier findings of Diviš et al. [59] on the edible flower of Sambucus nigra L., where Ca ranged from 474 to 1228 mg/100 g and K/Ca + Mg from 1967 to 3439 mg/100 g.
Potassium is an important nutrient in a healthy diet. It is essential physiologically because extracellular and intracellular cations are required to maintain blood pressure, nerve impulse conduction [45], and muscular contractility [45]. A minimum of 2000 mg K is recommended for an adult and it is widely available in T. divaricata. The highest yield of potassium was recorded in plants grown in peat under 20% shade. When compared to previous reports of other edible inflorescence plants such as red Amaranthus species [60], Cynara cardunculus [61], banana inflorescence [62], and Brassica oleracea var. italica Plenck [63], potassium content of the evaluated inflorescence of T. divaricata was significantly higher. This suggests that the species is a good source of dietary potassium.
Magnesium serves a variety of important functions, including structural roles in proteins and polyribosomes, cell adhesion, nucleic acids, neurotransmitter release, stabilisation of Ca/K homeostasis, and as an enzymatic cofactor [64]. This mineral was found to be well above the RDA value in analysed samples of T. divaricata, suggesting that the plant is a rich source of magnesium. As recommended by the USAD (2018), the standard magnesium content in 100 g of cooked broccoli is 12 mg, while amaranth food is 55 mg. This is far below the values obtained in all samples analysed, where the Mg contents ranged from 249.00 to 478.50 mg/100 g, suggesting that growth media and light intensity positively modulate this mineral in T. divaricata. When examining phosphorus, plants grown in vermiculite under 40, 60, and 80% shading as well as the plants grown in peat under 60% shading met the RDA of 700 mg. Phosphorus is an essential nutrient in the human diet, acting as a physiologic buffer, a substrate for critical cellular functions, and as a component of bone mineral in the skeleton alongside calcium [65]. Thus, eating the flower buds of this vegetable will help strengthen the human skeletal system.
Iron, zinc, aluminium, copper, and manganese are all essential micronutrients required in less than 20 mg per day and account for less than 0.01% of body weight [57]. The micronutrients present in the flower bud of T. divaricata were far below the RDA, except iron in a few treatments. These trace elements were lower than values reported on other edible inflorescence species such as banana (Musa spp.) [62], asparagus (Asparagus officinalis L.) [66], and Cynara cardunculus L. [61]. On the basis of these findings, it can be assumed that the flower buds of T. divaricata are safe to consume because they accumulated fewer heavy metals than other inflorescence vegetables.
The proximate content of the flower buds of the tested plant differed significantly in the present study. The ash composition of the analysed samples was high in comparison to similar records on inflorescence vegetables, which usually do not exceed 5% [67]. The ash content of the flower bud ranged from 11% to 20.86% among treatments, which corresponds to the composition found in processed foods [68]. These findings correspond with those reported by Fernandes et al. [69] on cauliflower, pumpkin, and broccoli, where the ash content ranged from 12 to 15%. The nutritional value of food is measured by the level of its ash content, which is thought to be a reflection of the mineral contents preserved in food materials [70]. Moreover, the presence of high ash value indicates that the plant is high in dietary fibres, which provide shelter for digestive organisms in the alimentary tract [71].
Generally edible flowers such as Erythrina caribaea, Aloe vera, Allium schoenoprasum, Brassica oleracea var. italica, and Erythrina americana have been reported to have low levels of unsaturated fats, which normally range from 1.5 to 3% [69]. The fat content obtained from the flower buds of T. divaricata (1.56 to 2.25%) fall within the range of these well-known edible flowers. Fat in vegetables provides energy, fatty acids, and vitamins, which add to the palatability through flavour retention [72]. Protein values ranged from 17 to 22.82% in tested treatments, and these were comparable to other well-known edible flowers such as Tropaeolum majus [67], Erythrina americana [73], Brassica oleracea var. botrytis, and Brassica oleracea var. italica [69]. The moisture content ranged from 6.25 to 11.53% in the tested treatments, including the control. These values are too low when compared to other edible flowers, which average between 70 to 80% in moisture. This suggest that the flower buds of this plant might have a long storage lifespan, which will favour the growers and sellers. The plant may be explored further for its potential use as a plant-based preservative used in enhancing the shelf life of food.
Fruits and vegetables with high antioxidant capacity add value to food products and are well received by consumers and the food industry [74]. Consumption of plant products high in phenolic content can protect human tissue oxidation by scavenging free radicals and inhibiting lipid peroxidation, thereby improving nutritional quality, and avoiding potential problems caused by excessive consumption of synthetic additives [75]. As a result, it is critical to enhance the phytochemical components of fruits and vegetables during cultivation. One of the most important environmental variables in regulating vegetable growth, development, and phytochemical accumulation is light condition (light quality, light intensity, and photoperiod), which is especially important for vegetables grown in controlled environments [76]. In the present study, the flower buds of plants grown under 20% shade had higher polyphenols than other treatments, while the media had no significant effect on the accumulation of polyphenols. This supports the findings of [6] on Tulbaghia violacea flower stalk, where low light intensity increased the polyphenols. On the contrary, the flavonol compositions among light intensities were variable. This contradicts the results of [77] on broccoli microgreens where high light intensity increased the flavonol content. Nevertheless, the antioxidant capacity was increased in plants grown in LECA clay and peat under 40 and 60% shade, except TEAC. These results show that light intensity and growth media may affect not only plant yield but also the synthesis of other biologically active substances, such as phenolics, which have a protective role against induced stress responses [78].

5. Conclusions

The current study found that light intensity and media influenced the growth, mineral composition, proximate contents, and antioxidant capacity of T. divaricata. The accumulation of high mineral nutrients in flower buds reflects a vegetable characteristic that provides nutrients. The high fibre content of the flower buds validates its digestive effectiveness in humans, and its high protein content validates its value as an immune booster, important nutraceutical, and as a potential functional food. The lower moisture content indicates that the plant may have a long storage lifespan, as well as a potential in improving the shelf life of food. Plants grown in peat under normal greenhouse conditions had improved growth parameters, while variation was observed in proximate compositions as well as phytochemical composition in response to light intensity and growth substrate. On the basis of these findings, T. divaricata should be domesticated due to its rich nutritional value.

Author Contributions

Conceptualisation, M.O.J. and C.P.L.; methodology, M.O.J. and C.P.L.; software, M.O.J., A.S. and C.M.W.; validation, C.P.L. and M.O.J. formal analysis, M.O.J. and A.S.; investigation, A.T., M.O.J. and C.P.L.; resources, C.P.L.; data curation, M.O.J. and A.S.; writing—original draft preparation, A.T.; writing—review and editing, A.S., M.O.J., C.M.W. and C.P.L.; supervision, M.O.J. and C.P.L.; project administration, C.P.L.; funding acquisition, C.P.L. All authors have read and agreed to the published version of the manuscript.

Funding

This research was funded by the Cape Peninsula University of Technology through the University Research Fund.

Data Availability Statement

All data are included in the manuscript.

Acknowledgments

The authors would like to thank Fanie Rautenbach of the Oxidative Stress Research Centre, Department of Biomedical Sciences, Cape Peninsula University of Technology for his support and the technicians (Phumlani Roto and Terence Mabela) in the Department of Horticultural Sciences for the acquisition of all necessary equipment and reagents for the experiment.

Conflicts of Interest

The authors declare no conflict of interest.

References

  1. Singh, S.; Kumar, V.; Kapoor, D.; Kumar, S.; Singh, S.; Dhanjal, D.S.; Datta, S.; Samuel, J.; Dey, P.; Wang, S.; et al. Revealing on Hydrogen Sulfide and Nitric Oxide Signals Co-Ordination for Plant Growth under Stress Conditions. Physiol. Plant 2020, 168, 301–317. [Google Scholar] [CrossRef] [Green Version]
  2. Zahid, G.; Iftikhar, S.; Shimira, F.; Ahmad, H.M.; Aka Kaçar, Y. An Overview and Recent Progress of Plant Growth Regulators (PGRs) in the Mitigation of Abiotic Stresses in Fruits: A Review. Sci. Hortic. 2023, 309, 111621. [Google Scholar] [CrossRef]
  3. Huang, L.Z.; Zhou, M.; Ding, Y.F.; Zhu, C. Gene Networks Involved in Plant Heat Stress Response and Tolerance. Int. J. Mol. Sci. 2022, 23, 11970. [Google Scholar] [CrossRef] [PubMed]
  4. He, Z.; Webster, S.; He, S.Y. Growth–Defense Trade-Offs in Plants. Curr. Biol. 2022, 32, R634–R639. [Google Scholar] [CrossRef] [PubMed]
  5. Hazrati, S.; Tahmasebi-Sarvestani, Z.; Modarres-Sanavy, S.A.M.; Mokhtassi-Bidgoli, A.; Nicola, S. Effects of Water Stress and Light Intensity on Chlorophyll Fluorescence Parameters and Pigments of Aloe vera L. Plant Physiol. Biochem. 2016, 106, 141–148. [Google Scholar] [CrossRef]
  6. Ncise, W.; Daniels, C.W.; Nchu, F. Effects of Light Intensities and Varying Watering Intervals on Growth, Tissue Nutrient Content and Antifungal Activity of Hydroponic Cultivated Tulbaghia Violacea L. under Greenhouse Conditions. Heliyon 2020, 6, e03906. [Google Scholar] [CrossRef]
  7. Franklin, K.A. Light and Temperature Signal Crosstalk in Plant Development. Curr. Opin. Plant Biol. 2009, 12, 63–68. [Google Scholar] [CrossRef]
  8. Yang, L.Y.; Wang, L.T.; Ma, J.H.; Ma, E.D.; Li, J.Y.; Gong, M. Effects of Light Quality on Growth and Development, Photosynthetic Characteristics and Content of Carbohydrates in Tobacco (Nicotiana Tabacum L.) Plants. Photosynth. 2017, 55, 467–477. [Google Scholar] [CrossRef]
  9. Feng, L.; Raza, M.A.; Li, Z.; Chen, Y.; Bin Khalid, M.H.; Du, J.; Liu, W.; Wu, X.; Song, C.; Yu, L.; et al. The Influence of Light Intensity and Leaf Movement on Photosynthesis Characteristics and Carbon Balance of Soybean. Front. Plant Sci. 2019, 9, 1952. [Google Scholar] [CrossRef]
  10. Costa, L.C.D.B.; Pinto, J.E.B.P.; de Castro, E.M.; Alves, E.; Bertolucci, S.K.V.; Rosal, L.F. Effects of Coloured Shade Netting on the Vegetative Development and Leaf Structure of Ocimum selloi. Bragantia 2010, 69, 349–359. [Google Scholar] [CrossRef]
  11. Ptushenko, O.S.; Ptushenko, V.v.; Solovchenko, A.E. Spectrum of Light as a Determinant of Plant Functioning: A Historical Perspective. Life 2020, 10, 25. [Google Scholar] [CrossRef] [PubMed] [Green Version]
  12. Kalaitzoglou, P.; van Ieperen, W.; Harbinson, J.; van der Meer, M.; Martinakos, S.; Weerheim, K.; Nicole, C.C.S.; Marcelis, L.F.M. Effects of Continuous or End-of-Day Far-Red Light on Tomato Plant Growth, Morphology, Light Absorption, and Fruit Production. Front. Plant Sci. 2019, 10, 322. [Google Scholar] [CrossRef] [PubMed] [Green Version]
  13. Zhang, M.; Sharma, A.; León, F.; Avery, B.; Kjelgren, R.; McCurdy, C.R.; Pearson, B.J. Plant Growth and Phytoactive Alkaloid Synthesis in Kratom [Mitragyna speciosa (Korth.)] in Response to Varying Radiance. PLoS ONE 2022, 17, e0259326. [Google Scholar] [CrossRef] [PubMed]
  14. Tran, T. The Effect of Light Exposure on the Total Chlorophyll Content, Chl a/b Ratio, and Car/Chl Ratio in the Barks of Fraxinus Latifolia Seedlings; Portland State University: Portland, OR, USA, 2018. [Google Scholar]
  15. Jimoh, M.O.; Afolayan, A.J.; Lewu, F.B. Germination Response of Amaranthus Caudatus L. to Soil Types and Environmental Conditions. Thaiszia J. Bot. 2019, 29, 085–100. [Google Scholar] [CrossRef]
  16. Li, W.; Zhang, X.; Ashraf, U.; Mo, Z.; Suo, H.; Li, G. Dynamics of Seed Germination, Seedling Growth and Physiological Responses of Sweet Corn under PEG-Induced Water Stress. Pak. J. Bot. 2017, 49, 639–646. [Google Scholar]
  17. Ngxabi, S.; Jimoh, M.O.; Kambizi, L.; Laubscher, C.P. Edibility of Trachyandra ciliata (L.F.) Kunth- An Underutilized Vegetable from South African Western Cape Coast: A Review. Afr. J. FoodAgric. Nutr. Dev. 2021, 21, 18644–18661. [Google Scholar] [CrossRef]
  18. Faber, R.J.; Laubscher, C.P.; Rautenbach, F.; Jimoh, M.O. Variabilities in Alkaloid Concentration of Sceletium Tortuosum (L.) N.E. Br in Response to Different Soilless Growing Media and Fertigation Regimes in Hydroponics. Heliyon 2020, 6, e05479. [Google Scholar] [CrossRef] [PubMed]
  19. Ngxabi, S.; Jimoh, M.O.; Kambizi, L.; Laubscher, C.P. Growth Characteristics, Phytochemical Contents, and Antioxidant Capacity of Trachyandra ciliata (L.f) Kunth Grown in Hydroponics under Varying Degrees of Salinity. Horticulturae 2021, 7, 244. [Google Scholar] [CrossRef]
  20. Bulawa, B.; Sogoni, A.; Jimoh, M.O.; Laubscher, C.P. Potassium Application Enhanced Plant Growth, Mineral Composition, Proximate and Phytochemical Content in Trachyandra divaricata Kunth (Sandkool). Plants 2022, 11, 3183. [Google Scholar] [CrossRef]
  21. Burchi, F.; Fanzo, J.; Frison, E. The Role of Food and Nutrition System Approaches in Tackling Hidden Hunger. Int. J. Environ. Res. Public Health 2011, 8, 358–373. [Google Scholar] [CrossRef]
  22. Noort, M.W.J.; Renzetti, S.; Linderhof, V.; du Rand, G.E.; Marx-Pienaar, N.J.M.M.; de Kock, H.L.; Magano, N.; Taylor, J.R.N. Towards Sustainable Shifts to Healthy Diets and Food Security in Sub-Saharan Africa with Climate-Resilient Crops in Bread-Type Products: A Food System Analysis. Foods 2022, 11, 135. [Google Scholar] [CrossRef] [PubMed]
  23. Chivenge, P.; Mabhaudhi, T.; Modi, A.T.; Mafongoya, P. The Potential Role of Neglected and Underutilised Crop Species as Future Crops under Water Scarce Conditions in Sub-Saharan Africa. Int. J. Environ. Res. Public Health 2015, 12, 5685–5711. [Google Scholar] [CrossRef] [PubMed] [Green Version]
  24. Bvenura, C.; Sivakumar, D. The Role of Wild Fruits and Vegetables in Delivering a Balanced and Healthy Diet. Food Res. Int. 2017, 99, 15–30. [Google Scholar] [CrossRef] [PubMed]
  25. De Vynck, J.C.; van Wyk, B.E.; Cowling, R.M. Indigenous Edible Plant Use by Contemporary Khoe-San Descendants of South Africa’s Cape South Coast. South Afr. J. Bot. 2016, 102, 60–69. [Google Scholar] [CrossRef]
  26. Van Wyk, B.E. The Potential of South African Plants in the Development of New Food and Beverage Products. South Afr. J. Bot. 2011, 77, 857–868. [Google Scholar] [CrossRef] [Green Version]
  27. Botha, M.S.; Cowling, R.M.; de Vynck, J.C.; Esler, K.J.; Potts, A.J. The Response of Geophytes to Continuous Human Foraging on the Cape South Coast, South Africa and Its Implications for Early Hunter-Gatherer Mobility Patterns. PeerJ 2022, 10, e13066. [Google Scholar] [CrossRef]
  28. Shew, A.M.; Tack, J.B.; Nalley, L.L.; Chaminuka, P. Yield Reduction under Climate Warming Varies among Wheat Cultivars in South Africa. Nat. Commun 2020, 11, 4408 . [Google Scholar] [CrossRef]
  29. Salami, S.O.; Adegbaju, O.D.; Idris, O.A.; Jimoh, M.O.; Olatunji, T.L.; Omonona, S.; Orimoloye, I.R.; Adetunji, A.E.; Olusola, A.; Maboeta, M.S.; et al. South African wild fruits and vegetables under a changing climate: The implications on health and economy. S. Afr. J. Bot. 2021, 145, 13–27. [Google Scholar] [CrossRef]
  30. Govender, L.; Pillay, K.; Siwela, M.; Modi, A.; Mabhaudhi, T. Food and Nutrition Insecurity in Selected Rural Communities of KwaZulu-Natal, South Africa—Linking Human Nutrition and Agriculture. Int. J. Env. Res. Public Health 2017, 14, 17. [Google Scholar] [CrossRef] [Green Version]
  31. Viljoen, C.C.; Jimoh, M.O.; Laubscher, C.P. Studies of Vegetative Growth, Inflorescence Development and Eco-Dormancy Formation of Abscission Layers in Streptocarpus formosus (Gesneriaceae). Horticulturae 2021, 7, 120. [Google Scholar] [CrossRef]
  32. Silber, A. Chemical Characteristics of Soilless Media. In Soilless Culture: Theory and Practice, 2nd ed.; Raviv, M., Lieth, J.H., Bar-Tal, A., Eds.; Academic Press: London, UK, 2019; pp. 113–148. [Google Scholar] [CrossRef]
  33. Bar-Tal, A.; Saha, U.K.; Raviv, M.; Tuller, M. Inorganic and Synthetic Organic Components of Soilless Culture and Potting Mixtures. In Soilless Culture: Theory and Practice, 2nd ed.; Raviv, M., Lieth, J.H., Bar-Tal, A., Eds.; Academic Press: London, UK, 2019; pp. 259–301. [Google Scholar] [CrossRef]
  34. Kazemi, F.; Mohorko, R. Review on the Roles and Effects of Growing Media on Plant Performance in Green Roofs in World Climates. Urban Urban Green 2017, 23, 13–26. [Google Scholar] [CrossRef]
  35. Mlih, R.; Bydalek, F.; Klumpp, E.; Yaghi, N.; Bol, R.; Wenk, J. Light-Expanded Clay Aggregate (LECA) as a Substrate in Constructed Wetlands–A Review. Ecol. Eng. 2020, 148, 105783. [Google Scholar] [CrossRef]
  36. Zhang, J.; Liu, T.; Huang, Q.; Luo, Z.; Lu, A.; Zhu, L. Preparation, Properties Characterization and Structure Formation Mechanism of Silica Sand Tailings-Based Ceramic Materials. Mater. Chem. Phys. 2020, 255, 123611. [Google Scholar] [CrossRef]
  37. Katz, O.; Puppe, D.; Kaczorek, D.; Prakash, N.B.; Schaller, J. Silicon in the Soil–Plant Continuum: Intricate Feedback Mechanisms within Ecosystems. Plants 2021, 10. [Google Scholar] [CrossRef] [PubMed]
  38. Euliss, K.W.; Dorsey, B.L.; Benke, K.C.; Banks, M.K.; Schwab, A.P. The Use of Plant Tissue Silica Content for Estimating Transpiration. Ecol. Eng. 2005, 25, 343–348. [Google Scholar] [CrossRef]
  39. Kremenetskaya, I.; Ivanova, L.; Chislov, M.; Zvereva, I.; Vasilieva, T.; Marchevskaya, V.; Semushin, V.; Slukovskaya, M. Physicochemical Transformation of Expanded Vermiculite after Long-Term Use in Hydroponics. Appl. Clay Sci. 2020, 198, 105839. [Google Scholar] [CrossRef]
  40. Kern, J.; Tammeorg, P.; Shanskiy, M.; Sakrabani, R.; Knicker, H.; Kammann, C.; Tuhkanen, E.M.; Smidt, G.; Prasad, M.; Tiilikkala, K.; et al. Synergistic Use of Peat and Charred Material in Growing Media–an Option to Reduce the Pressure on Peatlands? J. Environ. Eng. Landsc. Manag. 2017, 25, 25–160. [Google Scholar] [CrossRef] [Green Version]
  41. Simons, K.L.; Ansar, A.; Kadali, K.; Bueti, A.; Adetutu, E.M.; Ball, A.S. Investigating the Effectiveness of Economically Sustainable Carrier Material Complexes for Marine Oil Remediation. Bioresour. Technol. 2012, 126, 202–207. [Google Scholar] [CrossRef]
  42. Brown, P.A.; Gill, S.A.; Allen, S.J. Metal Removal from Wastewater Using Peat. Water. Res. 2000, 34, 3907–3916. [Google Scholar] [CrossRef]
  43. Jimoh, M.O.; Afolayan, A.J.; Lewu, F.B. Nutrients and Antinutrient Constituents of Amaranthus caudatus L. Cultivated on Different Soils. Saudi. J. Biol. Sci. 2020, 27, 3570–3580. [Google Scholar] [CrossRef] [PubMed]
  44. Sogoni, A. The Effect of Salinity and Substrates on the Growth Parameters and Antioxidant Potential of Tetragonia decumbens (Dune Spinach) for Horticultural Applications. Master’s Dissertation, Cape Peninsula University of Technology, Cape Town, South Africa, 2020. [Google Scholar]
  45. Olatunji, T.L.; Afolayan, A.J. Comparison of nutritional, antioxidant vitamins and capsaicin contents in Capsicum annuum and C. frutescens. Int. J. Veg. Sci. 2020, 26, 190–207. [Google Scholar] [CrossRef]
  46. AOAC (Association of Official Analytical Chemist). Official Methods of Analysis; Latimer, G.W., Jr., Ed.; AOAC International: Washinton DC, USA, 2016; ISBN 0935584870. [Google Scholar]
  47. Idris, O.A.; Wintola, O.A.; Afolayan, A.J. Comparison of the Proximate Composition, Vitamins (Ascorbic Acid, α-Tocopherol and Retinol), Anti-Nutrients (Phytate and Oxalate) and the GC-MS Analysis of the Essential Oil of the Root and Leaf of Rumex crispus L. Plants 2019, 8. [Google Scholar] [CrossRef] [PubMed] [Green Version]
  48. Sogoni, A.; Jimoh, M.O.; Kambizi, L.; Laubscher, C.P. The Impact of Salt Stress on Plant Growth, Mineral Composition, and Antioxidant Activity in Tetragonia decumbens Mill.: An Underutilized Edible Halophyte in South Africa. Horticulturae 2021, 7, 140. [Google Scholar] [CrossRef]
  49. Lim, S.H.; Kim, D.H.; Jung, J.A.; Hyung, N.I.; Youn, Y.; Lee, J.Y. Silencing of Dihydroflavonol 4-Reductase in Chrysanthemum Ray Florets Enhances Flavonoid Biosynthesis and Antioxidant Capacity. Plants 2022, 11, 1681. [Google Scholar] [CrossRef] [PubMed]
  50. Ohikhena, F.; Wintola, O.; Afolayan, A.J. Quantitative Phytochemical Constituents and Antioxidant Activities of the Mistletoe, Phragmanthera capitata (Sprengel) Balle Extracted with Different Solvents. Pharmacogn. Res. 2018, 10, 16–23. [Google Scholar] [CrossRef]
  51. Jimoh, M.O.; Afolayan, A.J.; Lewu, F.B. Antioxidant and Phytochemical Activities of Amaranthus caudatus L. Harvested from Different Soils at Various Growth Stages. Sci. Rep. 2019, 9, 12965. [Google Scholar] [CrossRef] [Green Version]
  52. Jimoh, M.A.; Idris, O.A.; Jimoh, M.O. Cytotoxicity, Phytochemical, Antiparasitic Screening, and Antioxidant Activities of Mucuna pruriens (Fabaceae). Plants 2020, 9, 1249. [Google Scholar] [CrossRef]
  53. Feller, U.; Rahman, S.; Marinello, F.; Lara, I.; Ortiz, R.; Bacenetti, J.; Cecchini, M.; Andolfi, A.; Ho Kim, K.; Rayhan Ahmed Shawon, M.; et al. Effect of Shade Screen on Sap Flow, Chlorophyll Fluorescence, NDVI, Plant Growth and Fruit Characteristics of Cultivated Paprika in Greenhouse. Agriculture 2022, 12, 1405. [Google Scholar] [CrossRef]
  54. Appolloni, E.; Pennisi, G.; Zauli, I.; Carotti, L.; Paucek, I.; Quaini, S.; Orsini, F.; Gianquinto, G. Beyond Vegetables: Effects of Indoor LED Light on Specialized Metabolite Biosynthesis in Medicinal and Aromatic Plants, Edible Flowers, and Microgreens. J. Sci. Food Agric. 2022, 102, 472–487. [Google Scholar] [CrossRef]
  55. Kitir, N.; Yildirim, E.; Şahin, Ü.; Turan, M.; Ekinci, M.; Ors, S.; Kul, R.; Ünlü, H.; Ünlü, H. Peat Use in Horticulture. In Peat; Topcuoğlu, B., Turan, M., Eds.; IntechOpen: London, UK, 2018; pp. 75–90. [Google Scholar] [CrossRef] [Green Version]
  56. Shao, Q.; Wang, H.; Guo, H.; Zhou, A.; Huang, Y.; Sun, Y.; Li, M. Effects of Shade Treatments on Photosynthetic Characteristics, Chloroplast Ultrastructure, and Physiology of Anoectochilus roxburghii. PLoS ONE 2014, 9, e85996. [Google Scholar] [CrossRef]
  57. Ogundola, A.F.; Bvenura, C.; Afolayan, A.J. Nutrient and Antinutrient Compositions and Heavy Metal Uptake and Accumulation in S. nigrum Cultivated on Different Soil Types. Sci. World J. 2018, Article ID 5703929, 1–20. [Google Scholar] [CrossRef] [Green Version]
  58. Cope, D.G. Nursing Considerations for Androgen Deprivation Therapy and Bone Health in Men Affected by Prostate Cancer. Semin. Oncol. Nurs. 2022, 38, 151271. [Google Scholar] [CrossRef]
  59. Diviš, P.; Pořízka, J.; Vespalcov, M.; Matějíček, A.; Kaplan, J. Elemental Composition of Fruits from Different Black Elder (Sambucus nigra L.) Cultivars Grown in the Czech Republic. J. Elem. 2015, 20, 549–557. [Google Scholar] [CrossRef]
  60. Achigan-Dako, E.G.; Sogbohossou, O.E.D.; Maundu, P. Current Knowledge on Amaranthus Spp.: Research Avenues for Improved Nutritional Value and Yield in Leafy Amaranths in Sub-Saharan Africa. Euphytica 2014, 197, 303–317. [Google Scholar] [CrossRef]
  61. Gostin, A.I.; Waisundara, V.Y. Edible Flowers as Functional Food: A Review on Artichoke (Cynara cardunculus L.). Trends Food Sci. Technol. 2019, 86, 381–391. [Google Scholar] [CrossRef]
  62. Lau, B.F.; Kong, K.W.; Leong, K.H.; Sun, J.; He, X.; Wang, Z.; Mustafa, M.R.; Ling, T.C.; Ismail, A. Banana Inflorescence: Its Bio-Prospects as an Ingredient for Functional Foods. Trends Food Sci. Technol. 2020, 97, 14–28. [Google Scholar] [CrossRef]
  63. Li, H.; Xia, Y.; Liu, H.Y.; Guo, H.; He, X.Q.; Liu, Y.; Wu, D.T.; Mai, Y.H.; Li, H.-B.; Zou, L.; et al. Nutritional Values, Beneficial Effects, and Food Applications of Broccoli (Brassica oleracea Var. Italica Plenck). Trends Food Sci. Technol. 2022, 119, 288–308. [Google Scholar] [CrossRef]
  64. Barbagallo, M.; Veronese, N.; Dominguez, L.J. Magnesium in Aging, Health and Diseases. Nutrients 2021, 13, 463. [Google Scholar] [CrossRef]
  65. Serna, J.; Bergwitz, C. Importance of Dietary Phosphorus for Bone Metabolism and Healthy Aging. Nutrients 2020, 12, 3001. [Google Scholar] [CrossRef]
  66. Guo, Q.; Wang, N.; Liu, H.; Li, Z.; Lu, L.; Wang, C. The Bioactive Compounds and Biological Functions of Asparagus officinalis L.–A Review. J. Funct. Foods 2020, 65, 103727. [Google Scholar] [CrossRef]
  67. Navarro-González, I.; González-Barrio, R.; García-Valverde, V.; Bautista-Ortín, A.B.; Periago, M.J. Nutritional Composition and Antioxidant Capacity in Edible Flowers: Characterisation of Phenolic Compounds by HPLC-DAD-ESI/MSn. Int. J. Mol. Sci. 2014, 16, 805–822. [Google Scholar] [CrossRef] [Green Version]
  68. Muñoz-Arrieta, R.; Esquivel-Alvarado, D.; Alfaro-Viquez, E.; Alvarez-Valverde, V.; Krueger, C.G.; Reed, J.D. Nutritional and Bioactive Composition of Spanish, Valencia, and Virginia Type Peanut Skins. J. Food Compos. Anal. 2021, 98, 103816. [Google Scholar] [CrossRef]
  69. Fernandes, L.; Casal, S.; Pereira, J.A.; Saraiva, J.A.; Ramalhosa, E. Edible Flowers: A Review of the Nutritional, Antioxidant, Antimicrobial Properties and Effects on Human Health. J. Food Compos. Anal. 2017, 60, 38–50. [Google Scholar] [CrossRef]
  70. Radha; Kumar, M.; Puri, S.; Pundir, A.; Bangar, S.P.; Changan, S.; Choudhary, P.; Parameswari, E.; Alhariri, A.; Samota, M.K.; et al. Evaluation of Nutritional, Phytochemical, and Mineral Composition of Selected Medicinal Plants for Therapeutic Uses from Cold Desert of Western Himalaya. Plants 2021, 10, 1429. [Google Scholar] [CrossRef]
  71. Schroeder, B.O.; Bäckhed, F. Signals from the Gut Microbiota to Distant Organs in Physiology and Disease. Nat. Med. 2016, 22, 1079–1089. [Google Scholar] [CrossRef]
  72. Kumar, M.; Zhang, B.; Nishad, J.; Verma, A.; Sheri, V.; Dhumal, S.; Radha; Sharma, N.; Chandran, D.; Senapathy, M.; et al. Jamun (Syzygium cumini (L.) Skeels) Seed: A Review on Nutritional Profile, Functional Food Properties, Health-Promoting Applications, and Safety Aspects. Processes 2022, 10, 2169. [Google Scholar] [CrossRef]
  73. Sotelo, A.; López-García, S.; Basurto-Peña, F. Content of Nutrient and Antinutrient in Edible Flowers of Wild Plants in Mexico. Plant Foods Hum. Nutr. 2007, 62, 133–138. [Google Scholar] [CrossRef]
  74. Pinto, T.; Vilela, A.; Cosme, F. Chemical and Sensory Characteristics of Fruit Juice and Fruit Fermented Beverages and Their Consumer Acceptance. Beverages 2022, 8, 33. [Google Scholar] [CrossRef]
  75. Akbari, B.; Baghaei-Yazdi, N.; Bahmaie, M.; Mahdavi Abhari, F. The Role of Plant-Derived Natural Antioxidants in Reduction of Oxidative Stress. BioFactors 2022, 48, 611–633. [Google Scholar] [CrossRef]
  76. Bian, Z.H.; Yang, Q.C.; Liu, W.K. Effects of Light Quality on the Accumulation of Phytochemicals in Vegetables Produced in Controlled Environments: A Review. J. Sci. Food Agric. 2015, 95, 869–877. [Google Scholar] [CrossRef]
  77. Gao, M.; He, R.; Shi, R.; Zhang, Y.; Song, S.; Su, W.; Liu, H. Differential Effects of Low Light Intensity on Broccoli Microgreens Growth and Phytochemicals. Agronomy 2021, 11, 537. [Google Scholar] [CrossRef]
  78. Bulgari, R.; Franzoni, G.; Ferrante, A. Biostimulants Application in Horticultural Crops under Abiotic Stress Conditions. Agronomy 2019, 9, 306. [Google Scholar] [CrossRef]
Figure 1. Arrangement of each gutter on four NFT systems with different media and shade levels.
Agronomy 13 00247 g001
Figure 2. The effect of different growth media and shade levels on leaf length of T. divaricata. Means at the same column followed by the same letter do not differ by Tukey’s test (p > 0.05).
Agronomy 13 00247 g002
Figure 3. The effect of different growth media and shade levels on the formation of buds of T. divaricata. Means followed by the same letter do not differ significantly by Tukey’s test (p ≤ 0.05).
Agronomy 13 00247 g003
Figure 4. The effect of different growth media and different shade levels on the fresh weight of T. divaricata. Means at the same column followed by the same letter did not differ by Tukey’s test (p > 0.05).
Agronomy 13 00247 g004
Figure 5. The effect of different growth media and different shade levels on the dry weight of T. divaricata. Means in the same column followed by the same letter did not differ by Tukey’s test (p > 0.05).
Agronomy 13 00247 g005
Figure 6. The effect of different growth media and shade levels on total polyphenols in the flower buds of T. divaricata. Means followed by the same letter did not differ by Tukey’s test (p > 0.05).
Agronomy 13 00247 g006
Figure 7. The effect of different growth media and shade levels on total flavonols in the flower buds of T. divaricata. Means followed by the same letter did not differ by Tukey’s test (p > 0.05).
Agronomy 13 00247 g007
Figure 8. The effect of different growth media and different shade levels on total DPPH content in the flower buds of T. divaricata. Means followed by the same letter did not differ by Tukey’s test (p > 0.05).
Agronomy 13 00247 g008
Figure 9. The effect of different growth media and different shade levels on total FRAP content in the flower buds of T. divaricata. Means followed by the same letter did not differ by Tukey’s test (p > 0.05).
Agronomy 13 00247 g009
Figure 10. The effect of different growth media and shade levels on total TEAC content in the flower buds of T. divaricata. Means followed by the same letter did not differ by Tukey’s test (p > 0.05).
Agronomy 13 00247 g010
Table 1. Arrangement of each gutter on four NFT systems with different media and shade levels.
NFT/TableGutter 1Gutter 2Gutter 3Gutter 4Gutter 5
1Leca clay + no shadeLeca clay + 20% shadeLeca clay + 40% shadeLeca clay + 60% shadeLeca clay + 80% shade
2Peat + no shadePeat + 20% shadePeat + 40% shadePeat + 60% shadePeat + 80% shade
3Sand + no shade (C)Sand + 20% shadeSand + 40% shadeSand + 60% shadeSand + 80% shade
4Vermiculite + no shadeVermiculite + 20% shadeVermiculite + 40% shadeVermiculite + 60% shadeVermiculite + 80% shade
NFT = nutrient filter technique hydroponic system, C = control.
Table 2. Effect of different growth media and different shade levels on the chlorophyll content of T. divaricata.
MediaShadeWeek 2Week 4Week 6Week 8Week 10Week 12
No shade1.020 ± 0.25 c–g1.026 ± 0.41 d–g0.99 ± 0.02 d1.09 ± 0.23 b–e1.19 ± 0.02 ab1.15 ± 0.03 ab
20% shade0.961 ± 0.34 fg0.99 ± 0.37 efg1.32 ± 0.05 ab1.00 ± 0.02 cde1.27 ± 0.05 a1.02 ± 0.02 ab
LECA clay40% shade0.980 ± 0.02 d–g1.02 ± 0.02 d-g1.09 ± 0.03 cd1.12 ± 0.26 ab1.06 ± 0.03 abc1.12 ± 0.03 ab
60% shade1.20 ± 0.27 ab1.35 ± 0.03 ab1.41 ± 0.04 ab1.35 ± 0.04 a1.12 ± 0.02 ab1.03 ± 0.04 ab
80% shade1.32 ± 0.49 a 1.34 ± 0.05 a1.43 ± 0.04 a0.96 ± 0.10 de0.96 ± 0.12 abc1.20 ± 0.14 ab
No shade1.14 ± 0.02 b–e0.95 ± 0.02 g1.00 ± 0.02 d1.06 ± 0.03 b-e1.03 ± 0.19 abc0.99 ± 0.04 b
20% shade1.11 ± 0.03 b-f1.20 ± 0.07 bcd1.10 ± 0.04 cd1.09 ± 0.03 b-e1.14 ± 0.06 ab1.02 ± 0.04 ab
Peat40% shade0.97 ± 0.02 efg1.04 ± 0.02 d-g1.11 ± 0.03 cd1.09 ± 0.02 b-e1.08 ± 0.04 abc1.16 ± 0.08 ab
60% shade1.15 ± 0.02 a-d1.28 ± 0.05 abc1.40 ± 0.06 ab1.15 ± 0.01 a–d1.16 ± 0.03 ab1.11 ± 0.02 ab
80% shade1.17 ± 0.02 abc1.26 ± 0.04 abc1.19 ± 0.06 d1.11 ± 0.04 b–e1.19 ± 0.04 ab1.15 ± 0.13 ab
No shade0.96 ± 0.03 fg1.00 ± 0.03 efg1.03 ± 0.03 d1.21 ± 0.03 abc1.16 ± 0.03 ab0.98 ± 0.03 b
20% shade1.13 ± 0.02 b–e0.99 ± 0.02 efg1.04 ± 0.02 d1.08 ± 0.03 b–e1.08 ± 0.03 abc1.01 ± 0.02 b
Silica sand40% shade1.02 ± 0.03 c–g1.04 ± 0.02 d-g1.02 ± 0.03 d0.90 ± 0.04 e1.00 ± 0.12 bc0.88 ± 0.03 b
60% shade1.17 ± 0.03 abc1.16 ± 0.05 b-e1.35 ± 0.04 ab1.25 ± 0.03 ab1.97 ± 0.22 ab1.13 ± 0.02 ab
80% shade1.23 ± 0.05 ab1.24 ± 0.03 abc1.33 ± 0.04 ab1.15 ± 0.13 a–d1.22 ± 0.14 ab1.29 ± 0.03 ab
No shade1.00 ± 0.04 c–g1.14 ± 0.03 c-f1.11 ± 0.03 cd1.12 ± 0.02 b–e1.04 ± 0.02 abc1.16 ± 0.03 ab
20% shade0.99 ± 0.02 efg1.27 ± 0.05 abc1.10 ± 0.04 cd1.13 ± 0.03 a–e0.81 ± 0.21 c0.84 ± 0.18 b
Vermiculite40% shade0.89 ± 0.04 g0.96 ± 0.02 fg1.01 ± 0.01 d0.98 ± 0.03 cde1.08 ± 0.03 abc1.07 ± 0.03 ab
60% shade1.09 ± 0.04 b–f1.27 ± 0.05 abc1.24 ± 0.04 bc1.14 ± 0.03 a–d1.08 ± 0.02 abc1.04 ± 0.02 ab
80% shade1.22 ± 0.07 ab1.26 ± 0.05 abc1.09 ± 0.02 cd1.14 ± 0.02 a–d1.24 ± 0.04 ab1.42 ± 0.02 a
Analysis of Variance
Growth media 0.0040.0010.0000.642 ns0.394 ns0.171
Shade levels 0.0000.0000.0000.0000.394 ns0.000
Growth media × shade levels 0.0000.0000.0000.0000.442 ns0.010
Note: means in the same column followed by the same letter did not differ by Tukey’s test (p > 0.05). ns = not significant.
Table 3. The effect of different growth media and shade levels on macronutrient content in the flower buds of T. divaricata.
ShadeMediaCalciumK/Ca + MgPotassiumNitrogenMagnesiumPhosphorusSodium
mg/100 gmg/100 gmg/100 gmg/100 gmg/100 gmg/100 gmg/100 g
No shadeLECA clay409.5 ± 0.5 i3145.0 ± 5.0 e5865.0 ± 5.0 h3019.0 ± 1.0 k324.5 ± 5.5 fg511.0 ± 1.0 ef139.0 ± 1.0 jk
Peat409.5 ± 0.5 i3419.5 ± 0.5 cd5926.5 ± 3.5 g2880.5 ± 0.5 n289.0 ± 1.0 h529.0 ± 1.0 e157.5 ± 2.5 gh
Silica sand347.5 ± 2.5 m3079.0 ± 1.0 h 4979.0 ± 1.0 m3257.5 ± 2.5 g286.0 ± 3.5 h444.5 ± 5.5 g169.0 ± 1.0 e
Vermiculite327.5 ± 2.5 o3039.0 ± 1.0 j5570.0 ± 10.0 j2957.0 ± 2.5 l371.0 ± 1.0 cde489.0 ± 1.0 f137.5 ± 2.5 k
20% shadeLECA clay389.5 ± 0.5 k4039.0 ± 1.0 a6329.0 ± 1.0 d3579.0 ± 1.0 d249.0 ± 1.0 i427.5 ± 2.5 g147.5 ± 2.5 ij
Peat469.5 ± 0.5 f3619.0 ± 0.5 b7167.5 ± 2.5 a2867.5 ± 2.5 o329.0 ± 1.0 fg689.0 ± 1.0 bc149.0 ± 1.0 hi
Silica sand347.5 ± 2.5 m3147.5 ± 2.5 e5390.5 ± 0.5 k3119.0 ± 1.0 h319.0 ± 1.0 gh511.5 ± 1.5 ef144.0 ± 4.0 ijk
Vermiculite449.0 ± 1.0 h2839.0 ± 1.0 m6319.5 ± 0.5 d2939.0 ± 1.0 m419.0 ± 1.0 b528.5 ± 1.5 e149.0 ± 1.0 hi
40% shadeLECA clay689.0 ± 1.0 d1979.0 ± 1.0 p4961.0 ± 1.0 m2960.5 ± 0.5 l359.0 ± 1.0 def611.0 ± 1.0 d179.0 ± 1.0 d
Peat519.0 ± 1.0 e3019.5 ± 0.5 k6648.0 ± 2.0 b3047.5 ± 2.5 j369.5 ± 0.5 cde678.5 ± 1.5 c158.0 ± 2.0 gh
Silica sand829.5 ± 0.5 c2219.0 ± 1.0 o6169.0 ± 1.0 f2720.0 ± 1.0 q 357.5 ± 2.5 def419.0 ± 1.0 g230.5 ± 0.5 a
Vermiculite409.0 ± 1.0 i2519.5 ± 0.5 n5239.5 ± 20.5 l3119.0 ± 1.0 h399.0 ± 1.0 bc748.5 ± 2.5 a147.5 ± 2.5 ij
60% shadeLECA clay359.5 ± 0.5 l2979.0 ± 1.0 l4865.0 ± 5.0 n2811.0 ± 1.0 p289.0 ± 1.0 h611.0 ± 1.0 d138.5 ± 1.5 jk
Peat458.5 ± 1.5 g3111.0 ± 1.0 f6189.0 ± 1.0 ef3412.0 ± 2.5 e337.5 ± 2.5 efg747.5 ± 2.5 a159.0 ± 1.0 fg
Silica sand409.0 ± 1.0 i3428.0 ± 2.0 c6389.0 ± 1.0 c3599.0 ± 1.0 c328.0 ± 1.5 fg744.0 ± 26.0 a168.0 ± 2.0 ef
Vermiculite360.5 ± 0.5 l3411.0 ± 1.0 d6223.5 ± 6.5 e3719.5 ± 0.5 a347.0 ± 3.0 defg716.0 ± 4.0 ab169.5 ± 0.5 de
80% shadeLECA clay1101.0 ± 1.0 a1536.5 ± 3.5 r5692.5 ± 7.5 i3018.5 ± 1.5 k478.5 ± 1.5 a529.0 ± 1.0 e219.5 ± 0.5 b
Peat339.0 ± 1.0 n3100.5 ± 0.5 g5228.0 ± 12.0 l3365.0 ± 5.0 f319.0 ± 1.0 gh678.5 ± 1.5 c79.0 ± 1.0 m
Silica sand1059.0 ± 1.0 b1911.0 ± 1.0 q6392.5 ± 7.5 c3060.0 ± 0.5 p 374.0 ± 26.0 cd516.0 ± 4.0 ef199.0 ± 1.0 c
Vermiculite400.0 ± 1.0 j3069.0 ± 1.0 i5559.0 ± 1.0 j3689.0 ± 1.0 b318.50 ± 1.50 gh727.5 ± 2.5 a99.5 ± 0.5 l
Analysis of Variance
Growth media 0.0000.0000.0000.0000.0000.0000.000
Shade levels 0.0000.0000.0000.0000.0000.0000.000
Growth media × shade levels 0.0000.0000.0000.0000.0000.0000.000
Note: means in the same column followed by the same letter did not differ by Tukey’s test (p > 0.05).
Table 4. The effect of different growth media and shade levels on micronutrients analysis in the flower buds of T. divaricata.
ShadeMediaCopper
(mg/100 g)
Iron
(mg/100 g)
Manganese
(mg/100 g)
Zinc
(mg/100 g)
No shadeLECA clay0.40 ± 0.01 abcd7.50 ± 0.50 h3.69 ± 0.01 g5.81 ± 0.01 h
Peat0.00 ± 0.00 d6.25 ± 0.05 ij3.47 ± 0.03 g5.84 ± 0.06 h
Silica sand0.40 ± 0.01 abcd9.25 ± 0.05 fg2.19 ± 0.01 h6.58 ± 0.02 g
Vermiculite0.69 ± 0.01 ab9.45 ± 0.05 ef3.79 ± 0.02 g5.58 ± 0.02 i
20% shadeLECA clay0.53 ± 0.43 abcd5.75 ± 0.05 ij3.55 ± 0.30 g5.36 ± 0.04 j
Peat0.11 ± 0.01 cd5.85 ± 0.05 ij5.85 ± 0.05 cd7.58 ± 0.02 e
Silica sand0.29 ± 0.01 bcd7.55 ± 0.05 h2.79 ± 0.02 h6.41 ± 0.01 g
Vermiculite0.69 ± 0.01 ab15.75 ± 0.05 d5.48 ± 0.02 d6.47 ± 0.03 g
40% shadeLECA clay0.49 ± 0.02 abcd22.11 ± 0.01 c5.84 ± 0.05 cd7.59 ± 0.01 e
Peat0.00 ± 0.00 d6.55 ± 0.05 i2.80 ± 0.20 h6.38 ± 0.03 g
Silica sand0.39 ± 0.01 abcd23.89 ± 0.01 b5.29 ± 0.02 de8.47 ± 0.03 c
Vermiculite0.79 ± 0.01 ab6.20 ± 0.01 ij3.58 ± 0.02 g6.58 ± 0.02 g
60% shadeLECA clay0.29 ± 0.01 bcd6.29 ± 0.01 ij3.45 ± 0.35 g8.28 ± 0.02 c
Peat0.00 ± 0.00 d6.29 ± 0.01 ij6.47 ± 0.03 bc7.58 ± 0.02 e
Silica sand0.49 ± 0.01 abcd8.50 ± 0.50 g3.93 ± 0.08 g6.57 ± 0.03 g
Vermiculite0.80 ± 0.01 ab5.49 ± 0.01 j4.68 ± 0.02 ef7.95 ± 0.05 d
80% shadeLECA clay0.89 ± 0.01 a40.39 ± 0.01 a9.48 ± 0.03 a9.19 ± 0.01 b
Peat0.58 ± 0.03 abc5.68 ± 0.03 ij3.68 ± 0.02 g5.93 ± 0.07 h
Silica sand0.58 ± 0.02 abc22.11 ± 0.01 c6.58 ± 0.03 b10.50 ± 0.10 a
Vermiculite0.69 ± 0.02 ab10.29 ± 0.02 e4.65 ± 0.05 f7.11 ± 0.01 f
Analysis of Variance
Growth media 0.0000.0000.0000.000
Shade levels 0.0010.0000.0000.000
Growth media × shade levels 0.056 ns0.0000.0000.000
Note: means in the same column followed by the same letter did not differ by Tukey’s test (p > 0.05), ns = not significant.
Table 5. The effect of different growth media and shade levels on proximate analysis in the flower buds of T. divaricata.
ShadeMediaADF %Ash % Fat %Moisture %NDF %Protein %
No shadeLECA clay33.78 ± 1.16 bcd12.45 ± 0.15 bcd2.00 ± 0.05 a–e9.87 ± 0.51 abc47.93 ± 0.68 ab19.14 ± 0.23 bcd
Peat32.80 ± 0.29 bcd12.59 ± 0.66 bcd1.91 ± 0.03 b–f9.76 ± 0.31 abc44.3 ± 0.77 bc17.63 ± 0.38 cd
Silica sand31.12 ± 0.87 def11.01 ± 0.32 d1.82 ± 0.05 bef10.62 ± 0.39 ab40.85 ± 1.23 b–e19.87 ± 0.51 a–d
Vermiculite32.19 ± 0.32 cde11.92 ± 0.27 cd2.01 ± 0.02 a–e10.26 ± 0.70 abc40.55 ± 1.30 b–e18.04 ± 0.48 cd
20% shade LECA clay35.91 ± 0.31 b13.76 ± 0.36 bcd1.73 ± 0.70 efg10.29 ± 0.21 abc44.45 ± 3.09 bc21.86 ± 0.50 ab
Peat41.17 ± 0,28 a14.97 ± 0.33 b1.56 ± 0.65 g10.32 ± 0.46 abc53.87 ± 0.57 a17.71 ± 0.26 cd
Silica sand29.09 ± 0.25 ef11.91 ± 0.46 cd2.26 ± 0.65 ab10.29 ± 0.21 abc40.85 ± 0.53 bcde19.23 ± 0.24 a–d
Vermiculite35.09 ± 1.54 bc14.01 ± 0.36 bc2.05 ± 0.55 a–d9.70 ± 0.15 abc43.98 ± 3.62 bc17.83 ± 0.58 cd
40% shadeLECA clay24.84 ± 0.18 ij14.34 ± 0.50 bc2.04 ± 0.15 a–e11.27 ± 0.41 a34.21 ± 0.65 ef18.02 ± 0.48 cd
Peat30.48 ± 0.41 d–g14.39 ± 0.37 bc1.90 ± 0.20 b–f11.12 ± 0.48 ab39.24 ± 1.04 cdef18.97 ± 0.11 bcd
Silica sand31.67 ± 0.41 cde18.89 ± 0.34 a1.82 ± 0.45 def10.02 ± 0.66 abc39.53 ± 1.27 cdef16.88 ± 0.13 d
Vermiculite28.23 ± 0.42 e–i13.14 ± 0.28 bcd2.14 ± 0.40 abc11.37 ± 0.38 a35.80 ± 1.55 def17.67 ± 1.80 cd
60% shadeLECA clay30.08 ± 0.78 d–g12.23 ± 0.34 bcd1.83 ± 0.01 def11.30 ± 0.52 a42.83 ± 0.47 bcd17.90 ± 0.35 cd
Peat27.81 ± 0.22 f–i14.38 ± 0.54 bc1.84 ± 0.02 c–f11.53 ± 0.23 a40.93 ± 0.67 bcde20.94 ± 0.38 abc
Silica sand31.15 ± 0.49 def14.21 ± 0.76 bc1.68 ± 0.03 fg9.40 ± 0.75 abc43.78 ± 0.53 bc21.91 ± 0.61 ab
Vermiculite31.94 ± 1.04 cde14.14 ± 0.69 bc1.79 ± 0.05 d–g8.81 ± 0.17 bc40.93 ± 0.57 bcde21.80 ± 1.43 ab
80% shadeLECA clay23.57 ± 1.07 j19.19 ± 0.54 a2.09 ± 0.01 a–d8.05 ± 0.18 cd32.91 ± 0.51 f18.26 ± 0.63 bcd
Peat24.84 ± 0.54 ij13.06 ± 0.50 bcd2.25 ± 0.02 a9.76 ± 0.40 abc32.91 ± 0.66 f20.65 ± 0.42 abc
Silica sand26.31 ± 0.01 g–j20.86 ± 0.87 a1.81 ± 0.16 def9.88 ± 0.25 bcd35.81 ± 0.40 ef19.04 ± 0.08 bcd
Vermiculite26.02 ± 0.52 hij13.76 ± 0.48 bcd1.93 ± 0.11 b–f6.25 ± 0.65 d34.28 ± 0.72 ef22.82 ± 0.26 a
Analysis of Variance
Growth media 0.0020.0000.0090.0010.0130.493 ns
Shade levels 0.0000.0000.0000.0000.0000.000
Growth media × shade levels 0.0000.0000.0000.0000.0000.000
ADF = acid-detergent fibre; NDF = neutral detergent fibre. Note: means in the same column followed by the same letter did not differ by Tukey’s test (p > 0.05), ns = not significant.
Disclaimer/Publisher’s Note: The statements, opinions and data contained in all publications are solely those of the individual author(s) and contributor(s) and not of MDPI and/or the editor(s). MDPI and/or the editor(s) disclaim responsibility for any injury to people or property resulting from any ideas, methods, instructions or products referred to in the content.

