Article

Scion/Rootstock Interaction Studies for Quality Traits in Mango (Mangifera indica L.) Varieties

1
ICAR-Indian Agricultural Research Institute, New Delhi 110012, India
2
College of Engineering and Technology, IILM University, Greater Noida 201310, India
3
Neogen Informatics Inc. A-121, Vikas Marg, New Delhi 110092, India
4
ICAR-National Institute for Plant Biotechnology, New Delhi 110012, India
5
Department of Bioinformatics, Gujarat Biotechnology University, Gandhinagar 382355, India
6
ICAR-National Bureau of Soil Survey and Land Use Planning, Nagpur 440033, India
*
Author to whom correspondence should be addressed.
These authors contributed equally to this work.
Agronomy 2023, 13(1), 204; https://doi.org/10.3390/agronomy13010204
Submission received: 29 November 2022 / Revised: 8 December 2022 / Accepted: 21 December 2022 / Published: 9 January 2023

Abstract

:
To explore the quality rootstocks which impart better quality fruits in mango varieties, we studied the interactive effect of the scion and rootstock using five mango varieties (Mallika, Amrapali, Dashehari, Pusa Arunima, and Pusa Surya) grafted on three rootstocks (Olour, Kurukkan, and K-5). A total of 25 physico-chemical parameters were studied in the five grafted varieties viz., fruit weight, yield efficiency, fruit per plant, pulp percent, total soluble solids (TSS), acidity, physiological loss in weight (PLW), peel thickness, respiration rate, etc., and were found to be altered through scion–rootstock interaction. Among the five mango varieties, Olour rootstock proved best to improve the fruit quality and shelf life using the grafting approach. Physico-chemical-traits-based clustering was unable to precisely group scion varieties according to their grafting rootstock. A total of 35 shelf-life specific markers were designed from ripening genes, such as expansin, polygalactouranase, ethylene insensitive, ethylene sensitive, etc. Of these specific primers, 24 showed polymorphism among the studied genotypes. The gene diversity (GD), allele per locus (An), polymorphism information content (PIC), and major allele frequency (MAF) observed were 0.43, 2.00, 0.34, and 0.63, respectively. Cluster analysis clearly showed that scion grafted on Kurukkan and Olour rootstock, and scion varieties grafted on K-5 rootstock grouped together have more similarity. A total of eight simple sequence repeats loci (SSRs) markers were associated with eight physiological traits. Strong association of SSR loci NMSLC-12 and NMSLC-14 with yield efficiency and fruit weight were observed with a phenotypic variance of 85% and 70%, respectively.

1. Introduction

The mango (Mangifera indica L.), a member of the family Anacardiaceae, is amongst the most important tropical fruit in the world. Mangoes are rich in organic acids, sugars, and amino acids. They also present a great diversity of valuable secondary metabolites, such as carotenoids and polyphenols, in addition to many volatile compounds that contribute to their nutritional characteristics and health benefits [1,2]. Global production of mangoes is estimated to be over 26 million tons per annum, and India ranks first with 40% of the total mangoes produced. In spite of the large volume of mango production, low productivity per unit area continues to be a problem, greatly impacting its export [3].
Shorter shelf life is one of the major constraints affecting mango trade, besides being highly susceptible to chilling injury and postharvest diseases [4,5]. The selection of an appropriate graft combination is pivotal with respect to nutrient uptake, water potential, plant vigor, fruit quality, and yield efficiency [6,7,8,9]. Rootstock breeding methods assisted with molecular tools may potentially help to improve the existing mango varieties [10,11]. Emerging research studies showed that grafting changes gene expression, which impacts the scion’s phenotype [12]. It is also suggested that, often, the interaction of rootstock and scion has a significant impact on grafted scions’ performance, including fruit quality [13,14]. Moreover, on the basis of the different rootstock/scion combinations, sensory properties can also be modified in accordance with the market requirements [15].
Exchanges of both RNA and DNA molecules between both rootstock and scion through long-distance mRNA translocation in the phloem or through horizontal bidirectional gene transfer via either large DNA pieces or an entire plastid genome may help to explain the molecular basis for grafting-induced genetic variation [16]. Hence, this clearly points towards the trafficking of genetic information between the two grafted partners. Expressed sequence tags (ESTs) are a valuable resource for developing simple sequence repeats (SSRs), associated with various quality traits, such as improved shelf life and tolerance to pests and disease [17]. In the present investigation, physico-chemical parameters for the 15 different scion–rootstock combinations (five scions with each of the three rootstocks) were studied to understand the effect of rootstock on scion with reference to quality traits of mango fruits.

2. Materials and Methods

2.1. Experimental Orchard and Plant Materials

The present experiment was carried out on 15–16 years old trees of five high-yielding varieties, grafted on 3 polyembryonic rootstocks (Table S1). These genotypes were evaluated for different quality traits, such as fruit weight, the number of fruits per plant, stone weight, pulp percent, shelf-life-related parameters, etc. An experimental orchard of different scion–rootstock combinations, such as Pusa Arunima, Pusa Surya, Mallika, Amrapali, and Dashehari (scion varieties) having varying quality traits was established in 2007 using three polyembryonic rootstocks (Kurukkan, Olour and K-5) in the Experimental Farm at the Division of Fruits and Horticultural Technology, ICAR—Indian Agricultural Research Institute, New Delhi (28°40′ N latitude and 77°13′ E longitude and an altitude of 228.6 m above mean sea level). Earlier, Dayal et al. [6] and Dubey et al. [14] encouraged the use of these polyembryonic rootstocks (K-5, Olour, Kurukkan) for the improvement of tree vigor and fruit quality traits of Amrapali, Pusa Surya, Mallika, Pusa Arunima, and Dashehari mango varieties. Mango varieties used in this study have different horticultural traits, for example Amrapali is an extremely dwarf and regular bearer, while Pusa Arunima and Pusa Surya are medium vigorous, regular bearers having a colored peel. On the other hand, Mallika and Dashehari are vigorous varieties. These varieties also had variation in shelf life (Table S1).
An orchard was established with six trees in each scion/rootstock combination, including four nucellar trees of each rootstock in randomized block design. The experimental location falls under trans-Gangetic plains of agroclimatic zones of India. The soil of the experimental orchard was sandy loam. These trees were planted in a square system at 4 m × 4 m spacing. All the plant materials belonged to the age group of 15–16 years. During the course of investigation, blocks were maintained as per the recommended cultural practices.

2.2. Fruit Yield

Total fruits harvested at maturity were counted and weighed in each replication separately. Yield efficiency was calculated by dividing the yield/tree in kg by total tree canopy volume (m3).

2.3. Physical Fruit Quality Analysis

Individual fruit weight, pulp weight, stone weight, pulp–stone ratio, the content of total soluble solids, and acidity were used as fruit quality parameters. All the above-mentioned parameters were measured after ripening. Mature fruits (60 numbers) were harvested from each marked tree from all directions for the fruit-quality analysis. Fruits were then treated with 0.3% copper oxychloride to avoid fungal infection during ripening. Thereafter, the fruits were kept for moisture drying, wrapped in blotting paper, and kept for ripening in wooden boxes at room temperature. After ripening, fruits were sorted into groups according to the storage temperature. One slot of 60 fruits (three replications with 10 fruits in each replication) was analyzed on the initial day of ripening. The rest of the fruits were kept for storage. The analysis was repeated on the 3rd and 6th days of storage.
Further, individual mango fruits were weighed after ripening using high-precision electronic balance at three storage durations (0, 3, and 6 days). After ripening, the pulp was immediately squeezed, and the above-mentioned traits were measured. Fruit peel thickness (mm) was measured using a vernier caliper, and total soluble solids (TSS) content was determined using a digital hand refractometer (Atago). Titratable acidity was determined by titrating 10 mL filtered juice against 0.1 N NaOH using a phenolphthalein indicator as described earlier [18].
Physiological loss in weight (PLW) was calculated using the formula:
PLW (%) = (Initial weight − Final weight) × 100/Initial weight
The rate of respiration (mL CO2kg−1 h−1) was measured from mature fruit with the help of an auto gas analyzer (Model: Checkmate 9900 O2/CO2, Dansensor PBI, Denmark), as per method reported by Prasad et al. [19].
Respiration rate (mL CO2kg−1 h−1) = Evolved CO2 (%) × head space of the container (mL)/100 × Weight of the trapped fruit in kg × time (h)
Density of the fruit was calculated by fractionating the average fruit weight with its volume. This is also treated as the specific gravity, given the density of water, the reference substance, is ‘1′.

2.4. DNA Extraction and PCR Analysis

The healthy leaves from the new flush of each mango genotype (rootstock and scion–rootstock combinations, n = 15) were collected from the field in the month of September 2021 and used immediately for DNA extraction. Genomic DNA from the samples was extracted using the cetyl-trimethyl ammonium bromide (CTAB) method [20]. The quality of the extracted DNA was assessed through 0.8% agarose gel electrophoresis, and quantified using Nanodrop 8000 spectrophotometer (Thermo Scientific, Waltham, MA, USA). For SSR identification and primer designing, ripening-related gene sequences in mango, such as 3-ketoacyl-coA thiolase, endo-1,4-beta-glucanase (cel gene), beta-galactosidase, expansins, and 1-aminocyclopropane-1-carboxylic acid oxidase (aco1 gene), etc. were extracted and subjected to identify genic SSRs using SSRIT (SSR identification tool; www.gramene.org/db/searches/SSRtool, accessed on 5 September 2021) [21]. Hence, identified sequences containing the SSRs were used to design primers in the Primer-3 software (www.frodo.wi/mit.edu/primer3, accessed on 6 September 2021).
A total of 35 SSR loci were synthesized for wet lab validation in 15 mango genotypes (five scion varieties grafted on 3 polyembryonic rootstocks). The PCR was carried out in 20 μL reaction mixture containing 1 μL each primer (forward and reverse), 5 μL of 25 ng/μL genomic DNA as template, and 10 μL of 2XPCR ready master mix buffer (GBioscience, St. Louis, MO, USA). The volume was made up to 20 μL with sterile distilled water. To allow proper settling of the reaction mixture, PCR tubes containing the above components were capped and centrifuged at 5000 rpm for 1 min. Amplification was carried out in a PE-Thermo cycler (C1000 Touch Thermal cycler, Bio-Rad, Foster City, CA, USA). Initial denaturation was carried out at 94 °C for 5 min followed by 35 cycles of denaturation at 94 °C, annealing at 55 °C, and extension at 72 °C for 1 min. Final extension was carried out at 72 °C for 10 min and programmed to store at 4 °C until the samples were processed further. PCR-amplified products were resolved in 3% high-resolution agarose gels. Electrophoresis was carried out at 100 V for 3 to 4 h. DNA profiles were visualized on UV trans-illuminator and photographed on gel documentation system (Alpha Innotech, Miami, FL, USA).

2.5. Data Scoring and Statistical Analysis

The experiment was laid out in a Randomized Block Design (RBD) with a factorial arrangement. There were three replications with one tree in each replication. The data were subjected to statistical analysis of variance (ANOVA) using SAS 9.3 version software (SAS, Institute Inc., Cary, NC, USA) followed by Duncan multiple range test (DMRT at p ≤ 0.05) to separate treatments and significant differences were compared. The analysis of data was used to interpret the results and draw valid conclusions. The ClustVis web tool used for Heatmap generation [22] and for PCA analysis R/ADEGENET package was used [23].
Among the 35 novel genic SSRs used in the present study, 24 polymorphic markers were used for the molecular studies and marker–trait analysis. Each allele was scored as presence ‘1′ and absence of a band as ‘0′ for each SSR allele, with missing data denoted by ‘9′. Only SSR markers that gave a product of a consistent and expected size were used for further analysis of variation. Genetic distances between all selected mango genotypes were calculated using Power Marker 3.5 [24].
For population structure, we assumed an admixed model with a uniform prior probability and independent allele frequency of the number of populations, K. All the runs with 50,000 MCMC replicates after a burn-in of 50,000 replicates were conducted for K = 2–10. Five independent runs were performed for each value of K to generate our estimate of the true number of sub-populations [25]. The ‘Structure harvester’ program (http://taylor0.biology.ucla.edu, accessed on 5 November 2021) was used to determine the final K value (K = 5 was optimum for this analysis), based on both the LnP (D) and Evanno’s DK [26,27].
Markers exhibiting a probability value (p value) less than 0.05 thresholds were considered significantly associated with the particular phenotypic trait. The association of each allele of the locus with the trait of interest was tested using two approaches, namely the GLM and MLM [28] approaches, wherein the population structure and kinship in the model was implemented using the TASSEL v2.0.1 software [29]. The MLM model exhibited the least variation in observed p values from expected p values in the quartile–quartile plot compared with the variation in the Q (population structure) or K (kinship) model only. JoinMap version 4.1 (Kyazma, Wageningen, The Netherlands) was used to prepare the map. Finally, linkage analysis was performed on markers showing no suspect linkages and distributed on 20 LGs in each category.

3. Results

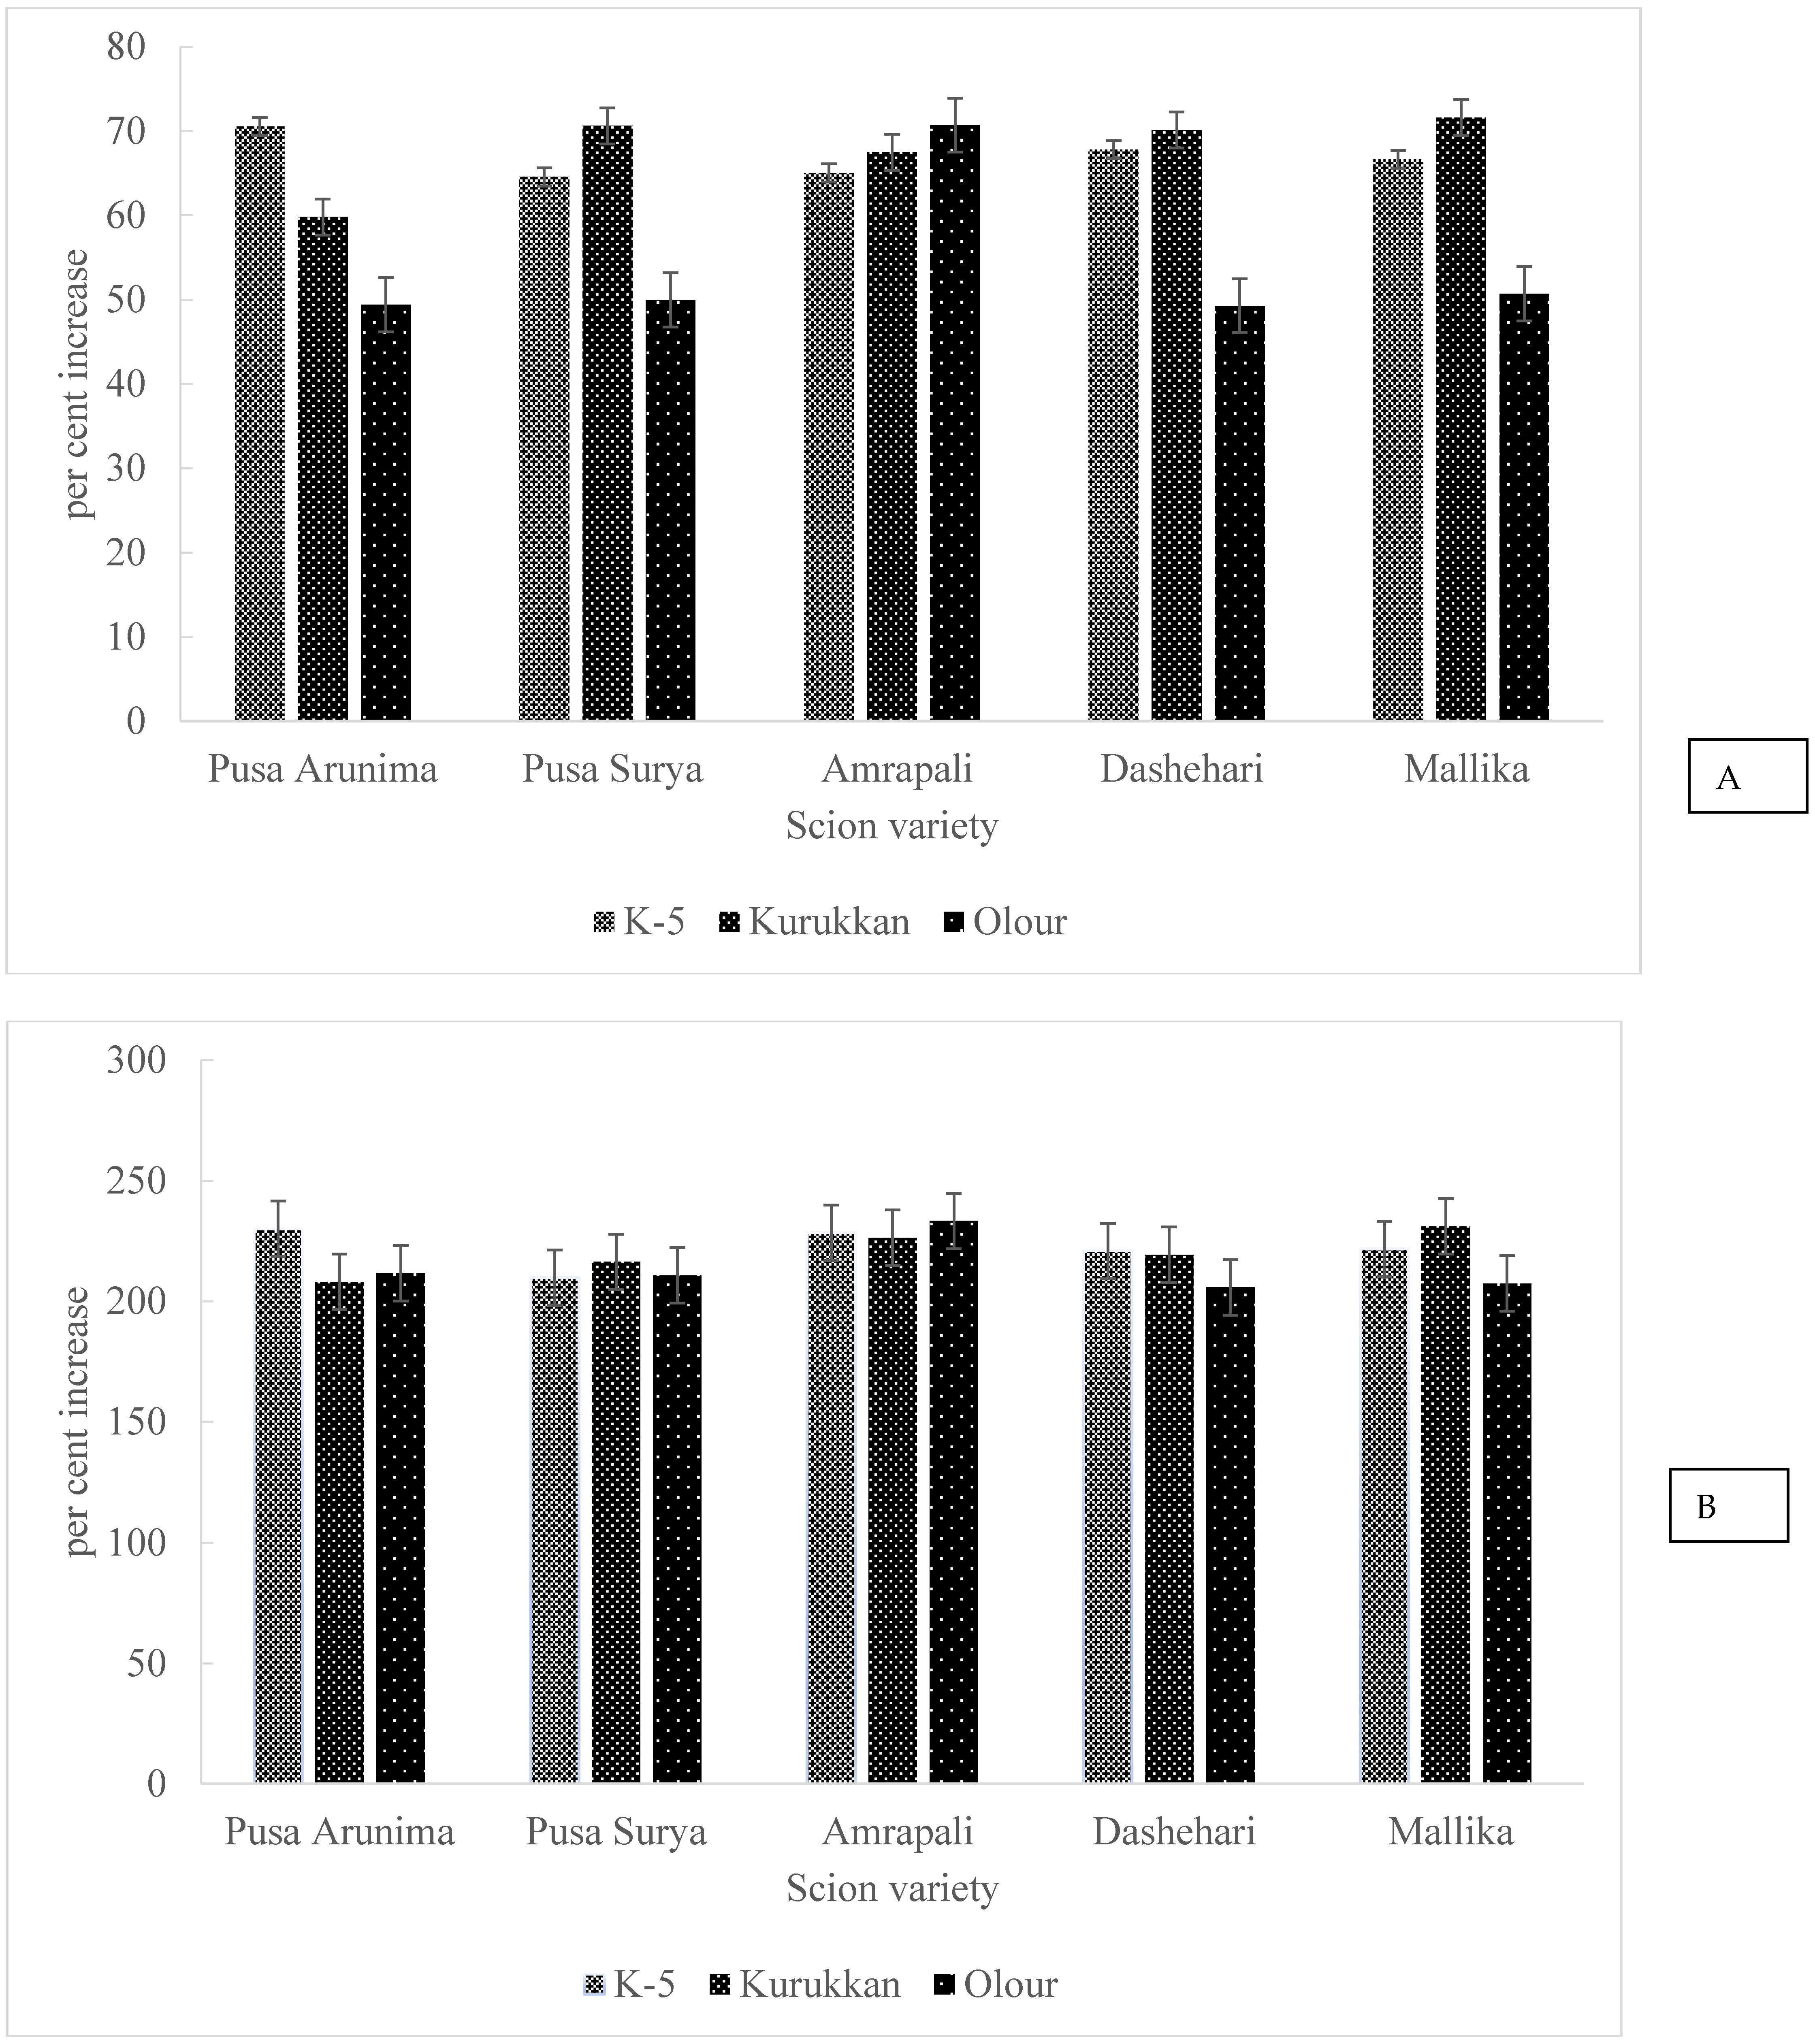
3.1. Effects of Scion, Rootstock and Interaction on Fruit Yield

Scion variety and rootstock, both alone as well as mutually, influenced the number of fruits, yield, and yield efficiency significantly (Table 1). Olour rootstock promoted fruits/tree in all scion varieties except Dashehari, where Kurukkan was found to have the highest number of fruits per tree. Yield and yield efficiency followed a similar pattern, and Pusa Arunima/Kurukkan, Pusa Surya/Olour, Amrapali/Olour, and Dashehari/Kurukkan recorded the highest yield/tree and yield efficiency per m3 canopy volume.

3.2. Effects of Scion, Rootstock, and Interaction on Fruit Quality at Ripening

Fruit weight, pulp recovery, stone weight, and pulp–stone ratio were affected by scion and interaction between scion x rootstock, but rootstock alone failed to modify these traits except fruit weight. Pusa Arunima/Kurukkan, Pusa Surya/K-5, or Kurukkan, Dashehari/Kurukkan produced the heaviest fruit; however, rootstock failed to influence fruit weight in Mallika and Amrapali. Moreover, in most of the scion varieties, except Amrapali, rootstock was unable to alter pulp recovery and stone weight, though the highest stone weight was recorded in Pusa Arunima on either rootstock. Likewise, except in Amrapali/Kurukkan and Amrapali/K-5, the rest of the combinations failed to influence pulp–stone ratio (Table 2).
Scion variety, rootstock, and their interactions exhibited a significant impact on peel thickness, pulp TSS, and acidity (Table 3), except acidity in the case of rootstock. The highest peel thickness was noticed in all scion varieties, particularly those grown on Olour rootstock. Within the scion variety, significantly higher TSS was found in Pusa Surya, Dashehari, and Mallika scion variety on Olour rootstock, while K-5 and Kurukkan promoted TSS in Amrapali. Notwithstanding, rootstock did not influence TSS in Pusa Arunima. Likewise, variable results were also obtained for acidity, and Olour enhanced acid content in Pusa Surya and Mallika, while both K-5 and Olour increased acidity in Amrapali. Kurukkan and K-5 enhanced acidity in Pusa Arunima and Dashehari, respectively.

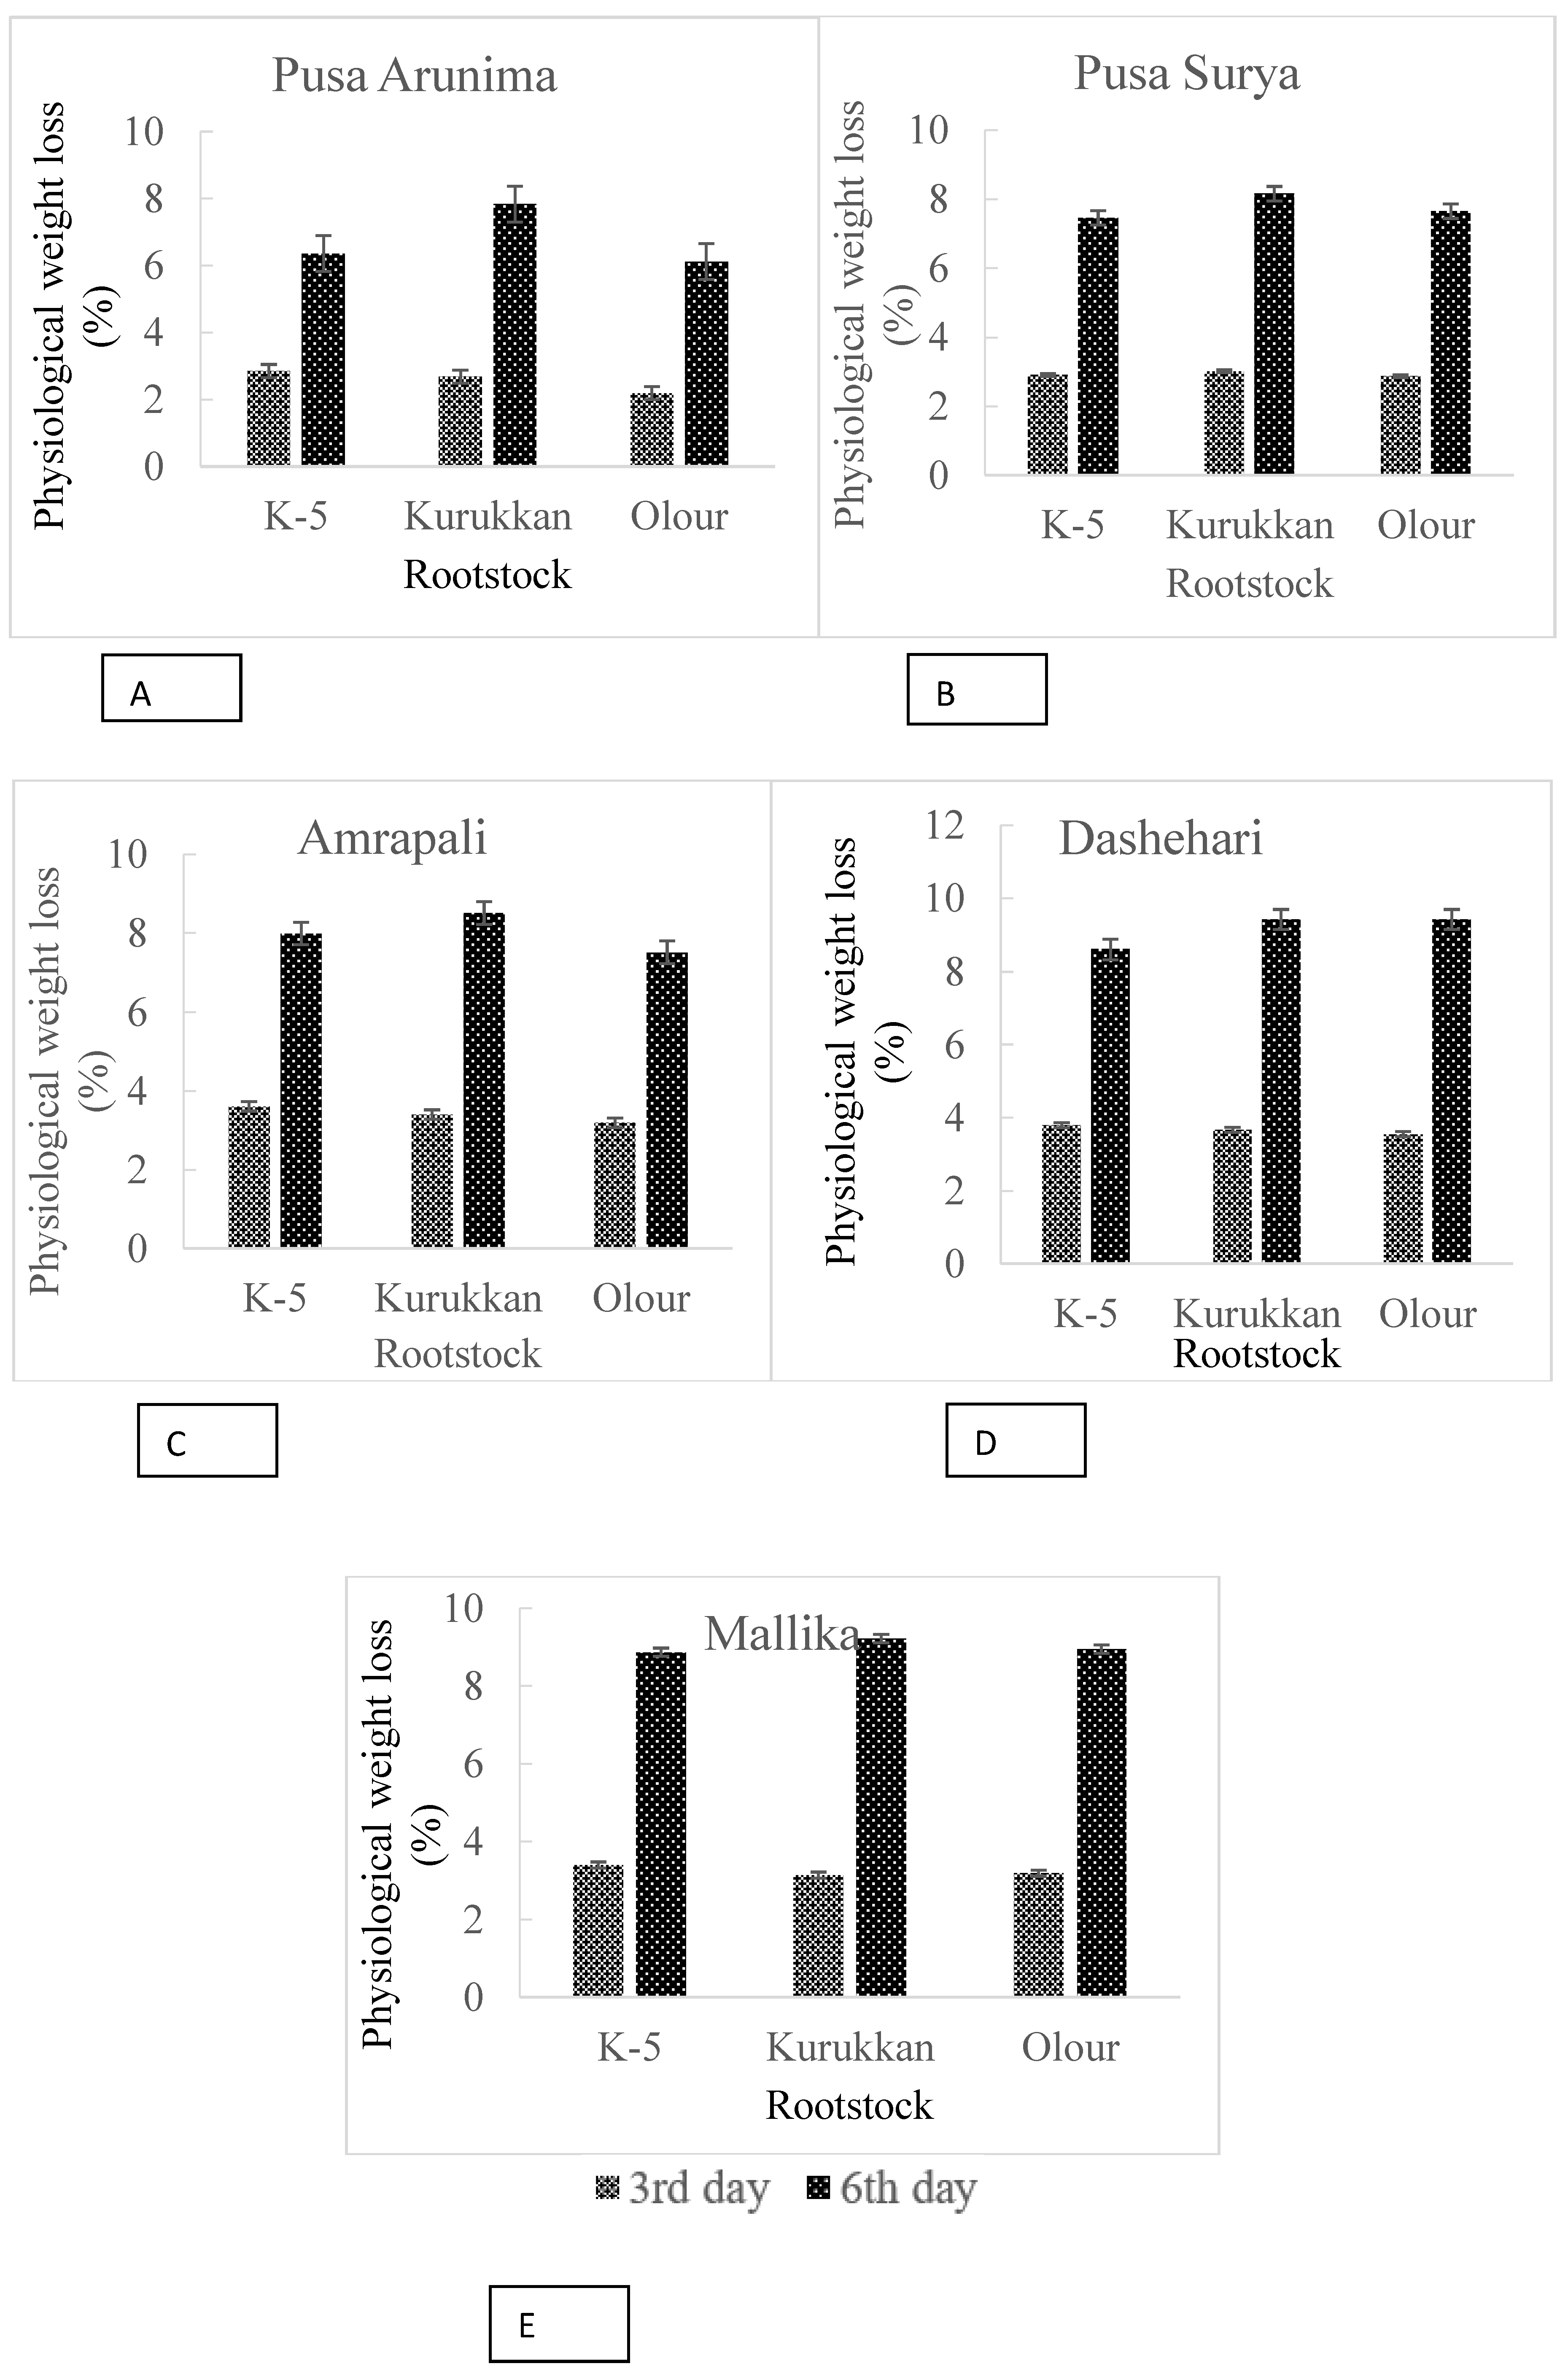
3.3. Effects of Scion, Rootstock, and Interaction on PLW and Respiration Rate during Storage

Scion variety and rootstock alone and jointly affected the physiological loss in weight (PLW) significantly (Figure 1). Except for Pusa Surya, the rest of the scion varieties when grown on Olour had lower PLW on the 3rd day of storage, whereas on the 6th day of storage, the rootstock effect was found to be variable for different scion varieties, and was higher for Pusa Arunima and Pusa Surya either on Olour or K-5 rootstock, but Olour and Kurukkan had lower PLW for Mallika. In case of Amrapali and Dashehari, it was Olour and K-5, which exhibited lower PLW at the 6th day of storage.

3.4. Effects of Scion, Rootstock, and Interaction on Fruit Quality during Storage

Total soluble solids (TSS) and acidity were affected significantly by rootstock, scion variety, and their interactions (Table 3). In Pusa Arunima, TSS increased slightly at the 3rd and 6th day of storage compared to the TSS at the day of ripening (0 day); however, equal TSS was observed at 6th day of storage on all rootstocks. Contrary to this, acidity decreased at the 3rd and 6th day compared to normal ripening stage. The highest decrease in acidity in the pulp of Pusa Arunima was noted on K-5 or Olour. There was no change in TSS from day of ripening to the 6th day of storage; however, acidity exhibited a similar pattern to the Pusa Arunima, and a decreased trend was noticed from the day of ripening to the 3rd and 6th day of storage. The highest reduction in acidity in the fruit pulp of Pusa Surya was observed either on the K-5 or Olour rootstocks. Furthermore, TSS in fruit pulp of Amrapali and Dashehari was also increased during storage with maximum enhancement recorded in Amrapali/Olour and Dashehari/Olour combinations. In both Amrapali and Dashehari, a decrease was observed in acid content from the day of ripening to the 3rd and 6th day of storage and Amrapali/K-5 and Dashehari/K-5 yielded the highest acidity at both the 3rd and 6th day of storage. An almost similar trend was also noted for Mallika and an increase was observed in TSS and a decline in acidity during storage. The highest increase in TSS in the pulp of Mallika was recorded on Olour, and the maximum decrease in acidity was found on K-5. Peel thickness was found to be impacted by rootstock–scion interaction. At day 0, peel thickness is found to be higher for Pusa Arunima and Pusa Surya on Olour (Table 3). On the 3rd day, it was higher for Pusa Arunima on Olour. On the 6th day, it was highest for Pusa Arunima on Olour.

3.5. Respiration Rate

In general, a lower respiration rate was observed in scion varieties having lower shelf life on Olour rootstock, while rootstock failed to amend the respiration rate in Pusa Arunima and Pusa Surya during storage. The respiration rate on the 3rd day and 6th day was affected by the interaction of rootstock and scion (Table 3). Moreover, an increase in respiration rate was noted in all scion/rootstock combinations at varying degrees (Figure 2). Except for the scion variety Amrapali, the rest showed the influence of rootstock on respiration rate during storage. The higher increase in respiration rate in Pusa Arunima and Pusa Surya during storage at the 3rd day was noted on the K-5 rootstock, while on the 6th day of storage, Pusa Arunima/K-5 and Pusa Surya/Kurukkan exhibited the highest increase in respiration rate. Moreover, Dashehari/Kurukkan and Mallika/K-5 combination had the highest increase in respiration rate on the 3rd day of storage compared to the normal ripening (0 day of storage). Dashehari/K-5 or Dashehari/Kurukkan and Mallika/Kurukkan exhibited the highest increase in respiration rate on the 6th day of storage. Overall, all scion varieties while grown on Olour rootstock showed the lowest increase in respiration rate on the 3rd day of storage.

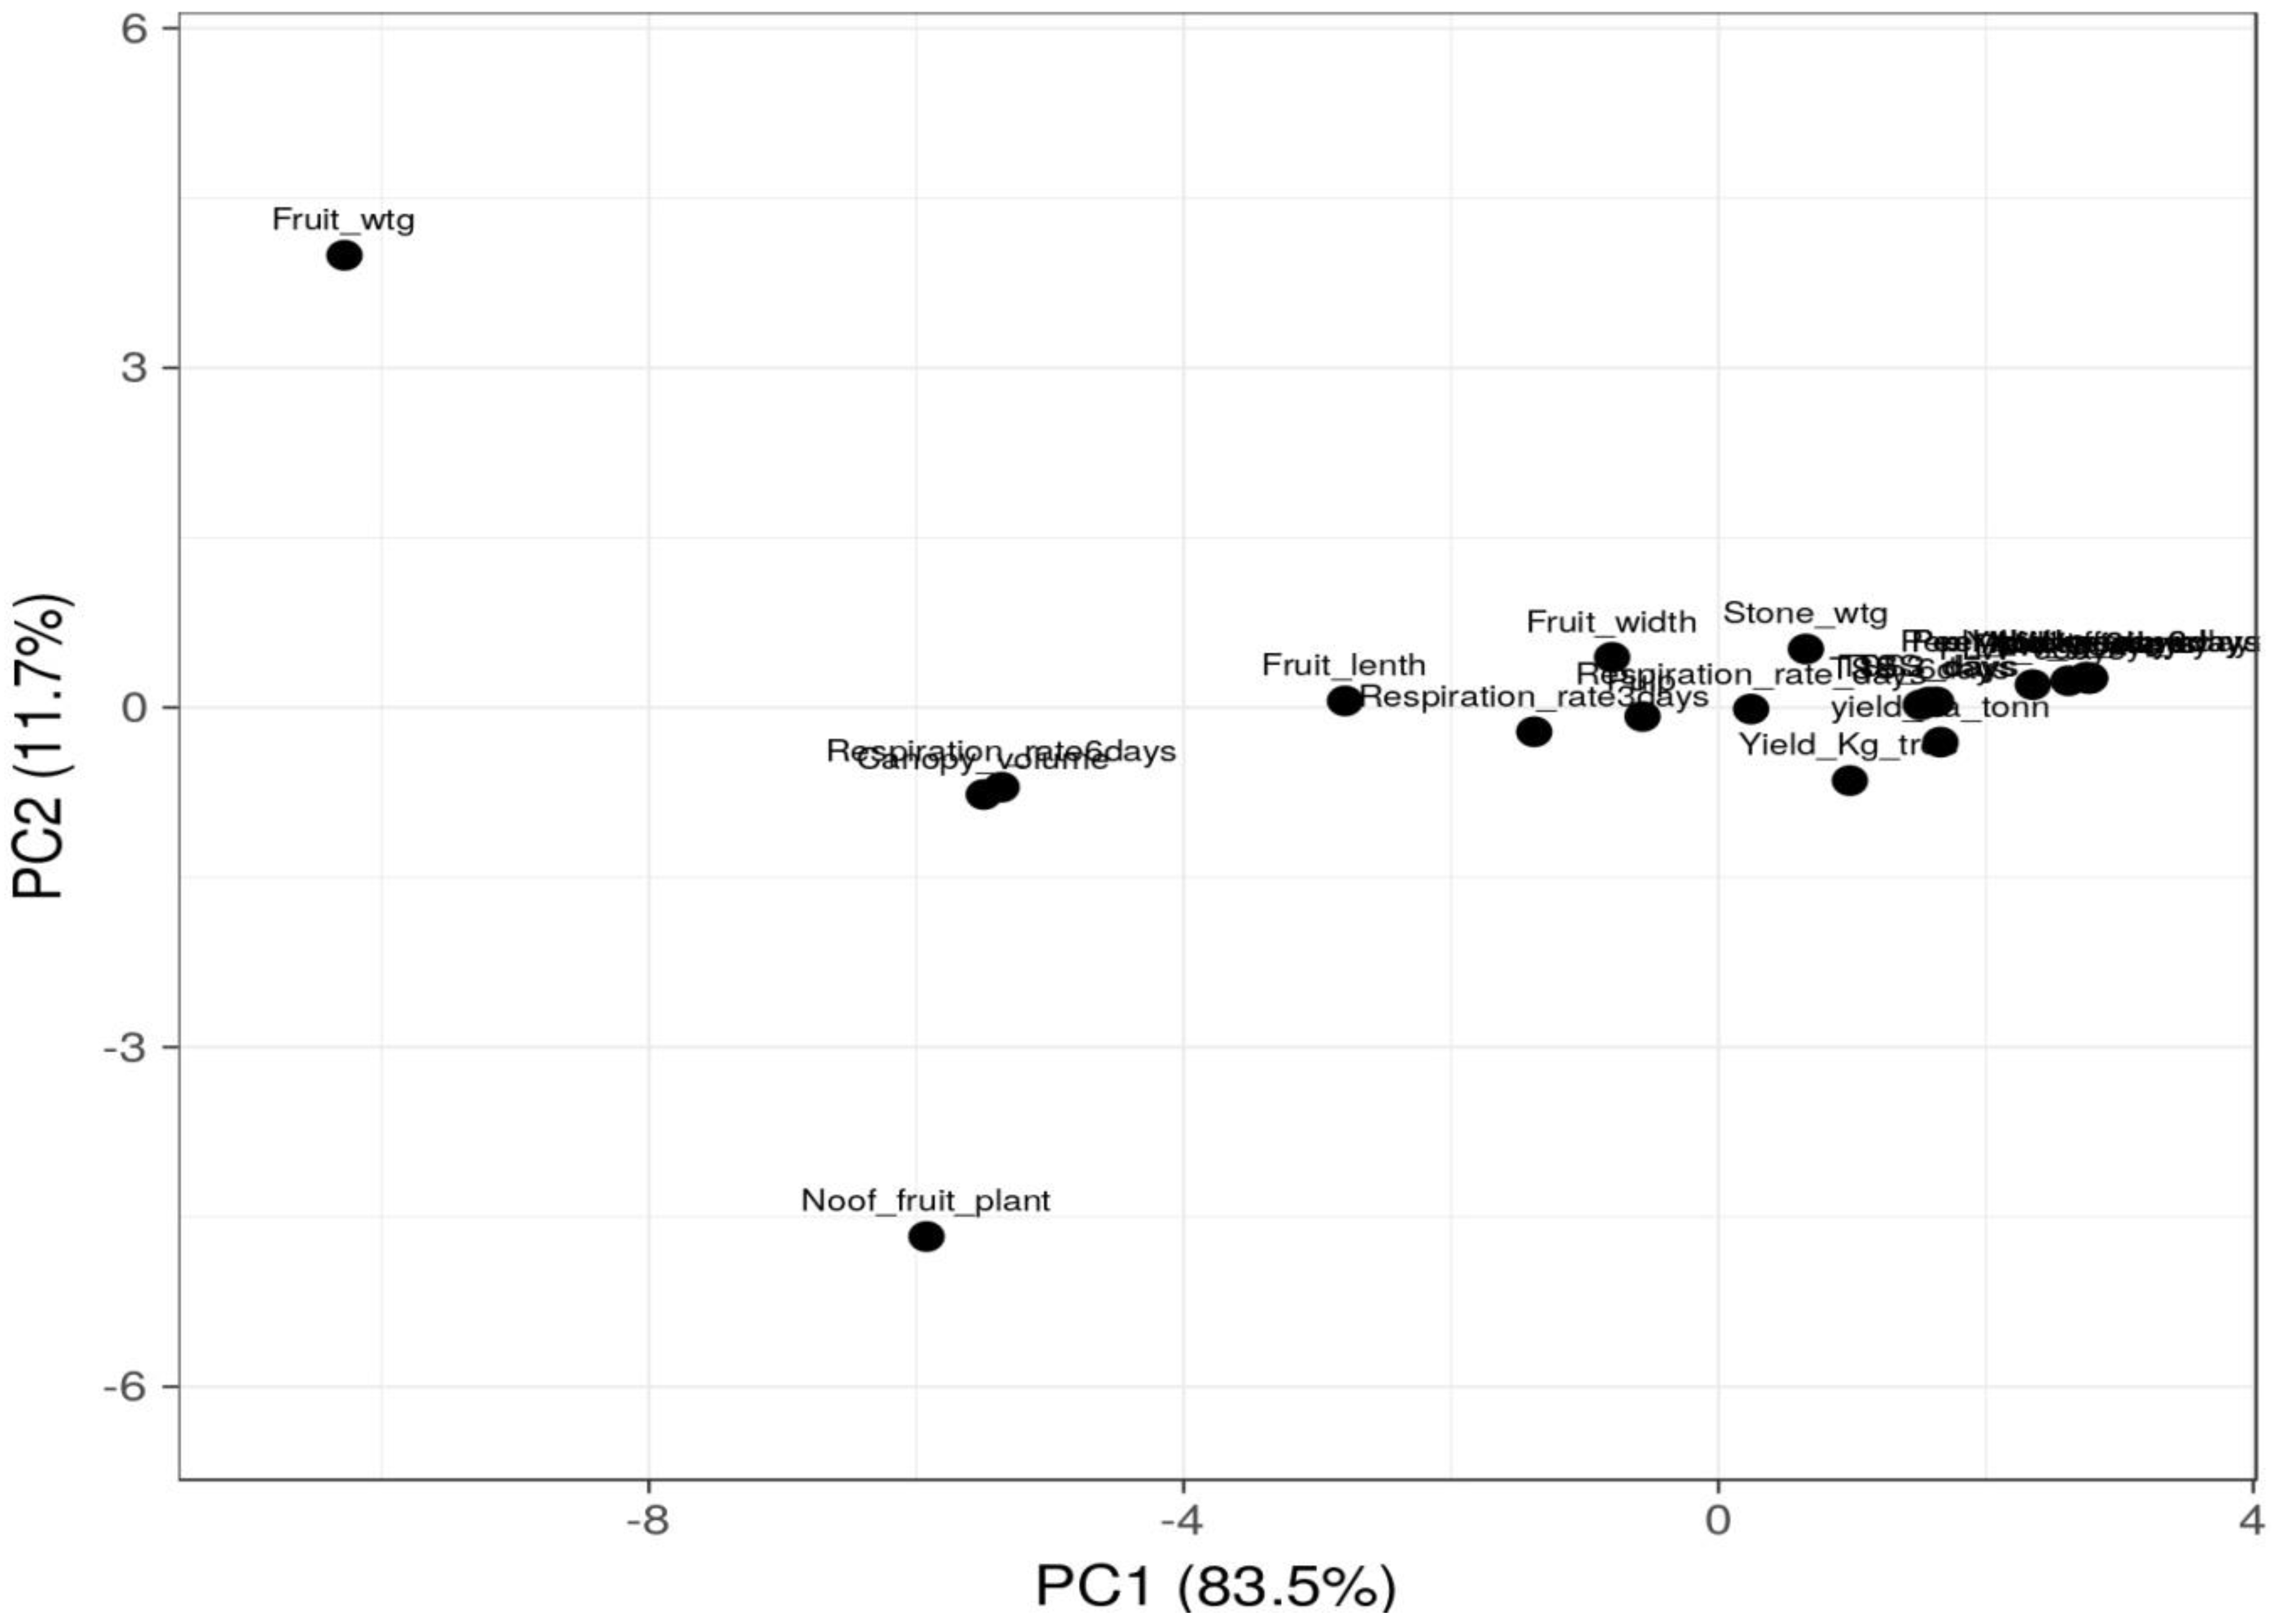
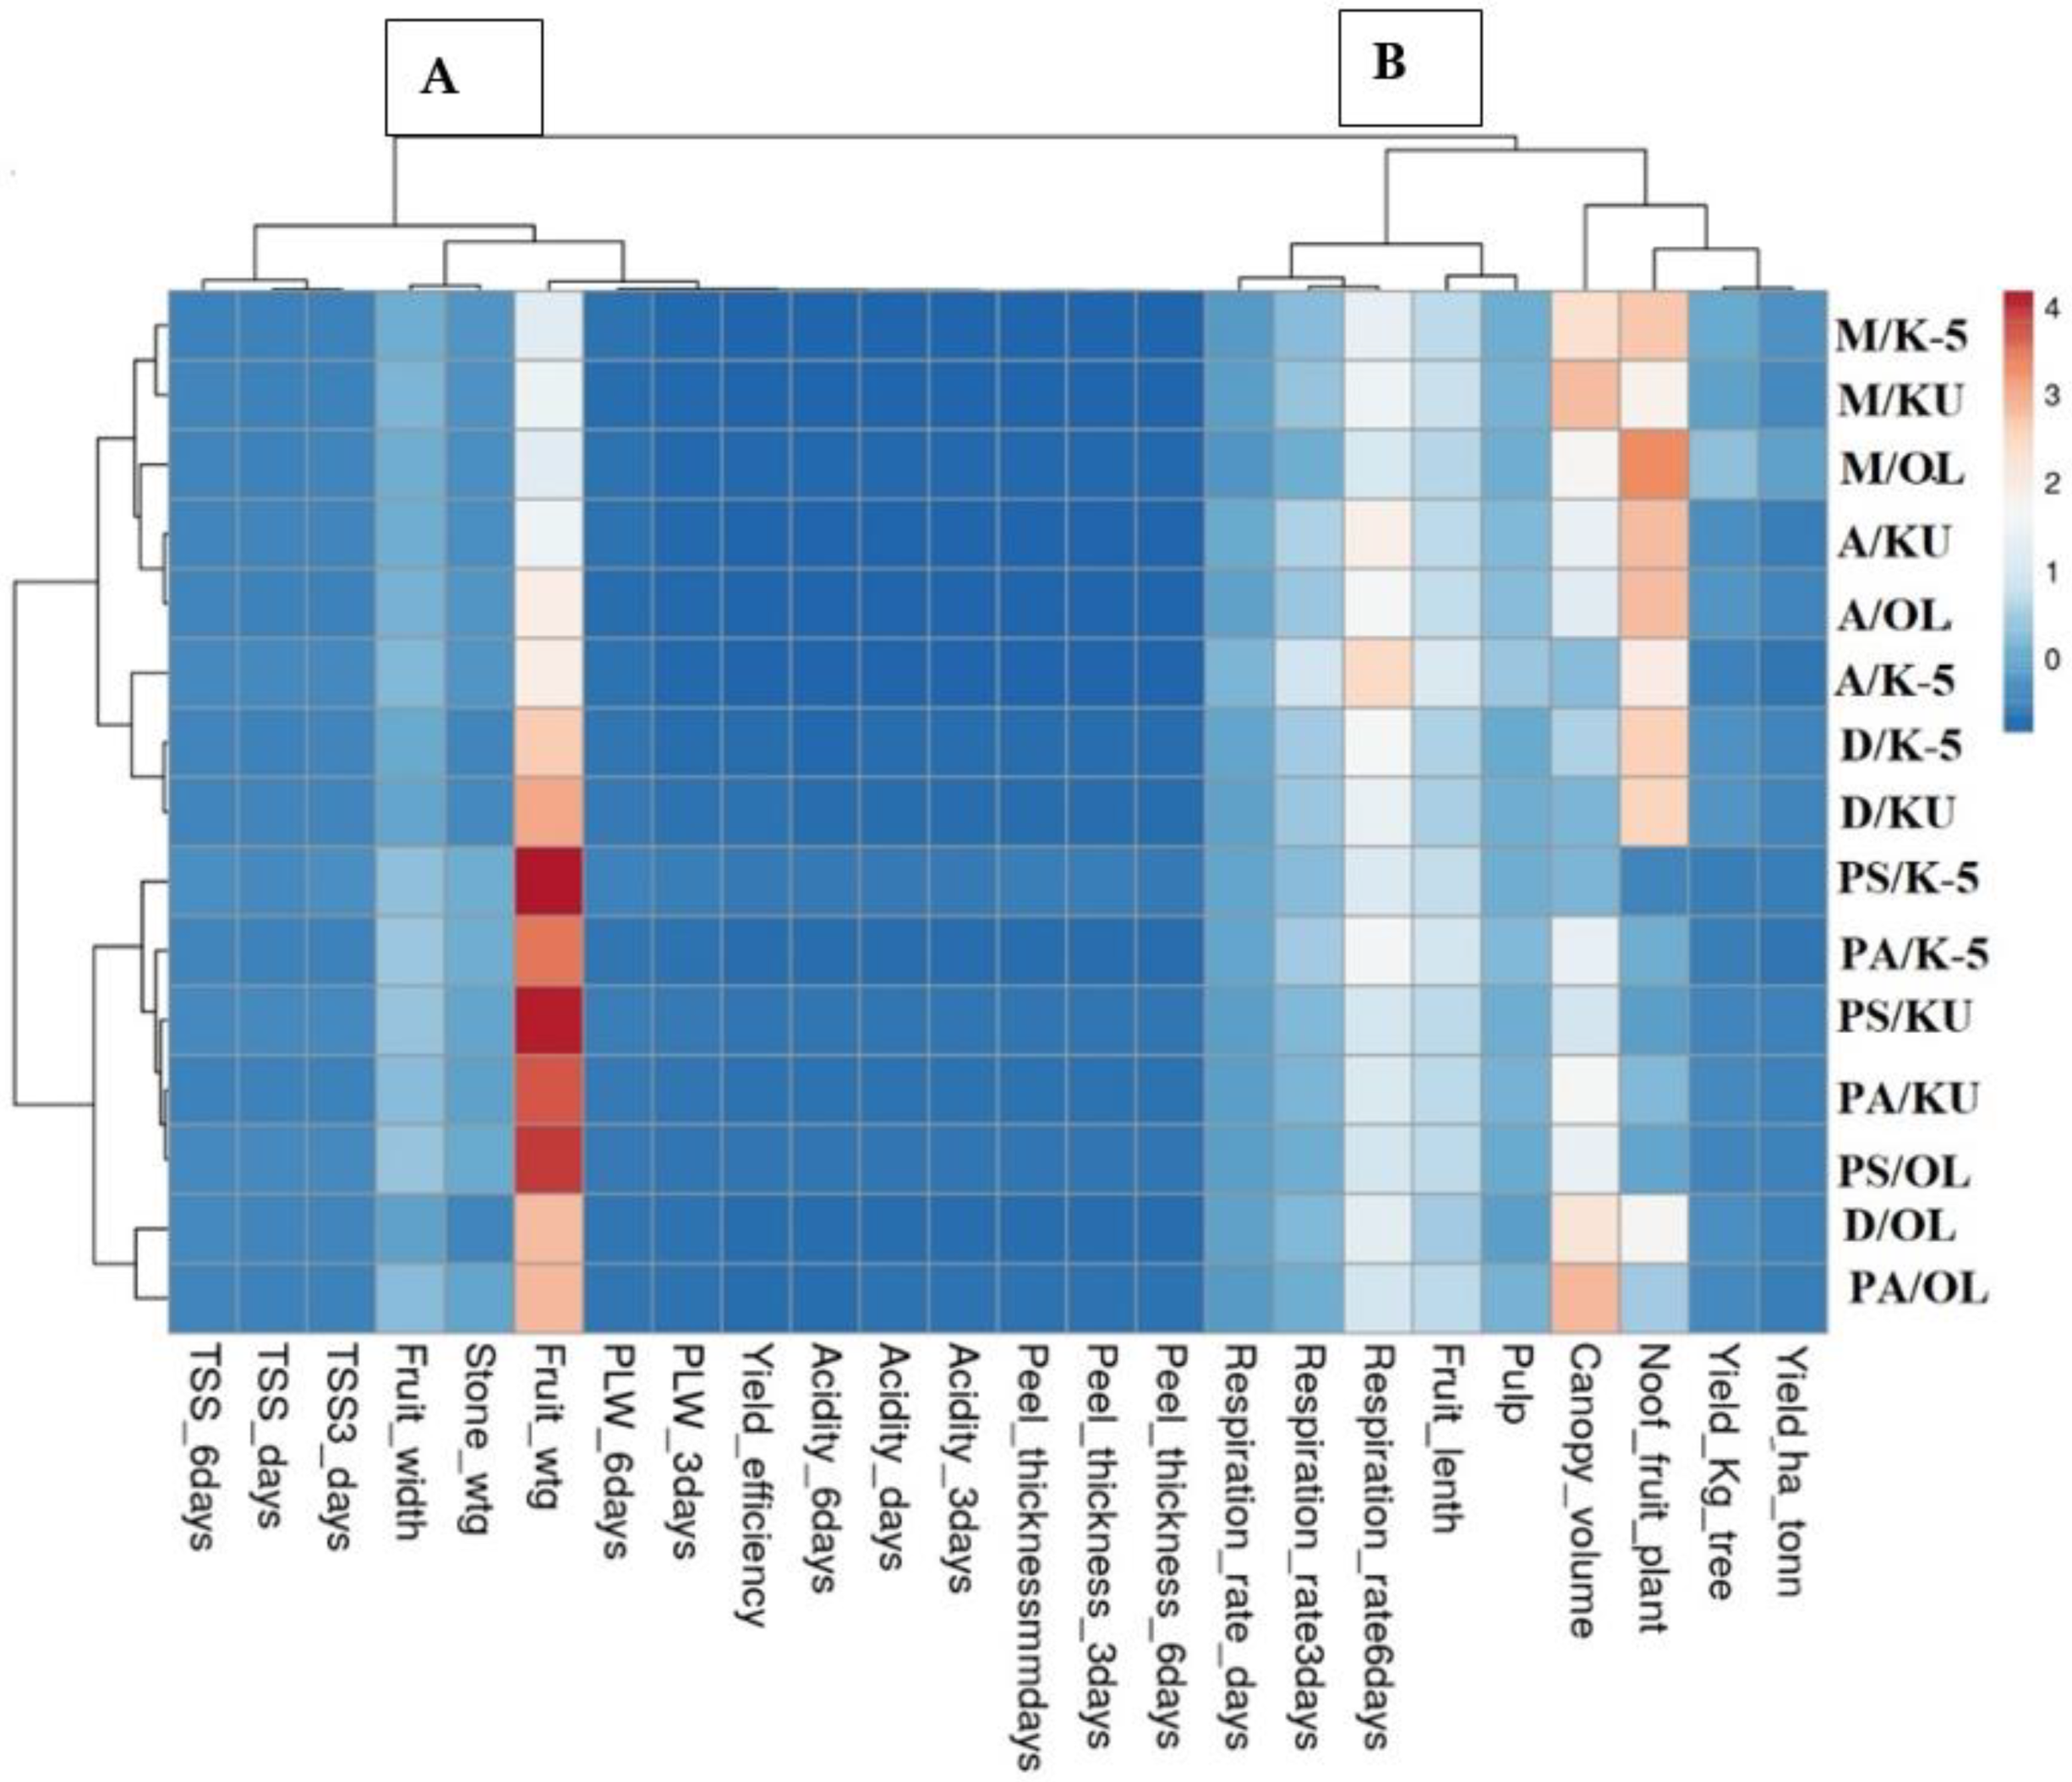
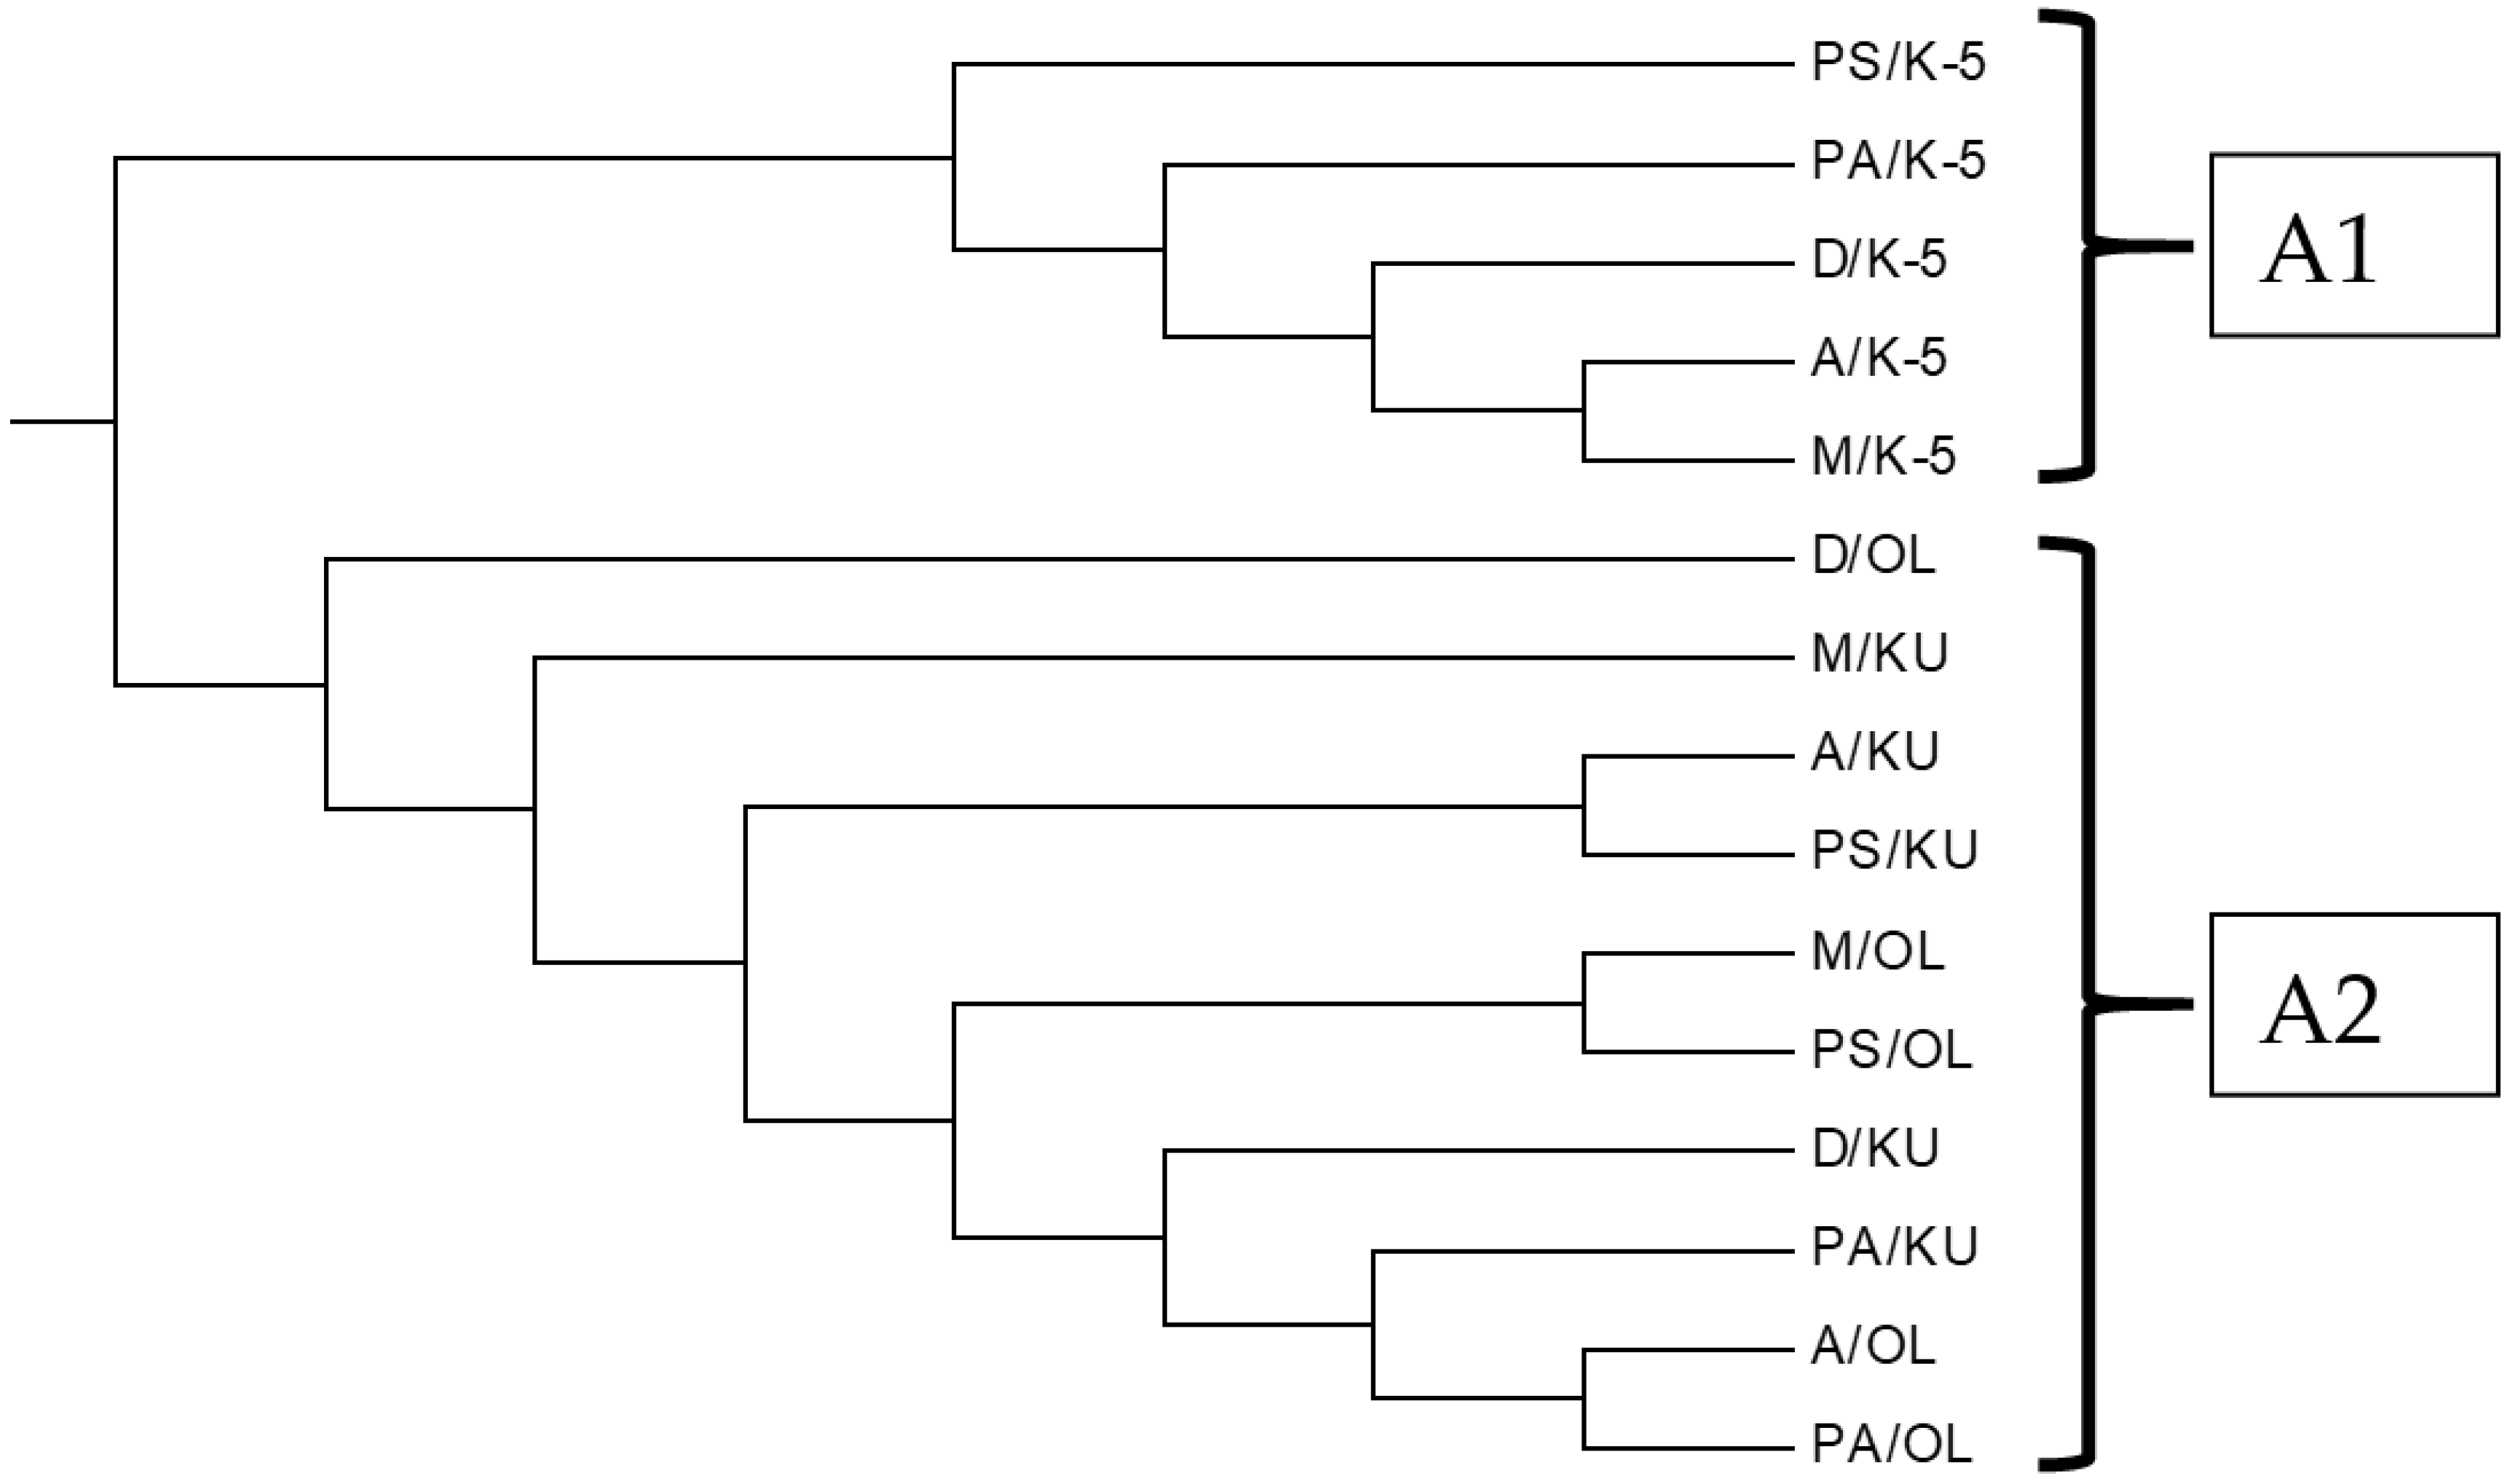
3.6. Cluster Analysis and Principal Component Analysis

Cluster analysis based on physico-chemical parameters depicts the relatedness and variability in five scion varieties each grafted on three rootstocks. Principal component analysis studies revealed a total of 15 principal components that mainly affect the quality of mango fruit (Supplementary Figure S1). Although variation among scion/rootstock combinations of mango can be explained by component PC1 (83.5%) and PC2 (11.7%), i.e., fruit weight, number of fruits per, canopy volume, fruit length, respiration rate at 6th day, it mainly affects the quality of mango fruit grafted on different rootstock. Detailed study based on physico-chemical data grouped all the rootstocks and scion/rootstock combinations into two major clusters. Fruit weight is highly upregulated, followed by fruit width and stone weight in group A, whereas in group B, no. of fruits per plant, canopy volume, fruit length, respiration rate at 6th day of storage, and pulp percent were highly upregulated. Based on heat-map clustering, Mallika and Amrapali clustered together, irrespective of the rootstock (Olour, Kurukkan, K-5) used for grafting (Figure 3 and Figure 4).

3.7. Genetic Characterization of Mango Rootstocks and Scion/Rootstock Combinations Using Shelf-Life-Specific Markers

Genomic DNA yield in different genotypes ranged from 1665.2 (Pusa Surya/K-5) to 348.6 ngμL−1 (Amrapali/K-5). The average value of DNA quality on the basis of nanodrop reading (A260/280) was 1.75. Primer standardization was performed on optimized PCR conditions at various annealing temperatures. A total of 35 shelf-life-specific SSR loci were used to characterize the scion/rootstock combinations for their shelf-life-related attributes. Final optimal annealing temperature for all 35 primers was provided in Table S2. These 35 SSR loci were grouped, viz., 13 ripening related sequences-based primers, 14 contigs-based primers, and 8 expansin gene-based primers. A total of 50 alleles were amplified from 24 polymorphic shelf-life-specific markers, ranging from 2 to 3 alleles per locus with an average of 2 (Supplementary Figure S2). The major allelic frequency (Maf) of the shelf-life-specific markers ranged from 0.43 (NMSLC-10) to 0.93 (MSL-6, MSL-7) with a mean value of 0.63 per locus. Furthermore, the average PIC value per locus was 0.34 across all three groups of primers. Maximum PIC 0.52 was observed with the primer NMSLC-10 and lowest 0.11 in MSL-6 and MSL-7. The gene diversity of the shelf-life-specific primers was calculated for 24 primers, with an average of 0.43 per locus and a range of 0.12 to 0.60. The highest gene diversity (0.60) was found in NMSLC-10, while the lowest value (0.12) was found in MSL-6 and MSL-7 (Table 4).
Genetic tree showed the relatedness among the studied mango genotypes (Figure 5). All the 15 mango genotypes grouped into two major clusters. Sub-cluster A1 consisted of a total of 10 genotypes, and sub-cluster A2 consisted of 5 genotypes (Supplementary Table S3). A total of 24 polymorphic SSR loci were further used to determine the population structure and marker–trait association analysis. A sharp peak with the maximum value of DK was obtained at K = 2, thereby confirming the classification of 15 mango genotypes into 2 distinct sub-population groups (Supplementary Figure S3A–C). Genotypes with a score of more than 0.80 were considered as pure, and less than 0.80 as admixture [1]. All genotypes were pure in the studied set of genotypes. Mango genotypes were assigned to the corresponding A–B subpopulations, representing 10 genotypes 66% and 24% (5) of the total genotypes (15) studied. Interestingly co-linearity was found between structure groups and dendrogram clusters and there were two groups in both the analysis with same types of genotypes. Marker–trait association was performed for 25 physico-chemical parameters using the TASSEL software. A total of eight SSRs loci were associated with eight different traits and contributed 33–85% of the phenotypic variation in the GLM approach (Supplementary Figures S4 and S5). Markers NMSLC-12 was strongly associated with yield efficiency trait, with 85% of phenotypic variance. Marker MSL-10 and MSL-7 were associated with acidity at the 6th day and pulp percentage with a phenotypic variance of 43% and 47%, respectively (Table 5). SSR loci MSL-9 was associated with acidity % at 0 day and the 3rd day, with a phenotypic % of 44 and 33, respectively. Marker NMSLC-14 was associated with fruit weight, TSS at 0, 3, and 6th day, pulp %. Marker NMSLC-2 was associated with pulp% with 49% phenotypic variance. Marker NMSLC-4 was associated with 10 traits. Marker NMSLC-5 was associated with pulp% with 48% phenotypic variance.

4. Discussion

4.1. Yield and Yield Efficiency

Yield/tree as well as yield efficiency fluctuated by rootstock in all studied scion varieties. In general, Mallika, Dashehari, and Amrapali had higher fruits per tree than Pusa Arunima and Pusa Surya on all rootstocks. Among all the scion–rootstock combinations, Mallika/Olour produced the highest fruit/tree as well as fruit yield/tree. Nevertheless, if compared within scion varieties, all scion varieties had higher fruits/tree on Olour rootstock. However, yield per tree indicated superior performance of Kurukkan for Pusa Arunima and Dashehari, while Amrapali and Mallika produced higher yield per tree on the Olour rootstock. Furthermore, Kurukkan and Olour were found to be more productive for Pusa Surya. Though highest yield efficiency was established in the Dashehari/Kurukkan combination, Kurukkan appeared to be the best performer with regard to yield efficiency for other varieties too. Variation in yield efficiency and yield may be because of modifications in climatic conditions, tree morphology, and physiology of rootstocks, which was witnessed by tree vigor, scion–stock compatibility, and fruiting opportunity of scion varieties on certain rootstocks [14]. Differences in fruit yield due to rootstock influence in mango had also been reported earlier by several researchers [14,30,31].

4.2. Storage Study

Shorter shelf life and high postharvest losses are major challenges in the postharvest chain for mango industry [4]. Identification of suitable rootstock for quality fruit production which imparts longer shelf life is very much required. To determine the effect of scion–rootstock interaction on quality traits of the fruits, in mango trees, we studied their relation through an analysis of the physico-chemical parameters of the fruit of 15 scion/rootstock combinations. Further, ripening-gene-specific markers were used to study marker–trait association, as characteristics of either a scion or a rootstock cannot be determined for themselves, but rather only in interaction with each scion/rootstock [8]. Here, we have studied five different varieties as scion: Pusa Arunima, Pusa Surya, and Mallika as long shelf-life varieties, Amrapali as a medium shelf-life variety, and Dashehari as a short shelf-life variety [32,33,34,35]. These varieties as scion were grafted on different rootstocks, e.g., Kurukkan, Olour and K-5. These different scion/rootstock combinations were studied for the effect of rootstock on scion in terms of shelf life.

4.2.1. Physico-Chemical Parameters Analysis in Scion/Rootstock Combinations

In a previous study, Shankar [36] reported, in comparison to K-5 and Kurukkan rootstocks, that Olour was found to be the best rootstock in terms of pomological characters, concentration of carotenoids, total phenolics and flavonoids, physiological parameters, and firmness. Similarly, in the present study, we have found that the rootstock Olour had the maximum potential to enhance quality traits and the shelf life of these scions. Moreover, Pusa Arunima fruits have an intrinsic property of a slow-ripening rate and fewer ripening-related alterations. Dubey et al. [14] reported that on the Olour rootstock, total phenolic compounds were higher in Pusa Arunima and Amrapali, although K-5 supported their larger accumulation in Pusa Surya and Dashehari. Similarly, in the present study, among all rootstocks, Olour was found to be best for a long shelf life of the mango. All the studied physico-chemical parameters were affected by scion/rootstock interactions. A previous study by Dayal et al. [6] suggested that rootstock affects the majority of the physico-chemical parameters in mango scion cultivars; however, the level of activity regulation varies with the scion. Scion has own fruit quality traits but all the studied physio-chemical parameters, i.e., TSS, acidity, PLW, peel thickness, and respiration rate, were affected by the rootstock–scion interaction.

4.2.2. Comparative Cluster Analysis for Physico-Chemical Parameters and Molecular Analysis

In the present study, when we compared the cluster data of morphological and molecular data, it depicted that those molecular markers clearly grouped most of the scion/rootstock combinations in terms of their rootstocks. For example, all scion grafted on the rootstocks Kurukkan and Olour were presented in one cluster, whereas scion grafted on K-5 were presented in a separate cluster. However, clusters based on morphological data did not show a clear-cut distribution of scion/rootstock combinations.

4.3. Marker–Trait Association Study in Scion/Rootstock Combinations

Strong association of SSR loci NMSLC-12 and NMSLC-14 with yield efficiency and fruit weight with a phenotypic variance of 85 and 70%, respectively, were observed. These parameters are well known to be related with shelf life. Previously, Sinha et al. [37] observed that the SSR markers TOM 184 and TOM 144, which are present on chromosomes 4 and 11, respectively, have been found to be associated with the long shelf life in tomato. Pawar et al. [38] screened RILs in tomato for shelf life. Three SSRs, namely SSR146, LEaat007, and TGS2259, were associated with shelf life. A total of 23 genic-SSR markers were linked to 13 different pomological features [2]. One SSR marker was linked to the fruit firmness, fruit size, fruit shape in longitudinal selection, acid content, and total soluble solid content in Japanese pear [39]. Similarly, in the present study, a total of eight SSR markers were associated with eight different traits. Therefore, the interaction of genotypes has a significant impact on grafted plants performance, as well as on fruit quality in grafted varieties. It is now evidenced that genetic exchange is happening across grafting junctions between rootstock and scion, potentially affecting grafting-mediated effects already recorded in grafted plants. Graft-induced changes on several plant characteristics producing many phenotypic variants have been reported in peppers [40]. Present study also clearly points out toward trafficking of genetic information between the two grafted partners for quality traits as well.
From the findings, we can infer that grafting reflected a wider effect on postharvest quality attributes, such as total soluble solids, acidity, peel thickness, respiration rate, and physiological weight loss. Mango scion varieties grafted on Olour rootstock had higher total soluble solids, moderate acidity, more peel thickness, and lower respiration rate and physiological weight loss, and hence were able to improve postharvest quality compared to the fruits harvested from the trees grafted on other rootstocks for all three scion varieties. Hence, rootstock Olour can be exploited as a potential polyembryonic rootstock for extending the shelf life of mango scion varieties. Furthermore, our study also established a strong association for markers NMSLC-12 and NMSLC-14 with yield efficiency and fruit weight; hence, this could be utilized for marker-assisted breeding for these traits in mango improvement. Overall, fruits of Pusa Arunima and Pusa Surya mango scion varieties could successfully be kept for 6 days at a room temperature of 20 °C.

Supplementary Materials

The following supporting information can be downloaded at: https://www.mdpi.com/article/10.3390/agronomy13010204/s1, Figure S1: Variance explained by Principal Component (individual and cumulative) for various fruit quality traits in 15 scion/rootstock combinations; Figure S2: Molecular profiling of five mango varieties grafted on three polyembryonic rootstocks using shelf-life specific simple sequence repeat locus NMSLC-14; Figure S3: Model based population structure plot for each variety with K = 2, using Structure with 24 SSR markers. Color codes are as follows: Population A red, Population B green, population. Delta K vs KEvanno plot showing K = 2 having the peak delta K value, suggesting existence of two sub-populations in 15 scion/rootstock combinations; Figure S4: Quantile–quantile (QQ) plots showing the distribution of observed verses expected p values. Significant associations were observed for fruit weight, yield efficiency, peel thickness, pulp percent, total soluble solids and acidity; Figure S5: Mapchart indicating the position and relative distance of the tested markers on different mango chromosomes; Table S1: Description of five mango varieties grafted on three polyembryonic rootstocks; Table S2: List of primer sequences, annealing temperature and product size of shelf-life specific primers used in five mango varieties grafted on three polyembryonic rootstocks; Table S3: Distribution of five mango varieties grafted on three polyembryonic rootstocks in different clusters using shelf-life specific primers.

Author Contributions

M.S., N.S. (Nimisha Sharma), A.K.D. and M.J. have contributed equally. M.S. carried out validation and lab work. N.S. (Nimisha Sharma) conceptualized the study, curated data, visualized the work, and wrote the original draft. N.S. (Neha Sharma) carried out formal analysis. B.P.S. carried out formal analysis. V.M. provided the lab facility and revised the manuscript. A.K.D. provided fruit samples, supervised the work, and revised the manuscript. S.K.S. helped in acquisition and editing. N.K., M.J., N.S. (Narendra Singh) and N.S. (Nisha Singh) carried out formal analysis. R.M.S. carried out editing. S.S. provided the lab facility. All authors have read and agreed to the published version of the manuscript.

Funding

No specific funding was obtained for this study.

Data Availability Statement

The datasets generated during and/or analyzed during the current study are available as electronic Supplementary File along with the published manuscript.

Acknowledgments

Authors are thankful to Director, ICAR-Indian Agricultural Research Institute, New Delhi for providing the required research facilities. The authors are also thankful to Ramya Ravishankar (presently working in the USA) for improving the language and grammar corrections.

Conflicts of Interest

The authors declare no conflict of interest.

References

  1. Singh, B.P.; Jayaswal, P.K.; Singh, B.; Singh, P.K.; Kumar, V.; Mishra, S.; Singh, N.K. Natural allelic diversity in OsDREB1F gene in the Indian wild rice germplasm led to ascertain its association with drought tolerance. Plant Cell Rep. 2015, 34, 993–1004. [Google Scholar] [CrossRef] [PubMed]
  2. Lal, S.; Singh, A.K.; Singh, S.K.; Srivastav, M.; Singh, B.P.; Sharma, N.; Singh, N.K. Association analysis for pomological traits in mango (Mangifera indica L.) by genic-SSR markers. Trees 2017, 31, 1391–1409. [Google Scholar] [CrossRef]
  3. APEDA-Agricultural and Processed Food Products Export Development Authority. Products-Fresh Fruits and Vegetable: Mango; Ministry of Commerce and Industry, Government of India: New Delhi, India, 2020; Volume 2020. [Google Scholar]
  4. Bally, I.S.; Bombarely, A.; Chambers, A.H.; Cohen, Y.; Dillon, N.L.; Innes, D.J.; Yan, H. The ‘Tommy Atkins’ mango genome reveals candidate genes for fruit quality. BMC Plant Biol. 2021, 21, 108. [Google Scholar] [CrossRef] [PubMed]
  5. Taher, M.A.; Loa, A.A.; Gouda, M.; Limam, S.A.; Abdelkader, M.F.; Osman, S.O.; Hikal, D.M. Impacts of gum arabic and polyvinylpyrrolidone (PVP) with salicylic acid on peach fruit (Prunus persica) shelf-life. Molecules 2022, 27, 2595. [Google Scholar] [CrossRef] [PubMed]
  6. Dayal, V.; Dubey, A.K.; Singh, S.K.; Sharma, R.M.; Dahuja, A.; Kaur, C. Growth, yield and physiology of mango (Mangifera indica L.) cultivars as affected by polyembryonic rootstocks. Sci. Hortic. 2016, 199, 186–197. [Google Scholar] [CrossRef]
  7. Wang, J.; Jiang, L.; Wu, R. Plant grafting: How genetic exchange promotes vascular reconnection. New Phytol. 2017, 214, 56–65. [Google Scholar] [CrossRef] [Green Version]
  8. Tietel, Z.; Srivastava, S.; Fait, A.; Tel-Zur, N.; Carmi, N.; Raveh, E. Impact of scion/rootstock reciprocal effects on metabolomics of fruit juice and phloem sap in grafted Citrus reticulata. PLoS ONE 2020, 15, 227192. [Google Scholar] [CrossRef]
  9. Vahdati, K.; Sarikhani, S.; Arab, M.M.; Leslie, C.A.; Dandekar, A.M.; Aleta, N.; Mehlenbacher, S.A. Advances in rootstock breeding of nut trees: Objectives and strategies. Plants 2021, 10, 2234. [Google Scholar] [CrossRef]
  10. Srivastava, S.; Singh, R.K.; Pathak, G.; Goel, R.; Asif, M.H.; Sane, A.P.; Sane, V.A. Comparative transcriptome analysis of unripe and mid-ripe fruit of Mangifera indica (var. “Dashehari”) unravels ripening associated genes. Sci. Rep. 2016, 6, 32557. [Google Scholar] [CrossRef] [Green Version]
  11. Pradeepkumara, N.; Sharma, P.K.; Munshi, A.D.; Behera, T.K.; Bhatia, R.; Kumari, K.; Dey, S.S. Fruit transcriptional profiling of the contrasting genotypes for shelf-life reveals the key candidate genes and molecular pathways regulating post-harvest biology in cucumber. Genomics 2022, 114, 110273. [Google Scholar] [CrossRef]
  12. Tsaballa, A.; Athanasiadis, C.; Pasentsis, K.; Ganopoulos, I.; Nianiou-Obeidat, I.; Tsaftaris, A. Molecular studies of inheritable grafting induced changes in pepper (Capsicum annuum) fruit shape. Sci. Hortic. 2013, 149, 2–8. [Google Scholar] [CrossRef]
  13. Dubey, A.K.; Sharma, R.M. Effect of rootstocks on tree growth, yield, quality and leaf mineral composition of lemon (Citrus limon (L.) Burm.). Sci. Hortic. 2016, 200, 131–136. [Google Scholar] [CrossRef]
  14. Dubey, A.K.; Sharma, R.M.; Kumar, A. Long term performance of mango varieties on five polyembryonic rootstocks under subtropical conditions: Effect on vigour, yield, fruit quality and nutrient acquisition. Sci. Hortic. 2021, 280, 109944. [Google Scholar] [CrossRef]
  15. Jukic-Spika, M.; Dumicic, G.; Brkic-Bubola, K.; Soldo, B.; Goreta, B.S.; Vuletin-Selak, G.; Zanic, K. Modification of the sensory profile and volatile aroma compounds of tomato fruits by the scion× rootstock interactive effect. Front. Plant Sci. 2021, 11, 2303. [Google Scholar] [CrossRef]
  16. Albacete, A.; Martínez-Andújar, C.; Martínez-Pérez, A.; Thompson, A.J.; Dodd, I.C.; Pérez-Alfocea, F. Unravelling rootstock × scion interactions to improve food security. J. Exp. Bot. 2015, 66, 2211–2226. [Google Scholar] [CrossRef] [Green Version]
  17. Gupta, P.K.; Varshney, R.K. The development and use of microsatellite markers for genetic analysis and plant breeding with emphasis on bread wheat. Euphytica 2000, 113, 163–185. [Google Scholar] [CrossRef]
  18. A.O.A.C. Offical Methods of Analysis. Association of official Analytical Chemists International; A.O.A.C.: Gaithersburg, MD, USA, 2006. [Google Scholar]
  19. Prasad, K.; Sharma, R.R.; Srivastav, M. Postharvest treatment of antioxidant reduces lenticels discolouration and improves cosmetic appeal of mango (Mangifera indica L.) fruits without impairing quality. J. Food Sci. Technol. 2016, 53, 2995–3001. [Google Scholar] [CrossRef] [Green Version]
  20. Doyle, J.J.; Doyle, J.L. A rapid total DNA preparation procedure from fresh plant tissue. Focus 1987, 12, 13–15. [Google Scholar]
  21. Temnykh, S.; DeClerck, G.; Lukashova, A.; Lipovich, L.; Cartinhour, S.; McCouch, S. Computational and experimental analysis of microsatellites in rice (Oryza sativa L.). Genome Res. 2001, 11, 1441–1452. [Google Scholar] [CrossRef] [Green Version]
  22. Metsalu, T.; Vilo, J. Clust Vis: A web tool for visualizing clustering of multivariate data using Principal Component Analysis and heatmap. Nucleic Acids Res. 2015, 43, 566–570. [Google Scholar] [CrossRef]
  23. Jombart, T. Adegenet: An R package for the multivariate analysis of genetic markers. Bioinformatics 2008, 24, 1403–1405. [Google Scholar] [CrossRef] [PubMed]
  24. Liu, K.; Spencer, V.M. Power marker: An integrated analysis environment for genetic marker analysis. Bioinformatics 2005, 21, 2128–2129. [Google Scholar] [CrossRef] [PubMed] [Green Version]
  25. Pritchard, J.K.; Stephens, M.; Donnelly, P. Inference of population structure using multilocus genotype data. Genetics 2000, 155, 945–959. [Google Scholar] [CrossRef] [PubMed]
  26. Evanno, G.; Regnaut, S.; Goudet, J. Detecting the number of clusters of individuals using the software STRUCTURE: A simulation study. Mol. Ecol. 2005, 14, 2611–2620. [Google Scholar] [CrossRef] [PubMed] [Green Version]
  27. Earl, D.A.; Von-Holdt, B.M. STRUCTURE HARVESTER: A website and program for visualizing STRUCTURE output and implementing the Evanno method. Conserv. Genet. Resour. 2012, 4, 359–361. [Google Scholar] [CrossRef]
  28. Yu, J.; Pressoir, G.; Briggs, W.H.; Bi, I.V.; Yamasaki, M.; Doebley, J.F.; Buckler, E.S. A unified mixed-model method for association mapping that accounts for multiple levels of relatedness. Nat. Genet. 2006, 38, 203–208. [Google Scholar] [CrossRef]
  29. Bradbury, P.J.; Zhang, Z.; Kroon, D.E.; Casstevens, T.M.; Ramdoss, Y.; Buckler, E.S. TASSEL: Software for association mapping of complex traits in diverse samples. Bioinformatics 2007, 23, 2633–2635. [Google Scholar] [CrossRef]
  30. Reddy, Y.T.N.; Kurian, R.M.; Ramachander, P.R.; Singh, G.; Kohli, R.R. Long-term effects of rootstocks on growth and fruit yielding patterns of ‘Alphonso’ mango (Mangifera indica L.). Sci. Hortic. 2003, 97, 95–108. [Google Scholar] [CrossRef]
  31. Smith, M.W.; Bright, J.D.; Hoult, M.D.; Renfree, R.A.; Maddern, T.; Coombes, N. Field evaluation of 64 rootstocks for growth and yield of ‘Kensington Pride’ mango. Hortscience 2008, 43, 1720–1725. [Google Scholar] [CrossRef] [Green Version]
  32. Hoda, M.N.; Singh, S.; Singh, J. Evaluation of mango (Mangifera indica) cultivars for quality attributes. Indian J. Agric. Sci. 2003, 73, 504–506. [Google Scholar]
  33. Singh, S.K.; Singh, S.K.; Sharma, R.R.; Patel, V.B. Influence of pruning intensity on flowering, fruit yields and floral malformation in three mango cultivars planted under high density. Indian J. Hortic. 2010, 67, 84–89. [Google Scholar]
  34. Aung, A.M.M. Evaluation of Postharvest Quality of Mango Genotype During Storage. Master’s Thesis, Indian Agricultural Research Institute, New Delhi, India, 2019. [Google Scholar]
  35. Prasad, K.; Sharma, R.R.; Srivastav, M.; Asrey, R. Relationship between lenticel discoloration and biochemical and quality attributes in mango (Mangifera indica L.) fruit. Acta Physiol. Plant. 2020, 42, 178. [Google Scholar] [CrossRef]
  36. Shankar, S. Influence of Polyembryonic Rootstocks on Quality of Mango Cultivars during Storage. Master’s Thesis, Indian Agricultural Research Institute, New Delhi, India, 2019. [Google Scholar]
  37. Sinha, S.; Ramanjini, G.P.H.; Kumar, S.; Mallikarjuna, N.M. Shelf-Life Evaluation in Selected Tomato (Solanum lycopersicum L) F7 Recombinant Inbred Lines (RILs). Austin J. Biotechnol. Bioeng. 2014, 1, 4. [Google Scholar]
  38. Pawar, P.; Gowda, P.H.; Ramegowda, R.P. Phenotypic evaluation and molecular characterization of alc/vaibhav recombinant inbred population of tomato for yield, shelf-life and fruit quality parameters. Int. J. Agric. Res. 2016, 8, 25–36. [Google Scholar]
  39. Iwata, H.; Hayashi, T.; Terakami, S.; Takada, N.; Saito, T.; Yamamoto, T. Genomic prediction of trait segregation in a progeny population: A case study of Japanese pear (Pyrus pyrifolia). BMC Genet. 2013, 14, 81. [Google Scholar] [CrossRef]
  40. Tsaballa, A.; Xanthopoulou, A.; Madesis, P.; Tsaftaris, A.; Nianiou-Obeidat, I. Vegetable grafting from a molecular point of view: The involvement of epigenetics in rootstock-scion interactions. Front. Plant Sci. 2021, 23, 2129. [Google Scholar] [CrossRef]
Figure 1. Physiological weight loss (PLW) at the 3rd and 6th days of storage as affected by scion/rootstock combinations in mango varieties: (A) Pusa Arunima, (B) Pusa Surya, (C) Amrapali, (D) Dashehari, (E) Mallika. Vertical bar indicates mean values of three samples ± standard error (SE). The LSD (p ≤ 0.05) for the 3rd day storage: variety; 0.09, rootstock; 0.07, and variety x rootstock; 0.15, for 6th day storage, variety; 0.02, rootstock; 0.15, and variety × rootstock; 0.35.
Agronomy 13 00204 g001
Figure 2. Increase in respiration rate on the 3rd (A) and 6th day (B) of storage compared to the normal ripening (0 day) as affected by scion/rootstock combinations in mango. Vertical bar indicates mean values of three samples ± standard error (SE). The LSD (p ≤ 0.05) for 3rd day storage: variety; 7.85, rootstock; 6.08, and variety × rootstock; 13.6, for 6th day storage, variety; 31.32, rootstock; 24.26, and variety × rootstock; 54.24.
Agronomy 13 00204 g002
Figure 3. PCA (Principal component analysis) biplot for fruit quality traits of scion/rootstock combinations in mango varieties.
Agronomy 13 00204 g003
Figure 4. Heatmap and hierarchical clustering for fruit quality traits of scion/rootstock combinations in mango varieties: PA; Pusa Arunima, PS; Pusa Surya, A; Amrapali, D; Dashehari, M; Mallika, OL; Olour, KU; Kurukkan, K-5. Subgroup A and B represent distinct cluster of fruit quality traits based on expression and hierarchical clustering.
Agronomy 13 00204 g004
Figure 5. Genetic tree of five mango varieties grafted on three polyembryonic rootstocks using shelf-life specific primers derived from ripening genes. 1. Pusa Arunima/Kurukkan(PA/KU), 2. Pusa Surya/Kurukkan (PS/KU), 3. Amrapali/Kurukkan(A/KU), 4. Mallika/Kurukkan(M/KU), 5. Dashehari/Kurukkan (D/KU), 6. Pusa Arunima/Olour (PA/OL), 7. Pusa Surya/Olour (PS/OL), 8. Amrapali/Olour(A/OL), 9. Mallika/Olour (M/OL), 10. Dashehari/Olour (D/OL), 11. Pusa Arunima/K-5 (PA/K-5), 12. Pusa Surya/K-5 (PS/K-5), 13. Amrapali/K-5 (A/K-5), 14. Mallika/K-5 (M/K-5), 15. Dashehari/K-5 (D/K-5). Subcluster A1 consist mango genotypes grafted on rootstock K-5, and subcluster A2 consist mango genotypes grafted on Olour and Kurukkan rootstocks.
Agronomy 13 00204 g005
Table 1. Influence of rootstock, scion, and their interaction on fruit yield of scion/rootstock combinations of mango.
Rootstock/ScionPusa ArunimaPusa SuryaAmrapaliDashehariMallikaMean
No. of Fruit/Plant
K-550.7 ± 2.8911.7 ± 2.10143.3 ± 7.64240.0 ± 5.77260.0 ± 5.8141.1
Kurukkan75.0 ± 3.4643.3 ± 2.92213.3 ± 5.35251.7 ± 6.12180.0 ± 4.9152.7
Olour86.7 ± 3.9450.7 ± 3.24223.3 ± 5.22193.3 ± 5.92330.0 ± 6.4176.8
Mean70.835.2193.3228.3256.7156.9
LSD (p ≤ 0.05)Variety (V)Rootstock (R)V × R
29.322.750.8
Yield/tree (kg)
K-513.1 ± 1.315.0 ± 1.1220.1 ± 1.1636.0 ± 2.0863.5 ± 3.1827.5
Kurukkan27.1 ± 1.2118.4 ± 1.4229.4 ± 1.8638.3 ± 2.3852.5 ± 2.8833.2
Olour22.8 ± 1.5620.2 ± 1.2238.2 ± 1.1830.4 ± 2.2290.9 ± 3.3240.5
Mean21.014.529.234.969.033.7
LSD (p ≤ 0.05)Variety (V)Rootstock (R)V × R
8.26.414.2
Yield efficiency (kg/m3)
K-50.11 ± 0.040.08 ± 0.010.38 ± 0.030.68 ± 0.080.17 ± 0.010.28
Kurukkan0.14 ± 0.050.15 ± 0.020.23 ± 0.011.84 ± 0.090.21 ± 0.020.51
Olour0.09 ± 0.020.13 ± 0.10.41 ± 0.040.41 ± 0.060.16 ± 0.010.24
Mean0.110.120.340.980.180.35
Variety (V)Rootstock (R)V × R
LSD (p ≤ 0.05)0.54NS0.93
Table 2. Influence of rootstock, scion, and their interaction on fruit weight, pulp recovery, stone weight, and pulp/stone ratio in mango.
Rootstock/ScionPusa ArunimaPusa SuryaAmrapaliDashehariMallikaMean
Fruit Weight (g)
K-5259.6 ± 5.8425.9 ± 5.4139.3 ± 6.7244.2 ± 5.4149.8 ± 4.1243.7
Kurukkan360.0 ± 6.2429.1 ± 7.6136.8 ± 4.1289.6 ± 6.4152.4 ± 4.8273.6
Olour261.8 ± 8.0388.1 ± 6.2170.1 ± 5.3275.3 ± 6.1157.2 ± 4.7250.5
Mean293.8414.4148.7269.7153.1255.9
LSD (p ≤ 0.05)Variety (V)Rootstock V × R
21.316.536.9
Pulp %
K-561.0 ± 1.4759.0 ± 2.5465.0 ± 1.9255.4 ± 1.2166.9 ± 2.5461.5
Kurukkan66.6 ± 1.2662.2 ± 1.9261.7 ± 1.4260.2 ± 1.2465.9 ± 2.1263.4
Olour60.7 ± 1.3658.0 ± 1.2369.0 ± 1.6248.5 ± 1.9470.3 ± 2.2461.3
Mean62.859.765.354.767.762.1
LSD (p ≤ 0.05)Variety (V)Rootstock (R)V × R
5.1NS8.8
Stone weight (g)
K-549.0 ± 1.9956.2 ± 1.5731.2 ± 2.3323.2 ± 1.0444.0 ± 1.9240.7
Kurukkan50.9 ± 1.3156.2 ± 1.7328.9 ± 1.0328.5 ± 1.8238.9 ± 2.1240.7
Olour49.3 ± 2.1055.2 ± 1.9238.0 ± 1.9424.0 ± 1.4637.8 ± 1.9640.9
Mean49.755.932.725.240.240.8
LSD (p ≤ 0.05)Variety (V)Rootstock (R)V × R
6.3NS11.0
Pulp/stone ratio
K-51.24 ± 0.111.07 ± 0.132.08 ± 0.212.39 ± 0.201.54 ± 0.111.67
Kurukkan1.30 ± 0.171.19 ± 0.122.14 ± 0.192.11 ± 0.171.70 ± 0.141.69
Olour1.23 ± 0.121.06 ± 0.191.83 ± 0.172.03 ± 0.161.87 ± 0.121.60
Mean1.201.112.022.181.701.65
Variety (V)Rootstock (R)V × R
LSD (p ≤ 0.05)0.20 NS0.35
Table 3. TSS, acidity, peel thickness, and respiration rate of different mango varieties grafted on polyembryonic rootstocks during storage.
Scion/RootstockTSS (0B)Acidity (% Citric Acid)Peel Thickness (mm) Respiration Rate (mL CO2kg−1 h−1)
0 day3rd day6th day0 day3rd day6th day0 day3rd day6th day0 day3rd day6th day
Pusa Arunima
K-516.6 ± 0.30 17.8 ± 0.4818.8 ± 0.320.29 ± 0.01 0.24 ± 0.020.19 ± 0.020.96 ± 0.030.94 ± 0.030.87 ± 0.0243.5 ± 2.7574.2 ± 1.59143.5 ± 2.24
Kurukkan16.4 ± 0.2117.3 ± 0.3918.3 ± 0.260.32 ± 0.020.29 ± 0.010.22 ± 0.010.85 ± 0.020.78 ± 0.020.74 ± 0.0245.4 ± 2.8872.6 ± 2.12139.9 ± 1.98
Olour17.0 ± 0.2518.2 ± 0.4018.8 ± 0.360.28 ± 0.020.23 ± 0.020.19 ± 0.021.32 ± 0.041.10 ± 0.020.92 ± 0.0338.1 ± 2.4056.9 ± 2.22118.8 ± 1.92
Pusa Surya
K-518.1 ± 0.2119.4 ± 0.2920.3 ± 0.290.26 ± 0.020.20 ± 0.010.18 ± 0.020.94 ± 0.020.90 ± 0.030.82 ± 0.0247.1 ± 2.8277.6 ± 2.34146.0 ± 2.52
Kurukkan20.0 ± 0.2620.4 ± 0.3620.8 ± 0.350.27 ± 0.010.24 ± 0.020.21 ± 0.010.81 ± 0.020.76 ± 0.020.68 ± 0.0345.0 ± 2.7576.8 ± 2.24142.4 ± 2.32
Olour21.1 ± 0.3221.7 ± 0.3721.9 ± 0.320.30 ± 0.020.26 ± 0.020.17 ± 0.021.20 ± 0.030.98 ± 0.020.86 ± 0.0242.0 ± 2.4663.0 ± 2.44130.5 ± 2.12
Amrapali
K-522.9 ± 0.5823.9 ± 0.2824.9 ± 0.290.27 ± 0.010.23 ± 0.030.17 ± 0.020.55 ± 0.040.50 ± 0.020.44 ± 0.0350.6 ± 1.9483.5 ± 2.16166.2 ± 1.98
Kurukkan23.1 ± 0.4023.8 ± 0.4124.4 ± 0.290.24 ± 0.020.20 ± 0.010.17 ± 0.030.49 ± 0.020.44 ± 0.030.37 ± 0.0249.1 ± 2.1782.3 ± 1.80160.3 ± 2.23
Olour20.2 ± 0.6621.2 ± 0.3825.4 ± 0.260.26 ± 0.020.24 ± 0.020.17 ± 0.020.79 ± 0.030.69 ± 0.020.62 ± 0.0245.2 ± 2.3277.2 ± 2.14150.8 ± 2.25
Dashehari
K-521.5 ± 0.3122.9 ± 0.4023.6 ± 0.480.29 ± 0.020.22 ± 0.010.19 ± 0.010.53 ± 0.020.43 ± 0.020.38 ± 0.0353.2 ± 1.4689.3 ± 2.49170.7 ± 1.85
Kurukkan22.4 ± 0.4524.5 ± 0.3924.5 ± 0.420.24 ± 0.010.19 ± 0.020.17 ± 0.020.48 ± 0.020.41 ± 0.020.36 ± 0.0251.9 ± 1.4688.2 ± 2.36165.6 ± 1.95
Olour24.2 ± 0.3624.9 ± 0.4426.8 ± 0.380.24 ± 0.030.20 ± 0.010.17 ± 0.020.73 ± 0.030.63 ± 0.030.52 ± 0.0350.5 ± 1.6175.4 ± 2.12154.4 ± 2.19
Mallika
K-525.1 ± 0.4025.9 ± 0.2927.0 ± 0.400.25 ± 0.010.19 ± 0.020.14 ± 0.030.59 ± 0.030.50 ± 0.030.45 ± 0.0249.5 ± 2.7482.5 ± 2.12159.3 ± 2.52
Kurukkan25.8 ± 0.3826.3 ± 0.2827.4 ± 0.390.27 ± 0.020.22 ± 0.010.17 ± 0.010.51 ± 0.020.44 ± 0.020.39 ± 0.0347.2 ± 3.1180.9 ± 2.28156.1 ± 2.98
Olour27.3 ± 0.3428.0 ± 0.4030.0 ± 0.360.30 ± 0.030.27 ± 0.020.19 ± 0.020.72 ± 0.020.67 ± 0.020.61 ± 0.0246.3 ± 2.8069.7 ± 2.48142.2 ± 2.40
LSD (p ≤ 0.05)
Variety (V)0.350.320.300.010.010.010.020.020.022.002.052.30
Rootstock (R)0.270.250.23NS0.010.110.020.010.011.551.581.78
V × R0.620.560.520.020.020.030.040.030.313.473.553.99
Table 4. Major allele frequency (MAF), gene diversity, heterozygosity, and polymorphism information content (PIC) of the 24 SSR markers.
MarkerMAFAllele NoGene DiversityPIC
MSL-60.932.000.120.12
MSL-70.932.000.120.12
MSL-100.872.000.230.20
NMSLC-140.802.000.320.27
MSL-10.732.000.390.31
NMSLC-70.732.000.390.31
NMSLC-20.672.000.440.35
NMSLC-110.672.000.440.35
NMSLC-130.672.000.440.35
MSL-30.602.000.480.36
MSL-90.602.000.480.36
NMSLC-30.602.000.480.36
NMSLC-40.602.000.480.36
NMSLC-50.602.000.480.36
MSL-120.572.000.490.37
MSL-20.532.000.500.37
MSL-80.532.000.500.37
MSL-130.532.000.500.37
NMSLC-120.532.000.500.37
EXPM-70.532.000.500.37
NMSLC-90.502.000.500.38
EXPM-60.502.000.500.38
EXPM-40.473.000.560.46
NMSLC-100.433.000.610.52
Mean0.632.080.440.34
Table 5. Marker trait association in five mango varieties grafted on three polyembryonic rootstocks with generalized linear model (GLM) approach (p < 0.001).
TraitMarkerMarker_FMarker R2
Yield efficiencyNMSLC-1279.10.85
Fruit wt. (g)NMSLC-1429.90.70
NMSLC-415.60.56
TSS 0 dayNMSLC-418.30.59
NMSLC-148.990.42
TSS 3 dayNMSLC-415.90.56
TSS 6 dayNMSLC-1412.20.49
NMSLC-411.60.48
Pulp%NMSLC-511.40.48
MSL-710.90.47
NMSLC-149.760.44
NMSLC-28.420.40
Peel thickness 0 dayNMSLC-48.540.40
Peel thickness 3 dayNMSLC-410.50.46
Peel thickness 6 dayNMSLC-411.10.48
Acidity 0 dayMSL-99.800.44
Acidity 6 dayMSL-1010.50.43
Yield (kg/tree)NMSLC-410.70.45
No. of fruit/plantNMSLC-410.20.45
Disclaimer/Publisher’s Note: The statements, opinions and data contained in all publications are solely those of the individual author(s) and contributor(s) and not of MDPI and/or the editor(s). MDPI and/or the editor(s) disclaim responsibility for any injury to people or property resulting from any ideas, methods, instructions or products referred to in the content.

