Article

Agro-Physiological Indices and Multidimensional Analyses for Detecting Heat Tolerance in Wheat Genotypes

1
Department of Plant Production, College of Food and Agriculture Sciences, King Saud University, Riyadh 11451, Saudi Arabia
2
Agronomy Department, Faculty of Agriculture, Al-Azhar University, Cairo 11651, Egypt
3
Queensland Alliance for Agriculture and Food Innovation, The University of Queensland, St Lucia, QLD 4072, Australia
*
Author to whom correspondence should be addressed.
Agronomy 2023, 13(1), 154; https://doi.org/10.3390/agronomy13010154
Submission received: 19 November 2022 / Revised: 28 December 2022 / Accepted: 28 December 2022 / Published: 3 January 2023
(This article belongs to the Special Issue Crop Productivity and Energy Balance in Large-Scale Fields)

Abstract

:
Increasing atmospheric temperature can significantly reduce global wheat productivity; despite a mounting demand for wheat grain supplies. Developing genotypes with superior performance under current and future hot climates is a key challenge for wheat breeders. Multidimensional tools have supported plant breeders in increasing the genetic stability rate of agro-physiological indices that influence wheat productivity. We used 25 agro-physiological indices to classify 20 bread wheat genotypes for their heat stress tolerance. Agro-physiological indices and multidimensional analyses to identify differences in genetic and phenotypic were used, combining these analyses to reach selection criteria of accurate and credible. The 25 studied indices reflected high genotypic and environmental variations. We used 16 indices, which have brought together high heritability and genetic gain as indicators for screening heat-tolerant genotypes. Based on the seven principal comprehensive indices of (D value), wheat genotypes were classified into three highly heat-tolerant, four heat-tolerant, six moderately heat-tolerant, five heat-sensitive, and two highly heat-sensitive wheat genotypes. Based on four critical indices [grain yield (GY), grain-filling duration (GFD), spike length (SL) and canopy temperature (CT)] obtained from stepwise multiple linear regression (SMLR), the genotypes were grouped as four genotypes highly heat-tolerant, six heat-tolerant, two moderately heat-tolerant, four heat-sensitive and four highly heat-sensitive. The classification D value and SMLR distances were significantly correlated based on the Mantel test, with a perfect match in nine genotypes. SMLR indicated that a mathematical equation for the evaluation of wheat heat tolerance was established: GY = 0.670 + 0.504 × GFD + 0.334 × SL − 0.466 × CT (R2 = 0.739; average prediction accuracy of 94.12%). SMLR-based classification of wheat genotypes for heat tolerance was further verified through discriminant analysis, which showed that prior and posterior classification was identical in eighteen genotypes. Cross-validation showed that prior and posterior classification was identical in thirteen genotypes. Based on this study, we can recommend tolerated new wheat lines (DHL25, DHL05, DHL23 and DHL08) and cultivar Pavone-76 as a promising genetic source for heat-tolerant breeding programs.

1. Introduction

Agriculture is the fundamental economic sector in the Arab region, providing employment, food security, and income for residents of rural areas. The last few decades have witnessed a cascading impact of climate change, resulting in a rapid shift in natural ecosystems, agricultural productivity, and cultivation practices. Generally, the wheat crop is adapted to a broad range of global climatic conditions. However, wheat cropping systems have started a marginal decline in grain yield, primarily because of groundwater depletion, land degradation, and heat stress. In contrast, wheat demand has gradually increased, i.e., a 2% increase in annual wheat production is needed to feed the growing world population [1]. It is projected that wheat grain yield must be increased by 60% compared to today to meet the supplies by 2050 [2]. A significant rise in the atmospheric temperature is one of the most significant challenges for wheat producers around the globe as it seriously affects grain yield and quality [2,3,4,5,6].
Wheat crops have a temperature requirement of 12–22 °C for most developmental stages, notably during flowering and grain filling [7]. Heat stress constitutes one of the main threats to sustainable wheat production. It is even more detrimental than drought as it seriously impairs metabolic processes in all plant organs during most of the developmental stages of the crop [8]. Late-cultivated wheat crops suffer from high canopy temperatures (>31 °C) from anthesis to maturity, which negatively affects grain yield formation [1,9]. In wheat, a 3–4 °C rise in the seasonal minimum or maximum temperatures could decrease yield by 15–35% in Africa and Asia and by 25–35% in the Middle East across the flowering, pollination, and grain-filling periods [1,10,11]. Asseng, et al. [12] and Djanaguiraman et al. [8] have projected a 6% reduction in global wheat yield for each 1 °C increase in the average current temperature. This impact will become more variable or extreme through times and places. When such stress occurs during sensitive growth stages, such as flowering or grain filling, yields are likely to be much reduced, especially with short episodes of very high temperatures [4]. Heat stress significantly reduces leaf photosynthesis, arresting overall plant growth and yield [13] by limiting carbohydrate formation and supplies. A temperature above the optimal range damages the leaf thylakoid membrane, reduces photosynthetic electron transfer, and arrests photochemical reactions [8,13,14,15].
High temperature during anthesis reduces grain number per spike by restricting embryo development and inducing pollen sterility [1,16]. Post-anthesis (i.e., during the grain-filling period) heat reduces grain-filling rate and duration by accelerating leaf senescence [7,16,17]. Researchers often exploit multiple physiological mechanisms for improving wheat performance in hot climates. Physiological traits such as early maturity, minimization of canopy temperature, stay green, and high stem water-soluble carbohydrates accumulation, coupled with high biomass accumulation, are likely to contribute to final grain yield [1,7,9,17,18,19]. Early maturity is considered one of the main physiological responses of wheat genotypes to high temperatures. This accelerates different physiological mechanisms to contribute to grain yield production, although there was a negative correlation between them [1]. Stay green trait is the principal source of chlorophyll contents in the leaf and is considered important with a direct impact on grain yield and its components, but the green area decreases under heat stress [17,20]. Likely, the plant may compensate for the negative impact of heat-induced green area loss on final grain size by remobilizing the stem water-soluble carbohydrates stockpiled [7,21]. Some wheat genotypes have the capacity to cool the canopy during grain filling, which can access underground moisture, thereby promoting evaporation and photosynthesis conservation under hot conditions [22]. Low canopy temperature positively correlates with sustained grain yield formation under hot environments in wheat genotypes [7,23,24].
Accordingly, these physiological traits could be used as an indirect selection tool for the genetic improvement of wheat genotypes; and they are less affected by the environment and have more genetic stability compared with grain yield traits [1,22,25]. Further exploration of physiological traits is needed for detecting wheat genotypes that produce high yields and adapt to high temperatures using these traits as selection criteria. This could only be achieved by developing high-yielding, early maturing genotypes that have protracted grain-filling duration, climate-smart, and abiotic stress tolerance [7,18]. Given the global climate changes, these efforts should be promoted to counter the negative impacts of high temperatures [26,27]. Efforts have been made to evaluate and test elite wheat genotypes for their adaptability to heat and traits-linked, combined into typical varieties for both high-yielding and heat tolerance [2,9,18]. Evaluation of the genetic parameters for agro-physiological response is important to determine the best genotypes used in breeding programs to tolerate abiotic stress [1].
The application of multivariate analysis techniques and multidimensional methods to achieve accuracy in verification and selection supports breeding programs and their success by incorporating agro-physiological traits. This may provide a better understanding, and an integrative approach that combines various parameters of heat adaptive traits and their integration into breeding programs may help show desirable genotypes [6,28,29,30]. The use of a combination of analyses is needed for reliably studying phenotypic traits generated through high computing-powered modeling of multidimensional data and to provide a more comprehensive understanding of the complicated mechanisms under heat stress [28,31,32]. Therefore, multivariate analysis techniques [principal component analysis (PCA), multiple regression, path analysis, cluster analysis, multivariate analysis of variance (MANOVA), and discriminant analysis] can serve as a model instrument for screening tests and for separating sources of variation [29,33,34].
For instance, PCA reduces the number of variables of a data set and uses an orthogonal transformation to convert a set of observations of possibly correlated variables into a set of values of uncorrelated variables while preserving as much information as possible. Multiple regression is used to determine the model’s overall fit (variance explained) and the relative contribution of each variable to the total variance explained. Path analysis is a straightforward extension of multiple regression [1]. It aims to provide estimates of the magnitude and significance of hypothesized causal connections between sets of variables and divide them into direct and indirect impacts. Cluster analysis is a method for collecting similar genotypes into several clusters based on the values of several variables used. Discriminant analysis and MANOVA are used to assess the extent of matching a classification by prior knowledge of the membership of the genotype within each group and to predict the classification position of new cases that have not been classified [29,35]. The main aims of this study were (i) to develop a screening method to identify the contribution of the key heat tolerance indices of wheat using multidimensional evaluation (ii) to evaluate and cluster the heat tolerance of 20 wheat genotypes (iii) to verify the validity of classification and predicting of new cases that have not been classified. The results presented here would be significant for further screening and evaluation of heat tolerance wheat and for improving wheat breeding that can be utilized to breed heat-tolerant varieties.

2. Materials and Methods

2.1. Experimental Design and Plant Materials

Field trials were conducted at the King Saud University Agricultural Research Station (24°42′ N, 44°46′ E, 400 m asl) for two successive years (2018/2019 and 2019/2020). The experimental design was a randomized complete block with three independent replicates. Two successive experiments were performed each year, i.e., the optimum sowing (15 and 20 November in 2018 and 2019, respectively) and late sowing (15 and 20 December in 2018 and 19, respectively). The late-sown crops experienced an average temperature of 30.4–31.0/14.2–14.4 °C day/night during grain-filling duration in the two seasons. The experimental unit (plot) consisted of five rows (3.0 m long) each, with the distance between rows of 0.17 m, at a seedling rate of 360 germinating kernels m−2, and the fertilizing rates used were180 kg ha−1 of N and 31 kg ha−1 of P2O5. The electrical conductivity of soil texture (2.89 dS m−1). The temperatures during the growing season are presented in Table S1. Twenty different wheat genotypes (6 varieties and 14 lines) were used in this study. The six varieties were chosen based on the presence of broad genetic variations between them concerning tolerance and/or sensitivity to heat, which were supplied by the Agricultural Research Center, Egypt (Table S2). The Department of Agronomy supplied the 14 doubled haploid lines (DHLs), Faculty of Agriculture, Al-Azhar University, Cairo, Egypt, and previously published [36] and been used to assess heat tolerance (Table S2).

2.2. Measurements of Traits and Data Collection

All 20 wheat genotypes were assessed using 25 physio-morphological and agronomic attributes. The mean value of five samples and/or plants per genotype for measuring all physio-morphological and some agronomic attributes were randomly selected from middle rows to reduce environmental impact and repeated three times. Twelve physiological crop attributes were estimated at the grain-filling stage. These include canopy temperature (CT), leaf water content (LWC), relative water content (RWC), photosynthesis rate (Pn), transpiration rate (E), stomatal conductance (Gs), intracellular CO2 concentration (Ci), stomatal limitation value (Ls), peroxidase (POD), polyphenol oxidase (PPO), and catalase (CAT). Briefly, CT was measured using an infrared thermometer (Therma CAM SC 3000 infrared camera, FLIR System, USA). LWC and RWC were obtained by fresh weight (FW), turgid weight (TW), and dry weight (DW) after oven drying at 48 h at 70 °C [37,38] deceptively. Pn, E, Gs, and Ci were measured on the upper third of flag leaves by a Li-6400 gas exchange system (Li-Cor, Inc., Lincoln, NE, USA) from 10:00 AM until 12 noon.
The stomatal limitation value (Ls) was calculated from the following equation [39]; Ls = (1 − Ci)/ atmospheric CO2 concentration
Antioxidant enzymes such as CAT, POD, and PPO were assessed from 0.5 g of fresh leaf samples. The leaves were ground in liquid nitrogen and placed in an ice bath with 50 mM potassium phosphate buffer (pH 7.8), including 1% (w/v) polyvinylpolypyrrolidone, and then centrifuged at 14,000× g rpm for 10 min at 4 °C for enzyme extractions. The supernatant is used as an extract of assays for CAT, POD and PPO, as described by Aebi [40], Chance and Maehly [41], and Duckworth and Coleman [42], respectively.
Four morphological attributes, i.e., green leaf number (GLN), flag leaf area (FLA), green leaf area (GLA), and leaf area index (LAI), were estimated after the anthesis. FLA and GLA were estimated using a leaf area meter (LI 3100; LI-COR Inc., Lincoln, NE, USA) after separating all the green leaves from the stem. LAI was calculated by the following formula: LAI = green leaf area / ground cover.
Ten agronomic attributes were estimated before and/or after harvest, namely the days to heading (DH, days), days to maturity (DM, days), grain-filling duration (GFD, days), plant height (PH, cm plant−1), spike length (SL, after excluding awns), number of spikes (NS, m−2), number of spikelets (NSS, spike−1), number of kernels (NKS, spike−1), thousand kernel weight (HKW, g) and grain yield (GY, ton ha−1). DH was recorded upon reaching the 50% of plants to flowered, and DH was recorded upon reaching the 50% of plants to peduncles yellow. GFD was calculated from the period between DM and DH. After harvesting, the plants were threshed to measure NKS, HKW and GY traits. GY was estimated from three rows to two-meters long.

2.3. Statistical Analysis of Evaluated Data

Based on the foregoing attributes data, the heat tolerance indices (HTI) of each of the above attributes were calculated.
HTI i j =   x i j - under   heat   stress   condition x i j - under   optimum   condition
where HTIij is the heat tolerance index (j) for genotype (i); xij-under heat stress condition and xij-under optimum condition represent values of the index for the genotype evaluated under optimum condition and heat treatments, respectively.
Analysis of variance for 26 indices was implemented using SAS v9.2 software (SAS Institute, Inc., Cary, NC, USA) for each season. The combined analysis was implemented for the two-season using Bartlett’s test to test the homogeneity of error variance between seasons. Afterwards, the variance of the combined data of all indices was used for calculating variance components and genetic parameters such as heritability (h2, broad sense), genetic gain (%), genotypic coefficient of variability (GCV), and phenotypic coefficient of variability (PCV), following t Fehr [43] and described by Al-Ashkar et al. [29]. Multidimensional modeling was used to understand genotype × environment interactions and their contributions of the key indices to genotypic performance. The principal component analysis (PCA) was performed based on data provided components (eigenvalue > 1) with the normalization values of heat tolerance indices used in calculating comprehensive indices values. It was also used for calculating the membership function value of heat tolerance. It was assessed using multiple indices as the subordinate function value (μ) and provides a comprehensive assessment using subordinate functions based on the theory of fuzzy mathematics [44]. The subordinate function μ was calculated using Equation (2).
μ = x i x m i n x m a x x m i n
where x i indicates the ith comprehensive index; x m a x and x m i n indicate the maximum and minimum value for the ith comprehensive index of all the genotypes, respectively.
In Equation (3), the weight function Wi was calculated and represents the relative importance of the ith comprehensive index for a genotype; P i represents the contribution of the ith comprehensive index.
W i = P i i = 1 n P i   , i = 1 ,   2   ,   3 . n
In Equation (4), the comprehensive index value for heat tolerance (D value) was calculated separately for each genotype to detect their heat tolerance, which was used for making clusters and evaluating heat tolerance.
D = i = 1 n [ μ   ( x i ) W i ] i = 1 ,   2   ,   3 . n
Stepwise multiple linear regression (SMLRA) and path analyses were used to identify the main indices and their contribution, respectively, to confirm the accuracy and reliability of clusters. The effective indices used in the calculation of cluster analysis (CA), building upon the genetic dissimilarity matrix between genotypes (Euclidean distance and Ward’s method of agglomeration) in five major groups to tolerance. The discriminant function analysis (DFA) was used to reaffirm the classification of each genotype by analyzing main indices (as quantitative variables) with the five major groups (as qualitative variables). Statistical analysis (PCA, SMLRA, path analysis, CA, DFA, and multicollinearity test) carried out by XLSTAT statistical package software (vers. 2019.1, Excel Add-ins soft SARL, New York, NY, USA).

3. Results

3.1. Phenotypic Analysis of Heat Tolerance Index

3.1.1. Analysis of Variance and Genetic Parameters of the Studied Indices

Analysis of heat tolerance index data (Table 1) revealed highly significant (p < 0.01) genotypic variations for all studied indices across the two seasons as sources of variance differed across the genotypes under optimal and heat-stressed environments for all measured traits. Across the combined data of two seasons, the interaction was significant for nineteen indices out of twenty-five; and non-significant for seven indices (DH, MD, GFD, POD, PPO, CAT, and GY). Test of the homogeneity of error variance of heat tolerance index between two seasons showed non-significant for twenty-two indices, but error variance was heterogeneity for LAI, Gs, and GY. The broad-sense heritability (h2) showed high values (>60%) for seventeen measured indices, which varied from 60.43% to 89.51% (Table 1). The genetic gain (GG) showed high values (>20%) for nine measured indices, which varied from 20.05% (GFD) to 54.25% (Ls); and moderate values (>10%) for twelve measured indices, which varied from 10.15% (DH) to 17.22% (Ci). The PCV and GCV were convergent for most indices, and the PCV was larger relative to the GCV, except for three indices (GLN, NSS, and NKS), which showed PCV values greater than GCV values twice.

3.1.2. Heat Tolerance Index of Measured Parameters

The heat tolerance index showed highly significant variations between genotypes as sources of variance due to changes between optimal and heat treatment for all measured indices. Interestingly, in S1, S2, and across the combined data of two seasons, there was a significant variation between large and small values for the majority of measured indices, and with certain exceptions for some indices (DH, MD, HW, and CT), which showed limited variation between large and small value. The large values were twice or more than the small ones for the seven measured indices (LAI, Gs, E, POD, PPO, CAT, and GY), a reference to the efficiency of these indices in the show genetic diversity between genotypes used (Table 2). However, five indices (CT, Pn, POD, PPO, and CAT) in some genotypes were higher (HTI > 1). Different indices within the same genotype and the same index within different genotypes showed considerable variability in the heat-tolerant index. Thus, it is difficult to make an accurate and reliable assessment of the heat tolerance of each genotype using the HTI of a single index. The values for coefficients of experimental variation (CVe) were small, ranging from 3.94% to 5.43.

3.2. Multidimensional Analyses in the Classification of Heat-Tolerant Genotypes

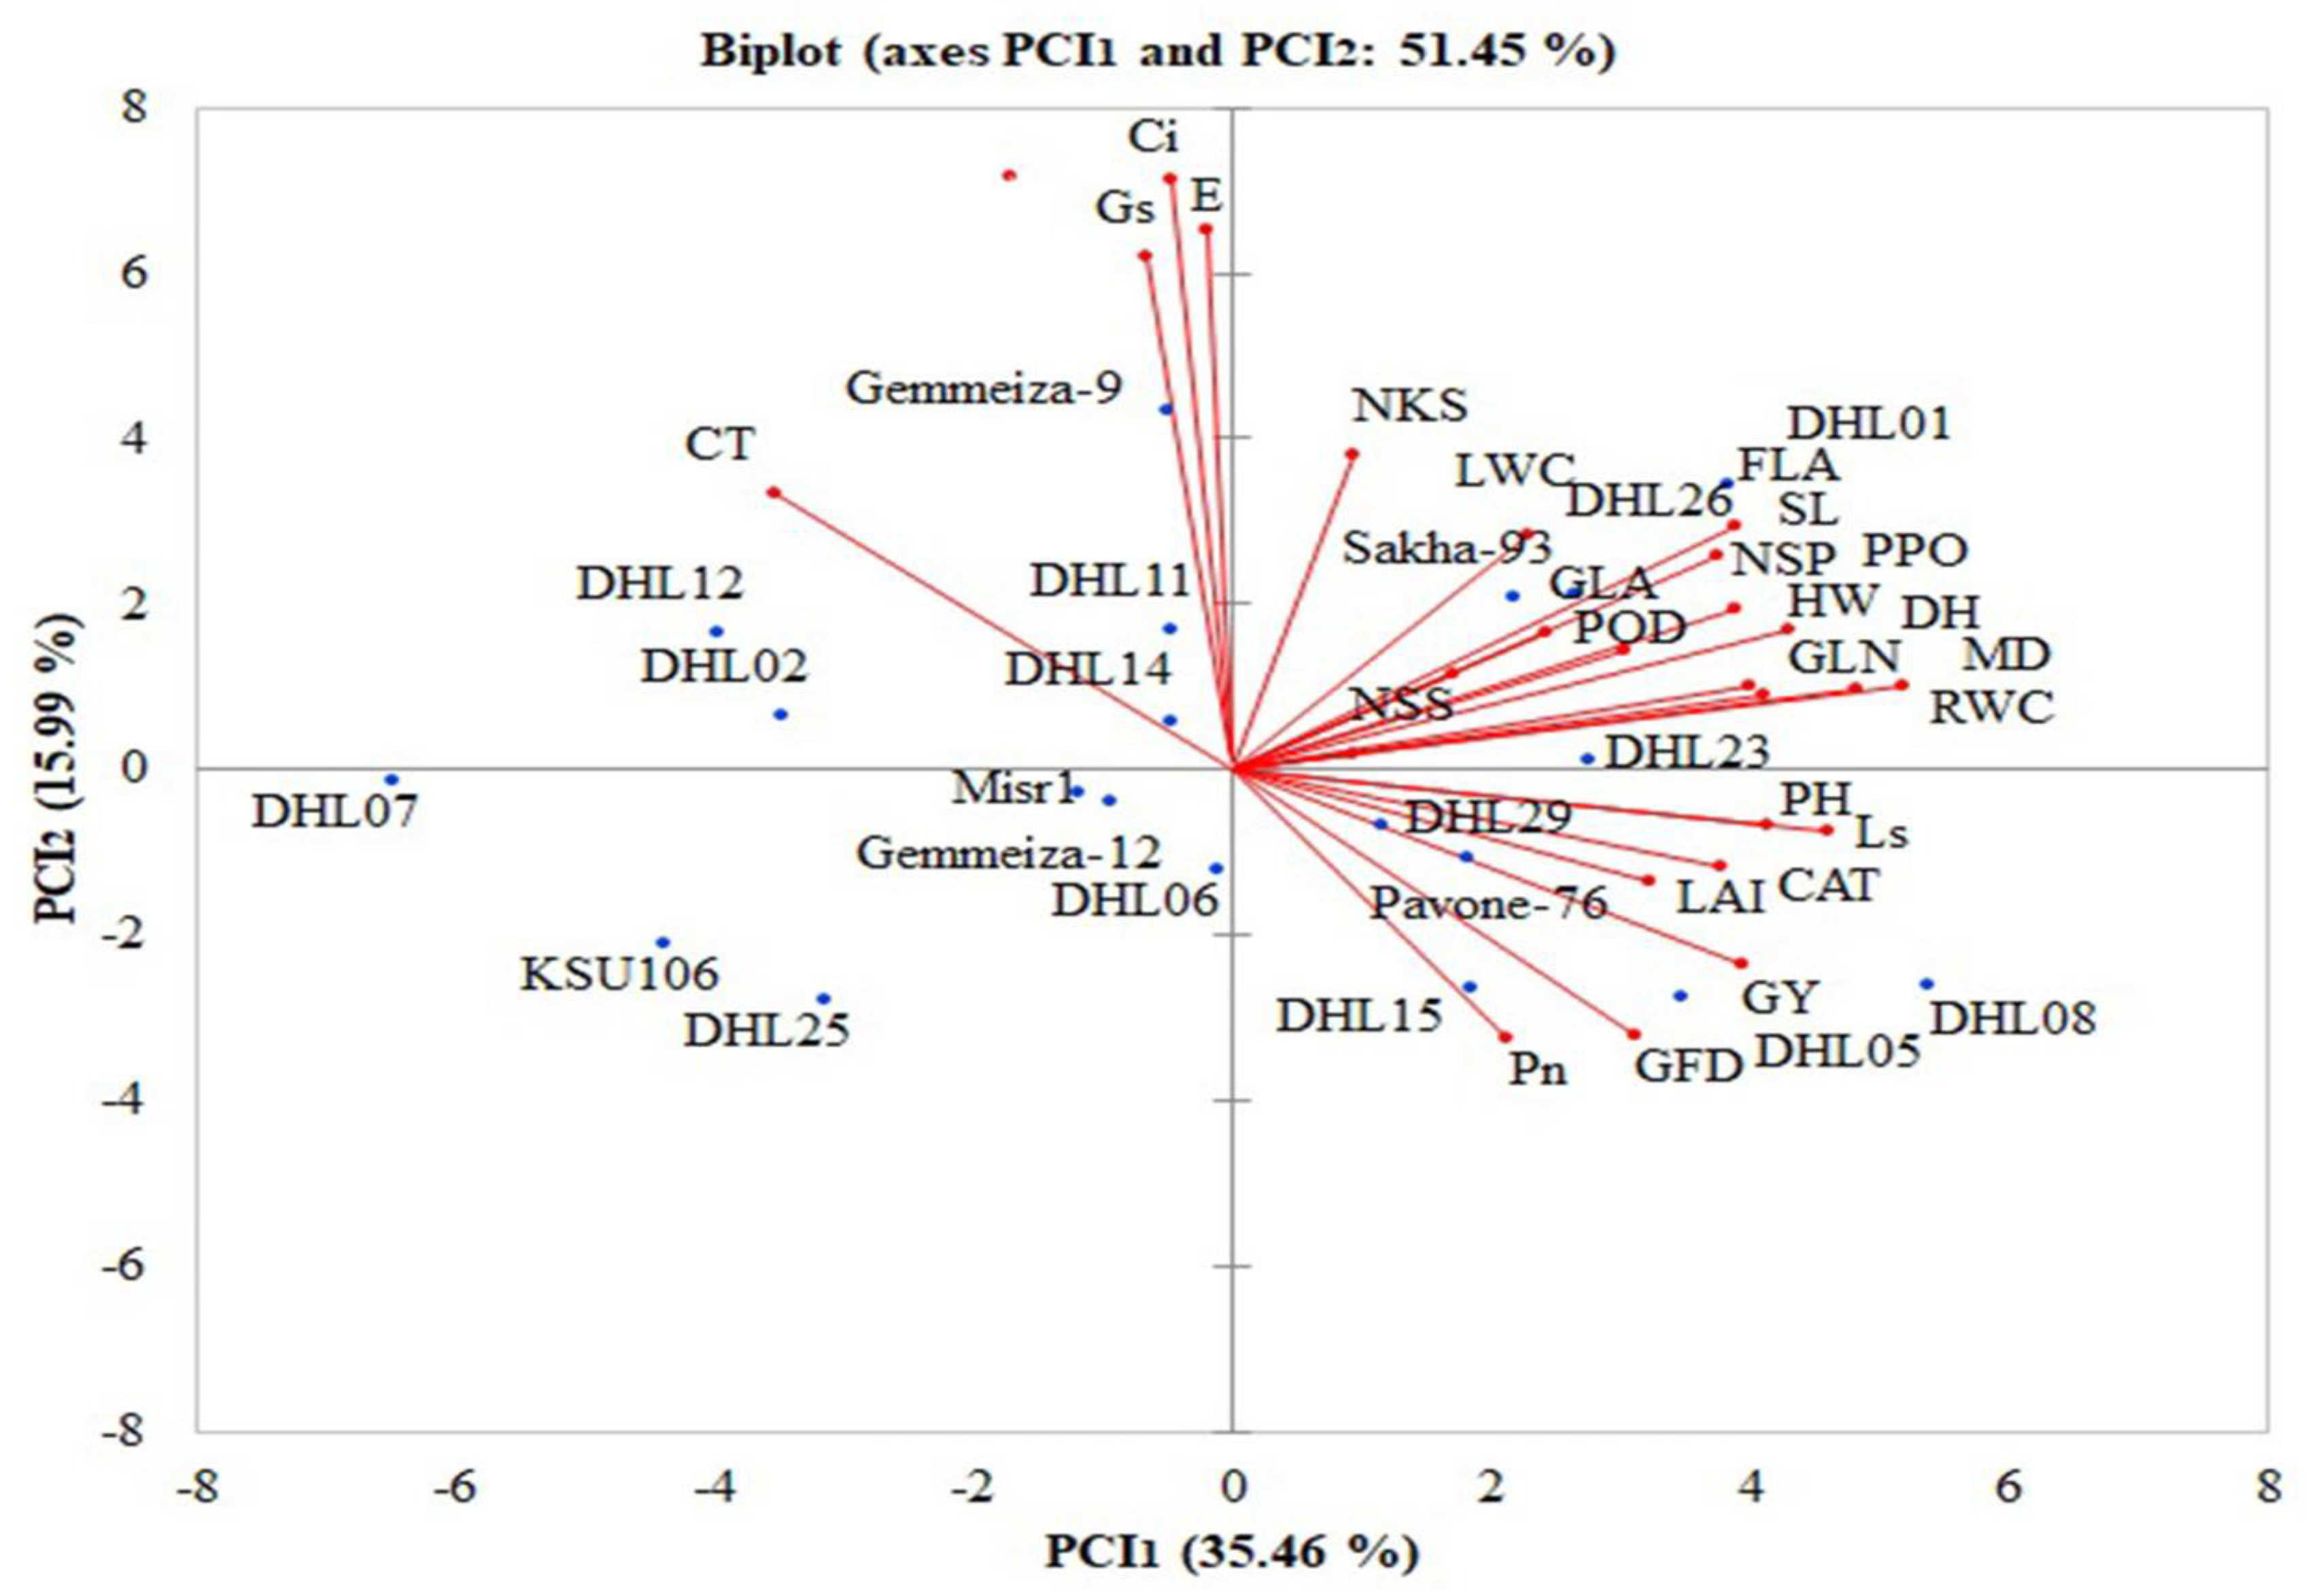
3.2.1. Principal Component Analysis

Kaiser–Meyer–Olkin measure of sampling adequacy showed a high value (KMO > 0.5). Based on the absolute value of each eigenvector, the PCA grouped the estimated variables (25 indices) into seven principal comprehensive indices (eigenvalue > 1), which had contribution rates of 35.47% (PCI1), 15.99% (PCI2), 10.88% (PCI3), 7.89% (PCI4), 5.20% (PCI5), 4.38% (PCI6), and 4.28% (PCI7). The cumulative contribution rate reached 84.09% (Table 3). PCI1 was related to DH, MD, GFD, NS, PH, GLN, LAF, LAI, SL, RWC, HW CT, Ls, PPO, CAT, and GY. PCI2 was related to Gs, Ci, and E. PCI3 was related to NSS and Pn; PCI4 was related to LWC and NKS; PCI5 and PCI6 were related to GLA and POD, respectively (Table 2). Figure 1 shows the correlations between variables (RWC and Ci) with factors (PCA1 and PCA2) were the highest value for squared cosines (0.885 and 0.759), respectively. So, the vectors were for RWC and Ci longer and acute with factors. As shown in Table 3, the seven principal comprehensive indices (PCI) were calculated for each genotype.
According to Equation (2), the subordinate function μ values were computed for comprehensive scores of each genotype. These values explain the heat tolerance of each genotype. Genotypic heat tolerance can be assessed based on the subordinate function μ value within the same comprehensive index. If the μ(xi) is 1.000, then the genotype has the highest heat tolerance; if the μ(xi) is 0.000, the genotype has the highest heat sensitivity. For PCI1, genotype DHL08 had the highest μ(x1) of 1.000, which showed that it had the highest heat tolerance (Table 4). The DHL01 had the smallest μ(x1) of 0.000, which showed that it had the highest heat sensitivity. However, in PCI2, genotype DHL02 had the highest μ(x1) of 1.000, and KSU106 had the smallest μ(x1) of 0.000. The evaluation result under each comprehensive index was aligned with our phenotypic results but differed from one PCI to another.
To maximize the effectiveness of comprehensive evaluation for the heat tolerance of used wheat genotypes was needed, the weight factor was computed for seven comprehensive indexes (W1: 0.422, W2: 0.190, W3: 0.129, W4: 0.094, W5: 0.062, W6: 0.052 and W7: 0.051) (Table 3) according to Equation (3) to maximize the effectiveness of the heat tolerance evaluation technique. A comprehensive evaluation value D was computed for heat tolerance (Table 4) according to Equation (4). The D value for twenty genotypes varied from 0.686 (HT) to 0.176 (HS). The cluster analysis from D values was then used to classify genotypes into five main clusters (Figure 2).
Cluster I was classified as highly tolerant (HT, with the highest value of D ≥ 0.638), consisting of three genotypes (DHL02, DHL23, DHL08); cluster II was classified as tolerant (T, with values of 0.638 > D ≥ 0.503), consisting of four genotypes (DHL12, DHL29, DHL05, and Pavone-76), Cluster III was classified as moderately tolerant (I, with values of 0.503 > D ≥ 0.458), consisting of six genotypes (DHL25, DHL07, Gemmeiza-9, DHL15, Misr1, and Sakha-93), Cluster IV was classified as sensitive (S, with values of 0.458 > D ≥ 0.293), consisting of five genotypes (DHL11, KSU106, Gemmeiza-12, DHL14, and DHL06). The genotypes DHL26 and DHL01 had lower D values (D < 0.293) and were placed into Cluster VI and designated as a highly sensitive (HS) group (Figure 2).

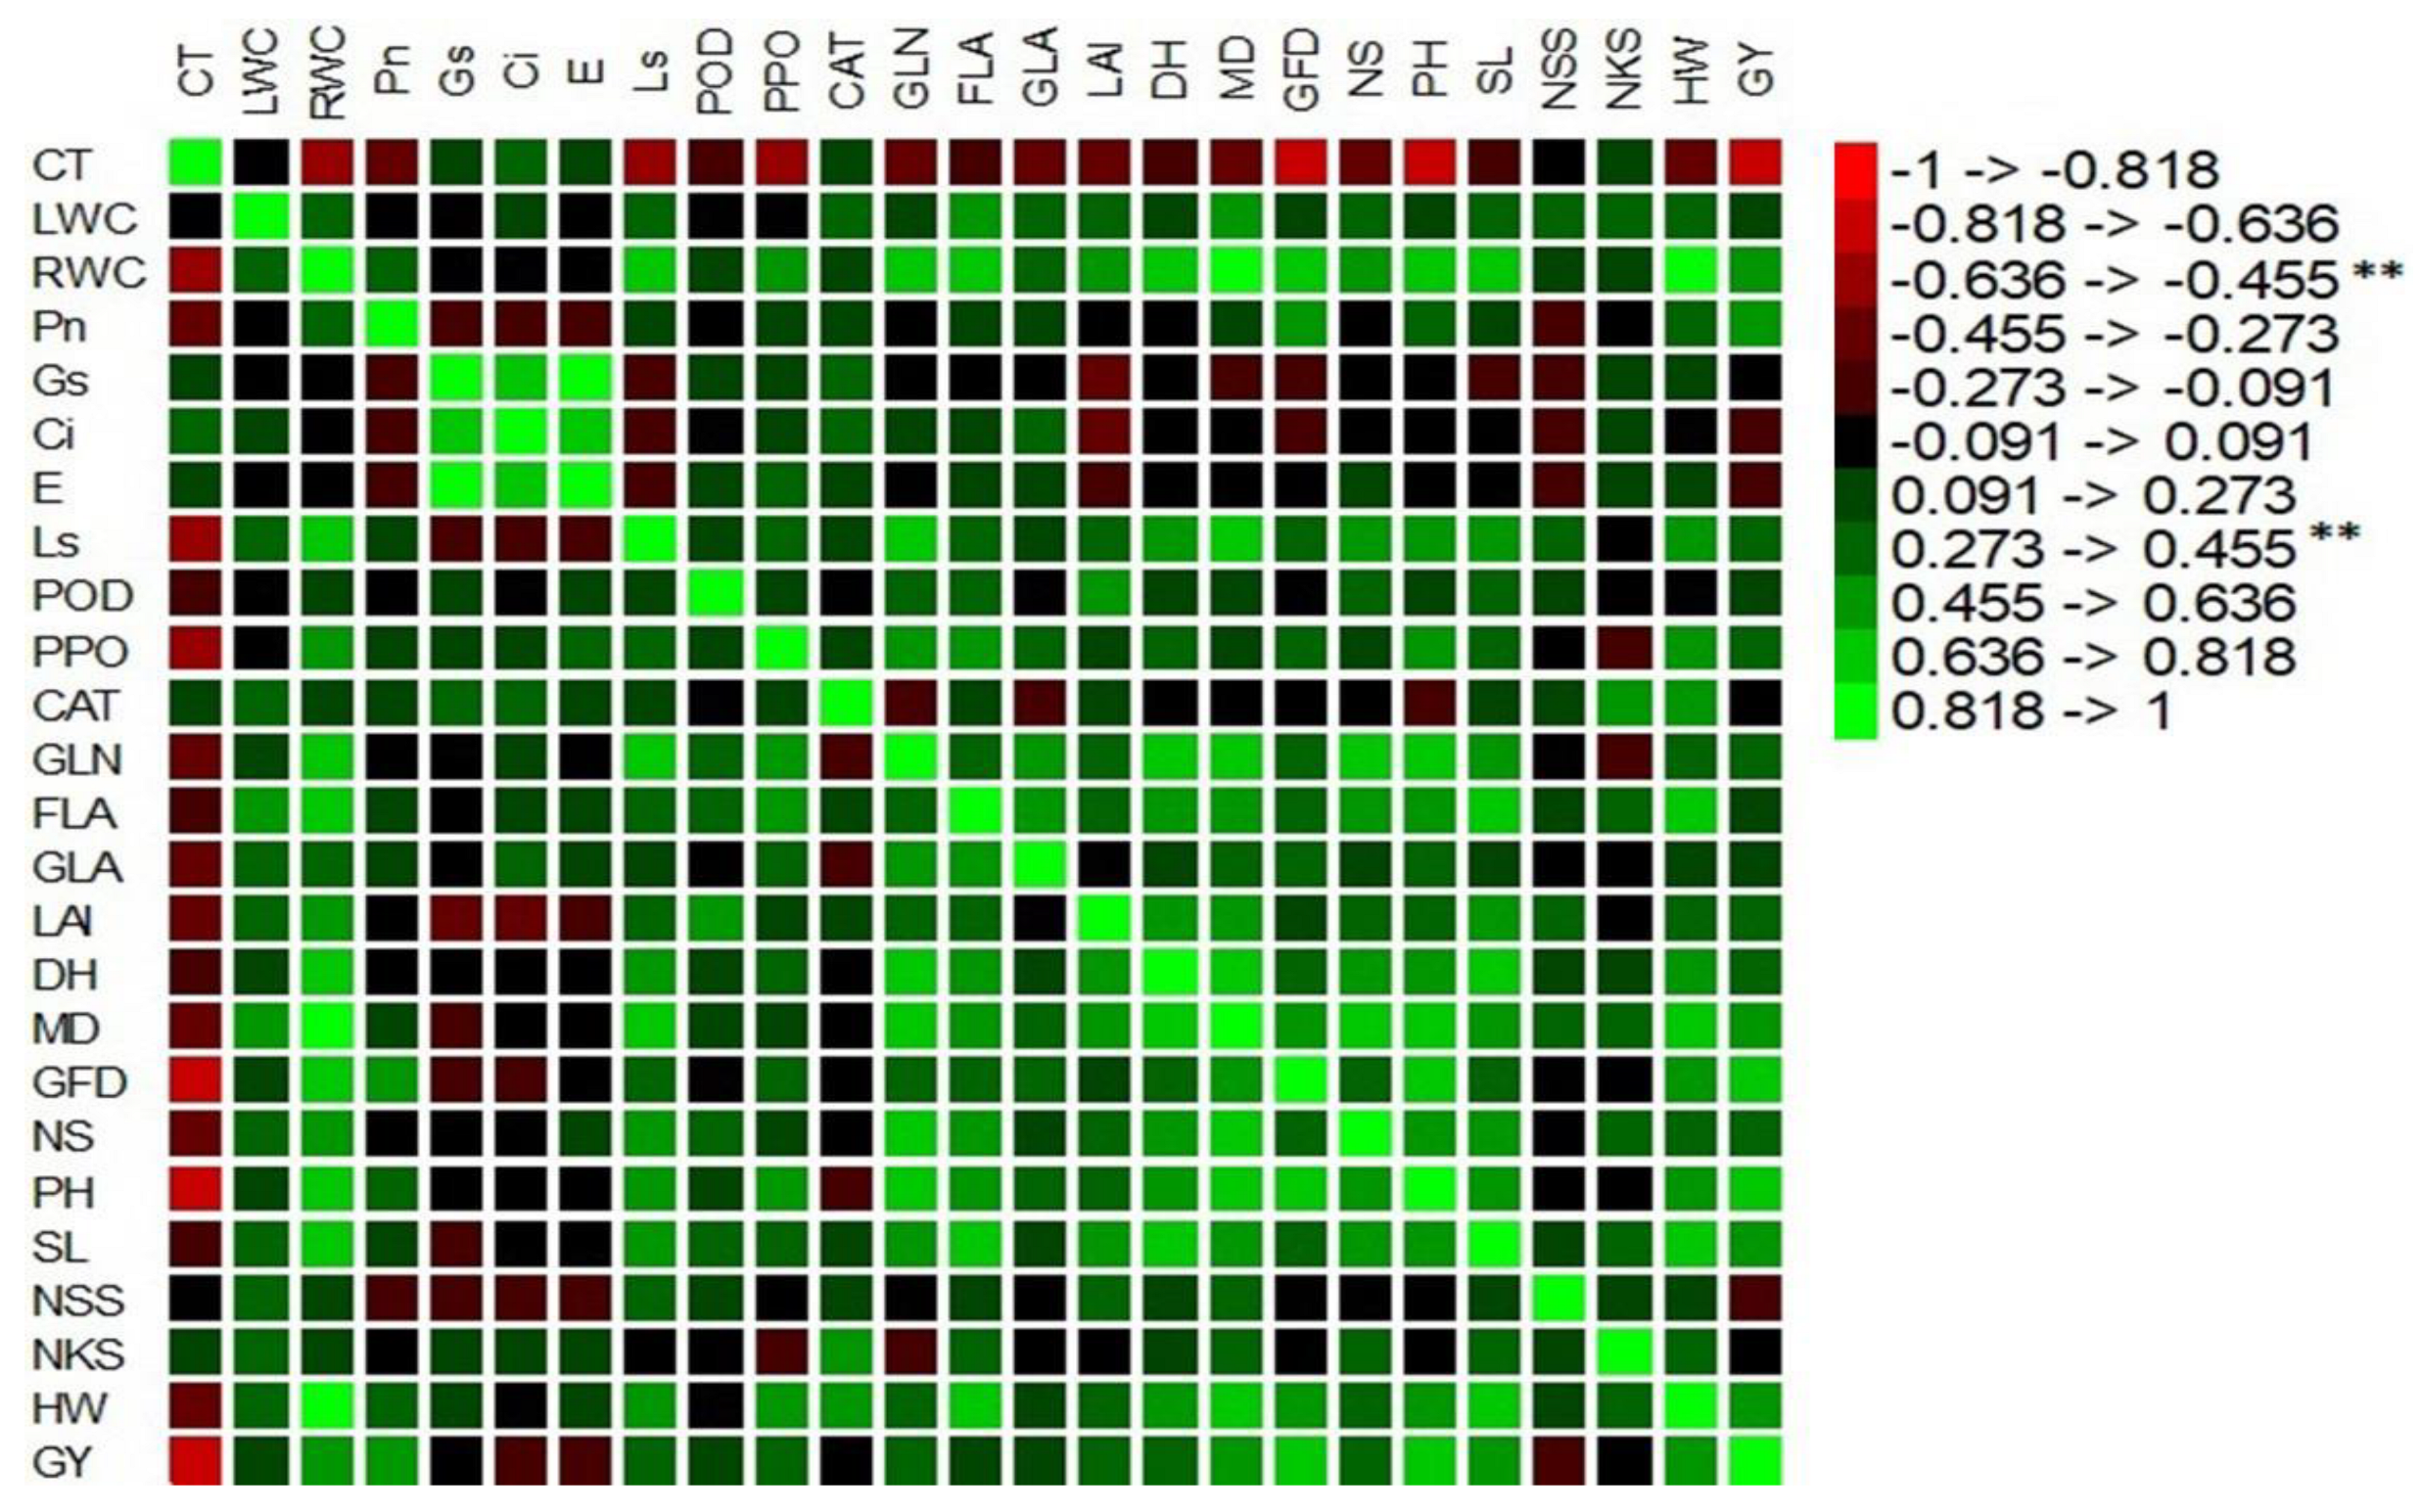
3.2.2. Identification of Indices Related to Yield Tolerance Index

We investigated the relationship between the heat tolerance indices (HTIs) of each index with the GY index. Seven HTIs (MD, GFD, PH, RWC, SL, HW, and Pn) showed a significant positive correlation, but the CT index was a significant negative correlation (Figure 3). The relationships between all indices were analyzed using SMLR in each genotype, as independent indices, in order to understand the best-measured and heat tolerance-related indices and their contribution to GY index performance as a dependent index (Table 5). The results of SMLR showed that indices GFD, SL, and CT only from the eight were directly relevant to the GY index (R2 of the SMLR model was 0.739, p < 0.0001), and their contribution rates were 0.529, 0.074, and 0.136, respectively (Table 5). The three indices of the GY index variation are partitioned into direct effects of each index and multiple indirect effects with the other indices using path coefficient analysis.
This contribution had a direct influence value of 478 (GFD, alone possessed 0.211 of them) and an indirect influence value of 0.261. The R2 value was (0.739), which is the same as the SMLR model, with a noise value of 0.511, suggesting that these three indices could be used as important selection criteria to determine the extent of the tolerance of wheat genotypes for heat. According to Equation of the model (GY, Table 5), GY = 0.670 + 0.504 × GFD + 0.334 × SL − 0.466 × CT, the predicted regression GY value, error value, and relative error value ranged from 0.663 to 0.972, from −0.142 to 0.081, from −0.261 to 0.105, respectively. Evaluation accuracy (%) ranged from 73.917 to 98.570, with an average value of 94.12 (Table 6).

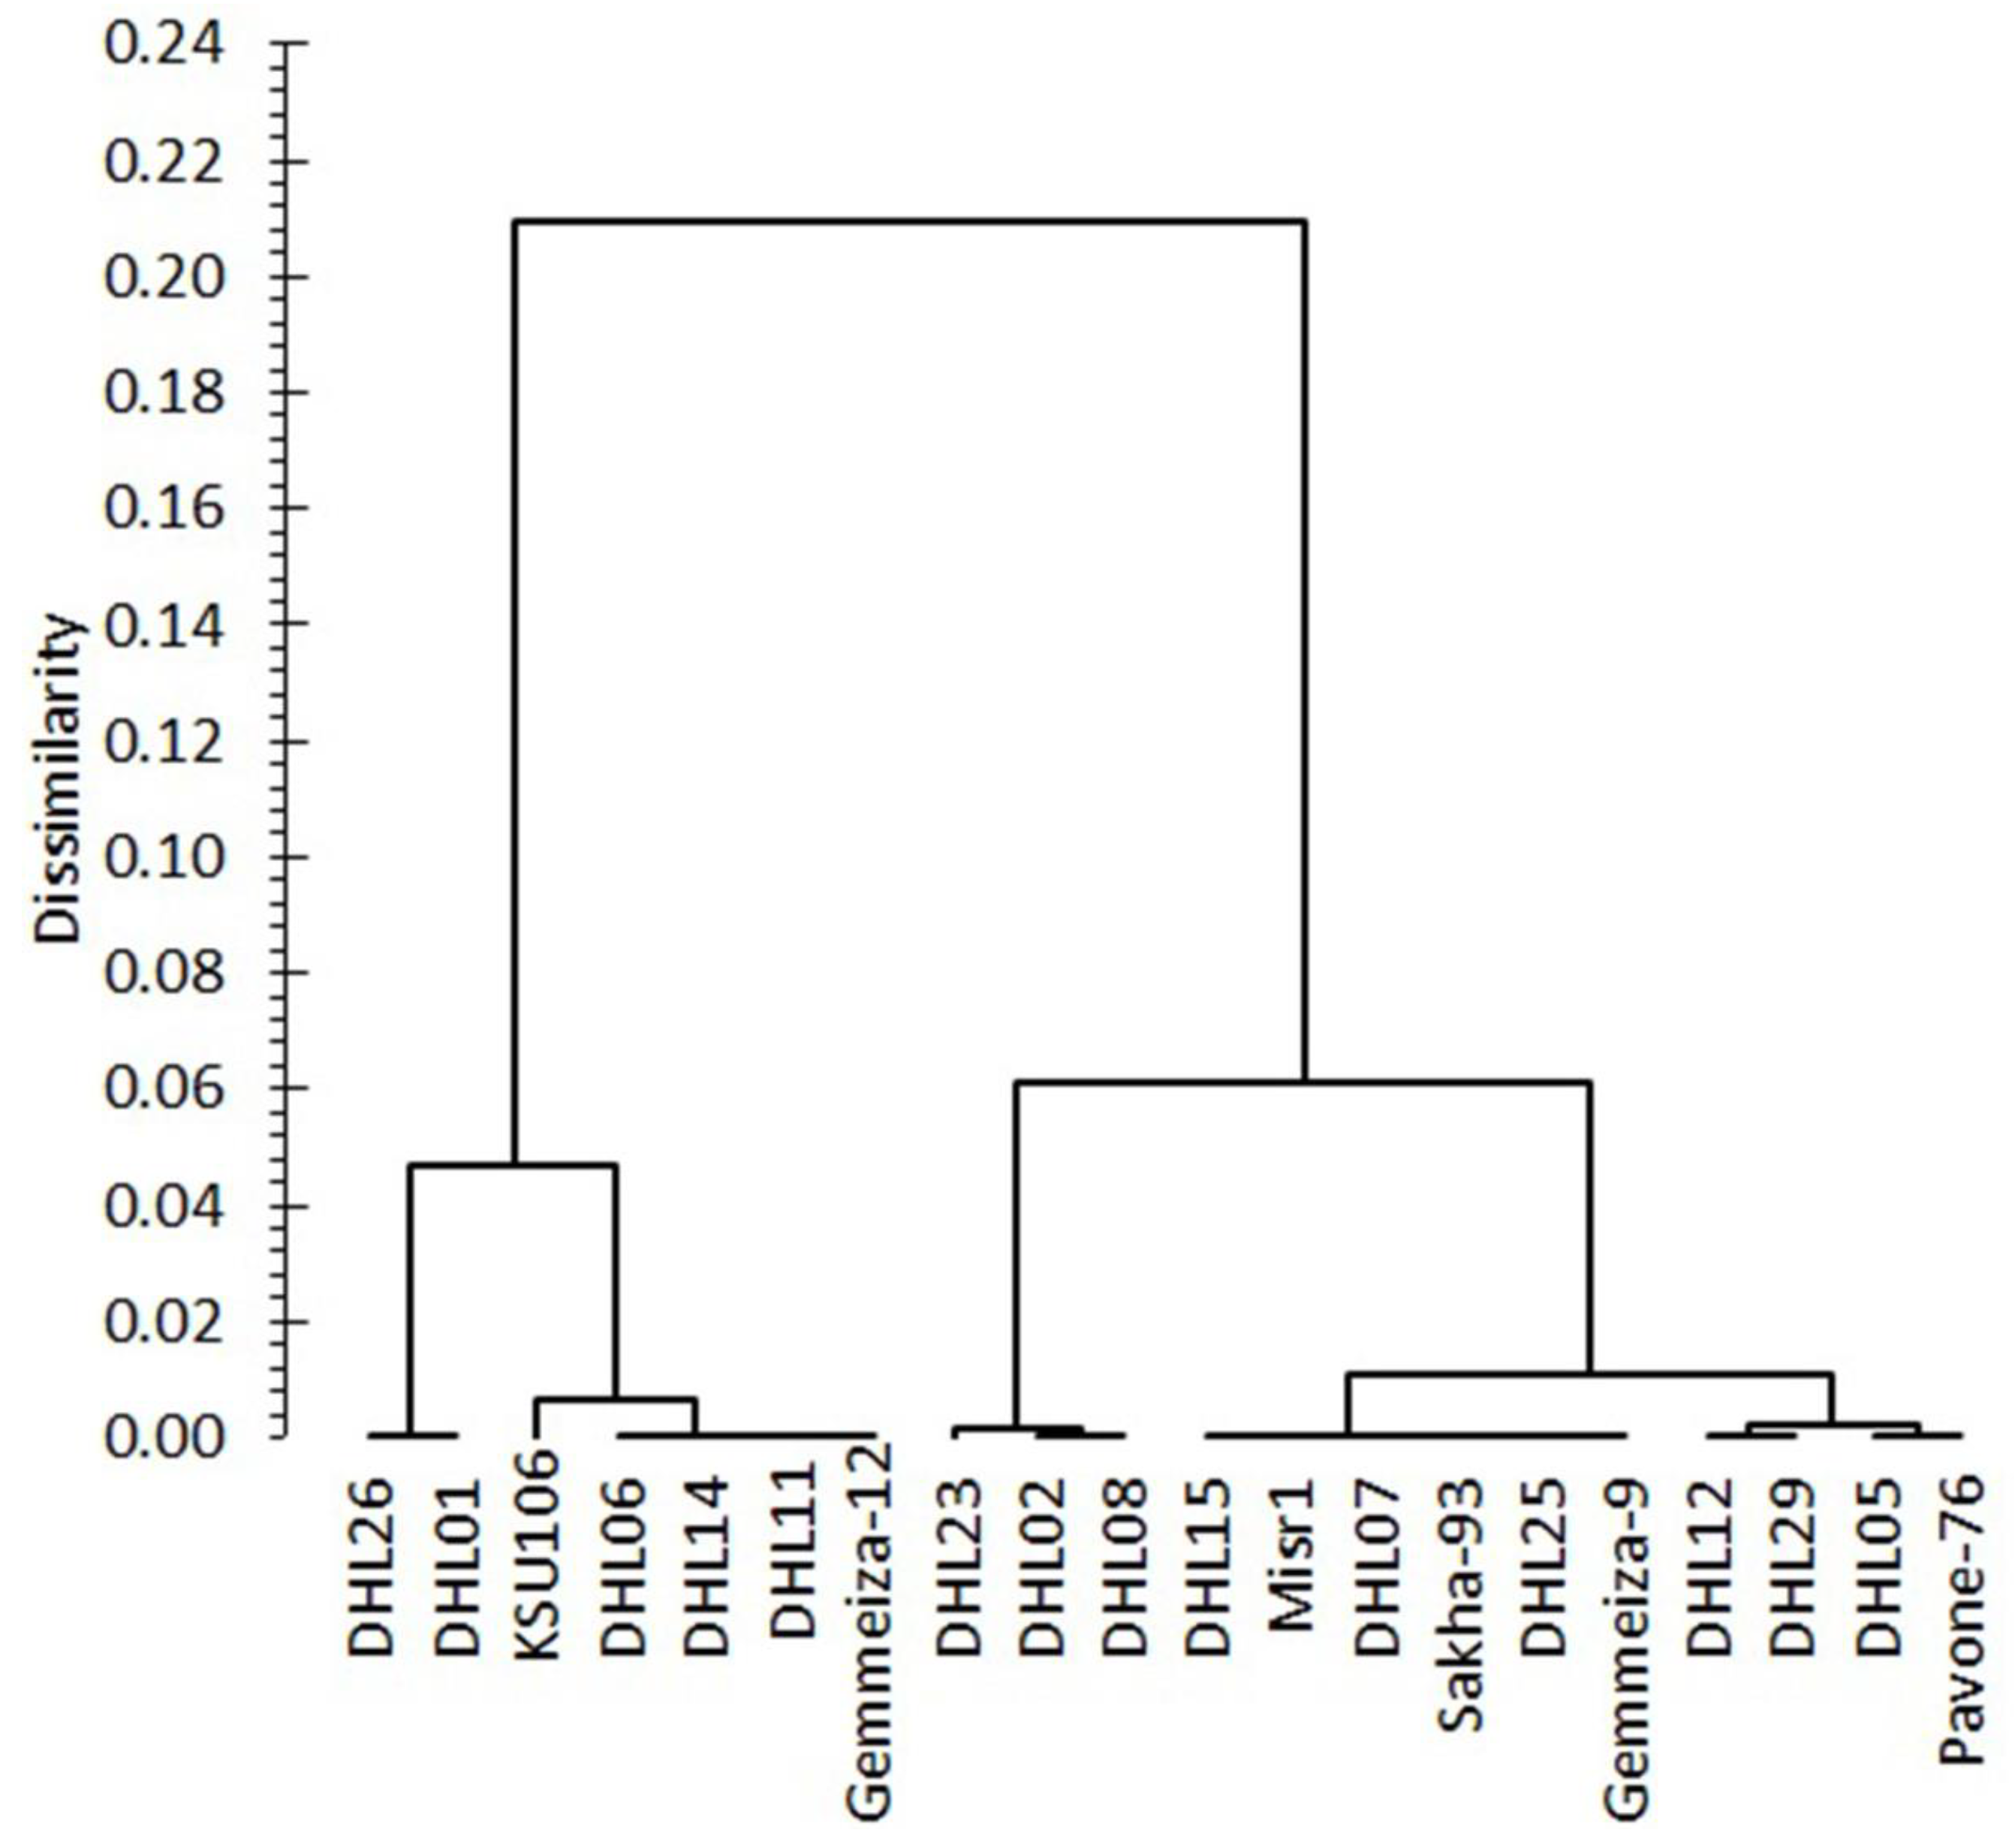
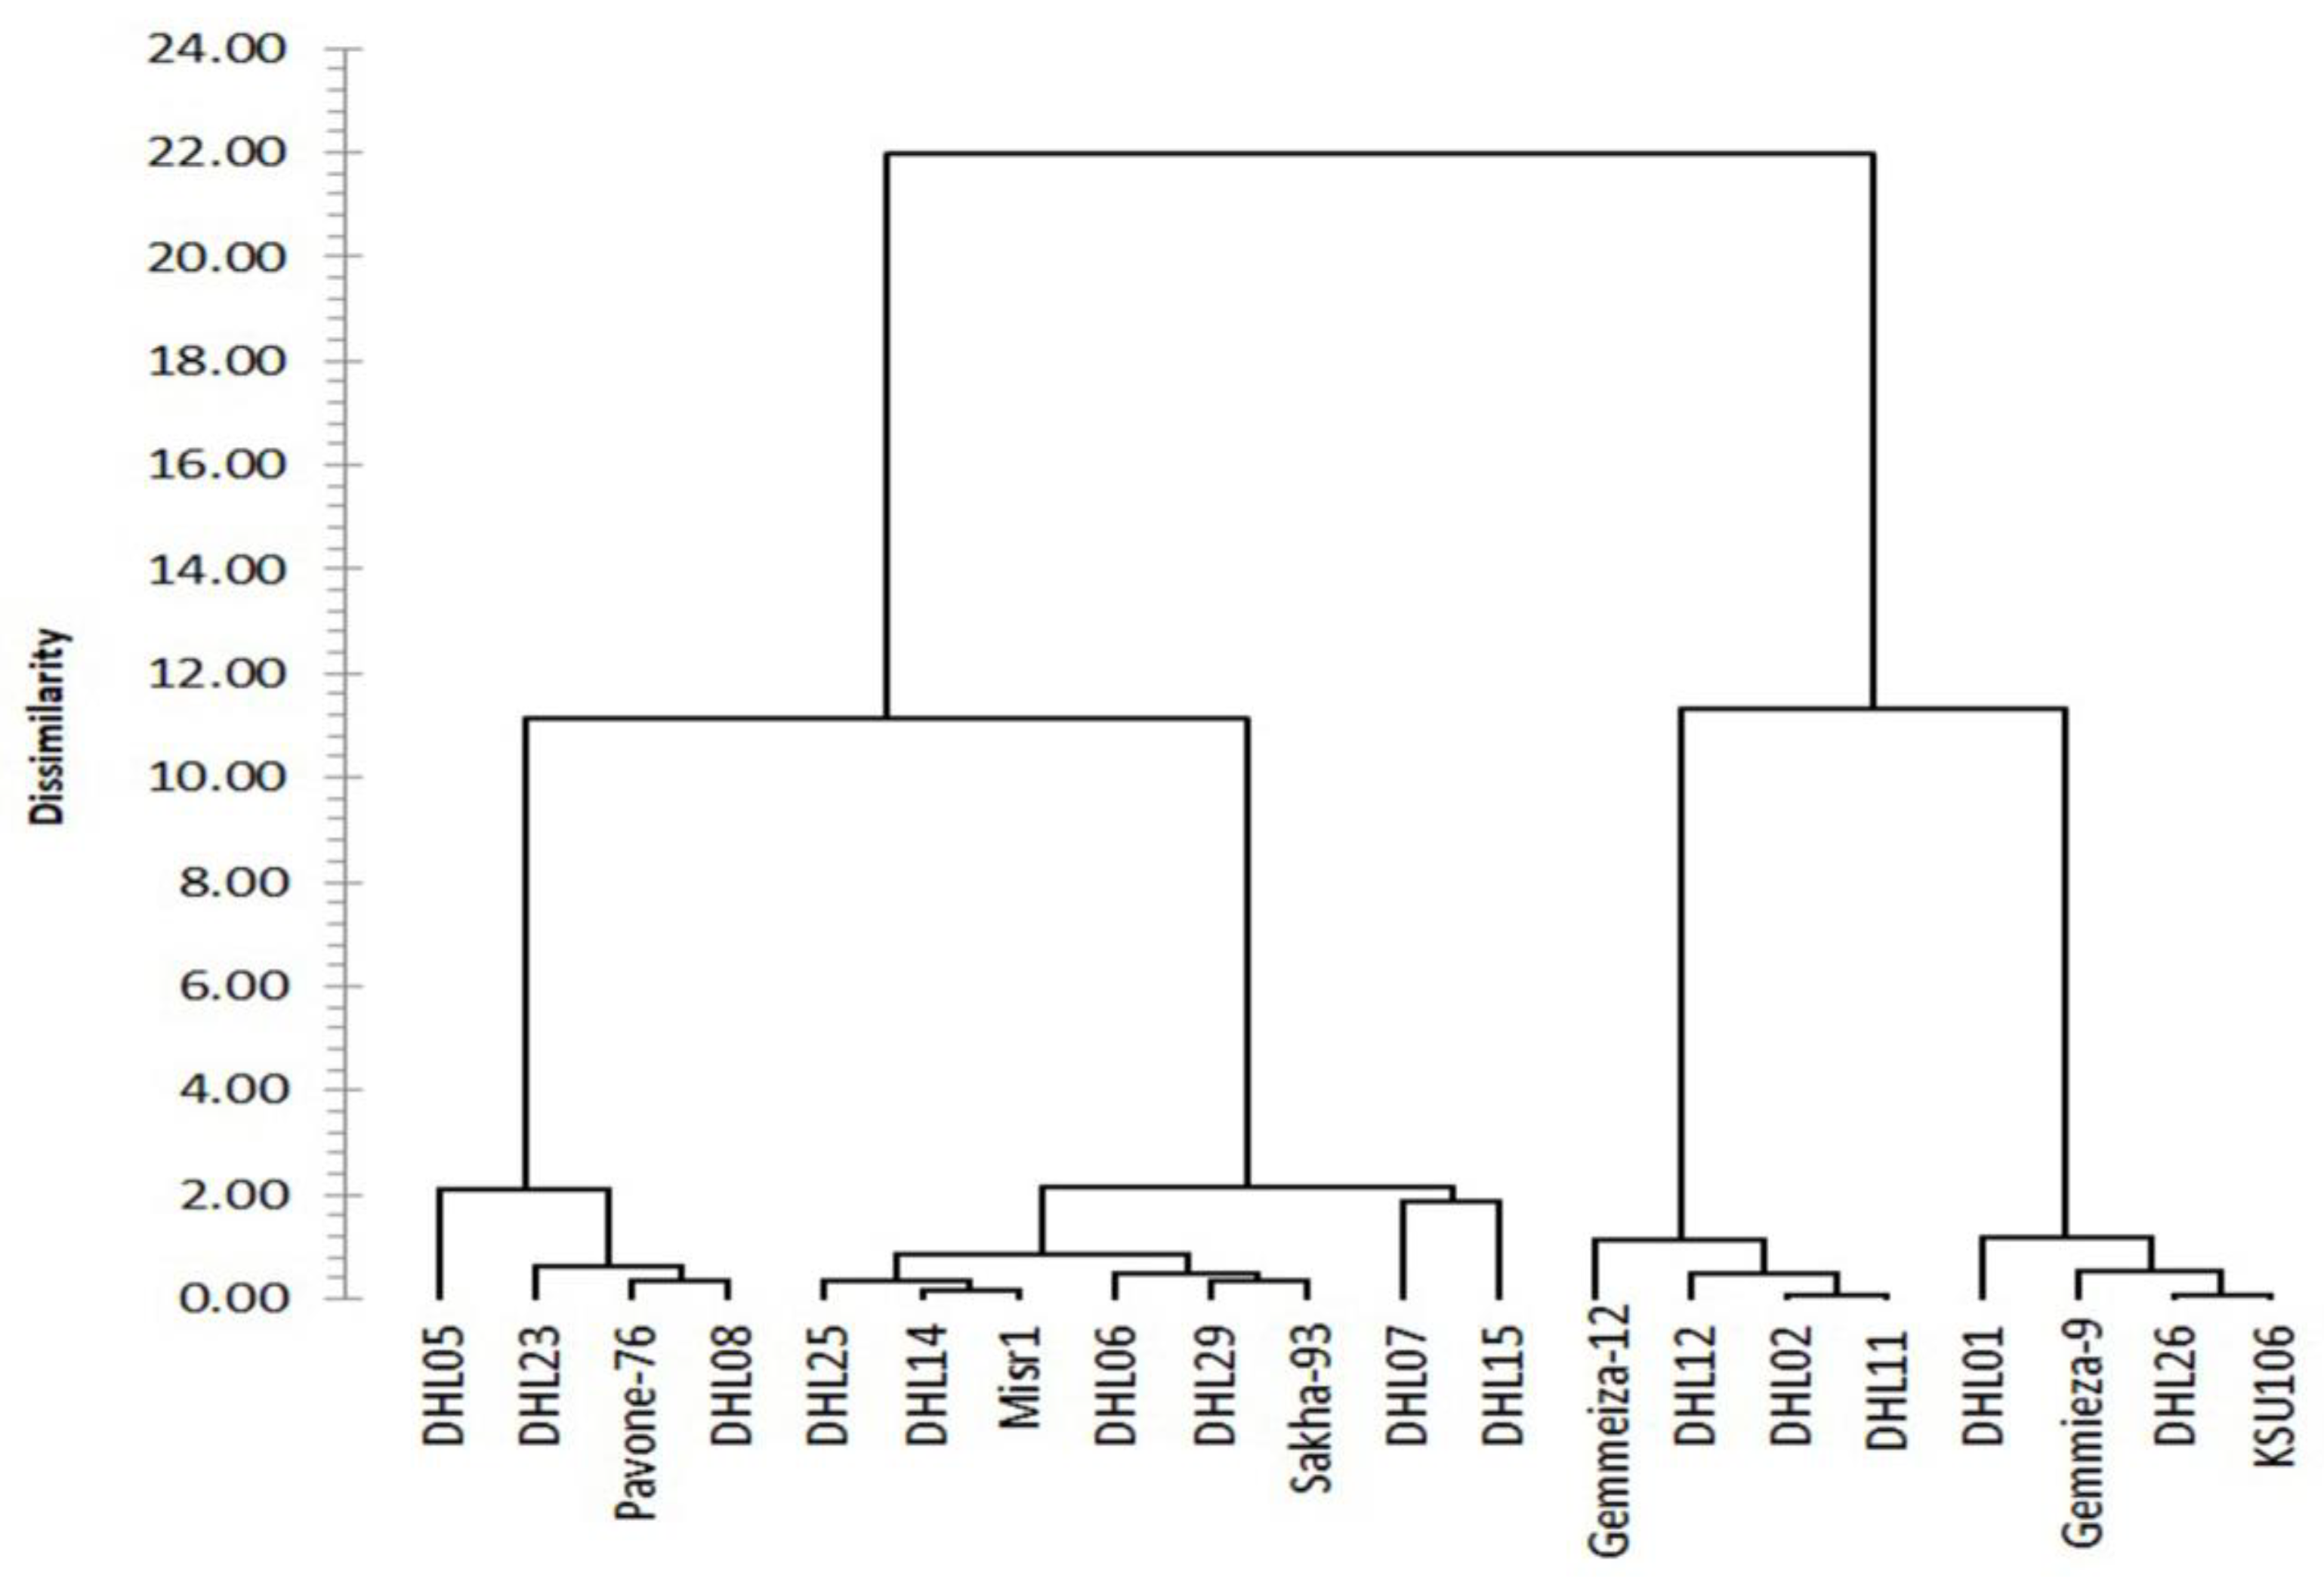
3.2.3. Clustering and Genetic Relationships between the Genotypes for Heat Tolerance

Based on SMLR analysis, we decided to use the tolerance index of the four indices (GFD, CAT, SL, and GY) for cluster analysis for heat tolerance of 20 wheat genotypes using genetics dissimilarity matrix (Euclidean distance and Ward’s method of agglomeration). Cluster analysis showed five major groups based on the heat tolerance range of wheat genotypes with a dissimilarity coefficient of 2.130. Cluster I, classified as highly tolerant (HT), consists of four genotypes (DHL05, DHL23, Pavone-76, and DHL08); cluster II or tolerant (T) with six genotypes (DHL12, DHL25, DHL29, DHL06, Misr1, and Sakha-93), cluster III of moderately tolerant (I) two genotypes (DHL07 and DHL15), cluster IV or sensitive (S), of four genotypes (DHL02, DHL11, Gemmeiza-12, and DHL14). Cluster VI was classified as highly sensitive (HS), consisting of four genotypes (DHL26, Gemmeiza-9, KSU106, and DHL01) (Figure 4).
The clustering result was substantially aligned with our phenotypic results. The classification of heat tolerance index for both PCA and clustering were significantly correlated (r = 0.502, p < 0.0001), building upon the Mantel test. Phenotypic variation between the five heat groups indicated significantly different performances for four indices (Figure 5). The mean comparison for each index showed significant differences in HT with S and HS groups for four indices, except for group S, which was insignificant for the SL index. There were insignificant differences between the T and I groups, except for group I, which was significant for the SL index. Group T vs. I exhibited insignificant differences in four indices. Group S vs. HS exhibited insignificant differences in GFD and GY indices and SL and CT indices (Figure 5).

3.2.4. Differentiation of Heat Groups by Discriminant Function Analysis

Multicollinearity statistics were acceptable, ranging from 0.278 to 0.696 for tolerance; and 1.436 to 3.598 for VIF (Table 7). Unidimensional test of equality of the means of the five groups by four indices (GFD, SL, CT, and GY) was significant with a low Lambda level, with values ranging from 0.216 (p < 0.0001) to 0.404 (p < 0.006). This indicates the possibility of predicting the performance of group members based on cluster analysis. The discriminant functions (two-dimensional) of five groups and four indices were closely related to the prediction of group members into the heat groupings for the 20 genotypes used in this study (Figure 4). The first and second canonical discriminant functions (Can) explained 54.325% and 43.385% (cumulative, 97,710), respectively, of the overall phenotypic variations (eigenvalues > 1) (Table 8). Bartlett’s statistic was significant for the first (54.926, p = 0.000) and second (27.670, p = 0.001) canonical. Canonical correlations were highly significant at 0.921 (Can1) and 0.903 (Can2). Loading the four indices to canonical discriminant functions (DF-Can1) showed that SL and CT were positively correlated, and GFD and GY were negatively correlated, reflecting that DF-Can1 discriminated between genotypes based on SL and CT. DF-Can2 was inextricably linked to GFD, SL, and GY but negatively correlated to CT, reflecting that DF-Can2 discriminates the genotypes based on GFD, SL, and GY.
The maximum distinction between group means I and S (3.681 vs. −2.940) was observed in DF-Can1, and between group means HT and HS (2.056 vs. −3.080) was observed in DF-Can2. S group with a positive DF-Can1 value was heat sensitive; conversely, four groups (HS, I, T, and HT) with DF-Can1 negative values. In the plot of heat groups with DF-Can1 and DF-Can2, group I was placed halfway between HS and HT (Figure 6). Group S had a positive value of DF-Can1 (3.681), indicating that it had high mean values for SL and CT indices and a negative DF-Can2 (−0.949) value due to low CT. The HT, T, and I groups were against the S group, which had a negative value for DF-Can1 (−0.017, −0.357, and −2.940) and a positive value for DF-Can2 (2.056, 1.088, and 0.682), respectively. The HS group had negative values for the two DF-Can (−1.659 and −3.080), respectively (Table 8). After finding the DF-Can, the classification of the five groups was verified, which showed that prior and posterior classification was identical in eighteen genotypes (% correct = 90%) and different in the two genotypes (DHL25 and DHL23). The values of membership probabilities (>0.5) indicated compatibility between prior and posterior classification (Table 9). The membership probabilities values = 1 in five genotypes (DHL02, DHL26, DHL11, Gemmeiza-12, and DHL01) and when it is less than 0.5 to be transferred to the appropriate classification. Cross-validation showed that prior and posterior classification was identical in thirteen genotypes (% correct = 65%) and different in the seven genotypes (DHL25, DHL07, DHL15, DHL06, DHL05, DHL23, and DHL08) (Table 9).

4. Discussion

Plant responses to stress are very complicated; it incorporates a set of temporal scales, from in just a few seconds to largely noticed evolutionary processes. We understand at least three clear time scales of plant response to stress, i.e., response to stress, acclimation, and adaptation. A plant’s response to stress varies with the developmental stage and genotype used, and the plant’s ability to survive under stress conditions is associated with stress tolerance [45]. Developing heat-tolerant genotypes is among the main goals of plant breeders, given that the final grain yield is affected by many genetic and environmental factors. Plant breeders rely on explained attributes associated with GY as screening criteria, which may provide greater information in the selection process of more sustainable and heat-tolerant genotypes [46,47]. There is a crucial need for a comprehensive understanding of the indirect approach behavior based on incorporating multiple morpho-physiological plant traits associated with heat tolerance with yield and its components. This can assist in targeting major traits, which may help genetic gain for grain yield for countries with high ambient temperatures. The accurate selection of explained attributes is efficient if there are strong associations with GY and high-value heritability and genetic gain [45,48,49].
Based on one-way ANOVA for heat tolerance index in S1 and S2, there were highly significant differences (p < 0.01) for genotypes for all indices, with a significant variation between large and small values for the majority of measured indices, reflecting the efficiency of these indices on the show genetic diversity between genotypes used (Table 1 and Table 2). The interactions in combined ANOVA between genotypes and seasons were significant, with nineteen indices out of twenty-six, suggesting that the genotypes’ heat tolerance index differed from season to season (Table 1). Test of the homogeneity between two seasons showed insignificant for 22 indices, suggesting that the combined data can be shown without exposing seasons data. Plant breeder depends primarily on the trait’s genetic stability (heritability, genetic gain and GCV). The 17 studied indices showed high heritability (h2 > 60%), genetic gain (nine of them were high >20% and/or eight of them were moderate >10%), and GCV and PCV were very close. This indicates that the genotypic variations primarily arise from the genetic control indices. These indices, therefore, can reliably be used as selection criteria for the evaluation of heat tolerance [28,33,48], notably if the measurement method is quick, easy, and low-budget [34]. The values for coefficients of experimental variation (CVe) were small, ranging from 3.94% to 5.43 (Table 2). These results show small variability within experimental units, and the number of replicates used was appropriate [50,51].
The studied wheat genotypes exhibited wide variation in heat tolerance. The stress tolerance index, typically used as a criterion to evaluate tolerance, has been used for screening genotypes in multiple recent literatures [29,35,45,52]. They have relied on quite fewer genotypes compared to our study. Although the number of applied genotypes could sound insufficient, it gave rise to reliable selection criteria and accurate results when multivariate analysis techniques and multidimensional methods were conducted for discriminating their heat tolerance [29,52,53,54]. In this study, we conducted a comprehensive assessment of wheat heat tolerance by many multivariate analyses with a view to achieving a more accurate classification. The angle between the vectors of indices was acute (less than 90°) for the GY index with most indices, which indicates a positive correlation of these traits with GY. In contrast, the angle between the vector of the four indices (CT, Gs, Ci, and E) was for GY higher than 90°, which indicated their negative correlation with GY (Figure 1). By PCA, the 25 indices were transformed into seven comprehensive indices (eigenvalue > 1) (Table 3), and the weight factor for each comprehensive index was determined (Table 3). Then, for each wheat genotype, the comprehensive evaluation value D to identify heat-tolerant capacity was calculated by the combination membership function analysis (Table 4). A high D value indicated higher heat tolerance capacity. Thus, the D value and the results of hierarchical cluster analysis were used to evaluate the heat tolerance of the 20 tested genotypes (Figure 2). The heat tolerance of wheat was determined, and studied genotypes were divided into five groups—three genotypes HT (DHL02, DHL23, DHL08), four genotypes T (DHL12, DHL29, DHL05, and Pavone-76), six genotypes I (DHL25, DHL07, Gemmeiza-9, DHL15, Misr1, and Sakha-93), four genotypes S (DHL11, KSU106, Gemmeiza-12, DHL14 and DHL06), and two genotypes HS (DHL26 and DHL01). This method was more confident than other traditional assessment metrics [52,55].
Heat tolerance is a comprehensive quantitative trait and a complex trait affected by many genetic and environmental factors and their interactions [56]. Thus, using only one index poorly reflects wheat genotypes’ heat tolerance, and the significant correlations between indices indicate overlap with others to heat stress [1,35]. We used other statistical analyses to further the accuracy of our results, i.e., the use of 16 morph-physiological and agronomic indices (MD, GFD, FLA, SL, LWC, RWC, CT, Pn, Gs, Ci, E, Ls, POD, PPO, CAT, and GY) as stress indicators for screening heat-tolerant genotypes. Out of these, nine indices, i.e., DH, NS, PH, GLN, GLA, LAI, NSS, NKS, and HW, were excluded from other statistical analyses because of their low heritability level and/or genetic gain with wide variation between GCV and PCV. Moreover, the 16 single HTIs showed highly significant differences among the 20 tested genotypes (Table 1). The seven indices of MD, GFD, PH, RWC, SL, HW, and Pn were correlated significantly positively with the GY index, while the CT index had a negative correlation (Figure 3). SMLR and path coefficient are effective tools for understanding the relationships between independent and dependent variables [1,57]. They have also found that a simple correlation analysis with interactions between independent and dependent indices may not help successful breeding programs [58]. We analyzed the relationships between 16 indices using SMLR for each genotype as independent indices to understand the best-measured and heat tolerance-related indices and their contribution to GY index performance as a dependent index (Table 5). The SMLR results showed that indices GFD, SL and CT only from the eight were directly relevant to the GY index (R2 of the SMLR model was 0.739, p < 0.0001), and their contribution rates were 0.529, 0.074, and 0.136, respectively (Table 5). We further conducted path analysis to separate the three indices (GFD, SL, and CT) for their direct and indirect impact. A direct effect of the correlation between the interpreted indices shows a direct connection among these indices and suggests their use in the selection process [1,59]. We found that the direct and indirect impacts were close for GDF and SL, but for CT, the direct impact was two-fold the indirect impact (Table 5).
The R2 values were 0.478 and 0.261 for direct and indirect impacts, respectively, and most of the impact was directly related to the GFD index. So, we realized that GFD, SL, and CT are good indices for predicting yield index and dependable to appraise the genotypic heat tolerance for their valuable contribution to the predicting process (Table 5). Naturally, the different genotypes perform from one index to another, but at least it will relate to one index [1]. In the same genotype, some traits might show a positive correlation, whereas others may show a negative correlation. As a result, we noticed the equation of the model (GY, Table 5), GY = 0.670 + 0.504 × GFD + 0.334 × SL − 0.466 × CT, and which showed that the predicted regression GY value, error value, and relative error value ranged from 0.663 to 0.972, from −0.142 to 0.081, from −0.261 to 0.105, respectively, with genotypes evaluation accuracy (%) ranging from 73.917 to 98.570 with an average value of 94.12 (Table 6), apparently, according to Yu et al. [52]. Indices such as GFD, SL, and CT are valuable indicators of overall plant performance; they consider radiation use efficiency, plant competition, photosynthesis, and evapotranspiration rates for computing plant growth and development [17,33]. Increasing GFD (from anthesis to maturity) is a critical target in plant breeding under heat stress. Therefore, plant breeders seek to break the negative correlation between DH and GY by obtaining high-yielding and early flowering bread wheat genotypes under heat stress [1]. GFD is a robust index for identifying genotypes of heat tolerance, given the interdependencies with morpho-physiological and early traits under heat stress. It has a strong relationship with SL and helps photosynthesis through awns. In this vein, CT is a strong index because closely linked to photosynthetic capacity, chlorophyll content, and several traits connected with high heat in plants [60,61,62]. The genotypes with the capacity to reduce CT and gas exchange are highly desirable, because of the efficiency indicator in gas exchange and transpiration as a leaf-cooling response under stress [63,64]. CT is a robust physiological index used in wheat breeding programs as a low-budget nondestructive tool for identifying heat-tolerant genotypes [60,61,65]. In wheat, genotypic variations for CT suggest the capacity of wheat genotypes also varies for transporting water cross-vascular system, regulating stomata aperture, metabolism, root biomass and depth, and source–sink balance [66]. Hence, the low CT trait should be the key focus of plant breeding programs for screening heat-tolerant wheat genotypes.
Based on the results of the SMLR analysis, we used the four tolerance indexes (GFD, CAT, SL, and GY) to create a cluster analysis for heat tolerance in the 20 wheat genotypes using a genetics dissimilarity matrix (Figure 4). The heat tolerance index for both PCA and clustering were significantly correlated (r = 0.502, p < 0.0001), building upon the Mantel test. Cluster analysis showed five major groups based on the tolerance range of wheat genotypes for heat. The HT, S, and HS groups represented four genotypes each, and T and I groups represented six and two genotypes, respectively. Six genotypes (DHL25, KSU106, Misr1, DHL05, Sakha-93, and Pavone-76) within groups showed deviation out to the nearest group compared to the classification of based comprehensive evaluation value D, but the genotypes (DHL12, DHL02, Gemmeiza-9, DHL14, and DHL06) showed deviation a lot further. Nine (DHL07, DHL26, DHL11, Gemmeiza-12, DHL01, DHL29, DHL15, DHL23, and DHL08) genotypes out of 20 were completely identical in the same categories obtained from comprehensive evaluation value D. Phenotypic variation between the five heat groups by one-way ANOVA indicated significantly different performances for the four indices (Figure 5). The group HT vs S in the SL index, HT vs T and I in GFD, CT, and GY indices, T vs I in the four indices, and S vs HS in GFD and GY indices had the same heat tolerance responses.
Many researchers have used cluster analysis for ranking the tolerant wheat genotypes based on their agro-physiological parameters [6,28,29,67,68]. However, cross-validation of the aggregation method was not employed to enhance classification reliability. In addition, identifying the differences between tolerance levels is unstable because heat tolerance is a complex inheritance and limited screening techniques [35,45,69]. So, FA was used to understand aggregation better and assess the extent of distinctions between heat categories to enhance classification reliability for heat tolerance. Fisher linear discriminant analysis (FLDA) is similar to MANOVA work; in the beginning, it computes the Mahalanobis distance of each genotype to a category and then uses this distance to classify a genotype into the category with the smallest generalized squared distance [68,70]. The homogeneity test for covariance matrices was significant (0.043 < p < 0.0001), and we conducted quadratic discriminant analysis, which resulted in a 0.00% error rate. This confirms that the classification of genotypes using clustering based on normalization values was a robust analysis. Lambda values were low (0.006 < p < 0.0001), which indicated the possibility of predicting group members based on the cluster analysis (Table 7). As indicated by DF, there were also strong contributions (cumulative, 97.71) and clear separations between the heat tolerance categories (Table 8). Our study suggested that DF-Can1 differentiates the genotypes based on SL and CT while DF-Can2 discriminates based on GFD, SL, and GY. The classification of the five groups was verified, which showed that prior and posterior classification was identical in eighteen genotypes (% correct = 90%) and different in the two genotypes (DHL25 and DHL23) (the values of membership probabilities > 0.5) (Table 9). Cross-validation showed that prior and posterior classification was identical in thirteen genotypes (% correct = 65%) and different in the seven genotypes (DHL25, DHL07, DHL15, DHL06, DHL05, DHL23, and DHL08). Therefore, DF could serve as a useful statistical tool for identifying genetic resources of heat tolerance using accurate and credible selection criteria [29,35,68]. Since heat-tolerant trait is very complicated and affected by many genetic and environmental factors and their interactions, an overall understanding of the genetic basis and plant responses to this stress and their interaction with the environment is needed [6,71,72,73]. We will be using recently discovered statistical methods in a future study with more environmental indices such as the multi-trait genotype-ideotype distance index (MGIDI), the weighted average of absolute scores (WAASB) index, and a superiority index that allows weighting between mean performance and stability (WAASBY) to help breeders make appropriate decisions for selecting more stable genotypes and commended in multi-environment trials [72,73,74].

5. Conclusions

In this study, we studied genotypic × environmental interactions in wheat using 25 indices with homogeneity of error variance in 22 indices. We found that 16 indices combined high heritability and genetic gain, which can be used as indicators for screening heat-tolerant genotypes. The classification D value and SMLR distances were significantly correlated based on the Mantel test, with a perfect match in nine genotypes. The SMLR-based classification of studied wheat genotypes into five distinct groups was verified through discriminant analysis, which showed that prior and posterior classification was identical in eighteen genotypes and different in the two genotypes. Cross-validation showed that prior and posterior classification was identical in thirteen genotypes and different in the seven genotypes. The tolerated new wheat lines (DHL25, DHL05, DHL23, and DHL08) and cultivar Pavone-76 could be recommended as a promising genetic source for heat-tolerant breeding programs.

Supplementary Materials

The following supporting information can be downloaded at: https://www.mdpi.com/article/10.3390/agronomy13010154/s1, : title; Table S1: Monthly temperature data at the experimental location during the growing seasons. Table S2. Names and pedigree of the 20 bread wheat genotypes (6 cultivars and 14 doubled haploid lines (DHLs)) used in this study.

Author Contributions

Conceived and designed the experiments, I.A.-A.; performed the experiments, I.A.-A., A.I., M.S.; analyzed the data, I.A.-A., M S., A.A.-D.; morpho-physiological measurements, I.A.-A., M.S., A.I., M.A. and A.G.; edited the manuscript, I.A.-A. and N.U.; final approval of the version to be published, I.A.-A. All authors have read and agreed to the published version of the manuscript.

Funding

The authors extend their appreciation to the Deputyship for Research & Innovation, Ministry of Education in Saudi Arabia for funding this research work through the project no. (IFKSURG-2-4).

Data Availability Statement

All data is contained within the article or Supplementary Material.

Acknowledgments

The authors extend their appreciation to the Deputyship for Research & Innovation, Ministry of Education in Saudi Arabia for funding this research work through the project no. (IFKSURG-2-4).

Conflicts of Interest

The authors declare no conflict of interest.

References

  1. Al-Ashkar, I.; Alotaibi, M.; Refay, Y.; Ghazy, A.; Zakri, A.; Al-Doss, A. Selection criteria for high-yielding and early-flowering bread wheat hybrids under heat stress. PLoS ONE 2020, 15, e0236351. [Google Scholar] [CrossRef] [PubMed]
  2. Riaz, M.W.; Yang, L.; Yousaf, M.I.; Sami, A.; Mei, X.D.; Shah, L.; Rehman, S.; Xue, L.; Si, H.; Ma, C. Effects of Heat Stress on Growth, Physiology of Plants, Yield and Grain Quality of Different Spring Wheat (Triticum aestivum L.) Genotypes. Sustainability 2021, 13, 2972. [Google Scholar] [CrossRef]
  3. Teixeira, E.I.; Fischer, G.; van Velthuizen, H.; Walter, C.; Ewert, F. Global hot-spots of heat stress on agricultural crops due to climate change. Agric. Forest Meteorol. 2013, 170, 206–215. [Google Scholar] [CrossRef]
  4. Dubey, R.; Pathak, H.; Chakrabarti, B.; Singh, S.; Gupta, D.K.; Harit, R.C. Impact of terminal heat stress on wheat yield in India and options for adaptation. Agric. Syst. 2020, 181, 102826. [Google Scholar] [CrossRef]
  5. Fernie, E.; Tan, D.K.; Liu, S.Y.; Ullah, N.; Khoddami, A.J.A. Post-Anthesis Heat Influences Grain Yield, Physical and Nutritional Quality in Wheat: A Review. Agriculture 2022, 12, 886. [Google Scholar] [CrossRef]
  6. Al-Ashkar, I.; Sallam, M.; Al-Suhaibani, N.; Ibrahim, A.; Alsadon, A.; Al-Doss, A.J.A. Multiple Stresses of Wheat in the Detection of Traits and Genotypes of High-Performance and Stability for a Complex Interplay of Environment and Genotypes. Agronomy 2022, 12, 2252. [Google Scholar] [CrossRef]
  7. Tariq, A.; Ashraf, I.; Ahmed, M.; Muscolo, A.; Basra, S.; Reynolds, M. Evaluation of Physiological and Morphological Traits for Improving Spring Wheat Adaptation to Terminal Heat Stress. Plants 2021, 10, 455. [Google Scholar]
  8. Djanaguiraman, M.; Narayanan, S.; Erdayani, E.; Prasad, P.V.V. Effects of high temperature stress during anthesis and grain filling periods on photosynthesis, lipids and grain yield in wheat. BMC Plant Biol. 2020, 20, 268. [Google Scholar] [CrossRef] [PubMed]
  9. Joshi, A.K.; Mishra, B.; Chatrath, R.; Ferrara, G.O.; Singh, R.P. Wheat improvement in India: Present status, emerging challenges and future prospects. Euphytica 2007, 157, 431–446. [Google Scholar] [CrossRef]
  10. Bita, C.E.; Gerats, T. Plant tolerance to high temperature in a changing environment: Scientific fundamentals and production of heat stress-tolerant crops. Front. Plant Sci. 2013, 4, 273. [Google Scholar] [CrossRef] [Green Version]
  11. Zhao, C.; Liu, B.; Piao, S.; Wang, X.; Lobell, D.B.; Huang, Y.; Huang, M.; Yao, Y.; Bassu, S.; Ciais, P.; et al. Temperature increase reduces global yields of major crops in four independent estimates. Proc. Natl. Acad. Sci. USA 2017, 114, 9326–9331. [Google Scholar] [CrossRef]
  12. Asseng, S.; Foster, I.; Turner, N.C. The impact of temperature variability on wheat yields. Glob. Chang. Biol. 2011, 17, 997–1012. [Google Scholar] [CrossRef]
  13. Wahid, A.; Gelani, S.; Ashraf, M.; Foolad, M.R. Heat tolerance in plants: An overview. Environ. Exp. Bot. 2007, 61, 199–223. [Google Scholar] [CrossRef]
  14. Djanaguiraman, M.; Boyle, D.L.; Welti, R.; Jagadish, S.V.K.; Prasad, P.V.V. Decreased photosynthetic rate under high temperature in wheat is due to lipid desaturation, oxidation, acylation, and damage of organelles. BMC Plant Biol. 2018, 18, 55. [Google Scholar] [CrossRef] [Green Version]
  15. Yadav, M.R.; Choudhary, M.; Singh, J.; Lal, M.K.; Jha, P.K.; Udawat, P.; Gupta, N.K.; Rajput, V.D.; Garg, N.K.; Maheshwari, C.; et al. Impacts, Tolerance, Adaptation, and Mitigation of Heat Stress on Wheat under Changing Climates. Int. J. Mol. Sci. 2022, 23, 2838. [Google Scholar] [CrossRef]
  16. Tashiro, T.; Wardlaw, I.F. The Response to High-Temperature Shock and Humidity Changes Prior to and during the Early Stages of Grain Development in Wheat. Aust. J. Plant Physiol. 1990, 17, 551–561. [Google Scholar] [CrossRef]
  17. Lopes, M.S.; Reynolds, M.P. Stay-green in spring wheat can be determined by spectral reflectance measurements (normalized difference vegetation index) independently from phenology. J. Exp. Bot. 2012, 63, 3789–3798. [Google Scholar] [CrossRef] [Green Version]
  18. Mondal, S.; Singh, R.P.; Crossa, J.; Huerta-Espino, J.; Sharma, I.; Chatrath, R.; Singh, G.P.; Sohu, V.S.; Mavi, G.S.; Sukuru, V.S.P.; et al. Earliness in wheat: A key to adaptation under terminal and continual high temperature stress in South Asia. Field Crop. Res. 2013, 151, 19–26. [Google Scholar] [CrossRef]
  19. Barakat, M.N.; Al-Doss, A.A.; Moustafa, K.A.; Motawei, M.I.; Al-Ashkar, I.M.; Al-Otayk, S.M.; Alamri, M.S.; Mergoum, M. Mapping Wheat Qtls for Grain Yield Related Traits under High Temperature Stress. Genetika 2020, 52, 1107–1125. [Google Scholar] [CrossRef]
  20. Talukder, S.K.; Babar, M.A.; Vijayalakshmi, K.; Poland, J.; Prasad, P.V.; Bowden, R.; Fritz, A. Mapping QTL for the traits associated with heat tolerance in wheat (Triticum aestivum L.). BMC Genet. 2014, 15, 97. [Google Scholar] [CrossRef] [Green Version]
  21. Blum, A.; Sinmena, B.; Mayer, J.; Golan, G.; Shpiler, L. Stem Reserve Mobilization Supports Wheat-Grain Filling under Heat-Stress. Aust. J. Plant Physiol. 1994, 21, 771–781. [Google Scholar] [CrossRef]
  22. Pinto, R.S.; Reynolds, M.P.; Mathews, K.L.; McIntyre, C.L.; Olivares-Villegas, J.J.; Chapman, S.C. Heat and drought adaptive QTL in a wheat population designed to minimize confounding agronomic effects. Theor. Appl. Genet. 2010, 121, 1001–1021. [Google Scholar] [CrossRef] [Green Version]
  23. Pinto, R.S.; Reynolds, M.P. Common genetic basis for canopy temperature depression under heat and drought stress associated with optimized root distribution in bread wheat. Theor. Appl. Genet. 2015, 128, 575–585. [Google Scholar] [CrossRef] [Green Version]
  24. Kumari, M.; Pudake, R.N.; Singh, V.P.; Joshi, A.K. Association of staygreen trait with canopy temperature depression and yield traits under terminal heat stress in wheat (Triticum aestivum L.). Euphytica 2013, 190, 87–97. [Google Scholar] [CrossRef]
  25. Pinto, R.S.; Lopes, M.S.; Collins, N.C.; Reynolds, M.P. Modelling and genetic dissection of staygreen under heat stress. Theor. Appl. Genet. 2016, 129, 2055–2074. [Google Scholar] [CrossRef] [Green Version]
  26. Asseng, S.; Ewert, F.; Martre, P.; Rotter, R.P.; Lobell, D.B.; Cammarano, D.; Kimball, B.A.; Ottman, M.J.; Wall, G.W.; White, J.W.; et al. Rising temperatures reduce global wheat production. Nat. Clim. Chang. 2015, 5, 143–147. [Google Scholar] [CrossRef]
  27. Kumar, S.; Kumari, P.; Kumar, U.; Grover, M.; Singh, A.K.; Singh, R.; Sengar, R.S. Molecular approaches for designing heat tolerant wheat. J. Plant Biochem. Biot. 2013, 22, 359–371. [Google Scholar] [CrossRef]
  28. Abdolshahi, R.; Nazari, M.; Safarian, A.; Sadathossini, T.; Salarpour, M.; Amiri, H. Integrated selection criteria for drought tolerance in wheat (Triticum aestivum L.) breeding programs using discriminant analysis. Field Crop Res. 2015, 174, 20–29. [Google Scholar] [CrossRef]
  29. Al-Ashkar, I.; Alderfasi, A.; El-Hendawy, S.; Al-Suhaibani, N.; El-Kafafi, S.; Seleiman, M.F. Detecting Salt Tolerance in Doubled Haploid Wheat Lines. Agronomy 2019, 9, 211. [Google Scholar] [CrossRef] [Green Version]
  30. Chakraborty, K.; Mondal, S.; Ray, S.; Samal, P.; Pradhan, B.; Chattopadhyay, K.; Kar, M.K.; Swain, P.; Sarkar, R.K. Tissue tolerance coupled with ionic discrimination can potentially minimize the energy cost of salinity tolerance in rice. Front. Plant Sci. 2020, 11, 265. [Google Scholar] [CrossRef]
  31. Dadshani, S.; Sharma, R.C.; Baum, M.; Ogbonnaya, F.C.; Léon, J.; Ballvora, A. Multi-dimensional evaluation of response to salt stress in wheat. PLoS ONE 2019, 14, e0222659. [Google Scholar] [CrossRef]
  32. Al-Ashkar, I.; Romdhane, W.B.; El-Said, R.A.; Ghazy, A.; Attia, K.; Al-Doss, A. Agro-Physiologic Responses and Stress-Related Gene Expression of Four Doubled Haploid Wheat Lines under Salinity Stress Conditions. Biology 2021, 10, 56. [Google Scholar] [CrossRef]
  33. El-Hendawy, S.; Al-Suhaibani, N.; Al-Ashkar, I.; Alotaibi, M.; Tahir, M.U.; Solieman, T.; Hassan, W.M. Combining Genetic Analysis and Multivariate Modeling to Evaluate Spectral Reflectance Indices as Indirect Selection Tools in Wheat Breeding under Water Deficit Stress Conditions. Remote Sens. 2020, 12, 1480. [Google Scholar] [CrossRef]
  34. Grzesiak, S.; Hordyńska, N.; Szczyrek, P.; Grzesiak, M.T.; Noga, A.; Szechyńska-Hebda, M. Variation among wheat (Triticum easativum L.) genotypes in response to the drought stress: I–selection approaches. J. Plant Interact. 2019, 14, 30–44. [Google Scholar] [CrossRef] [Green Version]
  35. De Leon, T.B.; Linscombe, S.; Gregorio, G.; Subudhi, P.K. Genetic variation in Southern USA rice genotypes for seedling salinity tolerance. Front. Plant Sci. 2015, 6, 374. [Google Scholar] [CrossRef] [Green Version]
  36. El-Hennawy, M.; Abdalla, A.; Shafey, S.A.; Al-Ashkar, I. Production of doubled haploid wheat lines (Triticum aestivum L.) using anther culture technique. Ann. Agric. Sci. 2011, 56, 63–72. [Google Scholar] [CrossRef] [Green Version]
  37. Clarke, J.M.; McCaig, T.N. Excised-leaf water retention capability as an indicator of drought resistance of Triticum genotypes. Can. J. Plant Sci. 1982, 62, 571–578. [Google Scholar] [CrossRef]
  38. Barrs, H. Determination of water deficits in plant tissues. In Water Deficits and Plant Growth; Academic Press: New York, NY, USA, 1968; Volume 1, pp. 235–368. [Google Scholar]
  39. Wang, X.; Wang, L.; Shangguan, Z. Leaf gas exchange and fluorescence of two winter wheat varieties in response to drought stress and nitrogen supply. PLoS ONE 2016, 11, e0165733. [Google Scholar] [CrossRef] [Green Version]
  40. Aebi, H. Catalase in vitro. Methods Enzymol. 1984, 105, 121–126. [Google Scholar] [CrossRef]
  41. Chance, B.; Maehly, A.C. Assay of Catalases and Peroxidases. Method Enzymol. 1955, 2, 764–775. [Google Scholar] [CrossRef]
  42. Duckworth, H.W.; Coleman, J.E. Physicochemical and kinetic properties of mushroom tyrosinase. J. Biol. Chem. 1970, 245, 1613–1625. [Google Scholar] [CrossRef]
  43. Fehr, W. Principles of Cultivar Development: Theory and Technique; Macmillian Publishing Company: New York, NY, USA, 1991. [Google Scholar]
  44. Zadeh, L.A. Fuzzy sets as a basis for a theory of possibility. J. Fuzzy Sets Syst. 1978, 1, 3–28. [Google Scholar] [CrossRef]
  45. Al-Ashkar, I.; Alderfasi, A.; Ben Romdhane, W.; Seleiman, M.F.; El-Said, R.A.; Al-Doss, A. Morphological and genetic diversity within salt tolerance detection in eighteen wheat genotypes. Plants 2020, 9, 287. [Google Scholar] [CrossRef] [Green Version]
  46. Fischer, K. Breeding Rice for Drought-Prone Environments; International Rice Research Institute: Los Baños, Philippines, 2003; Volume 1. [Google Scholar]
  47. Bustos-Korts, D.; Boer, M.P.; Malosetti, M.; Chapman, S.; Chenu, K.; Zheng, B.; van Eeuwijk, F.A. Combining Crop Growth Modeling and Statistical Genetic Modeling to Evaluate Phenotyping Strategies. Front. Plant Sci. 2019, 10, 1491. [Google Scholar] [CrossRef] [Green Version]
  48. Falconer, D.; Mackay, T.; Bulmer, M. Introduction to Quantitative Genetics. Genet. Res. 1996, 68, 183. [Google Scholar]
  49. Obala, J.; Saxena, R.; Singh, V.; Vechalapu, S.; Das, R.R.; Rathore, A.; Kumar, C.S.; Saxena, K.; Tongoona, P.; Sibiya, J.; et al. Genetic variation and relationships of total seed protein content with some agronomic traits in pigeonpea (Cajanus cajan (L.) Millsp.). Aust. J. Crop Sci. 2018, 12, 1859–1865. [Google Scholar] [CrossRef]
  50. Barbin, D. Planejamento e Análise de Experimentos Agronômicos; Midas: Arapongas, Brazil, 2003. [Google Scholar]
  51. Wartha, C.A.; Cargnelutti Filho, A.; Lucio, A.D.; Follmann, D.N.; Kleinpaul, J.A.; Simoes, F.M. Sample sizes to estimate mean values for tassel traits in maize genotypes. Genet. Mol. Res. 2016, 15, gmr15049151. [Google Scholar] [CrossRef]
  52. Yu, R.; Wang, G.; Yu, X.; Li, L.; Li, C.; Song, Y.; Xu, Z.; Zhang, J.; Guan, C. Assessing alfalfa (Medicago sativa L.) tolerance to salinity at seedling stage and screening of the salinity tolerance traits. Plant Biol. 2021, 23, 664–674. [Google Scholar] [CrossRef]
  53. El-Hendawy, S.; Elshafei, A.; Al-Suhaibani, N.; Alotabi, M.; Hassan, W.; Dewir, Y.H.; Abdella, K. Assessment of the salt tolerance of wheat genotypes during the germination stage based on germination ability parameters and associated SSR markers. J. Plant Interact. 2019, 14, 151–163. [Google Scholar] [CrossRef] [Green Version]
  54. Sandhu, D.; Cornacchione, M.V.; Ferreira, J.F.; Suarez, D.L. Variable salinity responses of 12 alfalfa genotypes and comparative expression analyses of salt-response genes. Sci. Rep. 2017, 7, 42958. [Google Scholar] [CrossRef] [Green Version]
  55. Han, B.; Ma, X.; Cui, D.; Wang, Y.; Geng, L.; Cao, G.; Zhang, H.; Han, L. Comprehensive Evaluation and Analysis of the Mechanism of Cold Tolerance Based on the Transcriptome of Weedy Rice Seedlings. Rice 2020, 13, 12. [Google Scholar] [CrossRef] [PubMed]
  56. Ashraf, M.; Foolad, M.R. Crop breeding for salt tolerance in the era of molecular markers and marker-assisted selection. Plant Breed. 2013, 132, 10–20. [Google Scholar] [CrossRef]
  57. Khan, A.S.; Ashfaq, M.; Asad, M.A. A correlation and path coefficient analysis for some yield components in bread wheat. Asian J. Plant Sci. 2003, 2, 582–584. [Google Scholar]
  58. Del Moral, L.; Rharrabti, Y.; Villegas, D.; Royo, C. Evaluation of grain yield and its components in durum wheat under Mediterranean conditions. Agron. J. 2003, 95, 266–274. [Google Scholar] [CrossRef]
  59. Bojarian, M.; Asadi-Gharneh, H.A.; Golabadi, M. Factor analysis, stepwise regression and path coefficient analyses of yield, yield-associated traits, and fruit quality in tomato. Int. J. Veg. Sci. 2019, 25, 542–553. [Google Scholar] [CrossRef]
  60. Rebetzke, G.J.; Rattey, A.R.; Farquhar, G.D.; Richards, R.A.; Condon, A.T.G. Genomic regions for canopy temperature and their genetic association with stomatal conductance and grain yield in wheat. Funct. Plant Biol. 2013, 40, 14–33. [Google Scholar] [CrossRef]
  61. Reynolds, M.P.; Pierre, C.S.; Saad, A.S.; Vargas, M.; Condon, A.G. Evaluating potential genetic gains in wheat associated with stress-adaptive trait expression in elite genetic resources under drought and heat stress. Crop Sci. 2007, 47, S-172–S-189. [Google Scholar] [CrossRef]
  62. Gautam, A.; Prasad, S.S.; Jajoo, A.; Ambati, D. Canopy temperature as a selection parameter for grain yield and its components in durum wheat under terminal heat stress in late sown conditions. Agric. Res. 2015, 4, 238–244. [Google Scholar] [CrossRef]
  63. Bahar, B.; Yildirim, M.; Barutcular, C.; Ibrahim, G. Effect of canopy temperature depression on grain yield and yield components in bread and durum wheat. Not. Bot. Horti Agrobot. 2008, 36, 34–37. [Google Scholar]
  64. Mason, R.E.; Singh, R.P. Considerations when deploying canopy temperature to select high yielding wheat breeding lines under drought and heat stress. Agronomy 2014, 4, 191–201. [Google Scholar] [CrossRef] [Green Version]
  65. Reynolds, M.; Manes, Y.; Izanloo, A.; Langridge, P. Phenotyping approaches for physiological breeding and gene discovery in wheat. Ann. Appl. Biol. 2009, 155, 309–320. [Google Scholar] [CrossRef]
  66. Reynolds, M.; Pask, A.; Mullan, D. Physiological Breeding I: Interdisciplinary Approaches to Improve Crop Adaptation; CIMMYT: Mexico City, Mexico, 2012. [Google Scholar]
  67. Zeng, L.; Shannon, M.C.; Grieve, C.M. Evaluation of salt tolerance in rice genotypes by multiple agronomic parameters. Euphytica 2002, 127, 235–245. [Google Scholar] [CrossRef]
  68. Al-Ashkar, I.; Al-Suhaibani, N.; Abdella, K.; Sallam, M.; Alotaibi, M.; Seleiman, M.F. Combining Genetic and Multidimensional Analyses to Identify Interpretive Traits Related to Water Shortage Tolerance as an Indirect Selection Tool for Detecting Genotypes of Drought Tolerance in Wheat Breeding. Plants 2021, 10, 931. [Google Scholar] [CrossRef] [PubMed]
  69. Platten, J.D.; Egdane, J.A.; Ismail, A.M. Salinity tolerance, Na+ exclusion and allele mining of HKT1;5 in Oryza sativa and O. glaberrima: Many sources, many genes, one mechanism? BMC Plant Biol. 2013, 13, 32. [Google Scholar] [CrossRef]
  70. Truxillo, C. Multivariate Statistical Methods: Practical Research Applications: Course Notes; SAS Institute: Cary, NC, USA, 2003; ISBN 159994586X. [Google Scholar]
  71. Singamsetti, A.; Shahi, J.P.; Zaidi, P.H.; Seetharam, K.; Vinayan, M.T.; Kumar, M.; Singla, S.; Shikha, K.; Madankar, K. Genotype × environment interaction and selection of maize (Zea mays L.) hybrids across moisture regimes. Field Crops Res. 2021, 270, 108224. [Google Scholar] [CrossRef]
  72. Olivoto, T.; Lúcio, A.D.; da Silva, J.A.; Sari, B.G.; Diel, M.I. Mean performance and stability in multi-environment trials II: Selection based on multiple traits. Agron. J. 2019, 111, 2961–2969. [Google Scholar] [CrossRef]
  73. Olivoto, T.; Lúcio, A.D.; da Silva, J.A.; Marchioro, V.S.; de Souza, V.Q.; Jost, E. Mean performance and stability in multi-environment trials I: Combining features of AMMI and BLUP techniques. Agron. J. 2019, 111, 2949–2960. [Google Scholar] [CrossRef]
  74. Olivoto, T.; Nardino, M. MGIDI: Toward an effective multivariate selection in biological experiments. Bioinformatics 2021, 37, 1383–1389. [Google Scholar] [CrossRef]
Figure 1. Biplot for the first two principle components in the principle component analysis of 20 wheat genotypes in two seasons (S1 and S2) for 25 heat tolerance indices.
Agronomy 13 00154 g001
Figure 2. Dendrogram showing clustering of 20 wheat genotypes based on the Euclidean distance of the (D) value.
Agronomy 13 00154 g002
Figure 3. Correlation matrix among 25 indices measured. ** indicate significance at p < 0.01.
Agronomy 13 00154 g003
Figure 4. Dendrogram showing clustering of 20 wheat genotypes based on the Euclidean distance of four tolerance indices: GFD, CAT, SL, and GY.
Agronomy 13 00154 g004
Figure 5. Radar charts comparing three indices of the five groups. Data was analyzed using least squares (LS). Grain-filling duration (GFD), canopy temperature (CT), spike length (SL), and grain yield (GY).
Agronomy 13 00154 g005
Figure 6. Distribution of 20 wheat genotypes by discriminant analysis of grain-filling duration, canopy temperature, spike length, and grain yield indices. Highly tolerant (HT), tolerant (T), intermediate (I), sensitive (S), and highly sensitive (HS).
Agronomy 13 00154 g006
Table 1. Analysis of variance for heat tolerance index of measured traits, heritability, genetic gain, genotypic, and phenotypic coefficients of variability for traits of 20 wheat genotypes.
Source of VariationsdfCTLWCRWCPnGsCiELsPODPPOCATGLNFLA
Season 1Replications20.00230.00180.00170.00180.00120.00120.00130.00310.00300.00140.00280.00150.0016
Genotypes (G)190.01040.01350.00920.03070.07970.01710.04490.42741.63120.59801.95330.01540.0103
Error380.00150.00140.00130.00130.00080.00100.00090.00250.00190.00120.00230.00130.0012
Season 2Replications20.00280.00170.00170.00170.00140.00130.00130.00310.00290.00140.00270.00170.0014
Genotypes (G)190.03460.00800.00990.04240.12010.02120.06890.22491.60300.58821.92030.04450.0368
Error380.00260.00130.00120.00140.00150.00100.00100.00230.00190.00120.00230.00140.0011
CombinedSeasons (S)10.15350.05330.03190.02180.03550.00410.00280.04900.00120.00100.00100.09080.0618
Replications (Sea.)40.00260.00180.00170.00180.00130.00130.00130.00310.00290.00140.00280.00160.0015
Genotypes (G)190.03680.01780.01400.06600.19150.03630.10360.61250.82100.98200.86700.03400.0369
S ×G190.00850.00410.00520.00720.00800.00180.01000.0410 0.0002 0.0001 0.0001 0.02610.0102
Error760.00200.00140.00130.00130.00120.00100.00090.00240.00190.00120.00230.00130.0012
Heritability (h2 %) 64.5360.4360.6180.1089.5177.9484.4386.6662.0583.6685.6127.5061.88
Genetic gain (GG %)14.9510.9510.8722.0543.2117.2231.1254.2550.4437.6044.105.7613.78
G.C.V. %9.036.836.7811.9622.179.4716.4428.2931.0819.9623.145.338.50
Ph.C.V. %11.248.798.7113.3623.4310.7317.8930.3939.4621.8225.0010.1710.81
Source of variationsdfGLALAIDHMDGFDNSPHSLNSSNKSHWGY
Season 1Replications20.00160.00050.00180.00170.00160.00120.00150.00150.00130.00160.00130.0012
Genotypes (G)190.02830.04410.00830.00620.01010.02990.00620.02400.02270.01390.00700.0260
Error380.00130.00040.00220.00130.00170.00090.00130.00130.00120.00120.00100.0013
Season 2Replications20.00110.00080.00170.00150.00130.00110.00160.00340.00180.00160.00140.0008
Genotypes (G)190.05930.03810.00810.01130.04380.03110.01770.11350.01350.02310.00900.0834
Error380.00100.00070.00140.00120.00100.00080.00130.00230.00120.00140.00110.0008
Combined Seasons (S)10.45020.19200.00010.04230.0020.02140.00300.52100.03370.06360.01830.0560
Replications (Sea.)40.00130.00070.00170.00160.00140.00110.00160.00240.00150.00160.00130.0010
Genotypes (G)190.05820.05200.01540.01640.0460.04140.01390.05010.01820.02440.01120.0816
S ×G190.02930.0304 0.0009 0.0001 0.0070 0.01960.01000.08730.01830.01270.0047 0.0281
Error760.00110.00050.00180.00130.00130.00090.00130.00180.00120.00130.00110.0011
Heritability (h2 %) 49.0738.6555.2260.4769.2947.4445.3069.4519.3433.7356.6980.73
Genetic gain (GG %)13.6715.0610.1510.3520.0512.206.1314.752.405.8510.3620.78
G.C.V. %9.4711.766.636.4611.698.594.428.592.654.896.6811.23
Ph.C.V. %13.5218.918.928.3114.0512.486.5710.316.038.428.8712.50
Values in bold indicate significance at p < 0.05.
Table 2. Means ± standard deviation, ranges of the 20 genotypes of two seasons and their combined for 25 indices.
IndicesS1S2Combined Data
MinMaxMean ± SDMinMaxMean ± SDMinMaxMean ± SDCV
CT0.9981.0810.989 ± 0.0590.9501.1310.988 ± 0.1070.9801.2130.972 ± 0.0454.60
LWC0.8040.9740.955 ± 0.0670.8310.9100.891 ± 0.0510.8260.9620.913 ± 0.0374.10
RWC0.8070.9500.922 ± 0.0550.7690.8910.889 ± 0.0570.8290.9350.906 ± 0.0363.98
Pn0.7000.9870.895 ± 0.1010.7410.9960.921 ± 0.1180.7211.0500.908 ± 0.0363.97
Gs0.3770.8710.704 ± 0.1630.3860.8810.738 ± 0.2000.3820.9950.722 ± 0.0354.80
Ci0.6570.9170.795 ± 0.0760.6540.9040.808 ± 0.0840.6560.8770.802 ± 0.0323.94
E0.4650.8300.754 ± 0.1220.4330.8500.764 ± 0.1510.4490.9460.760 ± 0.0303.95
Ls0.7450.9810.932 ± 0.3770.7450.9700.901 ± 0.2730.7450.9590.903 ± 0.0495.43
POD0.0721.1460.832 ± 0.7370.0711.1450.825 ± 0.7310.0721.1540.829 ± 0.0445.26
PPO0.0851.1640.768 ± 0.4460.0841.1620.762 ± 0.4420.0851.0680.865 ± 0.0354.00
CAT0.1031.1530.915 ± 0.8070.1021.1970.909 ± 0.8000.1031.6270.912 ± 0.0485.26
GLN0.6930.9200.889 ± 0.0720.7050.9300.904 ± 0.1210.7600.9940.902 ± 0.0364.00
FLA0.6870.9280.884 ± 0.0590.6150.9180.838 ± 0.1100.7030.9200.861 ± 0.0354.02
GLA0.6120.9910.888 ± 0.0970.4490.9700.796 ± 0.1400.6100.9130.826 ± 0.0334.02
LAI0.3290.7120.471 ± 0.1210.3280.6610.551 ± 0.1120.3450.6710.511 ± 0.0224.37
DH0.8380.9480.835 ± 0.0530.8580.9450.934 ± 0.0520.8480.9780.870 ± 0.0424.87
MD0.8480.9110.812 ± 0.0450.7870.9330.837 ± 0.0610.8170.9520.845 ± 0.0364.27
GFD0.6930.9260.779 ± 0.0580.5750.9580.769 ± 0.1200.6940.9830.712 ± 0.0365.06
NS0.5830.7940.752 ± 0.1000.5590.8090.726 ± 0.1010.5960.8130.739 ± 0.0304.06
PH0.7930.8730.855 ± 0.0460.7360.8540.804 ± 0.0760.8240.9280.889 ± 0.0364.05
SL0.7510.9590.911 ± 0.0890.7700.9470.907 ± 0.1940.8030.9590.912 ± 0.0424.65
NSS0.6640.8920.851 ± 0.0870.7540.9130.884 ± 0.0670.7600.8810.857 ± 0.0354.04
NKS0.7640.9790.883 ± 0.0680.7560.9800.927 ± 0.0870.7600.9810.905 ± 0.0363.98
HW0.7110.8170.803 ± 0.0480.7200.8450.828 ± 0.0540.7420.8520.816 ± 0.0334.06
GY0.4440.8940.776 ± 0.0920.4360.8510.704 ± 0.1660.4400.8990.740 ± 0.0334.48
Canopy temperature (CT), leaf water content (LWC), relative water content (RWC), photosynthesis rate (Pn), stomatal conductance (Gs), intracellular CO2 concentration (Ci), transpiration rate (E), stomatal limitation value (Ls), peroxidase (POD), polyphenol oxidase (PPO), catalase (CAT), green leaf number (GLN), flag leaf area (FLA), and green leaf area (GLA), leaf area index (LAI), days to heading (DH), days to maturity (DM), grain-filling duration (GFD), plant height (PH), spike length (SL), number of spikes (NS), number of spikelets (NSS), number of kernels (NKS), thousand-kernel weight (HKW), and grain yield (GY).
Table 3. Eigenvectors and percentage of accumulated contribution of principal components.
PCI1PCI2PCI3PCI4PCI5PCI6PCI7
Eigenvalue9.2214.1572.8292.0531.3521.1381.114
Variability (%)35.46515.98910.8837.8965.1994.3784.283
Cumulative %35.46551.45462.33670.23275.43179.80984.092
Eigenvectors:
CT−0.2100.2000.1620.1580.0560.012−0.305
LWC0.1380.1710.2170.3550.1770.1010.237
RWC0.3100.0600.0010.0160.095−0.169−0.070
Pn0.128−0.195−0.3200.274−0.0380.1480.114
Gs−0.0400.371−0.235−0.111−0.277−0.1250.083
Ci−0.0280.427−0.1510.0230.2140.075−0.090
E−0.0120.390−0.225−0.179−0.160−0.1870.134
Ls0.248−0.0400.165−0.1020.108−0.0710.033
POD0.1020.0700.085−0.314−0.3910.5170.132
PPO0.1810.086−0.236−0.3270.024−0.1220.324
CAT0.225−0.070−0.2560.294−0.0890.1670.014
GLN0.2460.053−0.019−0.3110.1740.150−0.318
FLA0.2330.1750.1310.0650.0650.1710.278
GLA0.1450.098−0.169−0.0010.5590.3710.143
LAI0.193−0.0810.290−0.096−0.2440.1510.009
DH0.2390.0610.145−0.1360.028−0.272−0.352
MD0.2880.0590.1310.0650.093−0.079−0.138
GFD0.186−0.192−0.2610.1680.031−0.194−0.138
NS0.2330.1160.077−0.011−0.0840.157−0.270
PH0.276−0.044−0.133−0.1270.082−0.119−0.034
SL0.2250.1550.1710.044−0.1600.091−0.111
NSS0.0550.0100.392−0.0390.125−0.2730.442
NKS0.0560.2280.1580.438−0.2660.035−0.026
HW0.2570.100−0.0350.168−0.155−0.3370.149
GY0.235−0.142−0.2370.108−0.2540.033−0.023
Canopy temperature (CT), leaf water content (LWC), relative water content (RWC), photosynthesis rate (Pn), stomatal conductance (Gs), intracellular CO2 concentration (Ci), transpiration rate (E), stomatal limitation value (Ls), peroxidase (POD), polyphenol oxidase (PPO), catalase (CAT), green leaf number (GLN), flag leaf area (FLA), and green leaf area (GLA), leaf area index (LAI), days to heading (DH), days to maturity (DM), grain-filling duration (GFD), plant height (PH), spike length (SL), number of spikes (NS), number of spikelets (NSS), number of kernels (NKS), thousand-kernel weight (HKW), and grain yield (GY).
Table 4. The values of comprehensive index (PCIi), index weight, P μ(xi), D and regression D′ for each wheat genotype.
Genotypes The Values of Comprehensive Index (PCIi)Membership Function ValueD
PCI1PCI2PCI3PCI4PCI5PCI6PCI7P μ(x1) P μ(x2) P μ(x3) P μ(x4) P μ(x5)P μ(x6) P μ(x7)Value
DHL12−0.449 1.653 0.442 1.106 0.901 0.023 −0.370 0.508 0.629 0.694 0.708 0.754 0.318 0.381 0.510
DHL02−0.474 4.236 0.920 2.481 −1.287 −0.491 1.226 0.506 1.000 0.780 1.000 0.256 0.195 0.766 0.638
DHL25−0.100 −1.192 0.085 0.607 0.077 −0.143 2.194 0.538 0.220 0.630 0.602 0.567 0.278 1.000 0.458
DHL07−0.455 0.579 −0.132 −0.576 −0.699 −0.814 1.068 0.508 0.475 0.591 0.350 0.390 0.117 0.728 0.451
DHL26−4.260 −2.042 −1.307 −2.225 −0.509 −0.405 0.760 0.178 0.098 0.379 0.000 0.433 0.215 0.654 0.176
Gemmeiza-9−1.151 −0.275 0.927 1.222 1.670 0.183 0.635 0.447 0.352 0.782 0.733 0.930 0.356 0.623 0.458
DHL11−3.398 0.644 2.012 0.148 −1.776 −0.577 −1.813 0.253 0.484 0.977 0.504 0.145 0.174 0.032 0.374
KSU106−3.055 −2.727 0.150 1.117 1.979 2.086 −0.195 0.282 0.000 0.642 0.710 1.000 0.811 0.423 0.293
Gemmeiza-12−3.858 1.622 2.139 −1.332 1.873 −0.452 −0.286 0.213 0.625 1.000 0.190 0.976 0.204 0.401 0.377
DHL01−6.311 −0.143 −2.197 1.552 −0.591 −0.665 −0.435 0.000 0.371 0.219 0.803 0.415 0.153 0.365 0.193
DHL14−0.906 −0.395 −0.419 −1.227 −2.410 2.878 0.532 0.468 0.335 0.539 0.212 0.000 1.000 0.598 0.381
DHL292.112 2.032 −2.439 −1.936 1.441 −0.849 0.989 0.730 0.683 0.175 0.062 0.877 0.109 0.709 0.503
DHL152.674 0.093 −3.411 0.491 −0.425 −0.787 −0.282 0.779 0.405 0.000 0.577 0.452 0.124 0.402 0.480
DHL061.781 −1.032 −2.367 −0.815 0.173 0.159 −1.258 0.701 0.244 0.188 0.300 0.589 0.350 0.166 0.404
Misr11.812 −2.579 1.851 −0.721 −0.101 −0.588 −0.118 0.704 0.021 0.948 0.320 0.526 0.171 0.441 0.476
DHL052.589 2.069 −1.560 1.179 0.565 1.023 −1.944 0.771 0.689 0.333 0.723 0.678 0.557 0.000 0.569
DHL233.730 3.361 1.646 −1.906 0.079 1.464 0.305 0.870 0.874 0.911 0.068 0.567 0.662 0.544 0.686
Sakha-931.116 −0.655 1.634 −1.723 −0.290 −1.305 −1.433 0.644 0.298 0.909 0.107 0.483 0.000 0.124 0.462
Pavone-763.377 −2.693 1.080 0.542 −0.323 −0.456 0.345 0.840 0.005 0.809 0.588 0.476 0.203 0.553 0.543
DHL085.228 −2.556 0.946 2.017 −0.346 −0.282 0.080 1.000 0.025 0.785 0.901 0.470 0.245 0.489 0.638
Table 5. Stepwise regression and path coefficient analyses for grain yield (dependent index) with three yield-related traits (independent indices) for combined data across the two seasons.
SourceStepwise RegressionPath Coefficient
Partitioning the CorrelationR2
Regression Coefficientp-Value R2 Par.R2 Com.Direct
Effect
Indirect
Effect
Correlation
Value
Direct
Effect
Intercept0.6700.033
GFD0.5040.0070.5290.5290.4600.3450.8050.211
SL0.3340.0490.0740.6030.2760.2220.4980.076
CT−0.4660.0090.1360.739−0.437−0.241−0.6770.191
Indirect effect 0.261
Total R2 0.739 0.739
Residual 0.511 0.511
Coefficient partial determination (R2 Par.), cumulative coefficient determination (R2 Com.), Values in bold indicate at significance.
Table 6. The stepwise linear regression analysis was applied to establish optimal regression equation (GY) for predictions, residuals, and evaluation accuracy (%).
GenotypesDependent IndicesGYRegression “GY” ValuePredicted Error ValueRelative Error ValueEvaluation Accuracy (%)
GFDSLCT
DHL120.6940.8451.3150.7690.6890.0810.10589.49
DHL020.6950.8961.2860.7360.7200.0160.02197.86
DHL250.7980.9071.0780.8400.873−0.032−0.03896.16
DHL070.7830.7511.0070.8110.846−0.035−0.04395.72
DHL260.6940.7091.1710.7730.7110.0620.08092.03
Gemmeiza-90.7580.7521.1550.7750.7640.0110.01498.57
DHL110.6060.8701.2930.6480.663−0.015−0.02397.73
KSU1060.6670.7071.1990.6620.683−0.021−0.03296.85
Gemmeiza-120.7090.7941.3000.5450.687−0.142−0.26173.92
DHL010.7250.6401.2500.7290.6660.0630.08691.39
DHL140.7510.8631.1370.8460.8070.0390.04695.36
DHL290.7830.8051.0830.7360.829−0.093−0.12687.37
DHL150.9750.8591.0860.9290.942−0.013−0.01498.57
DHL060.8170.8511.0290.9190.8860.0330.03696.41
Misr10.7830.8501.0820.8200.844−0.024−0.02997.08
DHL050.8520.9291.1980.9200.8510.0690.07592.53
DHL230.7150.8571.0990.7770.805−0.028−0.03696.40
Sakha-930.7570.8631.1850.8140.7870.0270.03396.69
Pavone-760.8980.9031.0900.8690.916−0.047−0.05494.55
DHL080.9290.9291.0220.9510.972−0.022−0.02397.73
Average 94.12
Table 7. Multicollinearity statistics and unidimensional test of equality of the means of the classes of heat group to canonical discriminant function.
StatisticGFDSLCTGY
Multicollinearity statistics:
Tolerance0.3210.6960.4650.278
VIF3.1141.4362.1513.598
Unidimensional test of equality of the means of the classes:
Lambda0.3770.2200.2160.404
F6.19513.31913.5845.536
DF14444
DF215151515
p-value0.004<0.0001<0.00010.006
Table 8. Total canonical structure of eigenvalue, canonical discriminant function, bartlett’s statistic, and class means of heat group to canonical discriminant function.
ParametersCan1Can2Can3
Eigenvalue5.5514.4330.200
Discrimination (%)54.32543.3851.959
Cumulative %54.32597.71099.669
Bartlett’s statistic54.92627.6703.128
p-value0.0000.0010.537
Canonical correlations0.9210.9030.408
Variables/Factors correlations:
GFD−0.4970.6680.543
SL0.4250.8750.062
CT0.732−0.6290.181
GY−0.5050.6730.083
Heat Group
HS−1.659−3.080−0.044
HT−0.0172.0560.312
I−2.9400.6820.667
S3.681−0.9490.173
T−0.3571.088−0.516
Table 9. Posterior probability of membership in heat groupings by linear discriminant analysis.
GenotypesClassificationCross-Validation
PriorPosteriorMembership ProbabilitiesPosteriorMembership Probabilities
Pr(HS)Pr(HT)Pr(I)Pr(S)Pr(T)HSHTIST
DHL12SS0.0000.0000.0000.9990.001S0.0010.0040.0000.9720.023
DHL02SS0.0000.0000.0001.0000.000S0.0000.0000.0000.9990.001
DHL25THT0.0000.5200.0000.0000.480HT0.0000.7030.0000.0000.297
DHL07II0.0080.0010.9550.0000.036HS0.6370.0000.0000.0000.363
DHL26HSHS1.0000.0000.0000.0000.000HS0.9990.0000.0010.0000.001
Gemmeiza-9HSHS0.9280.0010.0290.0000.042HS0.8650.0010.0620.0000.072
DHL11SS0.0000.0000.0001.0000.000S0.0000.0000.0001.0000.000
KSU106HSHS0.9990.0000.0000.0000.001HS0.9930.0000.0000.0000.006
Gemmeiza-12SS0.0000.0000.0001.0000.000S0.0010.0000.0000.9990.000
DHL01HSHS1.0000.0000.0000.0000.000HS1.0000.0000.0000.0000.000
DHL14TT0.0000.1690.0010.0000.830T0.0000.2150.0010.0000.783
DHL29TT0.0010.1120.0430.0000.844T0.0030.1770.1290.0000.691
DHL15II0.0000.1050.8450.0000.050HT0.0000.8940.0000.0000.106
DHL06TT0.0000.1140.2260.0000.660I0.0000.1000.7420.0000.158
Misr1TT0.0000.1880.0080.0000.804T0.0000.2040.0100.0000.787
DHL05HTHT0.0000.7550.0000.0030.242T0.0000.2730.0000.0350.692
DHL23HTT0.0000.1330.0000.0000.867T0.0000.0030.0000.0010.996
Sakha-93TT0.0000.2310.0000.0200.749T0.0010.4180.0000.0250.556
Pavone-76HTHT0.0000.7660.0050.0000.230HT0.0000.6710.0090.0000.320
DHL08HTHT0.0000.8130.0180.0000.170T0.0000.3950.1810.0000.424
Bold letters indicate misclassified wheat genotypes.
Disclaimer/Publisher’s Note: The statements, opinions and data contained in all publications are solely those of the individual author(s) and contributor(s) and not of MDPI and/or the editor(s). MDPI and/or the editor(s) disclaim responsibility for any injury to people or property resulting from any ideas, methods, instructions or products referred to in the content.

