Article

Drying of Prickly Pear (Opuntia ficus-indica (L.) Miller) and Its Potential as a Solid Biofuel

by
Guillermo San Miguel
*,
Diego Fernández-Olmedilla
and
Francisco Sánchez-Godoy
Grupo Agroenergética, Department of Chemical and Environmental Engineering, ETSII, Universidad Politécnica de Madrid, C/José Gutiérrez Abascal 2, 28006 Madrid, Spain
*
Author to whom correspondence should be addressed.
Agronomy 2022, 12(9), 2231; https://doi.org/10.3390/agronomy12092231
Submission received: 25 August 2022 / Revised: 13 September 2022 / Accepted: 16 September 2022 / Published: 19 September 2022

Abstract

:
Prickly pear is a species that shows great capability to grow in harsh environments with potential for being used as an energy resource. The aim of this paper was to characterize prickly-pear mature cladodes in terms of chemical, proximal, and fuel properties, as well as to study the drying kinetics of this biomass after pretreatments destined to expose the internal tissues of mature cladodes to different temperatures. The results show that prickly-pear biomass was a poor-quality solid biofuel due to a low calorific value (12.9 MJ/kg d.m.b.) and a high ash content (25.8 wt.%). When drying prickly-pear biomass, cutting the cladodes to expose the internal tissues significantly increased the drying rate, especially when temperatures of 60 °C and above were employed. Double exponential (three parameters) and Midilli were the models that best fitted the experimental curves of prickly-pear cladodes cut into straps and cubes when dried at 50–70 °C. Finally, the bulk density of the prickly-pear biomass was similar to the one obtained for herbaceous biomasses, thus suggesting that further densification will enhance the usability of this feedstock.

1. Introduction

Biomass resources in arid and semiarid lands are scarce due to lack of water and poor soil quality. Prickly pear (Opuntia ficus-indica (L.) Miller) is a member of the cactaceae family that shows great capability to grow in these harsh environments based on several morphological and physiological adaptations: the adoption of the Crassulacean acid metabolism (CAM) which allows nocturnal uptake of CO2 (thus avoiding the opening of stomata during the warmer hours of the day), the presence of a complex hydrocolloid (mucilage) capable of storing great amounts of water in the parenchyma tissues, and a vegetative form consisting of a succession of flat photosynthetic stems (cladodes) with low density of stomata and covered by an almost impermeable epicuticular wax layer [1,2].
Prickly pear is mainly cultivated for the production of edible fruits (the prickly pears, sensu stricto) but also to obtain tender cladodes for human consumption (nopalitos) and mature cladodes employed as forage for cattle, among other uses. There are two main approaches for the cultivation of prickly pear. Traditional management implies the extensive cultivation of prickly pear in wastelands with poor quality soils where no other crop can succeed and almost without any further agricultural practices or inputs. Biomass yields achieved in these conditions are very limited (typically below 5 MgDM/ha·year, depending primarily on rainfall, soil fertility, and specific management [1]) and so are the fodder resources and fruit yields obtained.
Modern intensive prickly-pear plantations are designed to achieve higher production yields and may be applied in lands with a certain degree of water availability. Under these circumstances, a more diligent management of the crop is carried, usually involving the use of large amounts of fertilizers and phytochemicals to reach productivities up to 50 Mg DM/ha·year [2,3].
The use of prickly pear as an energy crop can follow both approaches, but an improved version of the traditional management (in terms of appropriate fertilization and weeding) could allow for reaching the potential yields for the existing rainfall levels, while improving the energy balance of the bio-system. Furthermore, it implies a reduced competition for the land between crops destined to food and those destined to energy, as none of the essential rainfed crops can stand such harsh rainfed environments as prickly pear.
Consistent with a composition rich in mucilage carbohydrates and starch, while poor in lignin, research on energy applications for prickly-pear biomass has focused on the production of biogas and bioethanol. Biogas production from this feedstock has gathered certain scientific attention since the 1980s, and conclusions reported in literature [4,5,6,7,8,9,10] encourage the industrial development of prickly-pear anaerobic digestion. Bioethanol from prickly-pear cladodes has been less investigated and, though it seems promising (with obtained yields up to 163 L/Mg DM), it still faces uncertainties related to the low fermentation yields of carbohydrates (many of the pentoses present in the mucilage and hemicellulose hydrolysis), the low concentration of ethanol in the brew, and the energy balance of the process [1,9,11,12,13,14].
The use of prickly pear directly as a solid fuel for thermal applications (either direct combustion, gasification, or pyrolysis) has not been reported in the scientific literature, and it is very rarely described in practice. This is mainly due to its high moisture content, limited availability, and due to its more valuable use as animal fodder in water-deprived environments. However, new business initiatives looking into alternative fuels in arid and semiarid locations are starting to show interest in this type of biomass whose yields in sustainably managed crops may be sufficient for domestic and commercial exploitation. To evaluate the fuel potential of this biomass, information needs to be available about its heating values, ash content, composition, and most importantly, its drying behavior. Extended knowledge about moisture elimination may also be of interest to promote the use of this type of biomass in other potential applications, such as animal feeding.
The drying of prickly-pear tender cladodes aimed for human consumption has been investigated in some research papers [15,16,17,18,19,20,21]. However, no information is available regarding the drying of fully developed cladodes, which may be more suitable for use as a solid biofuel. Besides size and weight, mature cladodes differ from tender ones in their lower protein and ash contents and higher fiber contents [22], although the most important issue related to drying kinetics is the progressive development as the cladode grows older of a waxy cuticle over its epidermis [23]. This cuticle reduces transpiration and avoids the dehydration of the plant, becoming a major obstacle in the drying of this material. It has been reported that exposing the internal tissues of tender cladodes facilitates their drying process [18], and the same may occur when drying mature cladodes.
The aim of this paper is to characterize prickly-pear mature cladodes in terms of chemical, proximal, and fuel properties, as well as to study the drying kinetics of this biomass after a pretreatment destined to expose the internal tissues of mature cladodes to different drying temperatures.

2. Materials and Methods

2.1. General Description of the Biomass

Cladodes from a spineless Opuntia ficus-indica ecotype were collected from feral (naturalized) specimens in the Madrid region (40°18′ N 3°55′ O). Mature, terminal, fruitless cladodes were chosen, as this would be the biomass element harvested in a dedicated prickly-pear energy crop. To ensure a representative sampling, mature cladodes of different sizes were selected for collection, which were subsequently characterized for their length (L), diameter at wider point (D), and fresh weight.

2.2. Drying Stage

2.2.1. Experimental Design

Drying experiments were carried out considering two cutting geometries (straps and cubes) and three drying temperatures (50, 60, and 70 °C) following a complete factorial experimental design (2 × 3). An additional set of experiments was carried out for comparative purposes by drying complete cladodes (as collected) at the highest temperature (70 °C). For each one of these conditions, cladodes of two different sizes were tested: the small mature cladode (B1); and the large mature cladode (B2). The results in this investigation represent the average of these duplicate values.
Fresh cladodes were cut into straps or cubes. Straps (2 cm wide) were cut parallel to the major axis of the cladode (sagittal axis). Cubes (2 × 2 cm) were made by cutting the straps into pieces (Figure 1).
The flat surfaces of the cladodes are known as faces, which are covered by an epidermal tissue that hinders water evaporation in the natural plant. The face area of each cladode was estimated using the equation proposed by Saiz (Equation (1)) [24].
S ( cm 2 ) = 0.769 × L ( cm ) × D ( cm )
To estimate the area of epidermis exposed to the drying process, only the upper face of the cladode was considered. The lower face is resting flat on a waterproof surface (parchment paper) which has been assumed to avoid any kind of moisture transference during the experimental trials.
Cutting the cladode into straps or cubes exposes its internal tissues (parenchyma and chlorenchyma), allowing moisture to be released through spaces other than the original epidermis. The surface area of internal tissue exposed by cutting cladodes into straps was estimated as follows. The strap thickness was measured with a caliper at both extremes (Tp, Td) and at its half-length (Th). The exposed surface was calculated as the area covered by the resulting two trapezoids sharing a common base (Th) (Figure 2). This procedure was carried out for each one of the cladode straps (two exposed faces each, except for the ones on the cladode sides) so the total surface area of the exposed parenchyma and chlorenchyma tissues (SSp+c) could be estimated, as shown in (Equation (2)).
S S p + c = i = 1 n L s i 2 × ( 2 T h i + T d i + T p i ) 2
where n is the total number of exposed faces, and Ls is the length of each strap.
For the estimation of the exposed surface area when cutting the cladode into cubes, each one of the exposed faces of the cube was considered as a trapezoid. The total cladode exposed surface was estimated, as shown in Equation (3):
S C p + c = i = 1 n W i × ( T 1 i + T 2 i ) 2
where n represents the total number of exposed faces (considering all the cubes generated), T1 is the thickness of the cube face at the thickest point, T2 is the thickness of the cube face at the thinnest point, and W is the average width of the surface (Figure 3). Internal cubes show four faces of exposed tissues, while perimeter cubes may show two or three faces (as in Figure 3), depending on their relative position in the cladode.

2.2.2. Drying Process

Drying was carried out in a forced-air oven (Carbolite AX60) with variable, automatically regulated air speed (0.33 cm/s at oven fan at 100 °C). Ambient relative air humidity measured using a digital hygrometer was 35.5 ± 1.5% throughout the whole experimental phase. The samples were resting flat on parchment paper foil over one of their faces. The cladode pieces (straps or cubes) were separated by at least 1 cm to ensure free air flow between each of the pieces. The mass of the cladodes was periodically measured (interval times depending on trial temperature and cutting geometry) until constant weight (We). Finally, the moisture content of the oven-dried samples (equilibrium moisture content, Xe) was determined in a thermobalance (MB-100, PCE Group).
Drying curves were built considering moisture ratio (Rx) versus time. Rx is a dimensionless parameter whose values are determined using Equation (4).
R x = ( X t X e ) ( X 0 X e )
where Xt represents moisture content at time t (wt%), Xe is the equilibrium moisture content (wt%), and X0 is the initial moisture content of the sample (wt%). Once Xe is determined, Equation (5) can be used to calculate the weight of the dry sample (Wd).
W d = W e ( 1 X e 100 ) ( g )
Xt may then be calculated as in Equation (6).
X t = W t W d W d ( w t % )
where Wt is the sample weight at time t. Finally, X0 may be calculated similarly following (Equation (7)):
X 0 = W 0 W d W d ( w t % )
where W0 is the initial sample weight.

2.2.3. Drying Models

The fitting of experimental results on a series of empirical drying models (Table 1) was evaluated.
In addition, the correlation of experimental results with a simple diffusion model based on Fick’s second law of diffusion [36,37] was also tested (Equation (8)).
R x = 8 π 2 e ( π 2 4 × D e f f C 2 × t )
where Deff is the diffusion coefficient (diffusivity) of moisture in solids (m2·s−1) under the drying temperature conditions tested, and C is the average thickness of the cladode (m).
Calculations were carried out using the Statgraphics Centurion XVI software and determination coefficients (R2) as well as the standard errors of the estimate (SEE), and the mean absolute errors (MAE) were obtained for each model at each experimental condition.

2.3. Chemical, Physical, and Fuel Characterization of Dried Cladodes

A representative selection of cladode cubes obtained in the drying experiments were characterized for their chemical, physical, and energy properties to assess the fuel potential of this biomass.
Table 2 describes the standard methods employed to characterize this material. Proximate and density analyses were conducted on the samples as produced. This included duplicate samples of B1 and B2 cladodes. Elemental, calorific, and thermogravimetric (TGA) analyses required grinding/milling of the solids to a particle size below 0.5 mm. Each of these samples was analyzed at least in duplicate, and the values reported in this paper represent the average of these determinations. Results variability in terms of standard deviation (σ) or relative standard deviation (RSD) have been reported in the results section. TGA analyses of the different tissues (epidermis, chlorenchyma, and parenchyma) were carried out after separating by hand the different fractions of a cladode as harvested. These tissues were oven dried at 70 °C and stored in a desiccator prior to being analyzed.

3. Results

3.1. Characterization of Prickly-Pear Cladodes

The prickly-pear cladodes from the B1 batch (small mature cladodes) had fresh weight of 471.53 ± 69.7 g, diameter at the wider point of 15.5 ± 1.2 cm, and length of 31.5 ± 6.0 cm. The cladodes from the B2 batch (large mature cladodes) had fresh weight of 788.5 ± 95.6 g, diameter at the wider point of 19.2 ± 1.5 cm, and length of 40.5 ± 2.9 cm.
Table 3 shows the elemental composition of the prickly-pear cladodes. When compared to lignocellulosic biomass, the prickly-pear elemental composition shows a lower C content and a significantly higher concentration of alkaline (primarily K) and alkaline earth (primarily Ca) elements. Due to the low boiling temperatures of alkaline salts, the presence of K and Cl typically implies a high potential for the formation of slagging and/or fouling in boilers, while Cl and S may create major corrosion problems. This biomass also showed a high content in Ca that may be able to partly mitigate the negative effects of K [47]. This Ca content was associated with the presence of high amounts of calcium oxalates and free calcium in the parenchyma tissues [48,49]. Chlorine (Cl) content was also very high and may lead to the production of chlorinated aromatics (dioxins and furans) and corrosive HCl during combustion [50]. Nitrogen content was also higher than those typically reported for woody materials but low when compared to proteinaceous biomasses.
When compared to literature, Ca and K values were at the top of the ranges reported by other authors for prickly-pear cladodes (2.8–7.8 wt% dmb and 0.4–4.7 wt% dmb, respectively). Regarding P, the content observed in the samples investigated was higher (400–1800 ppm), while Mg content was lower (1900–24,000 ppm) (various authors, in [9]). The reported literature showed a significant variability in the elemental composition of prickly-pear biomass, especially regarding minor components. This has been attributed primarily to differences in soil composition which are, in turn, related to the agricultural practices as explained in the introduction of this work. The composition of plants cultivated using traditional management is poor in proteins (and, therefore, in N) and depends primarily on the elemental composition of the soil. On the contrary, cladodes produced in profusely fertilized intensive prickly-pear plantations usually accumulate a wider range of inorganic elements brought in by the fertilizer.
If intended for use directly for thermal applications, the management of prickly-pear plantations should try to find an equilibrium between the level of fertilization required to achieve high biomass yields and the limited amount of mineral elements tolerable in boilers and furnaces.
As expected from their elemental composition, proximate analyses of prickly-pear cladodes revealed a high ash content (25.8 ± 2.0%, as shown in Table 4), even compared to values reported in literature (10–23 wt%, dmb). The variability in the proximate composition of the samples (including small B1 and large B2 cladodes) was limited, evidencing the homogeneous nature of the material. The high ash and oxygen contents (1.26 O/C ratio) and the low lignin concentration were responsible for the limited calorific value of this biomass. The fiber contents of the employed cladodes fall within the ranges published in literature for hemicellulose (4–23 wt%, dmb) and lignin (2–7 wt%, dmb), while they were comparatively lower for cellulose (10–22 wt%, dmb) and starch (8–23 wt%, dmb) (various authors in [9]). This may suggest the presence of high amounts of mucilages, compounds rich in carbohydrates that could represent more than 20 wt% of dry cladodes [51,52].
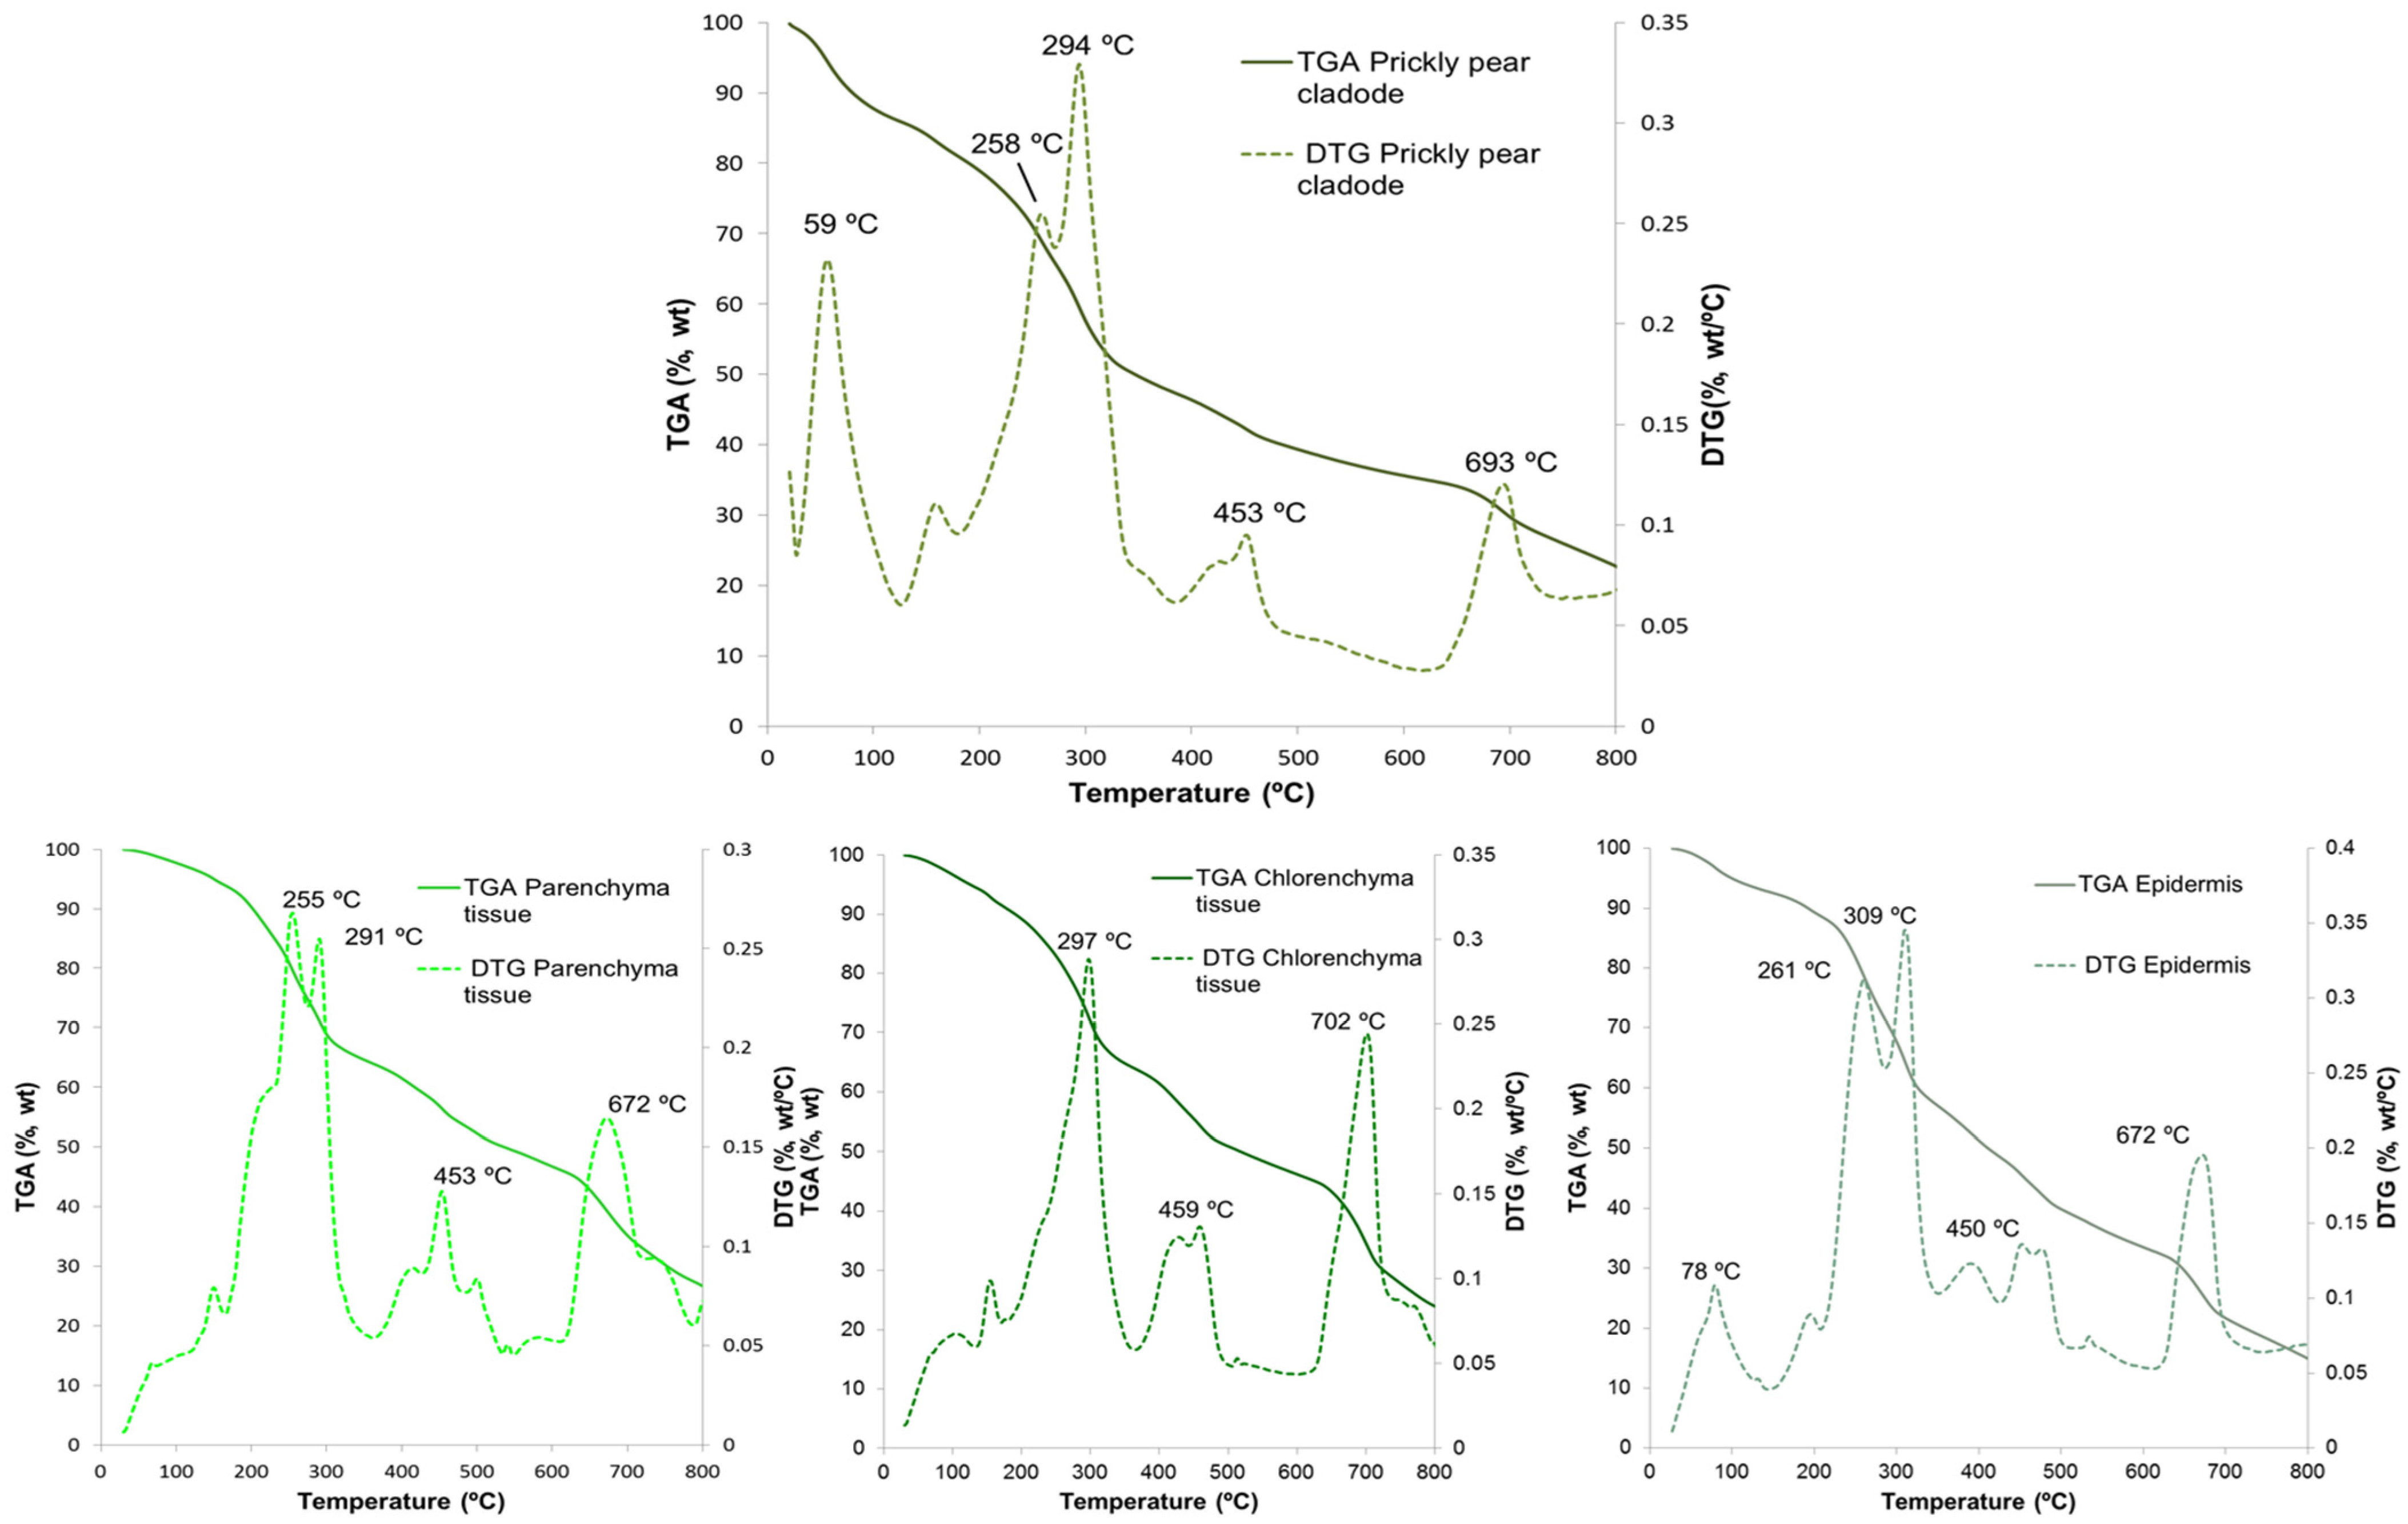
Figure 4 shows the TGA/DTG analyses of the three separated cladode tissues (parenchyma, chlorenchyma, and epidermis) and the ground/milled cladode sample. The results showed three main areas of weight loss. The first one takes place at temperatures below 200 °C and corresponded to the elimination of free moisture and the chemical dehydration of polysaccharides. The second one, at temperatures between 200 °C and 400 °C, was attributable primarily to the thermal degradation of polysaccharides. DTG plots for parenchyma and epidermis showed two differentiated peaks in this step. The first one corresponded to the maximum degradation rate of hemicellulose at 255 °C in the parenchyma tissue and 261 °C in the epidermis. The second one was mainly associated with the degradation of cellulose and appeared at 291 °C in parenchyma tissue, 297 °C in the chlorenchyma, and 309 °C in the epidermis [53]. The first peak in the chlorenchyma is almost indistinguishable, which suggests a limited hemicellulose content in this tissue.
Finally, the gradual mass reduction in the solid fraction observed at temperatures between 400 °C and 700 °C was attributable to the progressive carbonization of thermally resilient components (lignin), as well as to the degradation and volatilization of heavy tars and inorganic compounds. Mass losses associated with the transformation of oxalates into carbonate may be responsible for the peaks observed at 450–459 °C [54,55], while peaks at 672–702 °C could be related to the volatilization of chlorinated salts and the degradation of carbonates [54].
The TGA/DTG plots of the unfractionated cladode biomass appeared as a combination of the three tissues. Moisture loss in this sample was comparatively higher (with DTG maxima at 59 °C) due to the hydrophilic nature of this material that led to water absorption when the ground/milled biomass was stored at room conditions.

3.2. Drying of Prickly-Pear Cladodes

The equilibrium moisture contents (Xe) of the samples at 50 °C, 60 °C, and 70 °C were determined as 0.04 ± 0.003, 0.03 ± 0.001, and 0.03 ± 0.001 (kg H2O/kg DM), respectively. These values were similar, though slightly lower, to the ones reported by [17,21] for tender prickly-pear cladodes at similar temperatures and relative ambient moisture contents (0.05–0.06 kg H2O/kg DM). This was probably due to the osmotic pressure provided by the higher content of soluble components in tender cladodes when compared to mature ones.
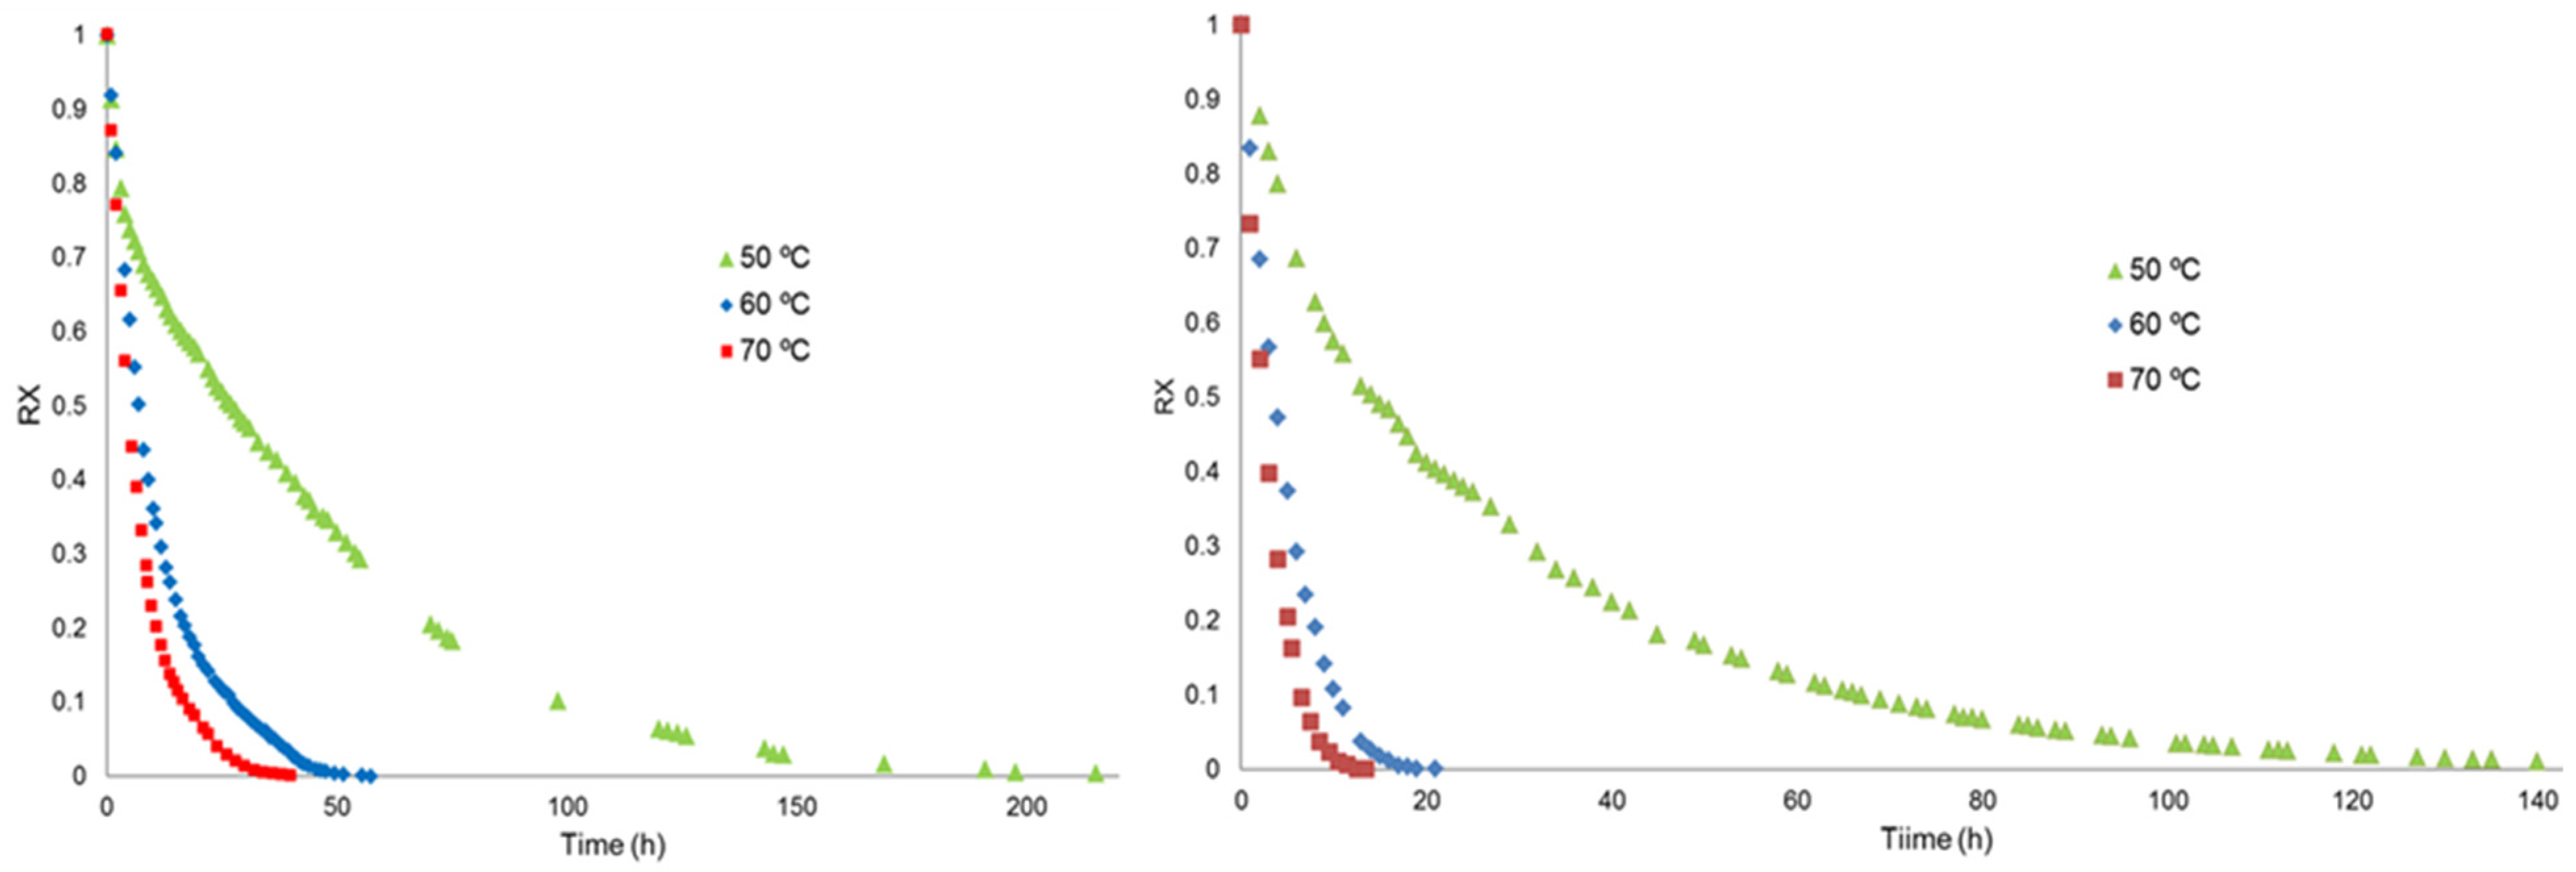
Figure 5 shows the drying curves of prickly-pear cladodes (cut into straps and cubes) at different temperatures. Similar patterns were found for both cutting geometries. Regarding curves at 60 °C and 70 °C, a rapid moisture loss could be observed in the first hours represented by parallel and almost linear tendencies with noticeable slopes. As the process moved forward, the curves tendency turned asymptotic towards Rx ≈ 0. Drying curves at 50 °C showed a more progressive tendency, even at the first hours, resulting in significantly higher drying times.
The variability between results obtained at each experimental condition (expressed as the average standard deviation of the moisture ratio—Rx) was 0.02, 0.01, and 0.01 for straps dried at 50, 60, and 70 °C, respectively, and 0.04, 0.02, and 0.04 for cubes dried at 50, 60, and 70 °C, respectively.
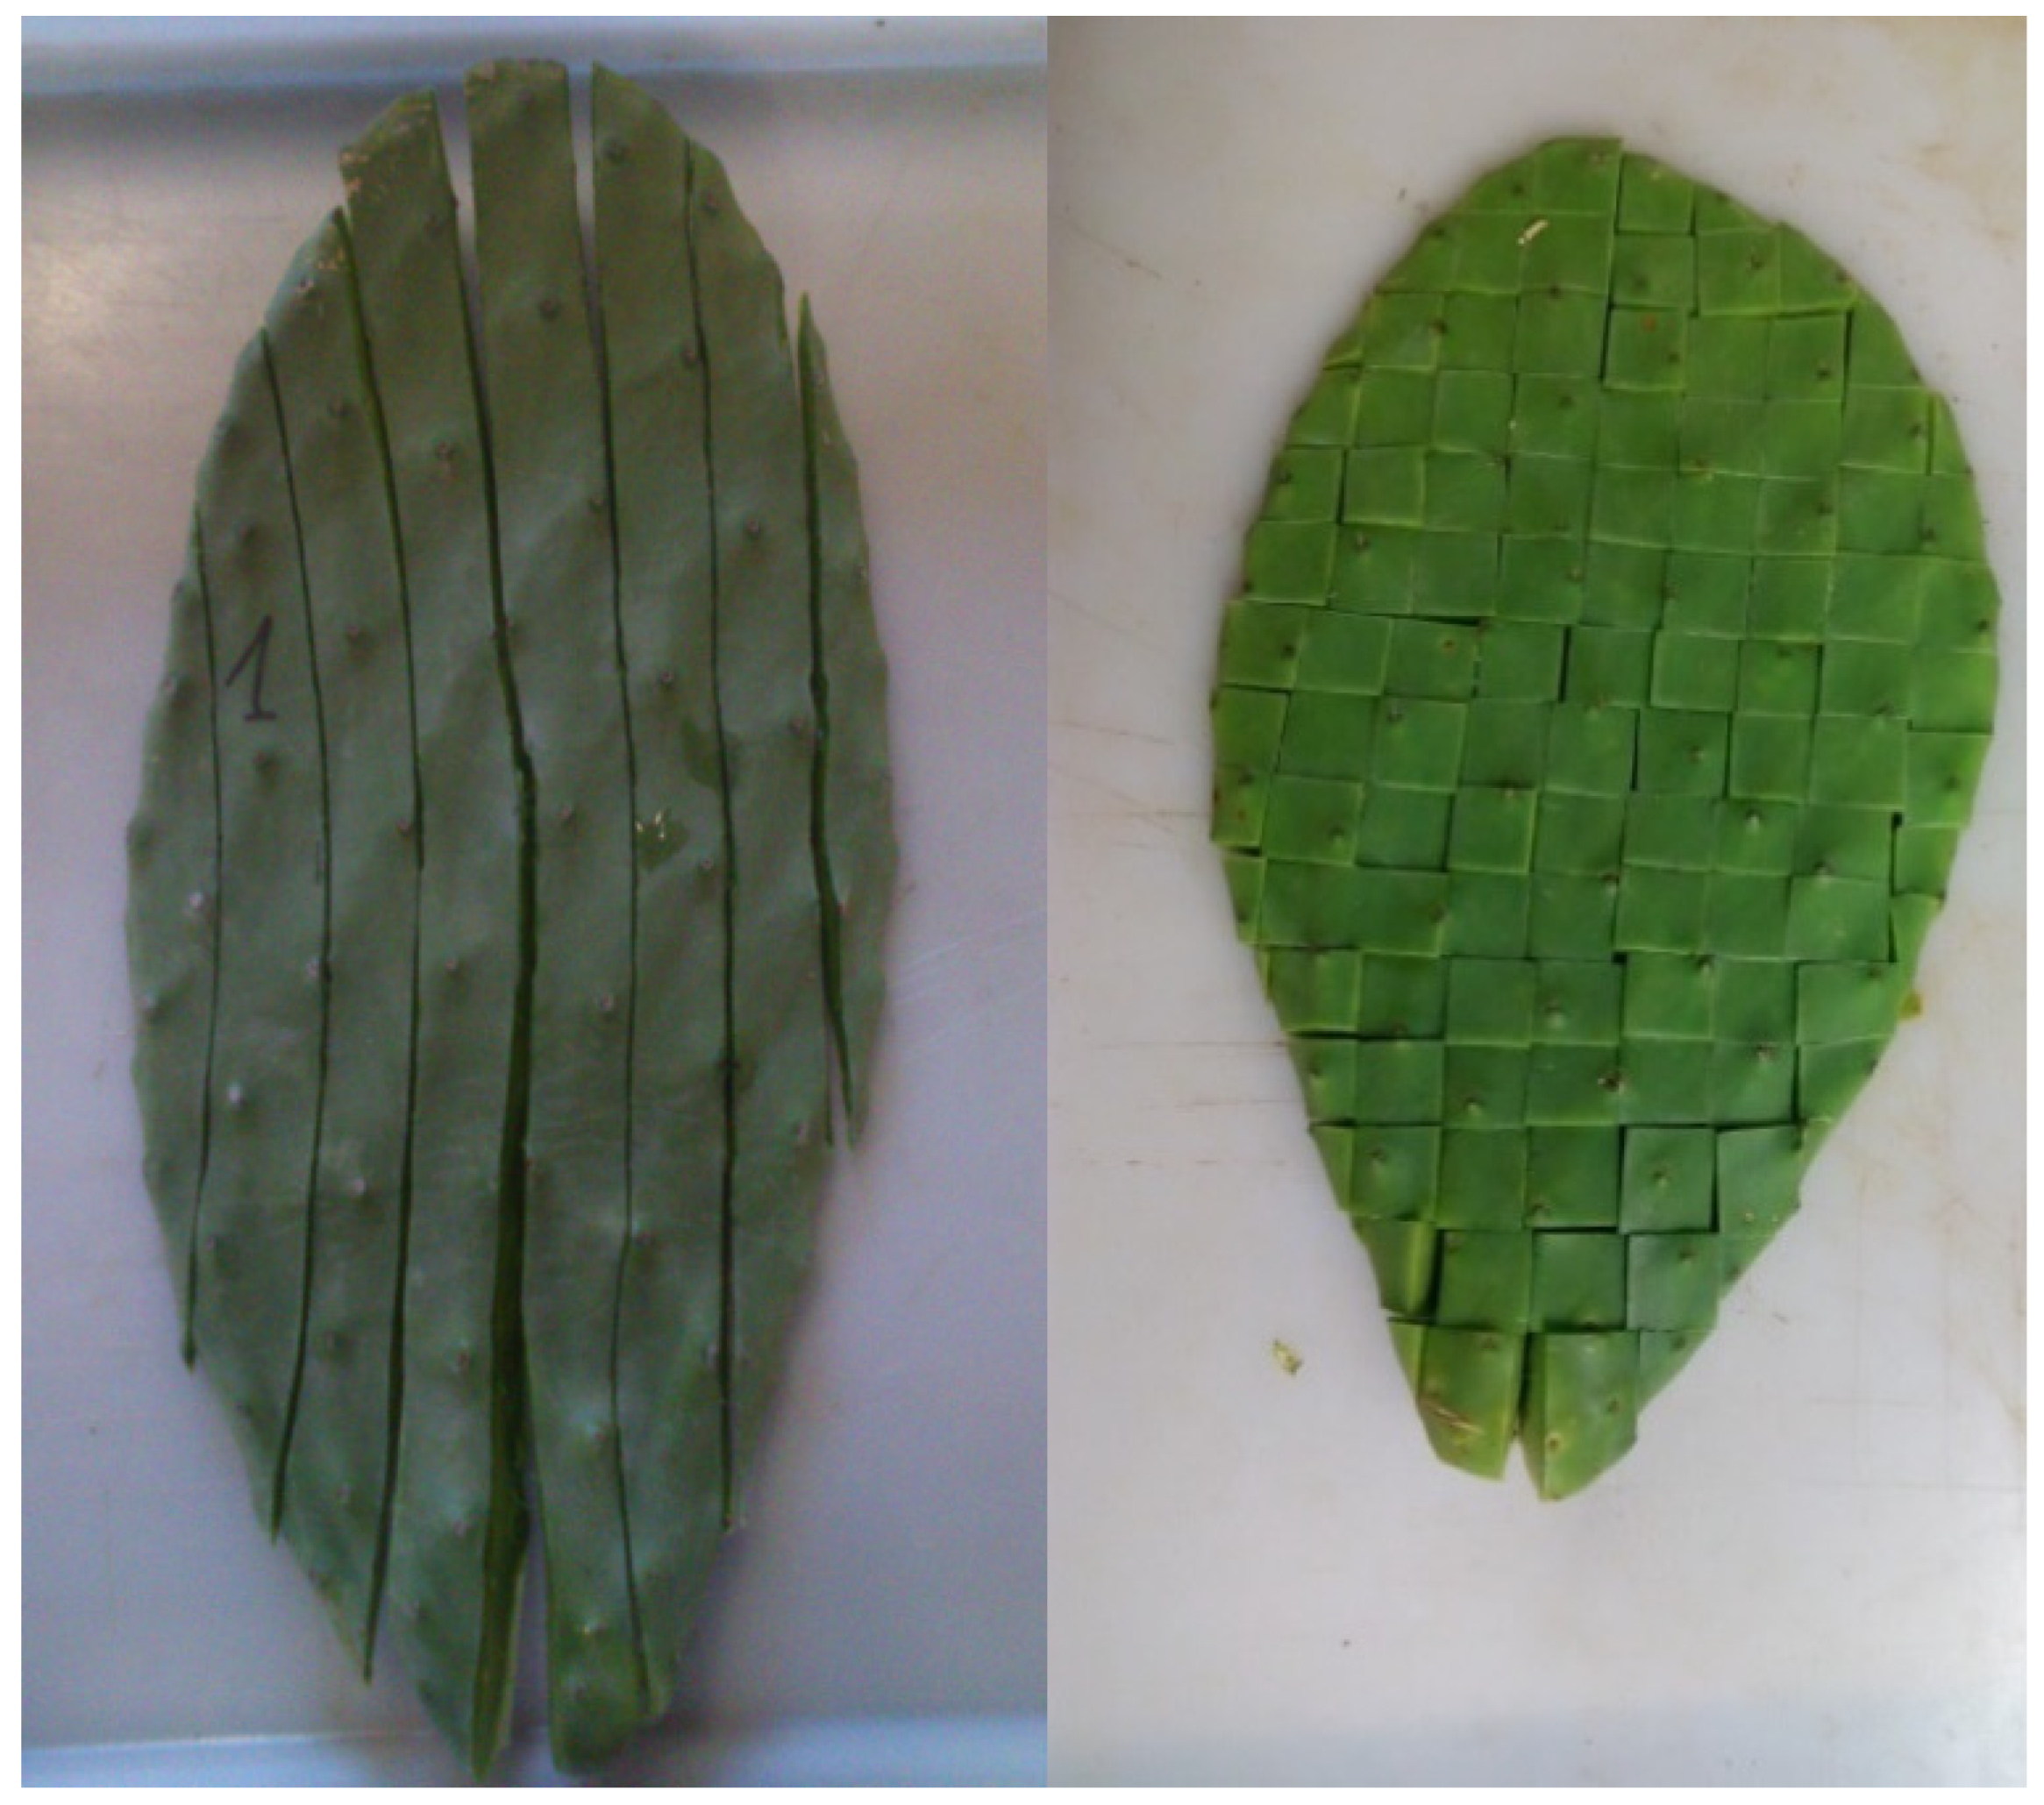
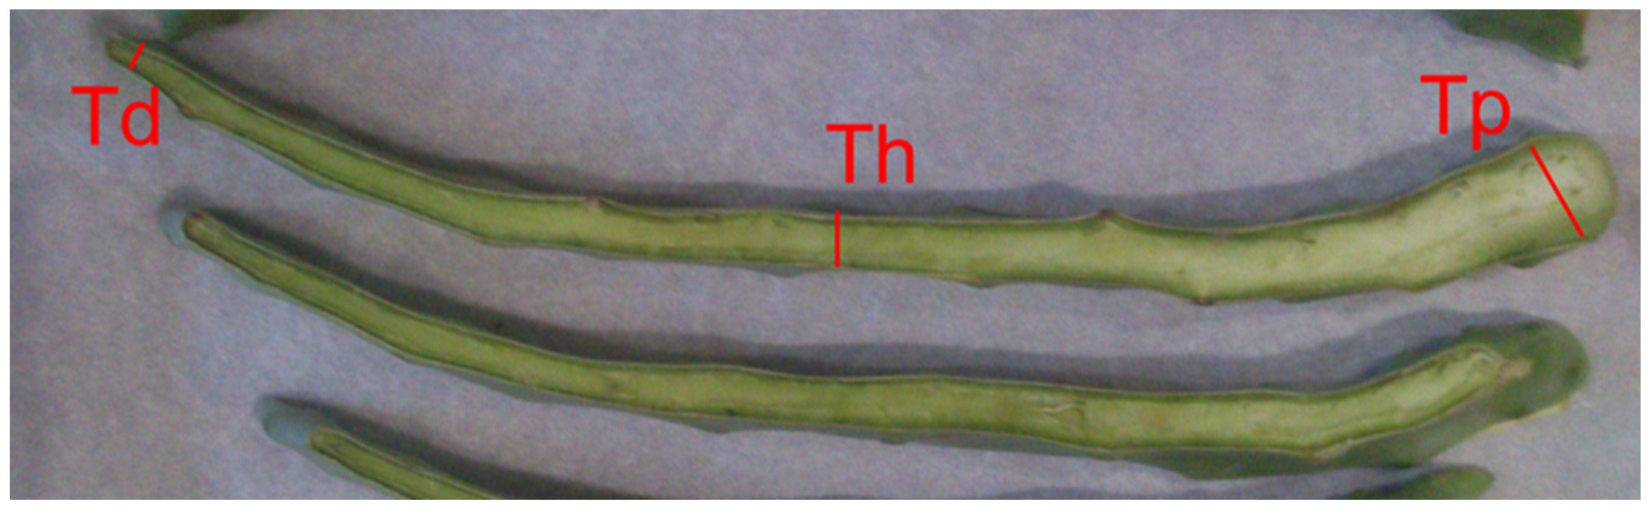
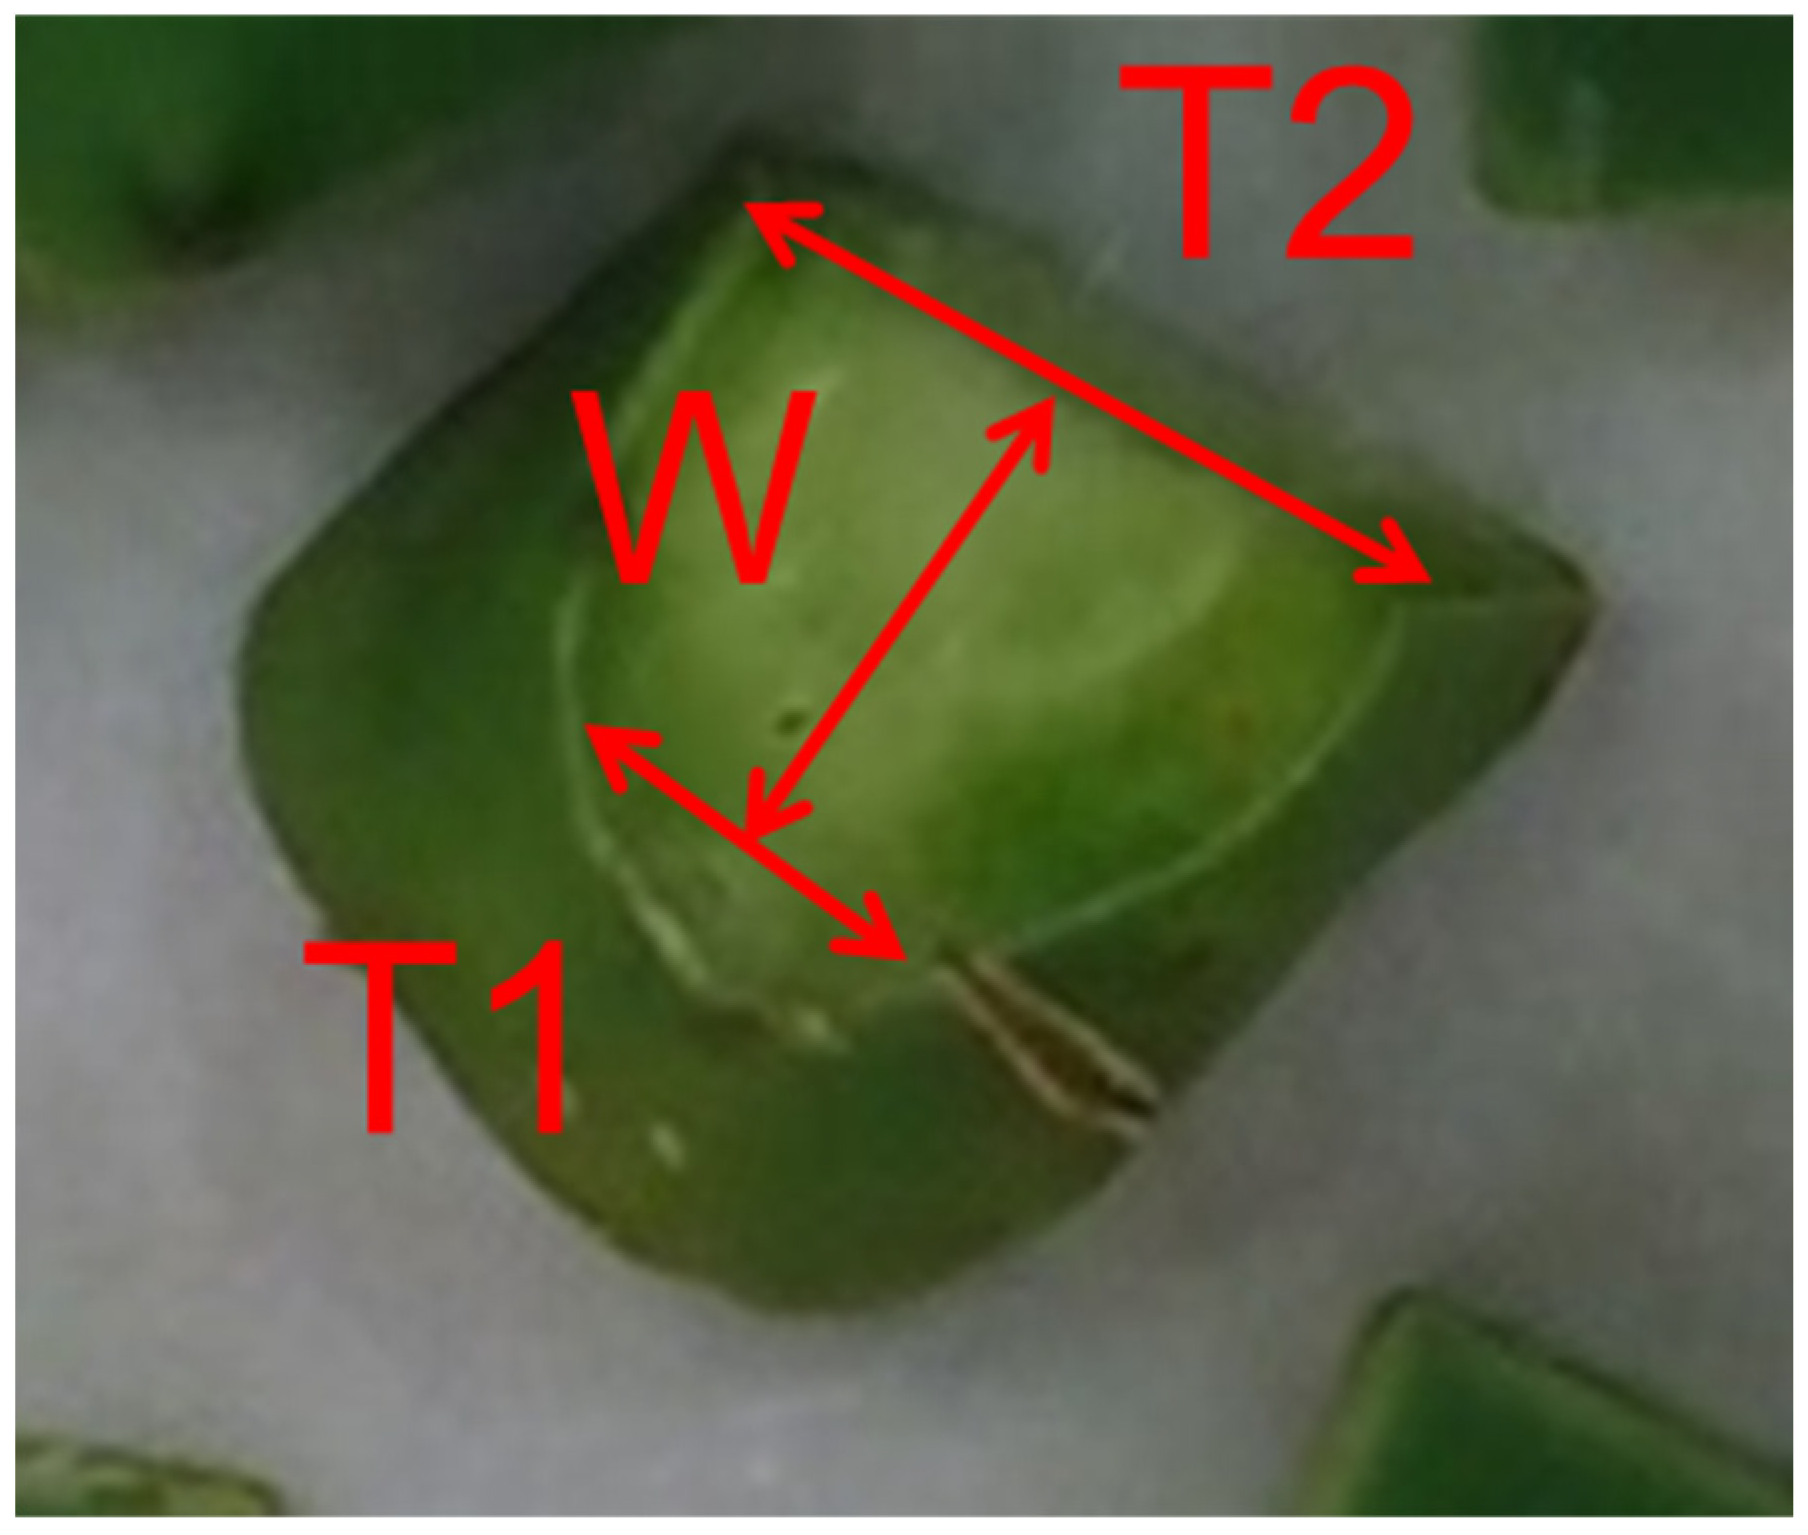
When cutting the cladodes into straps, the exposed surface of parenchyma and chlorenchyma tissues (expressed as the exposed surface to fresh-weight ratio) represented between 49 and 57% of the total cladode’s surface subjected to drying, while this value increased to 70–74% when cladodes were cut into cubes (Table 5). Exposed surfaces and moisture-loss rates were, respectively, 2.0–2.3 and 1.6–2.3 times higher when cladodes were cut into cubes than when they were cut into straps. The highest moisture-loss rate (31.9 g/h) was found for cladodes cut into cubes and dried at 70 °C, being 26% higher than the one found for the same cutting geometry at 60 °C, and 9.4 times higher than the one determined for cladode cubes dried at 50 °C. Whole cladodes dried at 70 °C showed the lowest moisture-loss rate, representing 11% of the one found for cladodes cut into straps and dried at the same temperature and 81% of the one determined for cladode cubes dried at 50 °C.
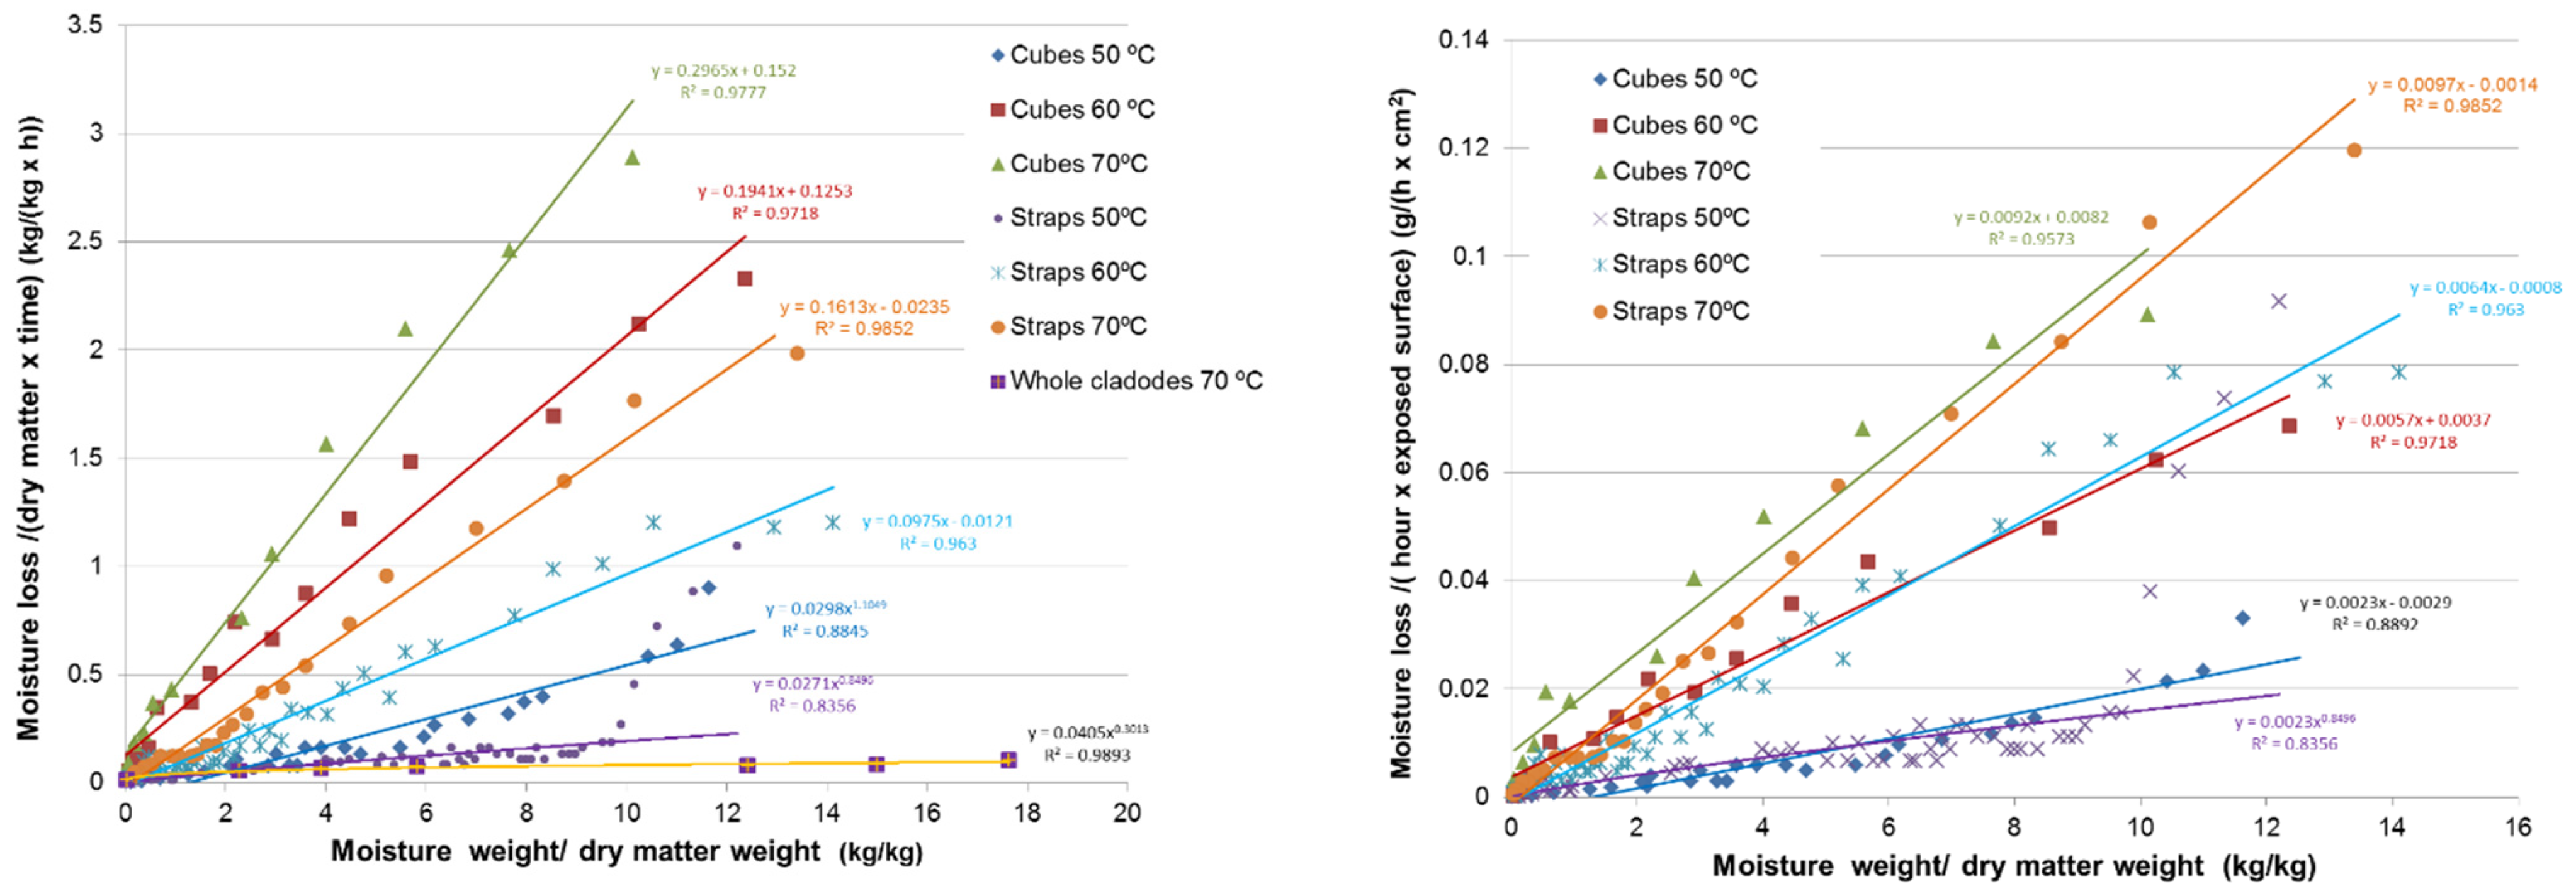
Figure 6 (left) shows the drying rates (expressed as moisture loss per unit of dry matter and time) of the prickly-pear cladodes cut into different geometries and dried at different temperatures, along with their tendency lines. Whole cladodes showed the lowest drying rates followed by cladode straps and cubes dried at 50 °C. At the other end of the spectrum, cubes dried at 70 °C and 60 °C reached the highest drying rates. The results showed how it was increasingly difficult to reach high drying rates when the moisture content in the cladode diminished. The tendency lines of the experimental results followed a power tendency (y = axb) when mild conditions were employed, although the asymptotic range of the function at the determined moisture-weight to dry-weight ratios (MW/DW), was only visible for the one representing the drying of whole cladodes. This implies that when the internal tissues of the cladodes are exposed to drying air, there is a clear response of the drying rate to the MW/DW ratio. At more severe drying conditions (cubes and straps at 60 °C and 70 °C), this phenomenon was utmost clear, as the tendency lines fitted into linear functions (R2 = 0.96–0.99) even better than into power ones (R2 = 0.93–0.96). According to [15,19], this predominance of the falling rate period implies that the drying process was mainly controlled by water diffusion (same as what happens when drying tender cladodes, as reported by the cited authors) while the constant-rate period observed at high MW/DW values for whole cladodes dried at 70 °C is governed by convection.
To study the effect of temperature over the moisture-loss rates without considering the effect of the cutting geometry, Figure 6 shows the rates of moisture loss per unit of exposed tissues surface (along with their tendency lines). If rates were compared at the maximum common value for MW/DW (10.1), the rates of moisture loss per unit of exposed tissues surface increased with temperatures from ca. 0.03 g/(cm2 h) at 50 °C to ca. 0.1 g/(cm2 h) at 70 °C.

3.3. Drying Modeling

The determination coefficients (R2) and the adjustment errors of the different drying models tested were included in Appendix A (see Table A1). All models fitted quite well with the experimental data (R2 ≥ 0.94, SEE ≤ 0.06, MAE ≤ 0.05) with the exception of the Wang and Sing model when applied to data from straps dried at 50 °C (R2 = 0.74–0.87). On average (considering the three tested temperatures), the double exponential with three parameters and the Midilli models achieved the higher determination coefficients for straps (0.997) and cubes (0.999), respectively. The coefficients belonging to these models that allowed us to build the empirical functions that best represent the drying kinetics of prickly-pear cladodes under the tested conditions are shown in Table 6.
The modeling of the drying kinetics of tender cladodes had been previously reported in literature. López et al. [18] found the best fit for the double exponential (four parameters) model when drying whole and partially peeled cladodes at temperatures between 35 and 60 °C, while both Díaz-Ayala et al. [15], and Taouil et al. [21] found better fits for the Midilli model when drying cladode straps (thickness = 0.4 cm) and cubes (1 × 1 cm), respectively, at the same temperatures. These results, together with the ones obtained in the present work, suggest that optimum results are achieved with functions that include at least three parameters when a wide range of models are tested to describe the drying kinetics of cladodes.
The diffusion coefficient values (Table 7) increased along with drying temperatures and the surface area of exposed tissues. The obtained values were significantly lower than those obtained for tender prickly-pear cladodes by [20] (0.82 × 10⁻⁷–3.25 × 10⁻⁷ m2/s) but fell within the range compiled by [56] for vegetables and foodstuff (10−12–10−8 m/s). When drying cladodes at 60 °C and 70 °C, the obtained values (2.0 × 10⁻⁹–6.5 × 10⁻⁹ m/s) were similar to those found for thyme biomass dried at 50–60 °C (3.4 × 10⁻⁹–6.0 × 10⁻⁹ m/s) [57], spinach dried at 60–70 °C (1.0–1.5 × 10⁻⁹ m/s) [58], and Chenopodium ambrosioides L. dried at 60 °C (4.5 × 10⁻⁹ m/s) [59]. Diffusion coefficients obtained for cladodes dried at 50 °C are similar to those found for another succulent species, Aloe barbadensis Mill., dried at 50–70 °C (5.3–11.3 × 10⁻¹⁰ m/s) [60].

3.4. Bulk Density of Prickly-Pear Dry Cubes

The average bulk density of dry cladode cubes was 150 ± 3.6 kg/m3. This value is higher than the ones found for different milled herbaceous biomasses (60–82 kg/m3) by [61], while similar to those reported for pine sawdust [62] and milled Phalaris arundinacea L. [63]. These values are much lower than the ones commonly determined in commercial quality pellets (≥600 kg/m3), suggesting the need of further densification of this biomass to avoid disproportionate transportation costs.

4. Conclusions

  • When compared to biomass commonly used for thermal purposes (wood), prickly-pear mature cladodes have lower calorific value and a much higher content in ashes. Alkaline species, particularly Ca and K, represent a significant percentage of prickly-pear biomass elemental composition. Consequently, prickly-pear mature cladodes are a poor-quality biofuel for thermal applications.
  • When drying prickly-pear biomass, cutting the cladodes and exposing the internal tissues significantly increases the drying rate, thus reducing the time necessary to complete the process.
  • Regarding drying temperature, there is a great response to this parameter in terms of drying time, drying rate, and diffusivity when its value increases from 50 °C to 60 °C.
  • Double exponential (three parameters) and Midilli are the drying models that best fit the experimental drying curves of prickly-pear cladodes cut into straps and cubes when dried at 50–70 °C.
  • Bulk density of dry cladode cubes is similar to the one reported in literature for sawdust and milled herbaceous biomasses.

Author Contributions

Conceptualization, G.S.M. and F.S.-G.; methodology, G.S.M. and F.S.-G.; software, F.S.-G. and D.F.-O.; validation, G.S.M. and F.S.-G.; formal analysis, D.F.-O.; resources, F.S.-G.; data curation, F.S.-G. and D.F.-O.; writing—original draft preparation, D.F.-O.; writing—review and editing, G.S.M. and F.S.-G.; supervision, G.S.M. and F.S.-G.; funding acquisition, G.S.M. All authors have read and agreed to the published version of the manuscript.

Funding

This research was funded by EUROPEAN COMMISSION, grant number FP7-ENERGY-2012-1 CP 308912.

Data Availability Statement

Data sharing is not applicable to this article.

Acknowledgments

Thanks are due to Grupo de Agroenergética for kindly allowing us to use their installations at UPM.

Conflicts of Interest

The authors declare no conflict of interest.

Abbreviations

a, b, and cDrying constants (dimensionless)
B1 and B2Batches of cladodes
CAverage thickness of the cladode (m)
DCladode diameter at the wider point (cm)
DeffDiffusion coefficient for moisture in solids (m2/s).
dmbDry matter basis
DTGDifferential thermogravimetry
HHV0High heating value on a dry matter basis (MJ/kg)
k, k0 and k1Drying rate constants.
LCladode length (cm)
LHV0Low heating value on a dry matter basis (MJ/kg)
LsLength of each strap (cm)
MAEMean absolute error.
MW/DWMoisture-weight to dry-weight ratio.
R2Determination coefficient.
RxMoisture ratio (dimensionless)
SCladode’s face area (cm2)
SCp+cTotal surface of exposed parenchyma and chlorenchyma tissues in cladode cubes (cm2).
SSp+cTotal surface of exposed parenchyma and chlorenchyma tissues in cladode straps (cm2)
tDrying time (h).
T1Thickness of the cladode’s cube face at the thickest point (cm)
T2Thickness of the cladode’s cube face at the narrowest point (cm)
TdStrap thickness at the distal extreme (cm)
TGAThermogravimetry
ThStrap thickness at half-length (cm)
TpStrap thickness at the proximal extreme (cm)
WAverage width of the cladode’s cube face (cm)
WdDry weight of the sample (g)
WeWeight of the sample at the end of the oven-drying process (g)
X ¯ Average value.
X0Initial moisture content of the sample (wt%).
XeEquilibrium moisture content (wt%)
XtMoisture content of the sample at the time t (wt%)
σStandard deviation.

Appendix A

Table A1. Determination coefficients and adjustment errors of the different drying models tested.
StrapsCubes
ModelT (°C)R2 (%)SEEMAER2 (%)SEEMAE
Henderson and Pabis (exponential, 2 parameters)5098.830.0280.01897.920.0330.027
6099.470.0170.01599.480.0210.017
7099.750.0140.01199.250.0270.024
Average99.350.0200.01598.880.0270.023
Exponential (3 parameters)5098.880.0280.01698.980.0230.018
6099.550.0160.01499.800.0120.010
7099.770.0140.01299.700.0180.014
Average99.400.0190.01499.490.0180.014
Double exponential (2 parameters)5097.630.0400.02899.290.0190.015
6099.740.0130.01099.320.0240.020
7099.720.0150.01199.190.0260.020
Average99.030.0220.01799.260.0230.018
Double exponential (3 parameters)5099.570.0160.01399.810.0100.008
6099.740.0130.01099.830.0120.009
7099.790.0130.01199.890.0100.008
Average99.700.0140.01199.840.0110.008
Double exponential (4 parameters)5098.830.0290.01897.920.0340.027
6099.510.0160.01499.480.0220.017
7099.750.0140.01199.250.0300.024
Average99.360.0200.01498.880.0290.023
Triple exponential (6 parameters)5098.830.0290.01997.920.0350.027
6099.470.0180.01999.480.0240.017
7099.810.0130.01099.250.0330.024
Average99.370.0200.01698.880.0300.023
Lewis5094.370.0620.04696.000.0450.038
6099.360.0190.01699.330.0230.019
7099.740.0140.01199.110.0290.025
Average97.820.0310.02498.150.0320.027
Page5098.260.0340.03099.610.0140.011
6099.670.0140.01299.900.0100.008
7099.780.0130.01199.890.0100.008
Average99.240.0210.01799.800.0110.009
Page (modified)5094.370.0620.04696.000.0450.038
6099.360.0190.01699.330.0240.019
7099.740.0140.01199.110.0300.025
Average97.820.0320.02498.150.0330.027
Midilli5099.230.0230.01999.660.0140.011
6099.750.0130.01199.950.0070.005
7099.800.0130.01099.940.0080.006
Average99.590.0160.01399.850.0100.007
Wang and Singh5074.250.1340.11794.930.0510.042
6084.590.0980.08196.640.0550.044
7087.050.1000.08597.700.0460.037
Average81.960.1110.09596.420.0510.041
Fick (simplified, 1st term)5098.370.0330.01994.510.0520.025
6096.460.0470.02494.350.0720.054
7095.760.0570.03293.880.0760.056
Average96.860.0460.02594.250.0670.045
R2 = Determination coefficient. SEE = standard error of the estimate. MAE = mean absolute error.

References

  1. Sánchez, J.; Sánchez, F.; Curt, M.D.; Fernández, J. Assessment of the bioethanol potential of prickly pear (Opuntia ficus-indica (L.) Mill.) biomass obtained from regular crops in the province of Almeria (SE Spain). Isr. J. Plant Sci. 2012, 60, 301–318. [Google Scholar]
  2. Flores-Ortiz, M.A.; Reveles-Hernández, M. Producción de nopal forrajero de diferentes variedades y densidades de plantación. In Proceedings of the VIII Simposium Taller Nacional y 1er. Internacional de Producción y Aprovechamiento del Nopal, Nuevo León, Mexico, 13–14 November 2009; Volume 5, pp. 198–210. [Google Scholar]
  3. Nobel, P.S. Environmental Biology. In Agro-Ecology, Cultivation and Uses of Cactus Pear: FAO Plant Production and Protection Paper; Barbera, G., Inglese, P., Pimienta-Barrios, E., Eds.; Food and Agriculture Organization of the United Nations: Rome, Italy, 1995. [Google Scholar]
  4. Contreras, S.; Toha, C.J. Biogas production from a suspension of homogenized cladodes of the cactus Opuntia cacti. J. Ferment. Technol. 1984, 62, 601–605. [Google Scholar]
  5. Varnero, M.; Teresa, M.; Uribe, J.; Lopez, X. Feasibility of an anaerobic biodigestion with a mix of goat manure and cladodes of prickly pear (Opuntia ficus-indica L. Mill). Terra Arid. 1992, 11, 166–172. [Google Scholar]
  6. Uribe, J.; Varnero, M.; Benavides, C. Biomass of prickly pear (Opuntia ficus-indica L. Mill) as a bovine manure anaerobic digestion accelerator. Simiente 1992, 62, 14–18. [Google Scholar]
  7. Obach, J.; Lemus, M. Bioenergy Generation Using Opuntia ficus-indica in Arid and Semi-Arid Zones of developing Countries. Symposium biomass and waste to energy. In Proceedings of the International Waste Working Group, Venice, Italy, 29 November 2006. [Google Scholar]
  8. Ramos-Suárez, J.L.; Martínez, A.; Carreras, N. Optimization of the digestion process of Scenedesmus sp. and Opuntia maxima for biogas production. Energy Convers. Manag. 2014, 88, 1263–1270. [Google Scholar] [CrossRef]
  9. Sánchez, F. Potencial del Cultivo de la Chumbera (Opuntia ficus-indica (L.) Miller) para la Obtención de Biocombustibles 2012. Available online: http://oa.upm.es/14773/ (accessed on 10 September 2020).
  10. Sánchez, F.; Sánchez, J.; San Miguel, G. Biomass Resources to Hybridize CSP with Biomethane: Potential of Horticultural Residues and Drought-tolerant Crops. Procedia Comput. Sci. 2016, 83, 1102–1109. [Google Scholar] [CrossRef]
  11. Retamal, N.; Durán, J.M.; Fernández, J. Ethanol production by fermentation of fruits and cladodes of prickly pear cactus [Opuntia ficus-indica (L.) Miller]. J. Sci. Food Agric. 1987, 40, 213–218. [Google Scholar] [CrossRef]
  12. Kuloyo, O.O.; Du Preez, J.C.; del Prado García-Aparicio, M.; Kilian, S.G.; Steyn, L.; Görgens, J. Opuntia ficus-indica cladodes as feedstock for ethanol production by Kluyveromyces marxianus and Saccharomyces cerevisiae. World J. Microbiol. Biotechnol. 2014, 30, 3173–3183. [Google Scholar] [CrossRef]
  13. de Souza Filho, P.F.; Ribeiro, V.T.; dos Santos, E.S.; de Macedo, G.R. Simultaneous saccharification and fermentation of cactus pear biomass—Evaluation of using different pretreatments. Ind. Crops Prod. 2016, 89, 425–433. [Google Scholar] [CrossRef]
  14. Sánchez, F.; Curt, M.D.; Uceda, M.; Zaragoza, G.; Agüera, J.M.; Fernández, J. Bioethanol production from prickly pear (Opuntia ficus-indica (L.) Miller) cladodes. In Proceedings of the 17th European Biomass Conference and Exhibition, Hamburg, Germany, 19 June–3 July 2009; EUBCE, pp. 1917–1921. [Google Scholar]
  15. Díaz-Ayala, F.; Álvarez-García, G.; Simá-Moo, E. Drying kinetics of slices of nopal (Opuntia ficus-indica) cladodes in a convective transversal flow dryer. Agrociencia 2015, 49, 845–857. [Google Scholar]
  16. Durán, G.; Margalef, M.; Condorí, M.; Castillo, S.; Estrada, L. Ensayos de secado de nopalito (Opuntia ficus-indica L. Miller) en un secador solar pasivo de uso doméstico. Av. Energías Renov. Medio Ambiente 2011, 15, 1–8. [Google Scholar]
  17. Lahsasni, S.; Kouhila, M.; Mahrouz, M.; Fliyou, M. Moisture adsorption–desorption isotherms of prickly pear cladode (Opuntia ficus-indica) at different temperatures. Energy Convers. Manag. 2003, 44, 923–936. [Google Scholar] [CrossRef]
  18. López, R.; de Ita, A.; Vaca, M. Drying of prickly pear cactus cladodes (Opuntia ficus-indica) in a forced convection tunnel. Energy Convers. Manag. 2009, 50, 2119–2126. [Google Scholar] [CrossRef]
  19. Medina-Torres, L.; Gallegos-Infante, J.A.; Gonzalez-Laredo, R.F.; Rocha-Guzman, N.E. Drying kinetics of nopal (Opuntia ficus-indica) using three different methods and their effect on their mechanical properties. LWT Food Sci. Technol. 2008, 41, 1183–1188. [Google Scholar] [CrossRef]
  20. Soto, G.M.; Ortega, A.F.; Flores, J.M.; Orozco, M.L. Características de secado de nopal (Opuntia ficus-indica) por lecho fluidizado. Acta Univ. 2010, 20, 70–76. [Google Scholar]
  21. Touil, A.; Chemkhi, S.; Zagrouba, F. Modelling of the drying kinetics of Opuntia ficus-indica fruits and cladodes. Int. J. Food Eng. 2010, 6. [Google Scholar] [CrossRef]
  22. Valdez, C.; Blanco, M.; Vázquez, A.; Magallanes, Q. Producción y usos del nopal para verdura. Rev. Salud Pública Nutr. 2008, 14, 1–19. [Google Scholar]
  23. Sudzuki Hills, F. Anatomy and morphology. In Agro-Ecology, Cultivation and Uses of Cactus Pear: FAO Plant Production and Protection Paper; Barbera, G., Inglese, P., Pimienta-Barrios, E., Eds.; FAO Plant Production and Protection Paper (FAO): Rome, Italy, 1995; pp. 29–36. [Google Scholar]
  24. Saiz Jarabo, M.M. Análisis de la Productividad de Opuntia ficus-indica (L.) Miller. En Distintos Regímenes Hídricos 1989. Available online: https://dialnet.unirioja.es/servlet/tesis?codigo=240110 (accessed on 10 September 2020).
  25. Hendreson, S.; Pabis, S. Grain drying theory I. Temperature effect on drying coefficients. J. Agric. Eng. Res. 1961, 6, 169–174. [Google Scholar]
  26. Akpinar, E.K.; Bicer, Y. Modelling of the drying of eggplants in thin-layers. Int. J. Food Sci. Technol. 2005, 40, 273–281. [Google Scholar] [CrossRef]
  27. Kassem, A. Comparative studies on thin layer drying models for wheat. In Proceedings of the 13th International Congress on Agricultural Engineering, Rabat, Morocco, 2–6 February 1998; Volume 6, pp. 2–6. [Google Scholar]
  28. Sharaf-Eldeen, Y.; Blaisdell, J.; Hamdy, M. A model for ear corn drying. Trans. ASAE 1980, 23, 1261–1265. [Google Scholar] [CrossRef]
  29. Henderson, S. Progress in developing the thin layer drying equation. Trans. ASAE 1974, 17, 1167–1168. [Google Scholar] [CrossRef]
  30. Karathanos, V.T. Determination of water content of dried fruits by drying kinetics. J. Food Eng. 1999, 39, 337–344. [Google Scholar] [CrossRef]
  31. Lewis, W.K. The Rate of Drying of Solid Materials. Ind. Eng. Chem. 1921, 13, 427–432. [Google Scholar] [CrossRef]
  32. Page, G.E. Factors Influencing the Maximum Rates of Air Drying Shelled Corn in Thin Layers. ProQuest Dissertations and Theses 1949. Available online: http://search.proquest.com/docview/301817819?accountid=14712 (accessed on 10 September 2020).
  33. Overhults, D.; White, G.; Hamilton, H.; Ross, I. Drying soybeans with heated air. Trans. ASAE 1973, 16, 112–0113. [Google Scholar] [CrossRef]
  34. Midilli, A.; Kucuk, H.; Yapar, Z. A new model for single-layer drying. Drying Technol. 2002, 20, 1503–1513. [Google Scholar] [CrossRef]
  35. Wang, C.; Singh, R. Use of variable equilibrium moisture content in modeling rice drying. Trans. Am. Soc. Agric. Eng. 1978, 11, 668–672. [Google Scholar]
  36. Aregbesola, O.A.; Ogunsina, B.S.; Sofolahan, A.E.; Chime, N.N. Mathematical modeling of thin layer drying characteristics of dika (Irvingia gabonensis) nuts and kernels. Niger. Food J. 2015, 33, 83–89. [Google Scholar] [CrossRef]
  37. Hazbavi, I.; Samadi, S.H. Using of Semi-Empirical Models and Fick’s Second Low for Mathematical Modeling of Mass Transfer in Thin Layer Drying of Carrot Slice. Glob. J. Sci. Front. Res. 2013, 13, 1–7. [Google Scholar]
  38. Asociación Española de Normalización y Certificación—AENOR. UNE-EN 14774-2:2010: Solid Biofuels–Determination of Moisture Content–Oven Dry Method–Part 2: Total Moisture–SIMPLIFIED Method 2010. Available online: https://standards.iteh.ai/catalog/standards/sist/b0380465-ff8b-48d3-bb56-ed9e70d52182/sist-en-14774-2-2010 (accessed on 10 September 2020).
  39. Asociación Española de Normalización y Certificación—AENOR. UNE-EN 15148:2010: Solid Biofuels–Determination of the Content of Volatile Matter 2010. Available online: https://standards.iteh.ai/catalog/standards/sist/2885462e-f60c-403e-8705-eb3d72c47cd8/sist-en-15148-2010 (accessed on 10 September 2020).
  40. Asociación Española de Normalización y Certificación—AENOR. UNE-EN 14775:2010: Solid Biofuels–Determination of Ash Content 2010. Available online: https://standards.iteh.ai/catalog/standards/sist/f6d427cb-b3fb-467f-a299-caeab4d33185/sist-en-14775-2010 (accessed on 10 September 2020).
  41. Asociación Española de Normalización y Certificación—AENOR. UNE-EN 14918:2011:Solid Biofuels–Determination of Calorific Value 2011. Available online: https://www.une.org/encuentra-tu-norma/busca-tu-norma/norma?c=N0046857 (accessed on 10 September 2020).
  42. Deutsches Institut für Normung—DIN. Testing of Solid and Liquid Fuels–Determination of Gross Calorific Value by the Bomb Calorimeter and Calculation of Net Calorific Value: DIN 51900 2000. Available online: http://www.techstreet.com/products/1051856 (accessed on 10 September 2020).
  43. Asociación Española de Normalización y Certificación—AENOR. UNE-EN 15104:2011: Solid Biofuels–Determination of total Content of Carbon, Hydrogen and Nitrogen–Instrumental Methods 2011. Available online: https://standards.iteh.ai/catalog/standards/cen/8284c803-422b-409a-891e-5d4859ba52a5/en-15104-2011 (accessed on 10 September 2020).
  44. Asociación Española de Normalización y Certificación—AENOR. UNE-EN 15103:2010: Solid Biofuels–Determination of Bulk Density 2010. Available online: https://www.une.org/encuentra-tu-norma/busca-tu-norma/norma/?c=N0046378 (accessed on 10 September 2020).
  45. Asociación Española de Normalización y Certificación—AENOR. UNE-EN ISO 16472:2007: Animal Feeding Stuffs–Determination of Amylase-Treated Neutral Detergent Fibre Content (aNDF) 2007. Available online: https://www.en-standard.eu/une-en-iso-16472-2007-animal-feeding-stuffs-determination-of-amylase-treated-neutral-detergent-fibre-content-andf-iso-16472-2006/ (accessed on 10 September 2020).
  46. Asociación Española de Normalización y Certificación—AENOR. UNE-EN ISO 13906:2009: Animal Feeding Stuffs–Determination of Acid Detergent Fibre (ADF) and Acid Detergent Lignin (ADL) Contents 2009. Available online: https://www.en-standard.eu/une-en-iso-13906-2009-animal-feeding-stuffs-determination-of-acid-detergent-fibre-adf-and-acid-detergent-lignin-adl-contents-iso-13906-2008/ (accessed on 10 September 2020).
  47. Miles, T.R.; Miles, T.R.; Baxter, L.L.; Bryers, R.W.; Jenkins, B.M.; Oden, L.L. Alkali Deposits Found in Biomass Power Plants. A Preliminary Investigation of Their Extent and Nature. National Renewable Energy Laboratory, Sandia National Laboratory (USDE) NREL/TP-433-8142. 1995. Available online: https://www.nrel.gov/docs/legosti/fy96/8142v1.pdf (accessed on 10 September 2020).
  48. Contreras-Padilla, M.; Pérez-Torrero, E.; Hernández-Urbiola, M.I.; Hernández-Quevedo, G.; del Real, A.; Rivera-Muñoz, E.M.; Rodríguez-García, M.E. Evaluation of oxalates and calcium in nopal pads (Opuntia ficus-indica var. redonda) at different maturity stages. J. Food Compos. Anal. 2011, 24, 38–43. [Google Scholar] [CrossRef]
  49. Tovar-Puente, A.; Pando-Moreno, M.; Gonzalez-Rodriguez, H.; Scott-Morales, L.; Mendez-Gallegos, S. Density of calcium oxalate crystals in 15 prickly pear cultivated species. J. Prof. Assoc. Cactus Dev. 2007, 9, 91–98. [Google Scholar]
  50. Öberg, T.; Öhrström, T. Chlorinated Aromatics from Combustion: Influence of Chlorine, Combustion Conditions, and Catalytic Activity. Environ. Sci. Technol. 2003, 37, 3995–4000. [Google Scholar] [CrossRef] [PubMed]
  51. Goldstein, G.; Nobel, P.S. Changes in Osmotic Pressure and Mucilage during Low-Temperature Acclimation of Opuntia ficus-indica. Plant Physiol. 1991, 97, 954–961. [Google Scholar] [CrossRef] [PubMed] [Green Version]
  52. Sepúlveda, E.; Sáenz, C.; Aliaga, E.; Aceituno, C. Extraction and characterization of mucilage in Opuntia spp. J. Arid Environ. 2007, 68, 534–545. [Google Scholar] [CrossRef]
  53. Jakab, E. Analytical Techniques as a Tool to Understand the Reaction Mechanism. In Recent Advances in Thermochemical Conversion of Biomass; Pandey, A., Bhaskar, T., Stöcker, M., Sukumaran, R.K., Eds.; Elsevier: Amsterdam, The Netherlands, 2015; p. 75. [Google Scholar]
  54. Perez-Rodriguez, J.L.; Duran, A.; Centeno, M.A.; Martinez-Blanes, J.M.; Robador, M.D. Thermal analysis of monument patina containing hydrated calcium oxalates. Thermochim. Acta 2011, 512, 5–12. [Google Scholar] [CrossRef]
  55. Benítez-Guerrero, M.; López-Beceiro, J.; Sánchez-Jiménez, P.E.; Pascual-Cosp, J. Comparison of thermal behavior of natural and hot-washed sisal fibers based on their main components: Cellulose, xylan and lignin. TG-FTIR analysis of volatile products. Thermochim. Acta 2014, 581, 70–86. [Google Scholar] [CrossRef]
  56. Zogzas, N.; Maroulis, Z.; Marinos-Kouris, D. Moisture diffusivity data compilation in foodstuffs. Drying Technol. 1996, 14, 2225–2253. [Google Scholar] [CrossRef]
  57. Doymaz, I. Drying of thyme (Thymus Vulgaris L.) and selection of a suitable thin-layer drying model. J. Food Process. Preserv. 2011, 35, 458–465. [Google Scholar] [CrossRef]
  58. Doymaz, I. Thin-layer drying of spinach leaves in a convective dryer. J. Food Process. Eng. 2009, 32, 112–125. [Google Scholar] [CrossRef]
  59. Kane, C.E.; Jamali, A.; Kouhila, M.; Mimet, A.; Ahachad, M. Single-layer drying behavior of Mexican tea leaves (Chenopodium ambrosioides) in a convective solar dryer and mathematical modeling. Chem. Eng. Commun. 2008, 195, 787–802. [Google Scholar] [CrossRef]
  60. Vega, A.; Uribe, E.; Lemus, R.; Miranda, M. Hot-air drying characteristics of Aloe vera (Aloe barbadensis Miller) and influence of temperature on kinetic parameters. LWT-Food Sci. Technol. 2007, 40, 1698–1707. [Google Scholar] [CrossRef]
  61. Chevanan, N.; Womac, A.R.; Bitra, V.S.P.; Igathinathane, C.; Yang, Y.T.; Miu, P.I.; Sokhansanj, S. Bulk density and compaction behavior of knife mill chopped switchgrass, wheat straw, and corn stover. Bioresour. Technol. 2010, 101, 207–214. [Google Scholar] [CrossRef] [PubMed]
  62. Wilén, C.; Moilanen, A.; Kurkela, E. Biomass Feedstock Analyses. Espoo 1996; VTT, Technical Research Center of Finland: Espoo, Finland, 1996. [Google Scholar]
  63. Larsson, S.H.; Thyrel, M.; Geladi, P.; Lestander, T.A. High quality biofuel pellet production from pre-compacted low density raw materials. Bioresour. Technol. 2008, 99, 7176–7182. [Google Scholar] [CrossRef] [PubMed]
Figure 1. Prickly-pear-cladodes cut in straps (left) and cubes (right).
Agronomy 12 02231 g001
Figure 2. Straps made from the cutting of prickly-pear cladodes. Td = thickness of the proximal extreme of the strap; Tp = thickness of the distal extreme of the strap; Th = thickness at half-length.
Agronomy 12 02231 g002
Figure 3. Cubes made from cutting prickly-pear cladodes. T1 = thickness of the cube face at the thickest point; T2 = thickness of the cube face at the narrowest point; W = average length of the face.
Agronomy 12 02231 g003
Figure 4. TGA/DTG analyses of whole prickly-pear cladode biomass (up) and its constituent tissues (from (left) to (right): parenchyma, chlorenchyma, and epidermis) in flowing nitrogen.
Agronomy 12 02231 g004
Figure 5. Drying curves of prickly-pear cladodes with different geometries ((left) straps, (right) cubes).
Agronomy 12 02231 g005
Figure 6. Drying rates (left) and drying rates per unit of exposed tissues surface (right) of prickly-pear cladodes cut into different geometries and dried at different temperatures.
Agronomy 12 02231 g006
Table 1. Drying models tested.
ModelEquationRef.
Henderson and Pabis (exponential, 2 parameters) R x = a e k t [25]
Exponential (3 parameters) R x = a e k t + b [26]
Double exponential (2 parameters) R x = a e k t + b + ( 1 a ) e a k t [27]
Double exponential (3 parameters) R x = a e k t + b + ( 1 a ) e b k t [28]
Double exponential (4 parameters) R x = a e k 0 t + b e k 1 t [29]
Triple exponential (6 parameters) R x = a e k t + b e k 0 t + c e k 1 t [30]
Lewis R x = e k t [31]
Page R x = e k t n [32]
Page (modified) R x = e ( k t ) n [33]
Midilli R x = a e k t n + b t [34]
Wang and Singh R x = 1 + a t + b t 2 [35]
Table 2. Analytical methods used for the characterization of the prickly-pear biomass.
ParameterMethods
Moisture (to determine the dry matter basis of the sample—dmb)Oven drying at 105 °C (EN 14774-2:2010) [38]
Volatile matterFurnace heating at 900 °C (EN 15148:2010) [39]
AshCalcination at 550 °C (EN 14775:2010) [40]
Higher Heating Value (HHV)Bomb calorimetry (EN 14918:2011, DIN 51900) [41,42]
Elemental analysisElemental analyzer (EN 15104:2011) (CHNO) [43]/X-ray fluorescence (other elements)
Bulk densityMeasuring cylinder (EN 15103:2010) [44]
Fiber compositionGoering and Van Soest method (EN ISO 16472, EN ISO 13906) [45,46]
Thermogravimetric analysis (TGA/DTG)Thermobalance TA 2050 (TA Inst.). Flowing nitrogen: 25–30 mg. 50 mL/min. Heating rate: 10 °C/min.
Table 3. Elemental analysis of prickly-pear cladodes.
Main Elements (>1%) (wt%, dmb)Minor Elements (<1%) (mg/kg, dmb)Elemental Ratios
C35.2Mg721Zn241O/C1.26
H4.7Al49Br31H/C0.13
N1.16Si608Rb75Si/K0.01
O44.3P3210Sr247Ca/K1.71
Ca7.3S270Ru13
K4.2Cl7240Sn51
Mn441Ba205
Fe19
Any other element < 10 mg/kg (dmb); RSD < 5% in all cases.
Table 4. Proximate, fiber, and thermal analyses of prickly-pear cladodes.
Proximate Analysis (wt%, dmb) X ¯ ± σ
Volatile matter169.7
Fixed carbon4.5 ± 0.9
Ash25.8 ± 2.0
Fiber analysis (wt%, dmb)
Cellulose8.2 ± 0.5
Hemicellulose10.5 ± 0.1
Lignin2.1 ± 0.2
Starch (wt%, dmb)3.0 ± 0.5
Thermal analysis (MJ/kg dmb)
Higher heating value (HHV)13.9 ± 0.2
Lower heating value (LHV)12.9 ± 0.2
Proximate analysis (wt%, dmb) X ¯ ± σ
X ¯ ± σ: average ± standard deviation; (1) Calculated by difference.
Table 5. Drying surface areas, drying times, and moisture-loss rates of prickly-pear cladodes.
T (°C)GeometryTotal Surface/Fresh Weight (cm2/g)Epidermis Surface/Fresh Weight (cm2/g)Exposed (Parenachima + Claorenchima) Surface/Fresh Weight (cm2/g)Drying Time (h)Average Moisture-Loss Rate (g Moisture Loss/h)
50Dices2.70.81.91503.4
Straps1.70.90.82372.1
60Dices2.90.82.22225.2
Straps1.70.70.95811
70Dices2.90.921431.9
Straps1.80.814015.7
Table 6. Coefficients of the double exponential with three parameters and Midilli models that describe the drying curves of prickly-pear cladodes cut into different geometries and exposed to different temperatures.
ModelT (°C)akbn
StrapsDouble exponential (three parameters)
R x = a e k t + b + ( 1 a ) e b k t
500.19190.48420.0420
600.62330.16330.3376
700.81810.16790.6238
Midilli
R x = a e k t n + b t
500.92840.0529−0.00030.7579
601.02610.1266−0.00010.9007
701.00950.15020.00010.9969
CubesDouble exponential (three parameters)
R x = a e k t + b + ( 1 a ) e b k t
500.24040.22300.1360
60−1.21130.14160.9010
70−4.95880.55040.8466
Midilli
R x = a e k t n + b t
501.02260.1062−0.00070.6996
600.99290.1671−0.00081.1250
700.99690.2251−0.00091.1894
Table 7. Diffusion coefficients found for the drying of prickly-pear cladodes cut into different geometries and exposed to different temperatures.
Diffusion Coefficients (m2/s)
T (°C)StrapsCubes
504.71 × 10−108.18 × 10⁻¹⁰
601.95 × 10−94.36 × 10−9
703.01 × 10−96.47 × 10−9
Publisher’s Note: MDPI stays neutral with regard to jurisdictional claims in published maps and institutional affiliations.

