Article

Real-Time Nitrogen Application of Rice Varieties Based on Leaf Colour Chart under System of Rice Intensification in Temperate Climate

1
Division of Agronomy, Faculty of Agriculture, Sher-e-Kashmir University of Agricultural Sciences and Technology of Kashmir, Wadura, Sopore 193201, India
2
Agromet Unit, Faculty of Horticulture, Sher-e-Kashmir University of Agricultural Sciences and Technology of Kashmir, Shalimar, Srinagar 190025, India
3
Division of Plant Pathology, Faculty of Agriculture, Sher-e-Kashmir University of Agricultural Sciences and Technology of Kashmir, Wadura, Sopore 193201, India
4
Division of Soil Science, Faculty of Agriculture, Sher-e-Kashmir University of Agricultural Sciences and Technology of Kashmir, Wadura, Sopore 193201, India
5
School of Agriculture, Lovely Professional University, Ludhiana 144411, India
6
Division of Genetics and Plant Breeding, Faculty of Agriculture, Sher-e-Kashmir University of Agricultural Sciences and Technology of Kashmir, Wadura, Sopore 193201, India
7
Department of Plant Production, College of Food and Agriculture, King Saud University, Riyadh 11451, Saudi Arabia
8
Academy of Biology and Biotechnology, Southern Federal University, Rostov-on-Don 344090, Russia
9
Crop Science, Institute of Crop Science and Resource Conservation (INRES), University of Bonn, 53115 Bonn, Germany
10
Department of Agronomy, Faculty of Agriculture, Kafrelsheikh University, Kafrelshaikh 33156, Egypt
*
Authors to whom correspondence should be addressed.
Agronomy 2022, 12(9), 2229; https://doi.org/10.3390/agronomy12092229
Submission received: 8 August 2022 / Revised: 8 September 2022 / Accepted: 13 September 2022 / Published: 19 September 2022

Abstract

:
Increasing nitrogen use efficiency in rice intensification (SRI) is pivotal to achieving high crop yield and reducing nitrogen losses. To find the critical value of the leaf color chart (LCC) for real-time nitrogen (N) application in rice varieties under SRI, a field experiment was laid at the Research Farm, Faculty of Agriculture, Wadura, SKAUST-Kashmir in Kharif between 2019 and 2020. The experiment comprised two cultivars (SR-3 and SR-4) and eight LCC-based nitrogen managements (control, recommended dose of nitrogen (RDF), and three LCC scores (≤3, ≤4, ≤5 each with 20 and 30 kg N ha−1). SR-4 produced significantly higher values for growth and yield parameters, producing higher grain yield (7.02 and 6.86 t ha−1) compared to SR-3 (6.49 and 6.36 t ha−1) between 2019 and 2020, respectively. An LCC value of 5 with 30 kg N ha−1 produced maximum grain yield (7.84 and 7.70 t ha−1) in 2019 and 2020, respectively, which were statistically at par with the LCC value of 5 with 20 kg Nha−1. Pooled data revealed that the highest B: C ratio of 1.55 was recorded in cultivar SR-4 with an LCC value of 5 with 30 kg N ha−1. Furthermore, agronomic and recovery efficiency of nitrogen remained maximum in LCC 5 with 20 kg N ha−1 for both years. Grain yield recorded in LCC 3 20 kg N ha−1 was similar to recommended nitrogen. The present study highlighted the need-based N application through LCC and proved effective in increasing the N-use efficiency and yield in rice.

1. Introduction

Rice (Oryza sativa L.) is a major staple food for more than the world’s half population. It is cultivated on an area of about 158.8 million hectares globally with 751.9 million tonnes of annual production [1]. The system of rice intensification (SRI) has been endorsed as an alternative rice growing technology and an efficient resource management option for achieving high rice production with fewer external inputs [2]. The set of management practices involved in SRI mostly developed for areas where scarcity of water and labor is more. The present system of transplanted rice production is more input-intensive and favors cash-rich farmers. The valley of Kashmir in Jammu and Kashmir, India, with a temperate climate condition, supports different cultivars suited to its agro-climatic situation. However, average yields are very low from their genetic potential owing to several constraints, being most among them is inefficient nitrogen (N) management.
While considering the various factors affecting the productivity of rice, inefficient (N) management is the most common. Among various nutrient management techniques, managing N levels seems to be the top priority for exploiting the yield potential of the crop [3]. For cereals, N is considered a key input for growth and development, particularly in rice cultivation [4]. In general, nitrogen use efficiency remains on the lower side due to excessive losses of nitrogen. The ineffective and irregular application of nitrogen fertilizer results in heavy loss of nitrogen from soil either by leaching or through denitrification [5]. Sometimes blanket application of nitrogen can result in heavy lodging because of more above-ground biomass causing yield losses. Farmers incline toward the use of high rates of nitrogenous fertilizers for maximizing crop yield and reducing apparent nitrogen recovery. Soil nitrogen availability indices are not much reliable measure and often become a challenge to assess the portion of soil nitrogen that can be used by crop plants [6,7]. Lack of synchronization in crop nitrogen demand with nitrogen application will result in more soil-plant system losses, thereby yielding lower N use efficiency [8]. Furthermore, it was also observed that only 30 to 50% of the applied nitrogenous fertilizer is used by the earlier crop [9]. The normal practice of using unnecessary N fertilizer applications further reduces the nitrogen use efficiency and becomes responsible for recurrent insect-pest incidence and environmental degradation, eventually leading to high production costs [10].
Need-based nitrogen application helps in improving agronomic efficiency and reduces the N losses considerably. In rice soil, a significant quantity of nitrogen is lost as NO3, NH3, or N2O via leaching, volatilization, and denitrification. The N losses from rice fields are substantial and have deleterious effects on global human and environmental health [4]. The use of optimum N can be attained by matching nitrogen supply with crop demand [11]. Since the photosynthetic activity is positively correlated with the nitrogen status of the plant, therefore, a physical examination of leaf color intensity will be used as an indicator for measuring the nitrogen demand of the plant [3]. An easy, simple, and reliable method for estimating the nitrogen demand in the plant is through a leaf color chart (LCC), which can assess the chlorophyll content of the leaf in a non-invasive and non-destructive manner, thus providing an estimation of indirect leaf N status. This diagnostic tool is easy to operate for observing the relative greenness of a leaf and acts as a visual indicator for the plant N status [12]. For farmers, practically, it offers a significant opportunity for determining the demand-based time and quantity of nitrogen to be applied for efficient N use and to achieve high rice yield. Therefore, physical examination of leaf color intensity against standard LCC provides the plant nitrogen requirement in actual time and helps to manage the scheduling of N top dressing in rice. With a real-time approach, nitrogen application matches the actual demand of the crop, which results in an appreciable amount of yield increase through the LCC nitrogen management technique [13]. However, analyzing plant samples in the laboratory for nutrient content is a tedious and time-consuming process, and creates a gap between sampling to results analysis, thus limiting its use. Therefore, managing N fertilizer with regard to the actual demand of the crop at the proper time enables the assimilation of a major portion of N in plants. Current rice yields in Kashmir valley are far below their potential as nitrogen is not managed effectively, so need based N application in SRI could prove to be a cost-effective strategy to resource-poor farmers. Hence, the objective of the study was to find the critical value of LCC for standardizing the nitrogen application on a need basis in two popular high yielding rice cultivars under system of rice intensification.

2. Materials and Methods

A rice field trial was conducted at an agricultural research farm, Faculty of Agriculture, Wadura, SKUAST-K, India, during the Kharif season 2019 and 2020, to assess the impact of Leaf color chart (LCC) based N application on the performance of rice varieties under SRI.

2.1. Experimental Location

The experimental area was located at an altitude of 1590 m amsl (34° 21/N Latitude and 74° 23/E Longitude) with a temperate climate, and it receives 812 mm annual precipitation. The soil analysis of the experimental site reveals a silty clay loam texture with normality in pH (6.5) and medium in major available N, P, and K (Table 1).

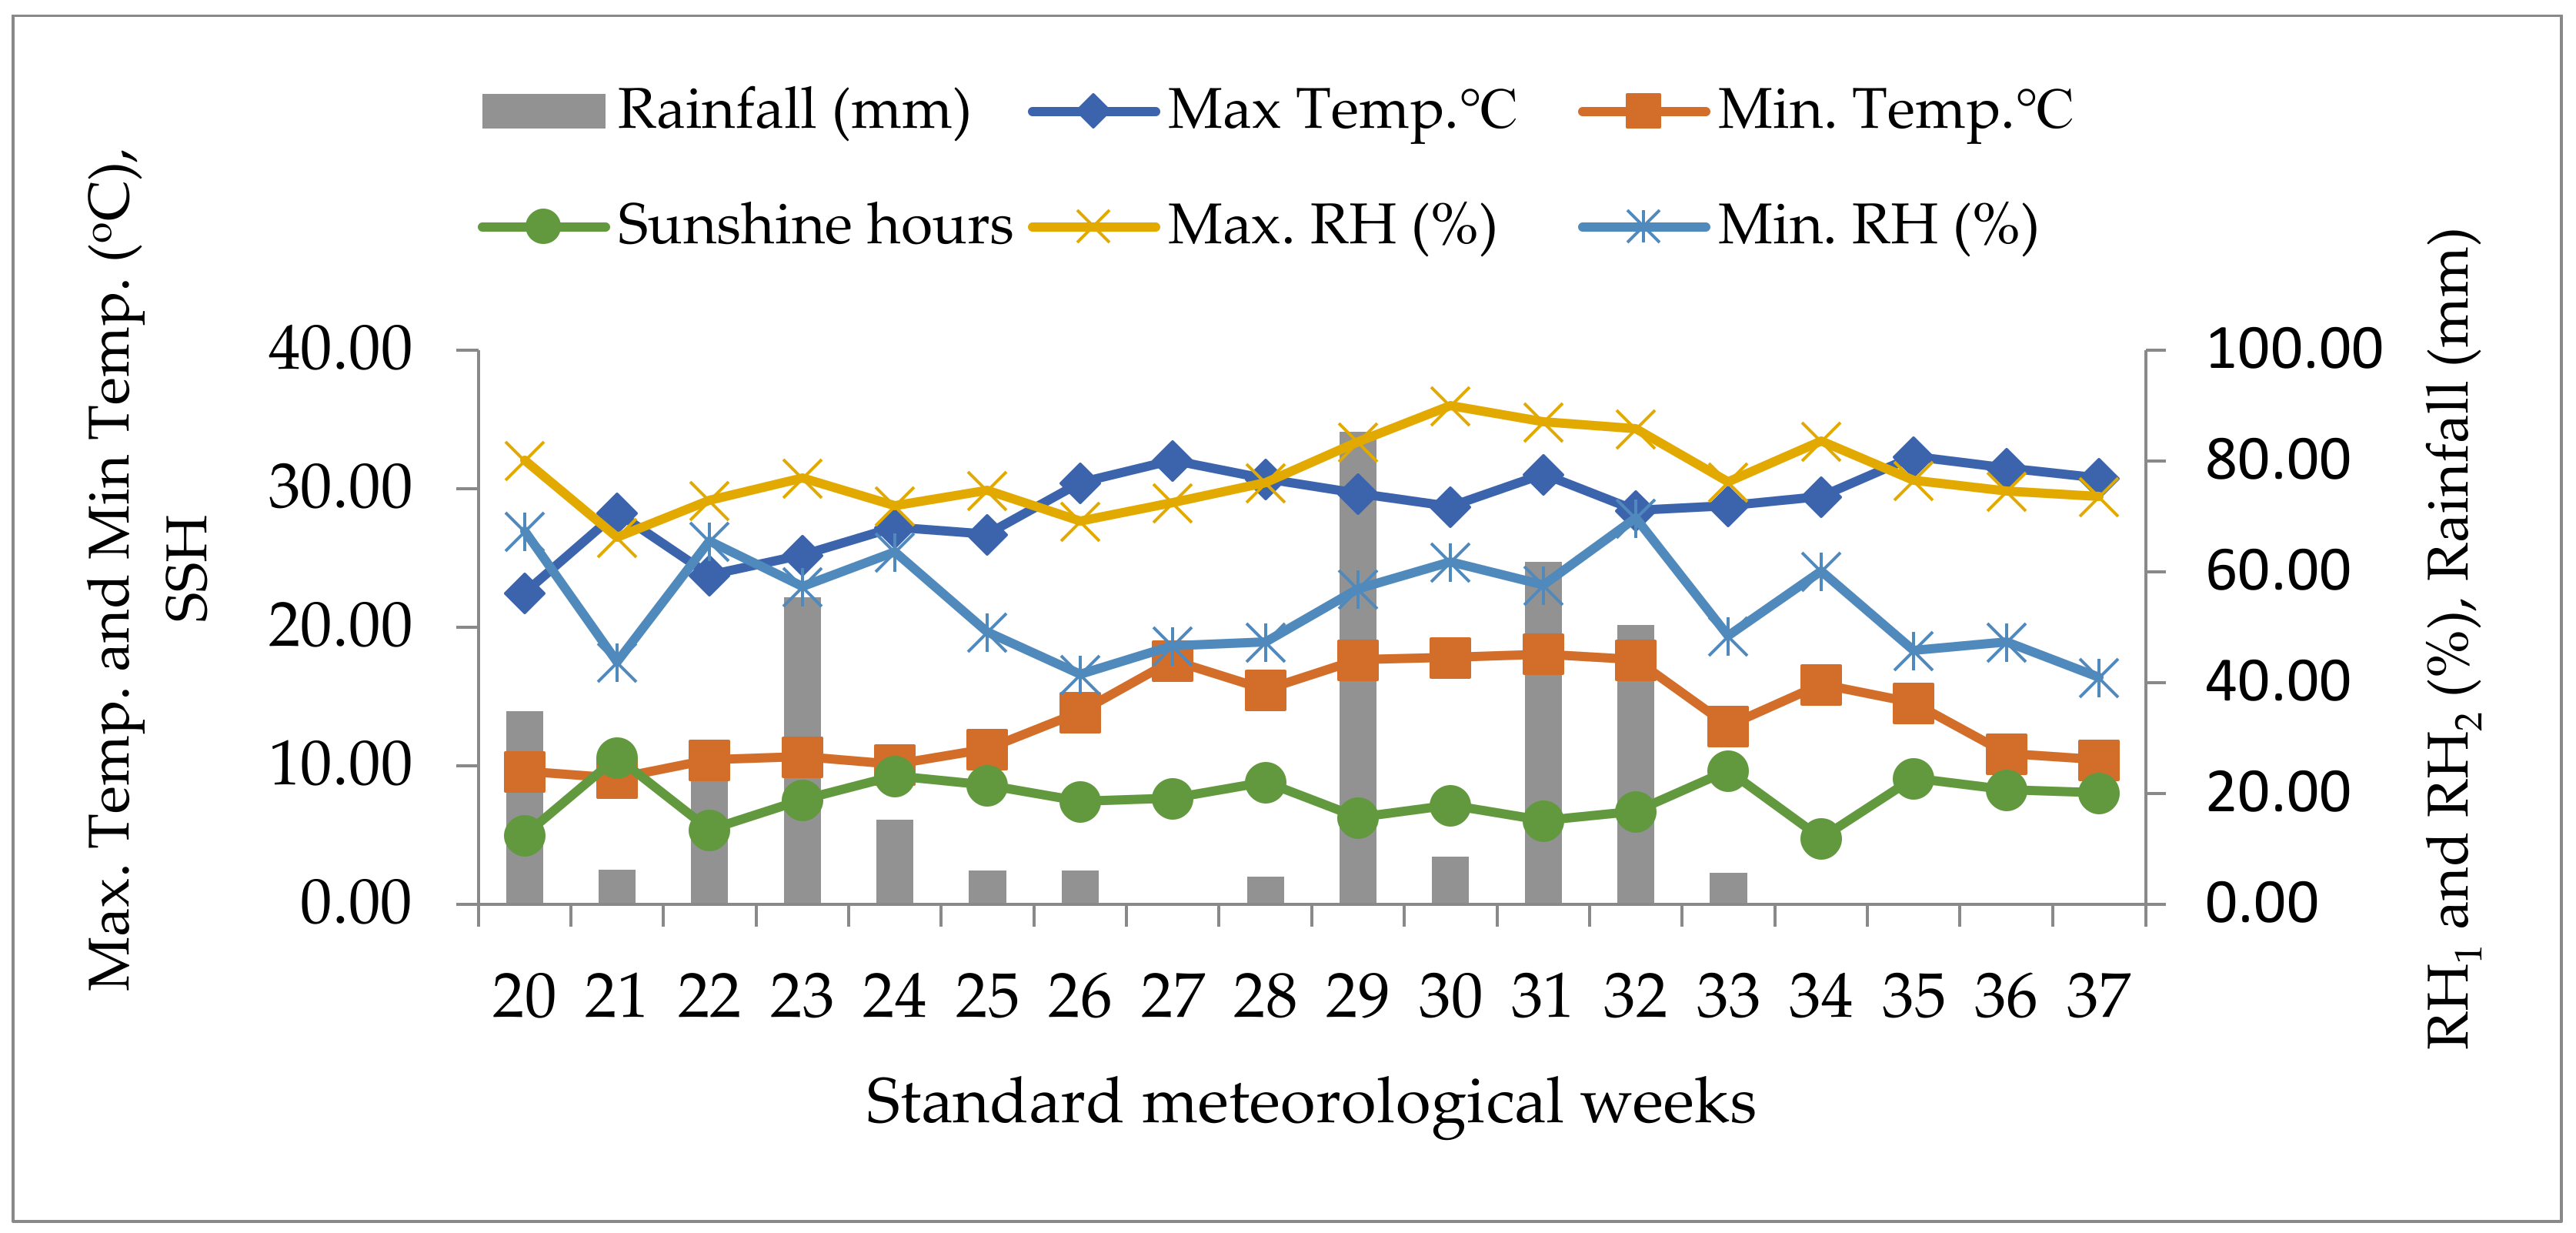
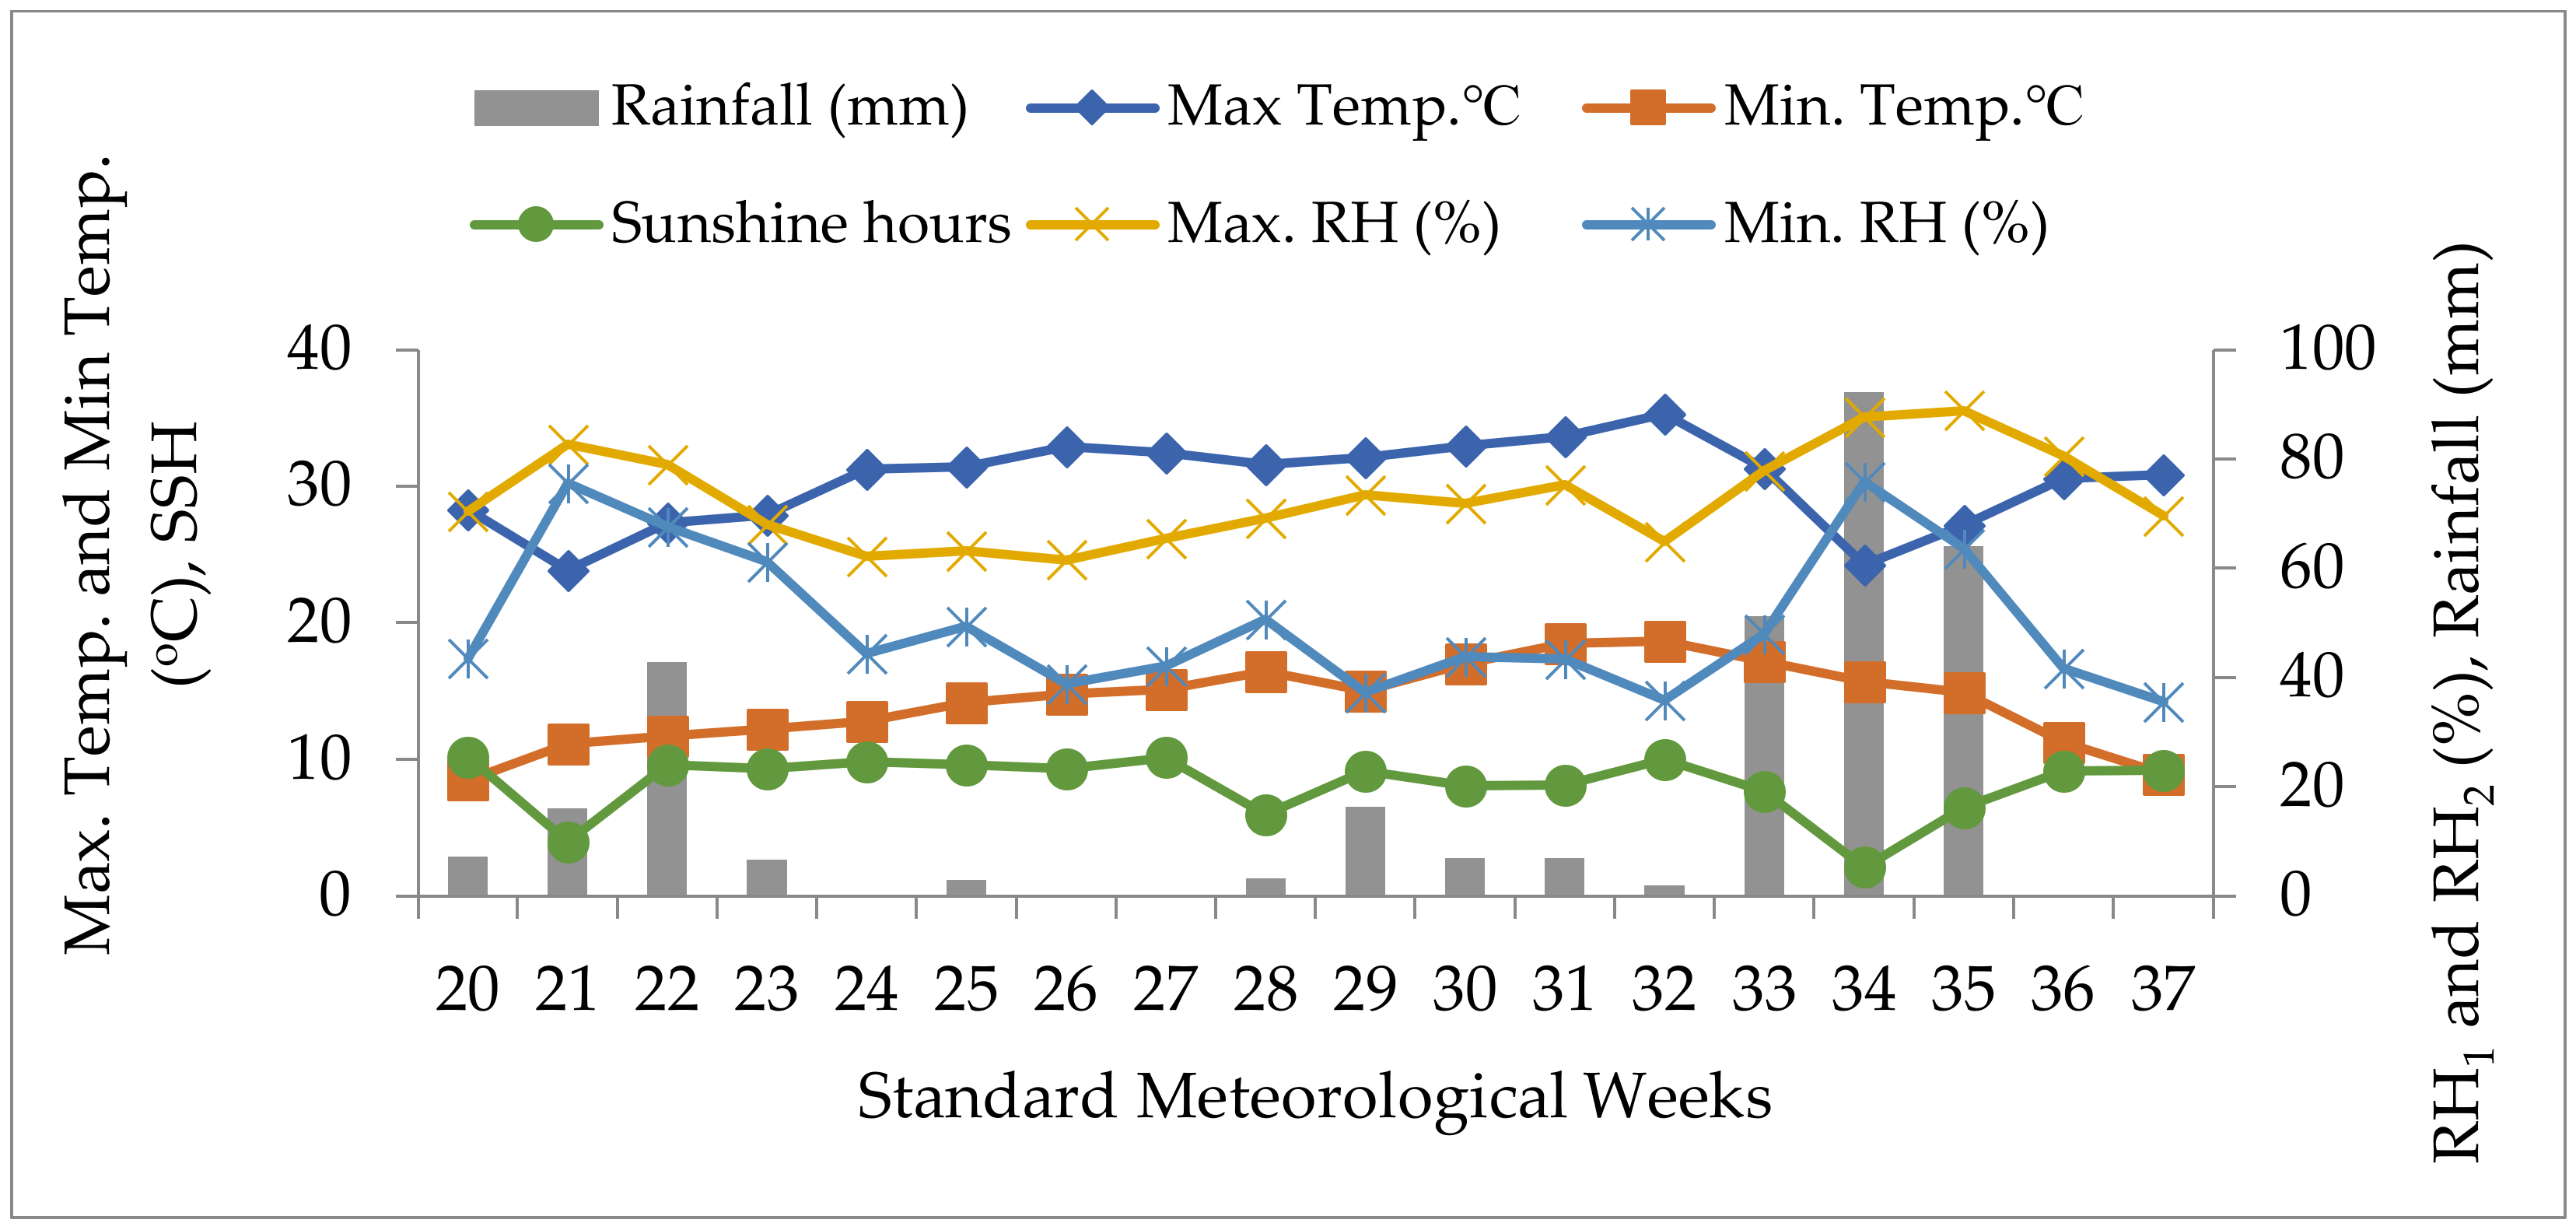
2.2. Weather Conditions

The weather of the region varied throughout the entire crop growth period and was presented as mean data for 2019 and 2020. The weather data was provided by Agromet Field Unit, SKUAST-K, Srinagar. The average maximum and minimum temperatures for the entire crop growth season were 28.76 °C and 13.54 °C respectively in 2019, and 30.27 °C and 14.11 °C in 2020, with total precipitation amounting to 367.60 mm in 2019 and 318.60 mm in 2020, respectively. The total number of mean sunshine hours recorded was 136.23 in 2019 and 147.93 in 2020, and the average maximum and minimum relative humidity were 77.29 and 53.91 percent in 2019 respectively and 72.86 and 49.90 percent in 2020, respectively (Figure 1 and Figure 2).

2.3. Nursery Raising and Transplanting

Raised nursery beds were laid with dimensions of 5 × 1 m2 with suitable drainage channels along the beds to drain the excess water. The beds were mixed with soil: decomposed FYM (1:1) up to 4–5 cm thickness, and after that, N, P, and K were applied at 1.0 (urea), 0.5 (DAP), and 0.5 kg per 100 m2 (MOP), respectively. The seeds of Shalimar Rice-3 (SR-3) and Shalimar Rice-4 (SR-4) were soaked in water for 48 h consecutively and then incubated at room temperature for 48 h in gunny cloth (moist) for sprouting. Sprouted seeds @ 5 kg ha−1 were homogeneously spread on the raised beds (18th May of 2019 and 2020, respectively), and soil: FYM (1:1) was applied as a thin layer of 1–2 cm. Nursery beds were irrigated before and after sowing as per the standard of SRI. Manual weeding by hand was done only once. On 30th May (12 days old seedlings), seedlings were transplanted in the main rice field during both years. Further, the crop was raised per the standard principles of the system of rice intensification.

2.4. LCC-Based Nitrogen Application

A leaf color chart is a simple and promising non-destructive method for determining the need-based nitrogen requirement of rice. The LCC used consisted of 6 color strips from yellowish green to dark green fabricated with veins matching that of rice leaves. LCC measures the intensity of leaf color and is developed by the International Rice Research Institute (IRRI) in association with the Philippine Rice Research Institute (Manila).
For real-time nitrogen (N) application in the rice field, LCC was used during the experiment trial, with five green strips ranging from yellow-green to dark green, each shade denoted by 1, 2, 3, 4, and 5. For nitrogen application through LCC, readings were taken at four regular intervals from 12 DAT (days after transplanting) to 50 percent flowering, randomly selecting ten healthy hills from the sampling area in each LCC treated plot (Supplemantary Material; Figure S1). LCC readings were taken by placing the fully expanded middle part of the selected leaf from each hill on the chart. The leaf color was observed by blocking sun rays by the body to prevent light interference that affects proper leaf color interpretation. Whenever the color of above 5 out of 10 leaves becomes less or equal to a critical threshold of LCC score, nitrogen was applied as per the treatment.

2.5. Experimental Design and Treatment Details

Two rice varieties, Shalimar Rice-3 (SR-3) and Shalimar Rice-4 (SR-4), and 6 LCC-based nitrogen management with 3 LCC scores viz., ≤3, ≤4, ≤5 each at 20 and 30 kg ha−1, were evaluated against control (Without nitrogen application) and recommended dosage (Table 2). Randomized complete block design (RCBD) was used in the present study, and each treatment was replicated thrice. SR-3 and SR-4 are the new promising rice varieties with high yielding potential for a temperate zone (Kashmir Valley) of India. Whenever the color of the leaf fell below a set LCC score, a given quantity of N was applied to plots, thus enabling the real-time application of nitrogenous fertilizer. Agronomic standard practices and principles under SRI were followed for raising the crop with a net plot size of 4.50 m × 3.50 m (15.75 m2). The soil under SRI was not flooded but kept moist by alternate wetting and drying of the rice field, reducing the water requirement for raising the rice crop. A full dose of P2O5 (60 kg ha−1) and K2O (30 kg ha−1) was the recommended dosage that was applied before transplanting. However, N fertilizer was applied per the treatment details. LCC was used to examine fully expanded leaves at a specified time from 12 DAT at four days intervals. At any time when the LCC reading fell below a set critical value of the LCC score, N fertilizer was applied. The last dose of N fertilizer was applied at the flowering stage. Recording of several important agronomic parameters, observations on dry matter production, plant height, panicle density, panicle length and weight, and the number of filled grains panicle−1 were taken at maturity by randomly selecting ten hills that were analyzed. Besides the agronomic parameters, the number of days to reach different phenophases, i.e., maximum tillering, panicle initiation, 50% flowering, dough, and maturity stage, were also recorded. Economics was calculated via prevailing prices of inputs and outputs. Agronomic efficiency (AE) and apparent nitrogen recovery (RE) were estimated to evaluate the effectiveness of N application practices by using given formulae.
AE   kg   grain / kg   N   applied = Increase   in   grain   yield   kg / ha   due   to   N Applied   N   kg / ha  
  RE   % =   Increase   in   plant   N   uptake   kg / ha   due   to   N   Applied   N   kg / ha       × 100
Table 2. Treatment-wise splits and quantity of nitrogen used in rice crops during 2019 and 2020.
TreatmentsNo. of Splits20192020
SR-3SR-4SR-3SR-4
Control00000
Recommended dose of N (RDF)3120120120120
20 kg N (Basal) + LCC ≤3 with 20 kg ha−1480808080
30 kg N (Basal) + LCC ≤3 with 30 kg ha−1390909090
20 kg N (Basal) + LCC ≤4 with 20 kg ha−15100100100100
30 kg N (Basal) + LCC ≤4 with 30 kg ha−14120120120120
20 kg N (Basal) + LCC ≤5 with 20 kg ha−16120120120120
30 kg N (Basal) + LCC ≤5 with 30 kg ha−15150150150150

2.6. Statistical Analysis

The ANOVA was performed on experimental data by adopting the standard statistical procedures applied to RCBD (factorial) to assess the influence of rice cultivars and nitrogen application by using R software (R core Team, 2013) [19]. To evaluate the significance of treatment means, the least square difference (LSD) at a 5% level of significance was used.

3. Results

3.1. Growth Parameters

Among the rice varieties, SR-4 gave maximum plant height (123.95 cm) and dry matter accumulation (15.62 t ha−1) in 2019 and 122.47 cm and 15.21 t ha−1 in 2020, respectively, at the harvest stage than variety SR-3 (Table 3). Among LCC scores, LCC ≤ 5 with 30 kg ha−1 produced maximum plant height and dry matter production at the harvest, although being statistically similar to the 20 kg N ha−1 supplied by LCC ≤ 5 for 2019 and 2020. The lowest plant height (110.93 and 109.25 cm) and dry matter (13.25 and 12.82 t ha−1) at harvest were observed under control between 2019 and 2020. Besides, 20 kg N ha−1 applied by LCC ≤ 3 was found statistically at par with a recommended dose of N.

3.2. Crop Phenology

The data on crop phenology during 2019 and 2020 revealed that variety SR-4 attained the phenological stages, i.e., maximum tillering, panicle initiation, 50% flowering, dough, and maturity stage with more days compared to SR-3. However, the difference in crop phenology was statistically non-significant (Table 4). The variety SR-4 completed the maturity stage in 140 and 139 days compared to SR-3, which was completed in 137 and 136 days during 2019 and 2020, respectively.
Among LCC scores, LCC ≤ 5 with 30 kg ha−1 achieved different phenological stages in more days, although it was statistically at par with LCC ≤ 5 with 20 kg ha−1. The LCC≤ 5 with 30 kg ha−1 took 145 and 144 days to complete maturity, while the lowest number of days were observed in control (130 and 129 days) during 2019 and 2020, respectively. Furthermore, the minimum number of days to attain maturity during both years was recorded in control. Recommended application of nitrogen attained maturity in 138 and 137 days, which was statistically at par with the 30 and 20 kg ha−1 provided by LCC ≤ 3 during 2019 and 2020, respectively.

3.3. Yield Attributes

From the data, it was observed that both rice varieties significantly influenced yield attributes in 2019 and 2020 (Table 5). The results revealed that variety SR-4 produced a significantly maximum number of panicles per m−2 (371.17 and 365.85), panicle length (23.51 and 22.48 cm), panicle weight (2.39 and 2.15 g), and grains-filled panicle−1 (81.81 and 79.39) compared to variety SR-3, which showed panicles per m−2 (349.17 and 343.27), panicle length (23.11 and 21.89 cm), panicle weight (2.18 and 1.92 g) and filled grains panicle−1 (75.81 and 73.14) during 2019 and 2020, respectively.
Similarly, for LCC based on N management, a significant influence was noted on yield characters, with higher panicles m−2 (380.46 and 374.99), panicle length (24.43 and 23.31 cm), panicle weight (2.61 and 2.36 g) and filled grains panicle−1 (91.80 and 89.26) recorded under LCC 5 with 30 kg ha−1 (application of 150 kg N ha−1), which was similar to the 20 kg N ha−1 supplied by LCC 5.

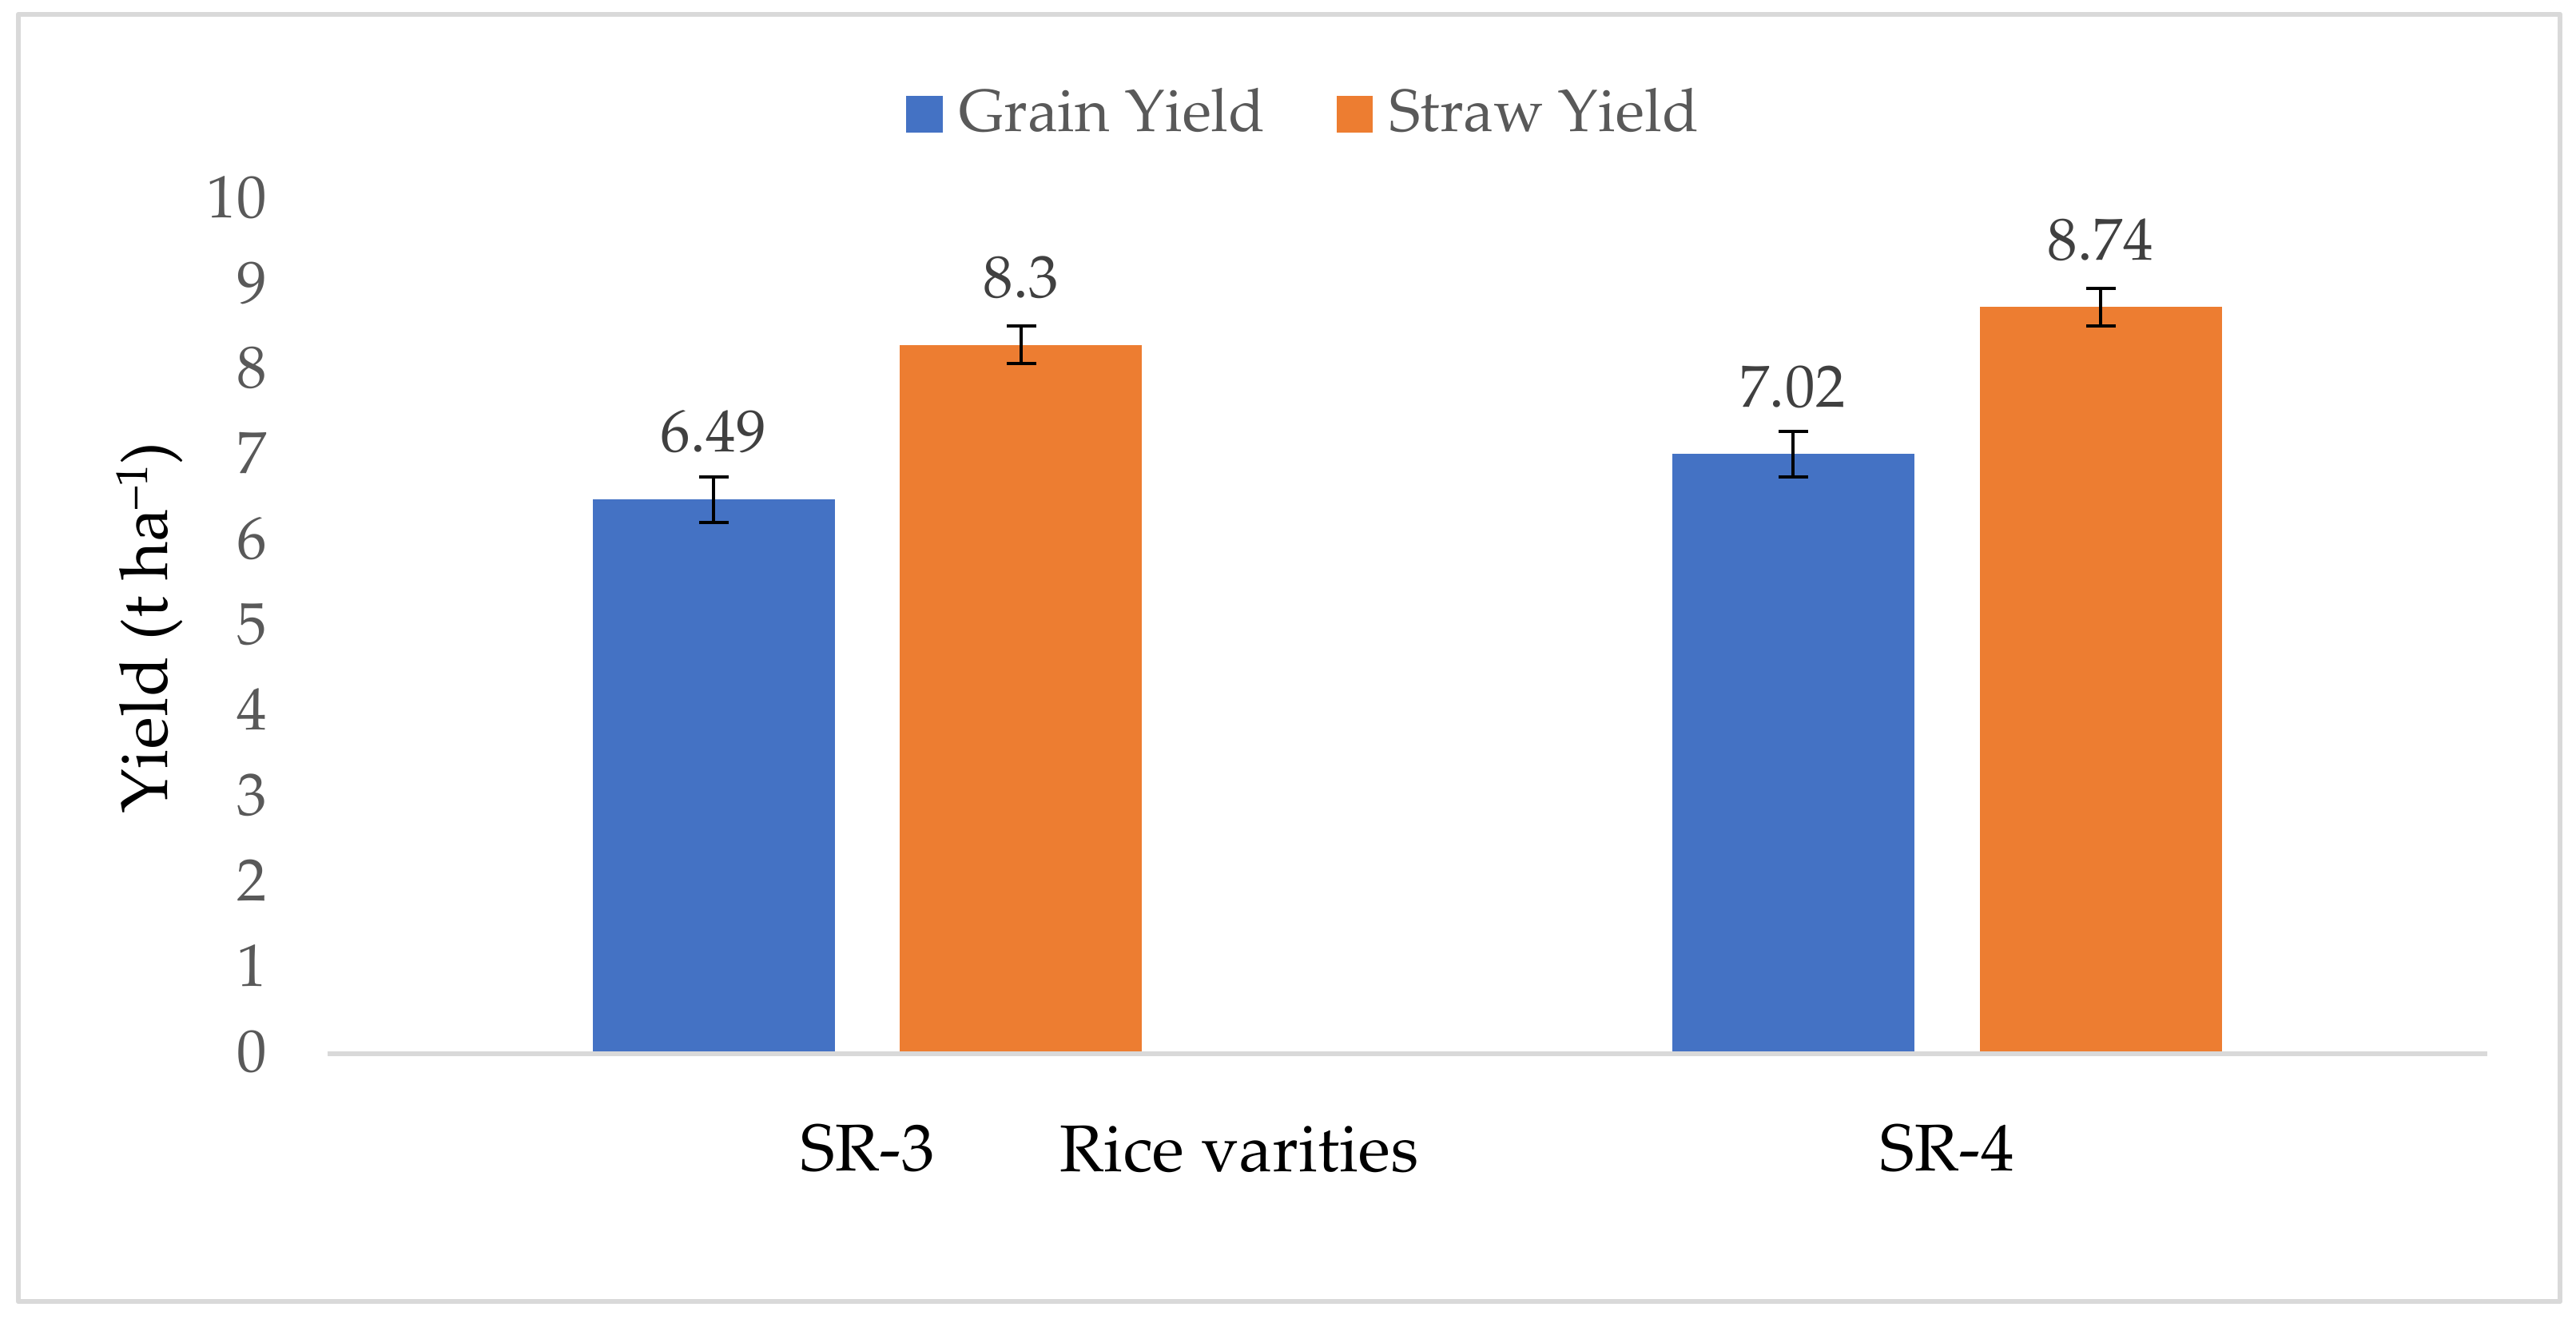
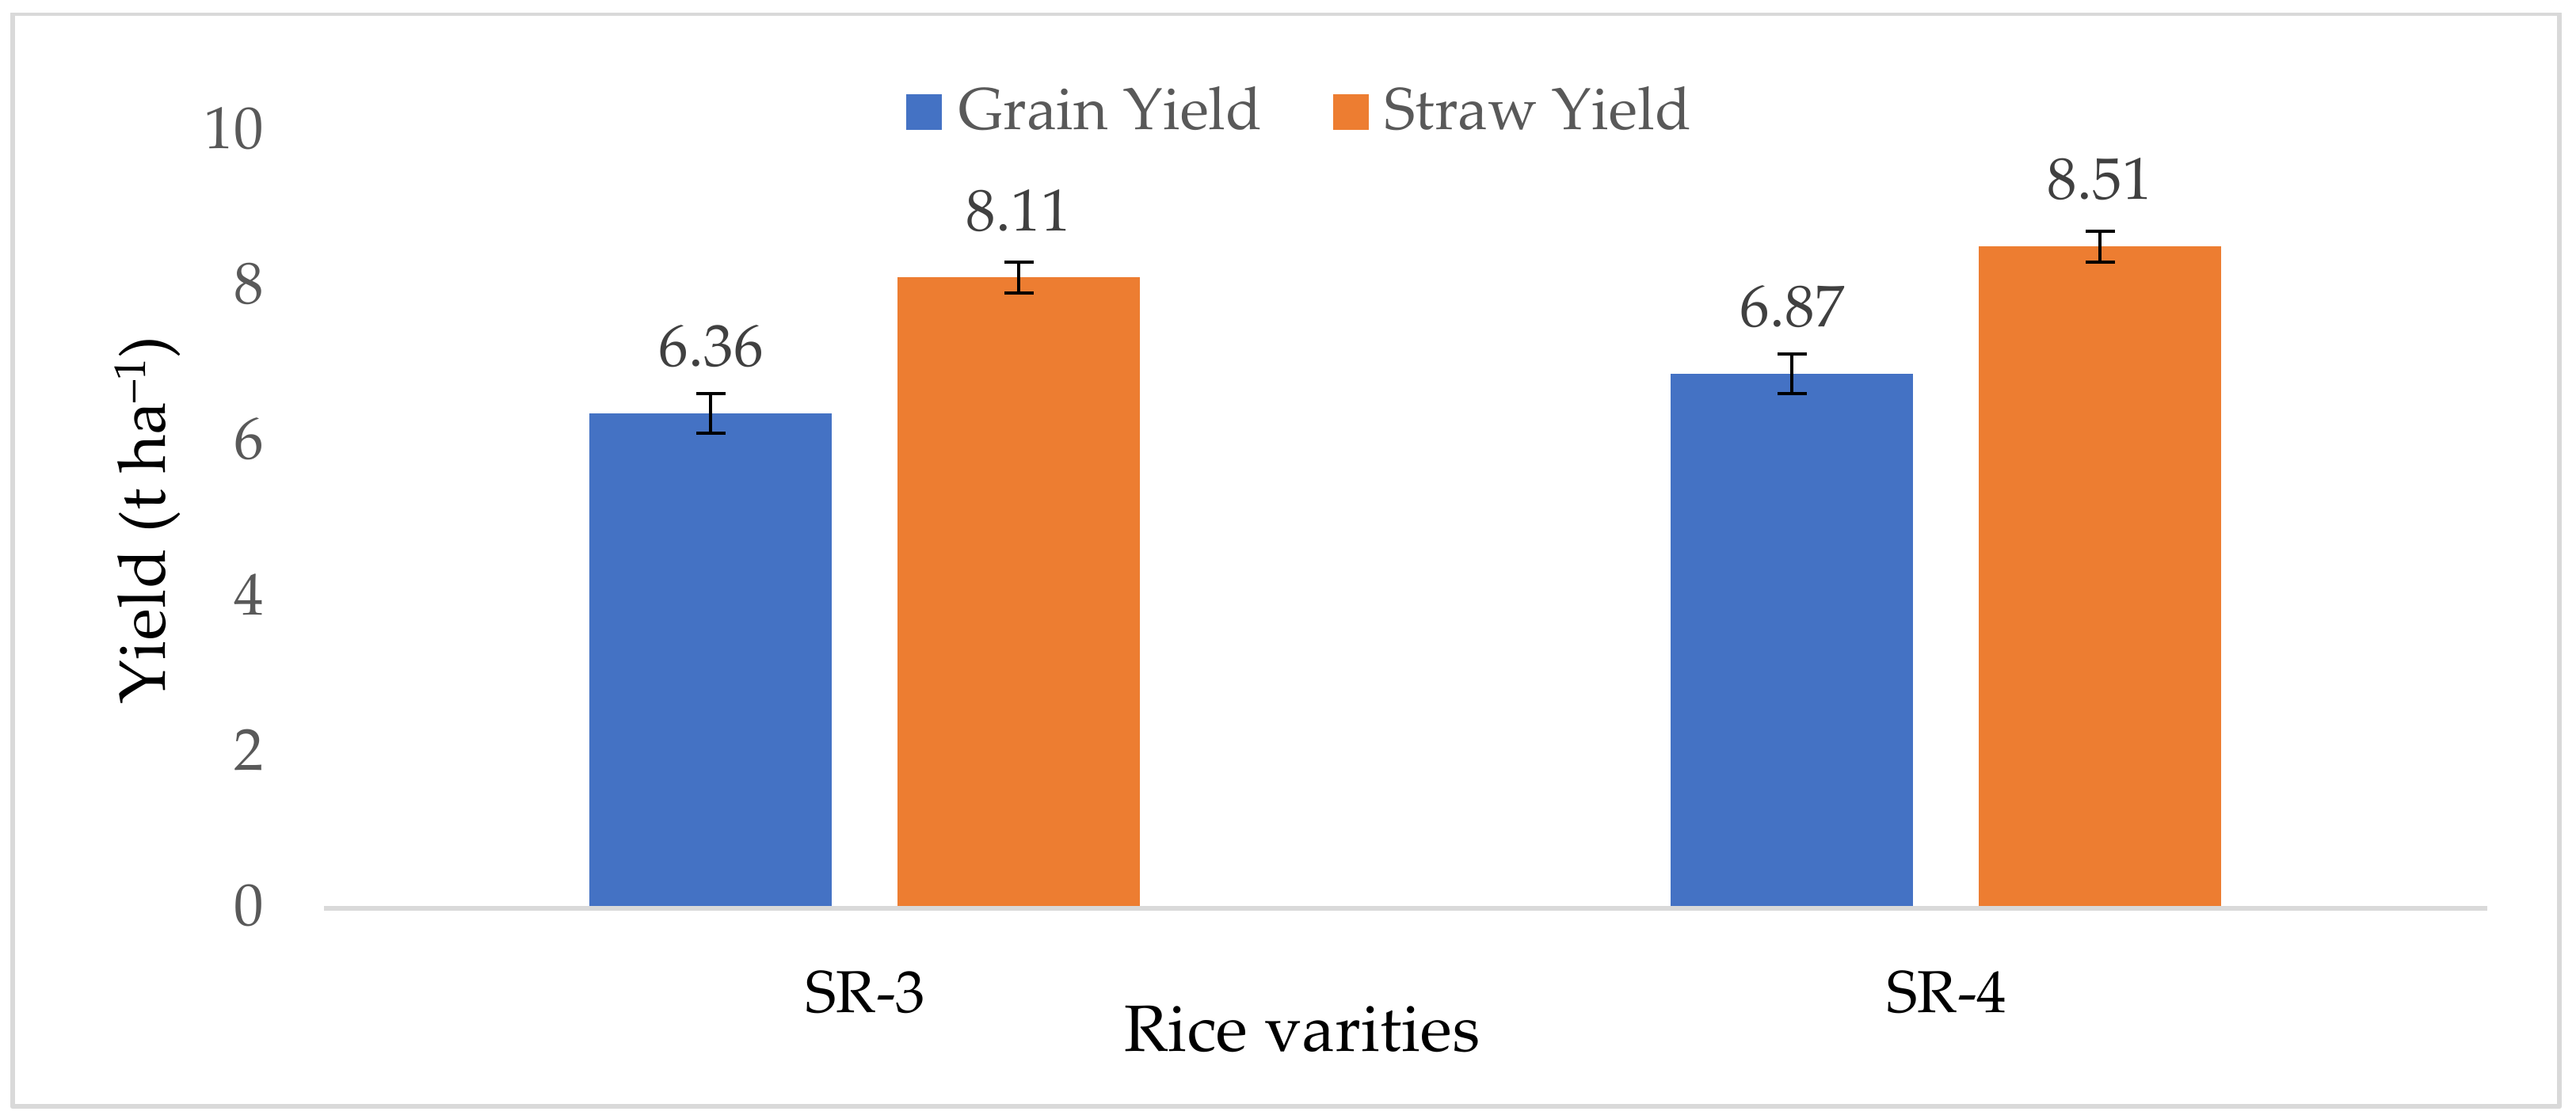
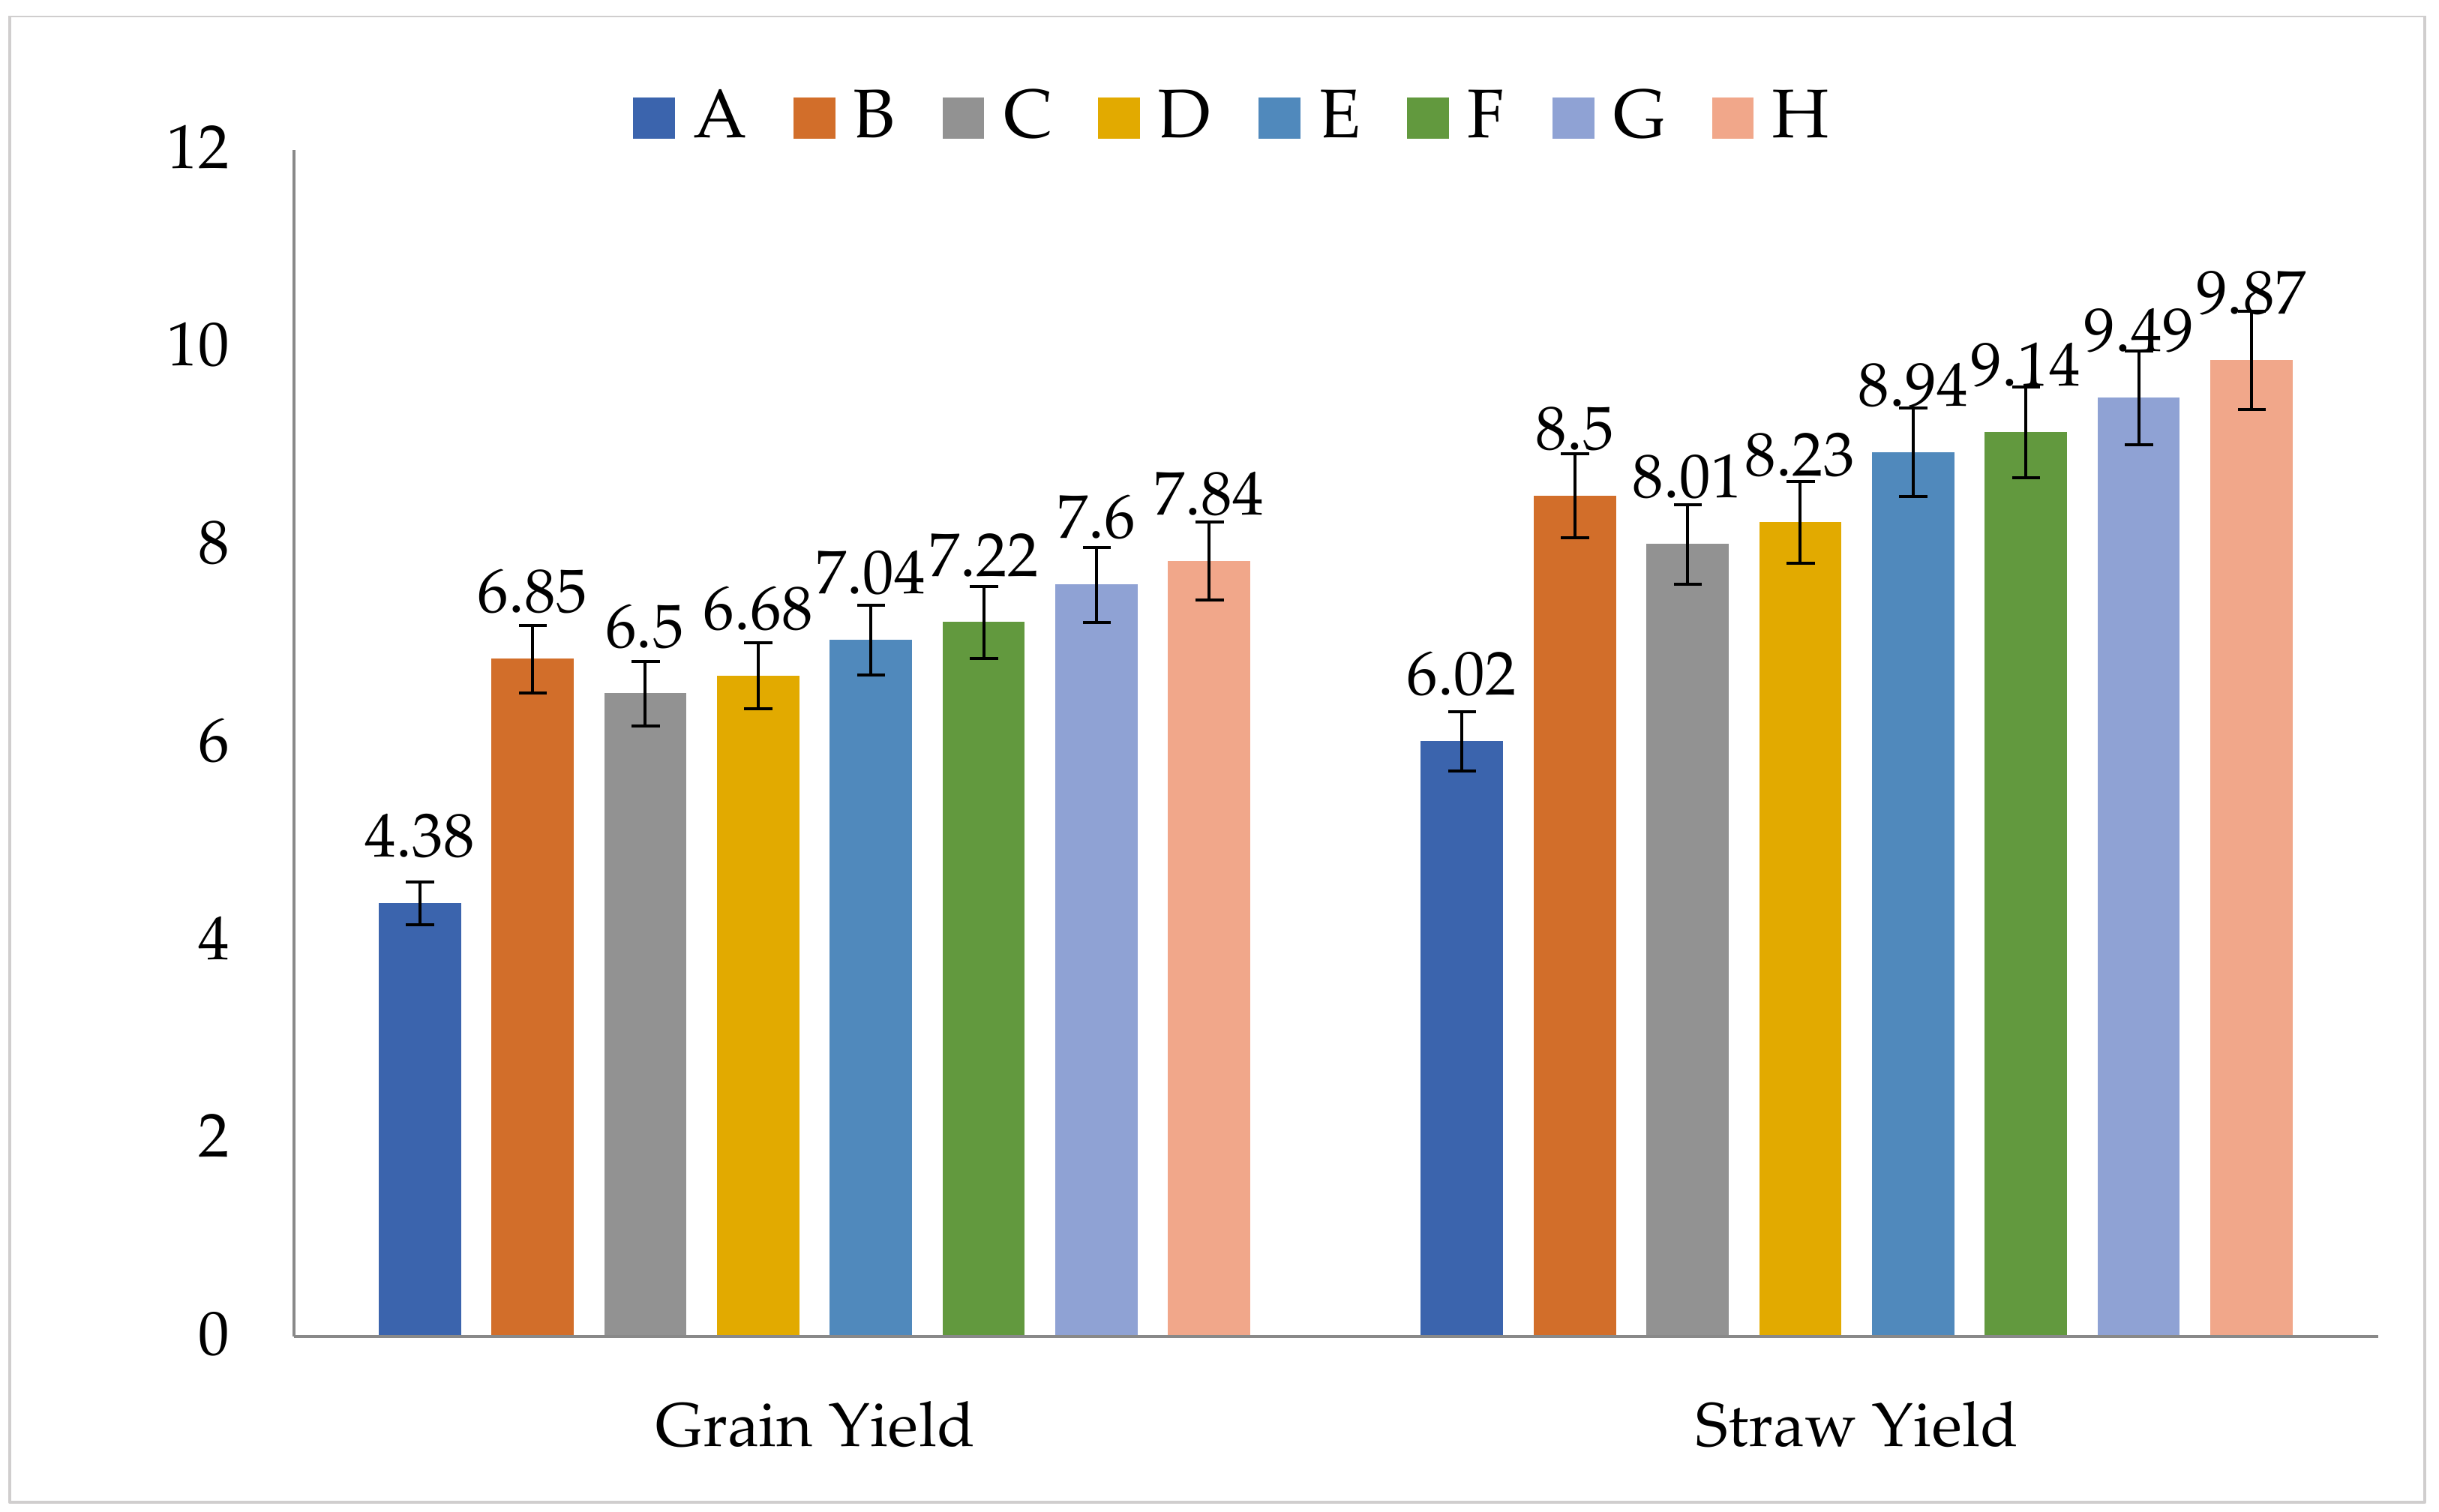
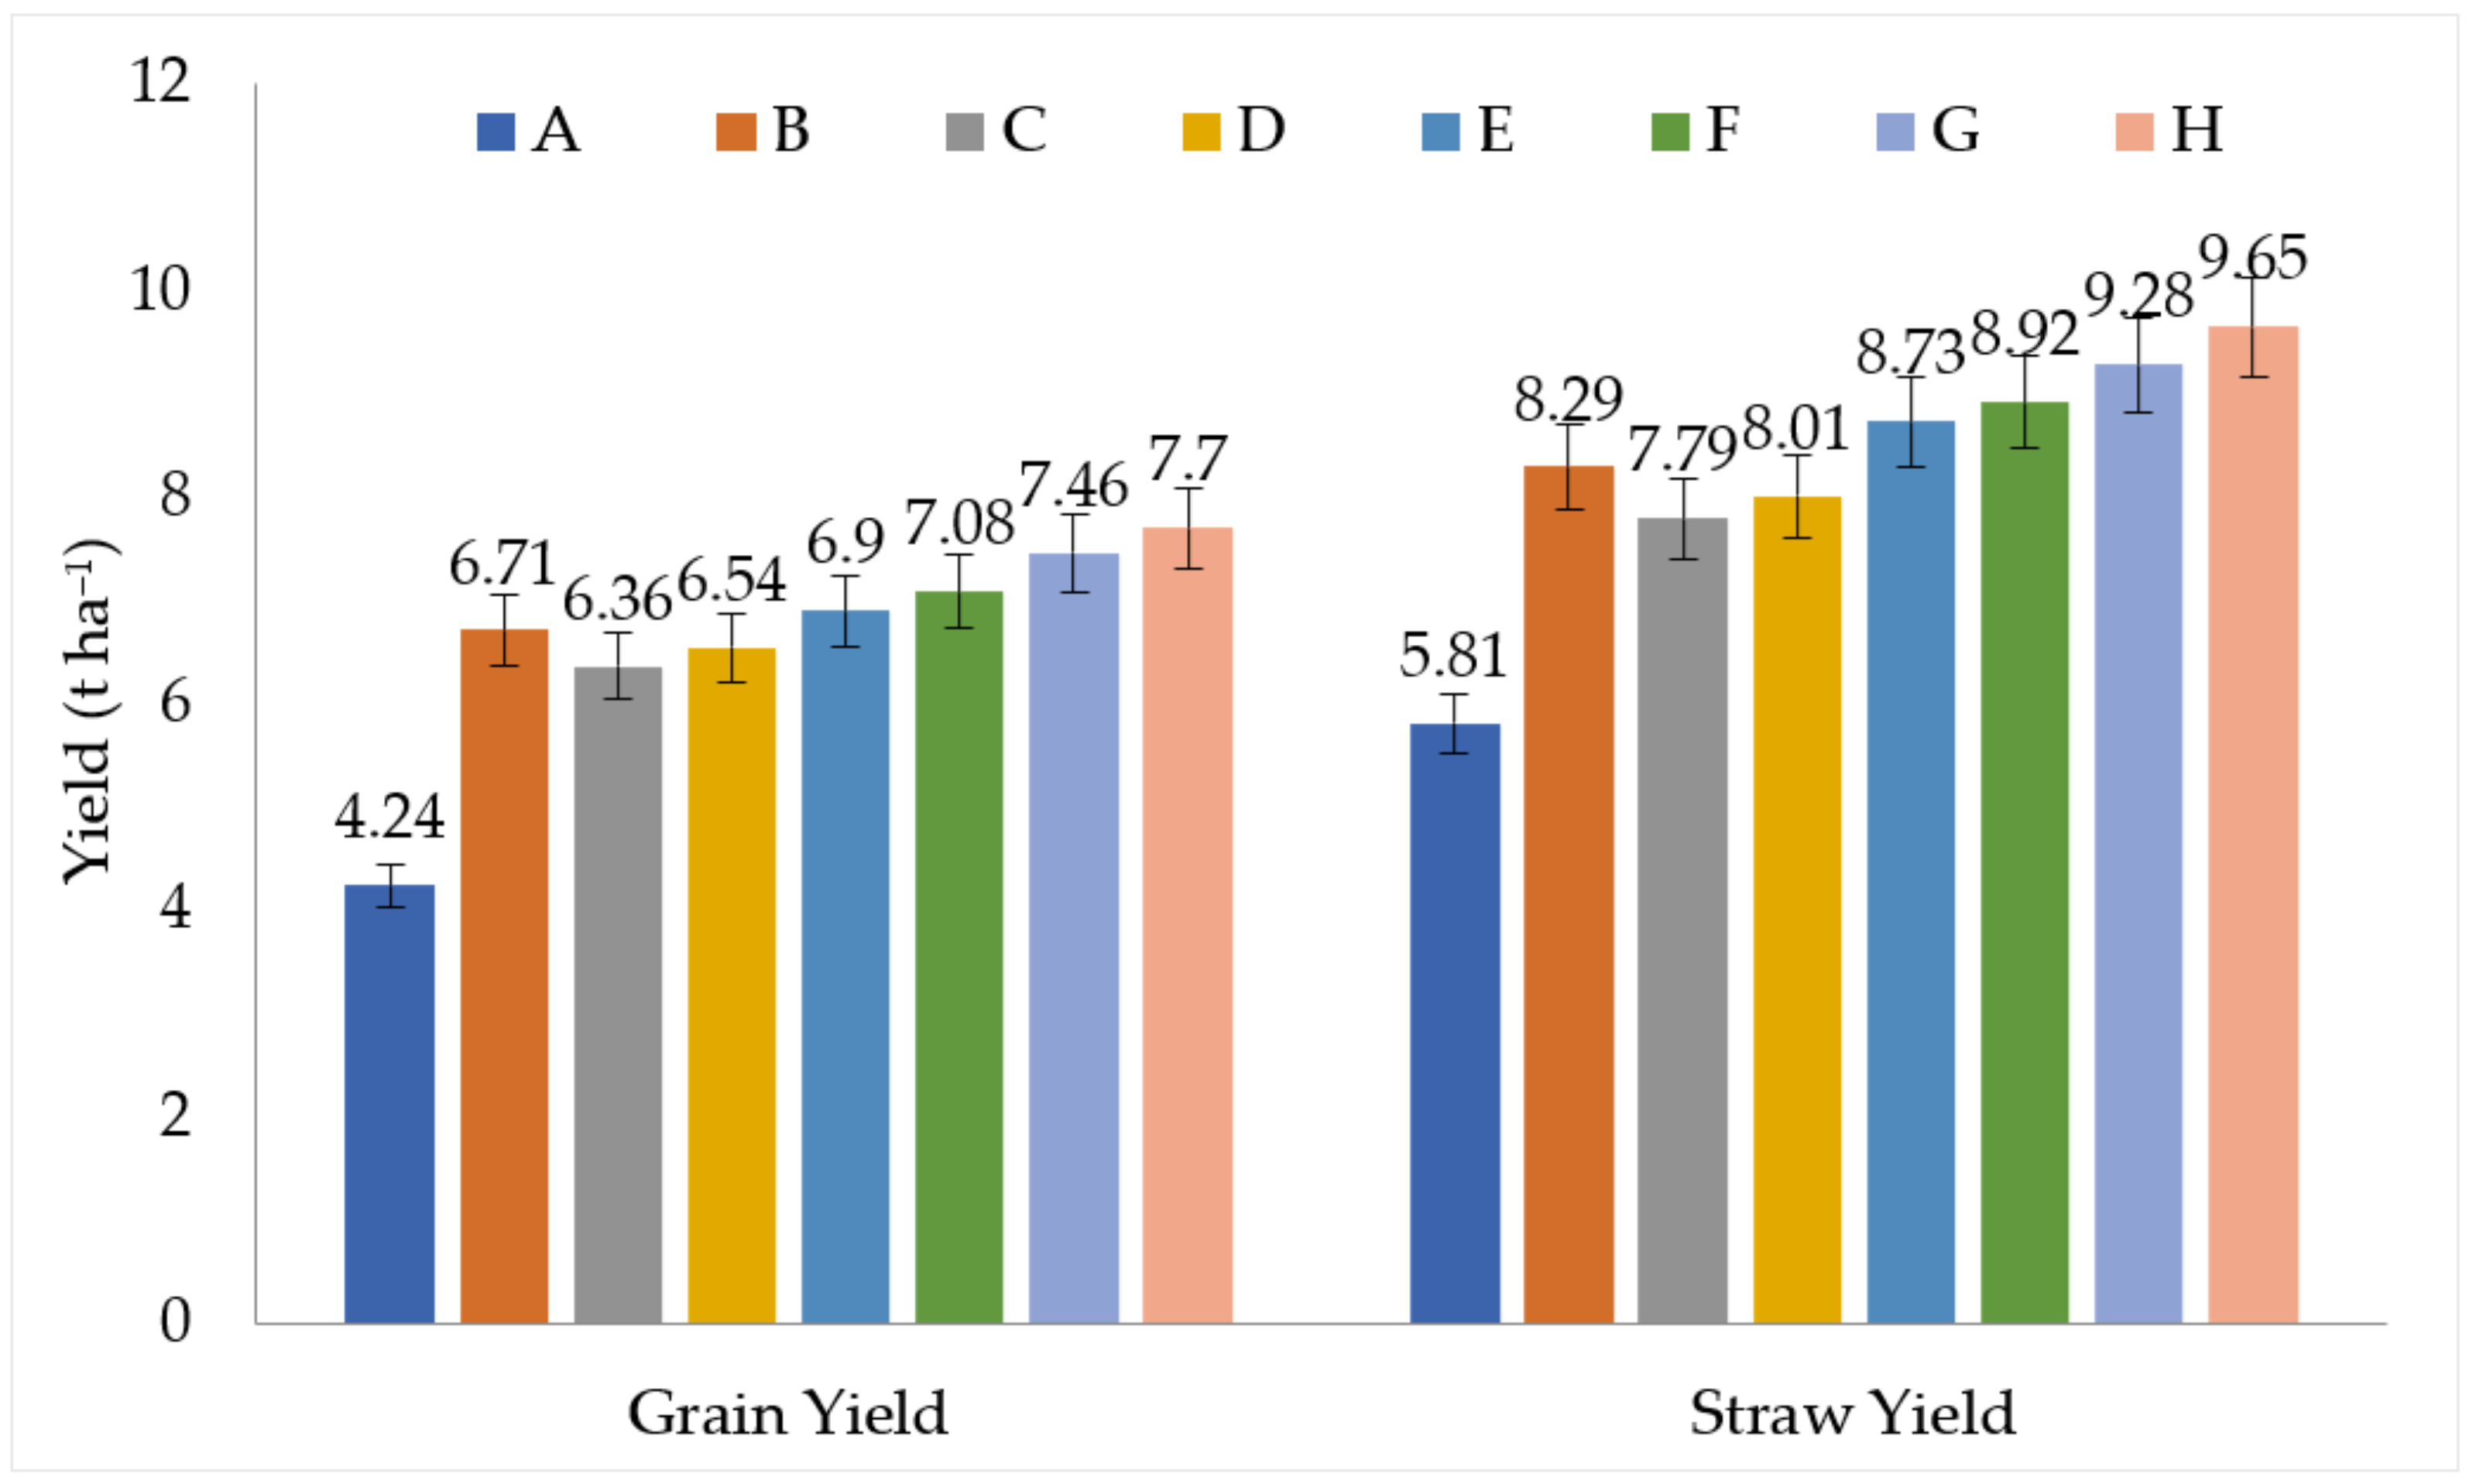
3.4. Grain and Straw Yield

Real-time N application through LCC in both rice varieties, SR-4 and SR-3, significantly influenced grain and straw yield. However, the varieties observed a substantial difference, with the highest grain yield of 7.02 and 6.87 t ha−1 produced by SR-4 as compared to SR-3, where grain yields of 6.49 and 6.36 t ha−1 during 2019 and 2020, respectively observed and were closely associated with potential growth parameters and yield attributes of this variety (Figure 3 and Figure 4). Moreover, amongst the N management practices, LCC ≤ 5 with 30 kg ha−1 showed the significantly highest grain yield of 7.84 and 7.70 t ha−1 for 2019 and 2020, respectively, which was statistically at par with LCC ≤ 5 with 20 kg ha−1 that yielded 7.60 and 7.46 t ha−1 during both years (Figure 5 and Figure 6). The straw yield of 8.74 t ha−1 (2019) and 8.51 t ha−1 (2020) was observed to be significantly higher in variety SR-4 than SR-3. Among the LCC scores, LCC ≤ 5 with 30 kg ha−1 yielded the maximum compared to other LCC scores, which were found statistically at par with LCC ≤ 5 with 20 kg ha−1 during 2019 and 2020.

3.5. Agronomic Efficiency and Apparent Nutrient Recovery

From Table 6, the data revealed that in SR-4, agronomic efficiency of 25.80 and 26.20 kg grain/kg N and recovery efficiency of 34.1 and 34.64%, respectively, were significantly superior to SR-3 during 2019 and 2020. Among LCC scores, LCC ≤ 5 with 20 kg ha−1 recorded the highest agronomic (26.85 and 26.90 kg grain/kg N) and apparent N recovery efficiency (36.02 and 35.59%), followed by LCC ≤ 4 with 20 kg ha−1, which was statistically at par with LCC ≤ 3 with 20 and 30 kg N ha−1 (application of 80 and 90 kg N ha−1), respectively.

3.6. Economics of Different Treatments

From Table 7, the economic analysis of pooled data revealed that maximum gross return, net returns, and B:C ratio was recorded in variety SR-4 in comparison to SR-3. The real-time N application through LCC ≤ 5 with 30 kg ha−1 gave the maximum gross and net returns and B:C ratio in both SR-4 and SR-3. The LCC ≤ 5 with 30 kg ha−1 recorded maximum gross returns (₹137,215.8), net returns (₹83,332.83), and B: C ratio of 1.55 with variety SR-4 compared to SR-3 where gross returns of ₹129,329.20, net returns (₹75,446.17) and B:C ratio of 1.30 were recorded. Gross returns, net returns, and B: C ratio in both varieties were recorded lowest in control during both years.

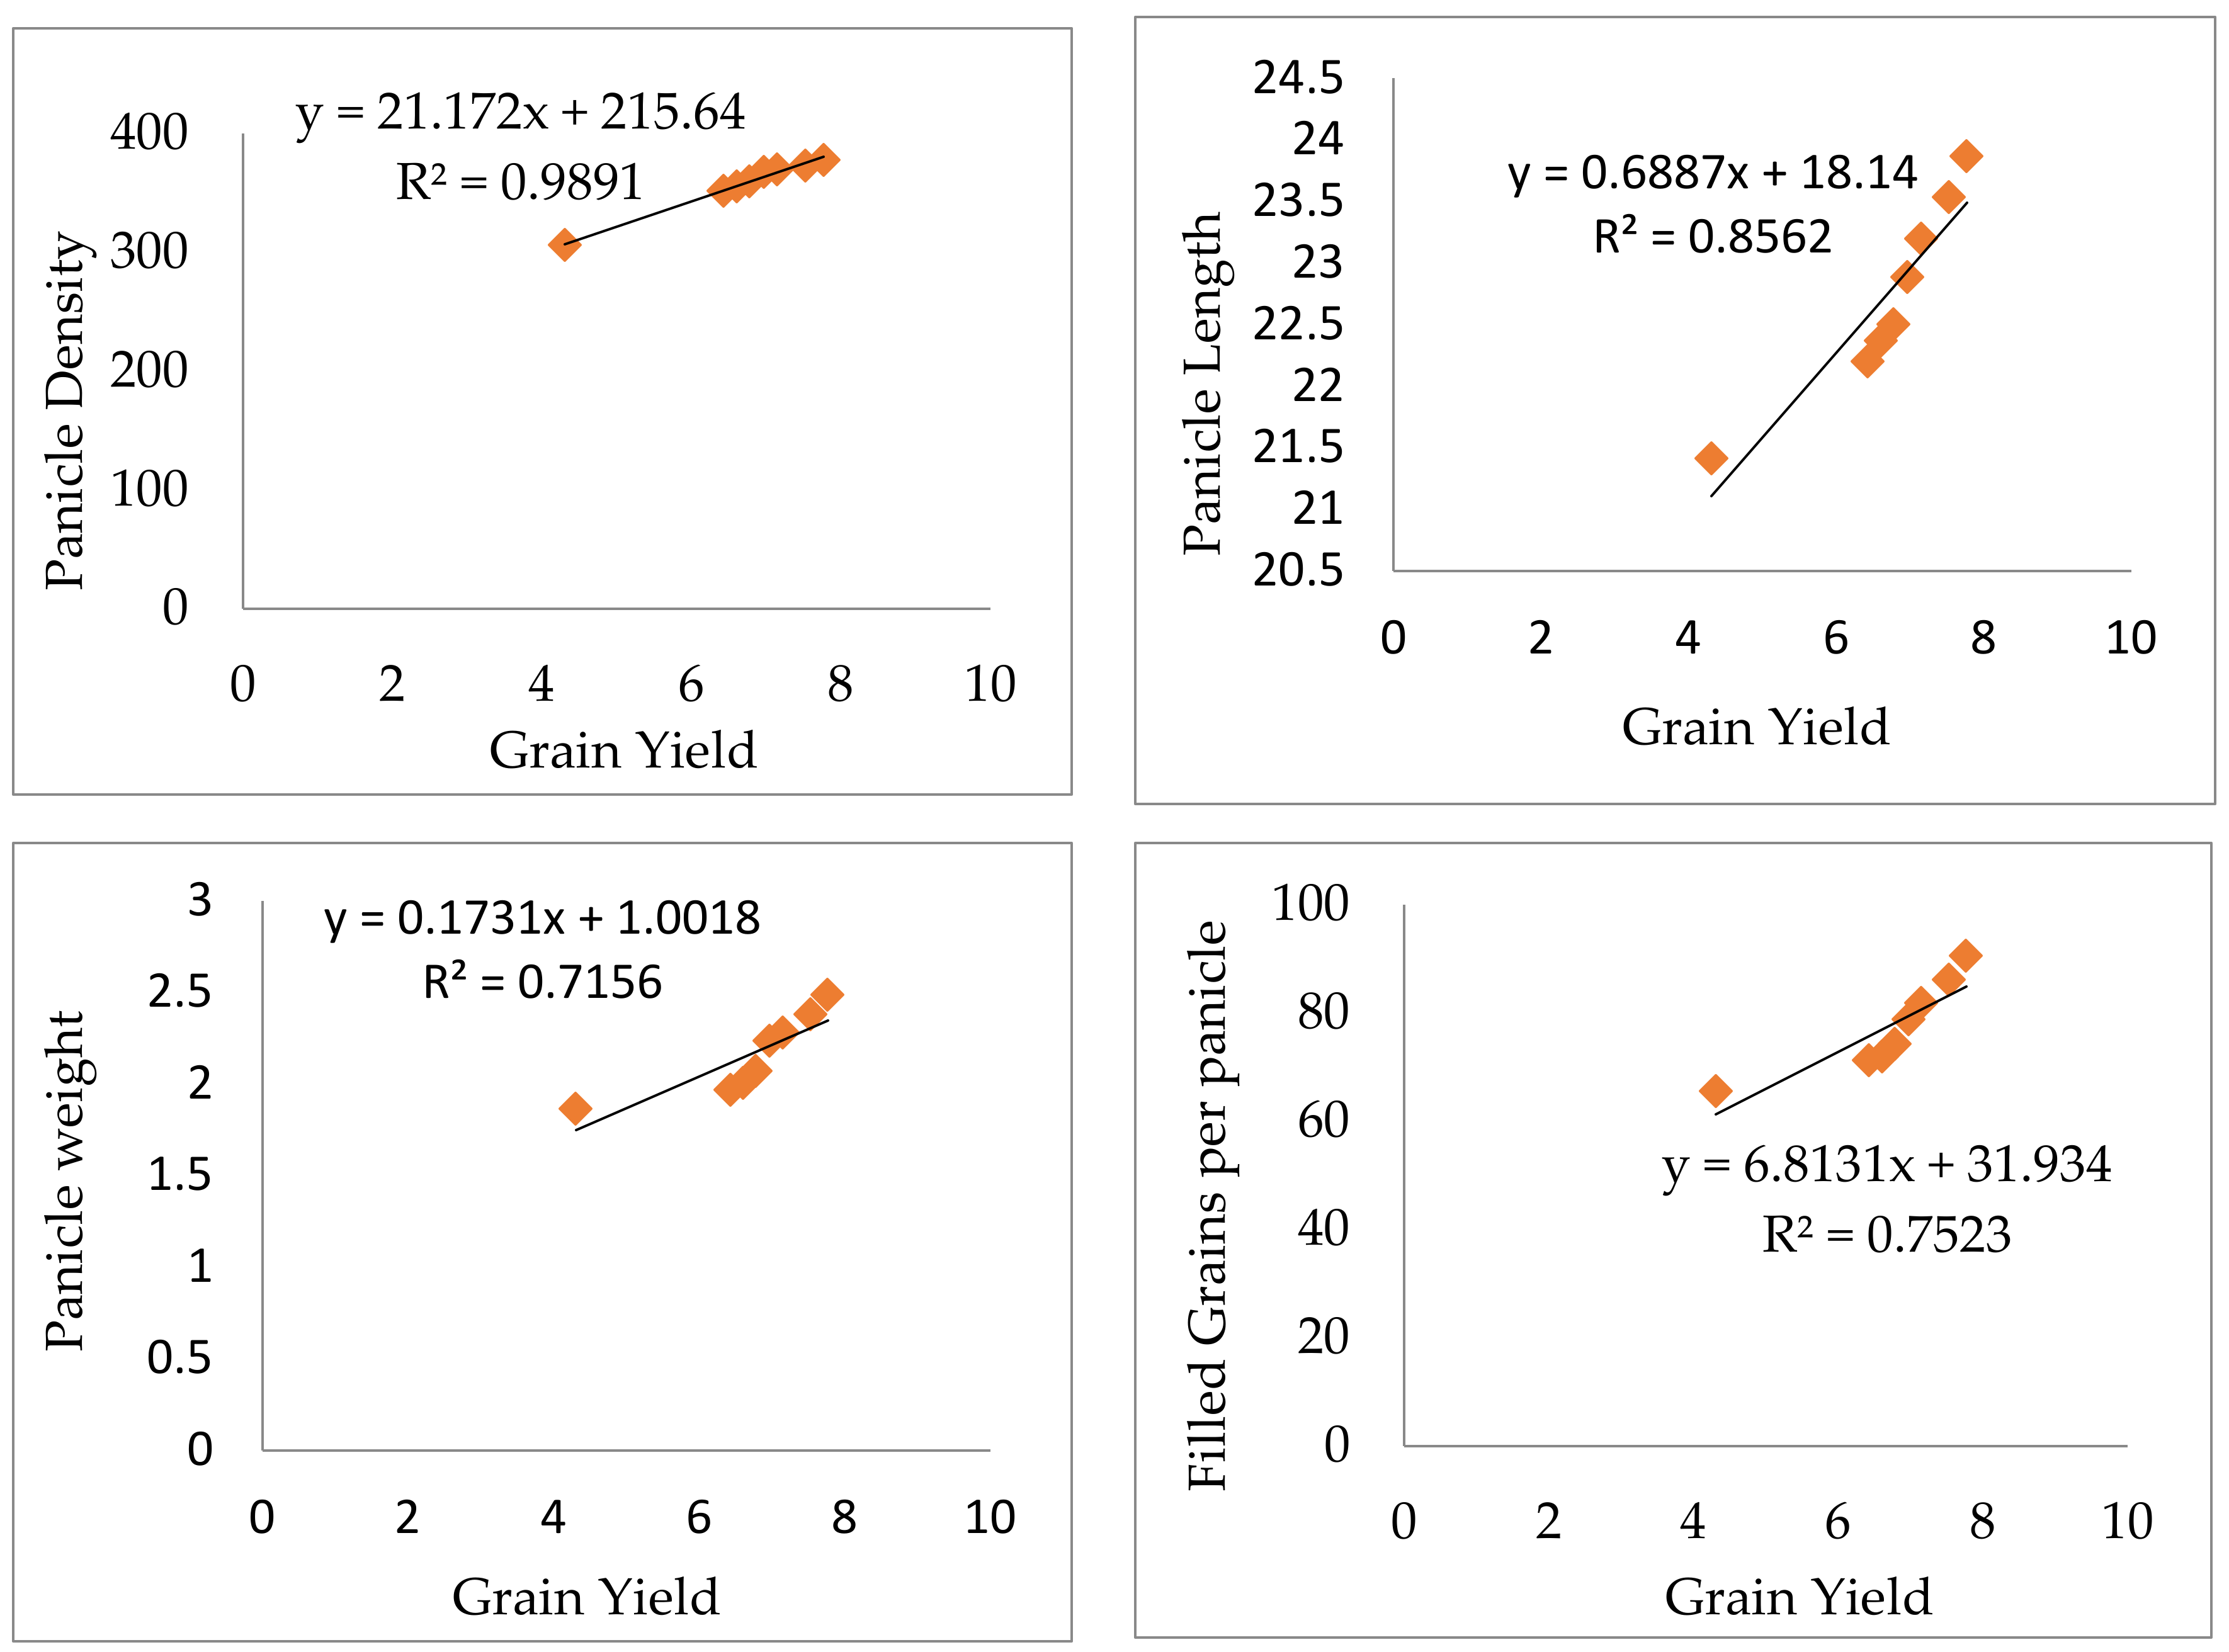
3.7. Correlation and Regression Studies

The correlation matrix in Figure 7 and Table 8 indicated a highly significant and positive relationship between grain yield with yield attributes like panicle density, panicle length, panicle weight, and filled grains per panicle. The range of correlation coefficient (r2) was 0.833 to 0.995. Panicle density recorded maximum influence on grain yield with r2 of 0.995, followed by a correlation coefficient of 0.925 between panicle length and yield. The minimum correlation of grain yield was noticed with panicle weight, but filled grains per panicle observed the highest correlation with panicle weight. The regression equation depicted that the coefficient of determination (R2) observed for grain yield were 0.98, 0.85, 0.71, and 0.75, with panicle density, panicle length, panicle weight, and filled grains per panicle being highly significant (Figure 7). The observed variation in grain yield due to panicle density, panicle length, panicle weight, and filled grains per panicle was 98%, 85%, 71%, and 75%, respectively.

4. Discussion

The main cause for the lower efficiency of nitrogen is improper splitting leading to the application of N in excess of the requirement. The most promising approach is to synchronize crop requirement with nitrogen application which can be attained by using a leaf color chart which is an inexpensive, feasible, and non-destructive method of meeting the N requirement of the crop using a need-based approach [4]. LCC is a low-cost and practically reliable diagnostic tool to guide need-based N fertilizer application in cereal crops and thus has become a very important tool for increasing crop yield and nitrogen recovery. However, there is a need to work out appropriate criteria for using LCC-based nitrogen application in rice, which should be region-specific based on the consideration of many factors like climatic conditions of the area, genotype, and soil nitrogen status. Between 2019 and 2020, the results clearly depict that variety SR-4 performed better compared to variety SR-3 for major growth parameters at the harvest stage, i.e., plant height and dry matter, which might possibly be due to variations in their genetic composition. Further different LCC scores showed significant differences with respect to growth parameters, with LCC shade five recording higher growth compared to other LCC shades. Similar inferences were made by Bhat et al. (2015) [20] while evaluating the effect of LCC-based N management on rice genotype. Plant growth and metabolism are closely linked with nitrogen application, thus ensuring enhanced cell division and elongation, which results in intermodal elongation, and ultimately increases plant height and dry matter production under its ample supply. Krishnakumar and Haefele (2013) [21] and Bhat et al. (2015) [4] reported the advantage of higher LCC scores (LCC ≤ 5) over low LCC scores (LCC ≤ 4, 3) among the various growth parameters. Although a statistically insignificant difference was observed in SR-4 and SR-3 in attaining various phenophases, SR-4 took more days, resulting in more dry matter accumulation. Considerable differences among various LCC-score based N treatments, resulted in prolonged vegetative growth parameters, due to a timely and balanced supply of nitrogen. The crop attained maturity in greater number of days when nitrogen was applied through the LCC score-based. In the case of control, crop plants switched over to the reproductive phase much earlier than LCC score-based treatments, due to the unavailability of nitrogen and took the minimum number of days to attain maturity [4,22]. The observed variation in yield attributes among the two rice varieties may be due to their inherent genetic variability. Moharana et al. (2017) [23], Bhat et al. (2015) [20], and Najarb and Mehmoodc (2017) [24] also observed significant varietal differences while evaluating rice varieties.
Under LCC score-based N management, nitrogen supply displayed a significant effect on yield parameters, which might be due to nitrogen effect on growth performance in terms of plant height and dry matter accumulation, which was contrary to control where reduced dry matter accumulation and poor development of yield parameters were observed. Under LCC ≤ 5 with 30 kg ha−1, timely accessibility of N gave more leaf area, which directly improved dry matter accumulation and consequently enhanced growth in yield parameters compared to the rest of the treatments. Increased grain yield with increasing LCC score specifies the importance of nitrogen in achieving more yield. Thus, in control, inadequate inherent N supply of soil was insufficient to meet the growing need of the crop [20]. Among the two rice varieties, the superiority of yield attributes in variety SR-4 led to significantly higher grain yield than SR-3. Several researchers have reported a significant yield enhancement with an increase in the application of N [25,26]. Moreover, nitrogen demand in rice crops changes with the advancement of growth (vegetative to maturity phase), with maximum demand observed during periods of rapid growth. Thus the application of nitrogen at rapid growth stages results in better crop development and thus, more yield [24,27]. The present findings are also supported by the work of Ahmad et al., 2016 [28], who reported that for profitable crop production, applying nutrients at critical stages while considering the soil’s inherent capability is important. Agronomic efficiency and apparent nutrient recovery are more in SR-4 than SR-3, possibly due to their genetic differences. Improvement in the dry matter under SR-4 resulted in the production of more yield than variety SR-3, indicating the close association of dry matter accumulation with its nutrient uptake, thus achieving higher N use efficiency.
Among the several LCC score-based treatments, the variation observed in N use efficiency may be possibly due to significant N losses due to the incongruity between the need and supply of nitrogen. Furthermore, statistically comparable results for grain yield in treatment LCC ≤ 5 with 30 kg ha−1 and LCC ≤ 5 with 20 kg ha−1 specified that application of N can be saved without compromising yield and high N use efficiency. Excessive application of N in LCC ≤ 5 with 30 kg ha−1 augments the cost of cultivation and increases environmental problems owing to the high leaching of N into the soil [29,30]. Timely nitrogen application to plants is critically vital so that the major portion of applied N is utilized while reducing losses to achieve higher N use efficiency. The correlation and regression analysis indicated that panicle density was the foremost yield attribute exhibiting a huge impact on grain yield and observing a variation of 98% on yield. In contrast, the panicle weight showed the least but most significant influence on grain yield with a variation of 71% only. A significant and positive impact of yield attributes on rice was observed, indicating panicle number and panicle length as the most influential yield attributes on grain yield [2]. Comparing the two rice varieties, SR-4 produced a greater yield practically at a similar cost of cultivation than SR-3, thus resulting in a high net return and BC ratio [31]. Among LCC scores, LCC ≤ 5 with 30 kg ha−1 yielded higher returns and BC ratio in both rice varieties, followed by LCC ≤ 5 with 20 kg ha−1. Though the cost of cultivation was more under LCC ≤ 5 with 30 kg ha−1, it still outperformed the other treatments by achieving more yields [32,33].

5. Conclusions

From the experiment, it was observed that need-based N fertilizer management practice based on applying LCC ≤ 5 with 30 kg ha−1 of N whenever the LCC reading was below 5 resulted in a higher yield. Further, among the rice varieties, SR-4 produced a higher yield compared to SR-3. It was further observed that grain yield recorded in LCC 3 with 20 kg ha−1 with less quantity of nitrogen produced the same results as that with a recommended dose of nitrogen. The present investigation highlighted the need-based N application through LCC. It will be effective in increasing the nitrogen use efficiency and yield in rice under the temperate climatic conditions of the Kashmir valley.

Supplementary Materials

The following supporting information can be downloaded at: https://www.mdpi.com/article/10.3390/agronomy12092229/s1, Figure S1. Different LCC shades used for nitrogen application in rice varieties SR-4 and Sr-3.

Author Contributions

Conceptualization, T.A.B.; methodology, T.A.B., R.H.K., B.J. and S.A.A.; software, A.N., N.B.N. and T.M.; validation, T.A.B., R.H.K., M.S.M., A.N., K.A.D. and S.F.; formal analysis, N.B.N., K.A.D., T.M. and A.G.; investigation, M.S.M., S.F. and R.H.K.; resources, S.A.A., I.A.-A., A.K., A.G. and M.H.u.R.; writing—original draft preparation, T.A.B., B.J., S.A.A., N.B.N. and A.E.S.; writing—review and editing, S.A.A., M.S.M., S.F., A.N., A.G., K.A.D., I.A.-A., A.K., M.H.u.R. and A.E.S. All authors have read and agreed to the published version of the manuscript.

Funding

The authors extend their appreciation to the Researchers Supporting Project number (RSP-2021/298), King Saud University, Riyadh, Saudi Arabia.

Data Availability Statement

Not applicable.

Acknowledgments

The authors extend their appreciation to the Researchers Supporting Project number (RSP-2021/298), King Saud University, Riyadh, Saudi Arabia. The authors express the deepest appreciation to the Division of Agronomy; Faculty of Agriculture, Sher-e-Kashmir University of Agricultural Sciences and Technology of Kashmir, Wadura, Sopore -193201, India, for providing all the necessary facilities, suggestions, help, cooperation, and praise to complete the research.

Conflicts of Interest

The authors declare no conflict of interest.

References

  1. Pocketbook, F.S. World Food and Agriculture; FAO: Rome, Italy, 2015. [Google Scholar]
  2. Nazir, A.; Bhat, M.A.; Bhat, T.A.; Fayaz, S.; Mir, M.S.; Basu, U.; Ahanger, S.A.; Altaf, S.; Jan, B.; Lone, B.A. Comparative Analysis of Rice and Weeds and Their Nutrient Partitioning under Various Establishment Methods and Weed Management Practices in Temperate Environment. Agronomy 2022, 12, 816. [Google Scholar] [CrossRef]
  3. Wahiddin, D.; Roespinoedji, R.; Masruriyah, A. Color feature extraction and euclidean distance for classification of oryza sativa nitrogen adequacy based on leaf color chart (LCC). Int. J. Psychosoc. Rehabil. 2020, 24, 3421–3428. [Google Scholar]
  4. Bhat, T.A.; Kotru, R.; Ahmad, L.; Ganai, M.A. Management of nitrogen through leaf colour chart (LCC) in rice under irrigated conditions of Kashmir. Appl. Biol. Res. 2015, 17, 24–30. [Google Scholar] [CrossRef]
  5. Fayaz, S.; Kanth, R.; Bhat, T.; Bhat, M.; Alie, B.; Dar, Z.; Mehdi, Z.; Maqbool, S.; Rasool, K. Effect of precision nitrogen management through lcc on nutrient content and uptake of maize (Zea mays L.) under temperate conditions of Kashmir. Int. J. Plant Soil Sci. 2021, 33, 1–11. [Google Scholar] [CrossRef]
  6. Nayyar, A.; Bijay-Singh; Yadvinder-Singh. Nitrogen-Supplying Capacity of Soils for Rice and Wheat and Nitrogen Availability Indices in Soils of Northwest India. Commun. Soil Sci. Plant Anal. 2006, 37, 961–976. [Google Scholar] [CrossRef]
  7. Pathak, H.; Aggarwal, P.; Roetter, R.; Kalra, N.; Bandyopadhaya, S.; Prasad, S.; Van Keulen, H. Modelling the quantitative evaluation of soil nutrient supply, nutrient use efficiency, and fertilizer requirements of wheat in India. Nutr. Cycl. Agroecosyst. 2003, 65, 105–113. [Google Scholar] [CrossRef]
  8. Thind, H.; Kumar, A.; Vashistha, M. Calibrating the leaf colour chart for need based fertilizer nitrogen management in different maize (Zea mays L.) genotypes. Field Crops Res. 2011, 120, 276–282. [Google Scholar]
  9. Ladha, J.K.; Pathak, H.; Krupnik, T.J.; Six, J.; van Kessel, C. Efficiency of fertilizer nitrogen in cereal production: Retrospects and prospects. Adv. Agron. 2005, 87, 85–156. [Google Scholar]
  10. Fageria, N.; Baligar, V. Properties of termite mound soils and responses of rice and bean to nitrogen, phosphorus, and potassium fertilization on such soil. Commun. Soil Sci. Plant Anal. 2005, 35, 2097–2109. [Google Scholar] [CrossRef]
  11. Singh, B.; Gupta, R.; Singh, Y.; Gupta, S.; Singh, J.; Bains, J.; Vashishta, M. Need-based nitrogen management using leaf color chart in wet direct-seeded rice in northwestern India. J. New Seeds 2006, 8, 35–47. [Google Scholar] [CrossRef]
  12. Hussain, F.; Bronson, K.; Yadvinder, S.; Singh, B.; Peng, S. Use of chlorophyll meter sufficiency indices for nitrogen management of irrigated rice in Asia. Agron. J. 2000, 92, 875–879. [Google Scholar] [CrossRef]
  13. Bhat, T.A.; Kotru, R.; Verma, A.; Ganai, M.A.; Latie, L.A.D.; Teli, N.A. Leaf Colour Chart Based N Management for Yield, Nutrient Uptake and Yield of Rice Genotypes. Int. J. Curr. Microbiol. Appl. Sci. 2017, 6, 3531–3538. [Google Scholar]
  14. Piper, C. Soil and Plant Analysis; Asia Edition; Hans Publishers: Mumbai, India, 1966. [Google Scholar]
  15. Jackson, M. Soil Chemical Analysis; Pentice Hall of India Pvt. Ltd.: New Delhi, India, 1973; Volume 498, pp. 151–154. [Google Scholar]
  16. Walkely, A.; Black, T. Determination of organic carbon by rapid titration method. Soil Sci. 1934, 37, 29–35. [Google Scholar]
  17. Subbaiah, B. A rapid procedure for estimation of available nitrogen in soil. Curr. Sci. 1956, 25, 259–260. [Google Scholar]
  18. Olsen, S.R. Estimation of Available Phosphorus in Soils by Extraction with Sodium Bicarbonate; US Department of Agriculture: Washinton, DC, USA, 1954. [Google Scholar]
  19. R.C. Team. R: A Language and Environment for Statistical Computing; R Foundation for Statistical Computing: Vienna, Austria, 2015; Available online: http://www.R-Proj.org/2013 (accessed on 7 August 2022).
  20. Bhat, T.A.; Kotru, R.; Singh, K.; Dar, S.B.; Ram, H. Real-time nitrogen management using leaf colour chart in rice (Oryza sativa) genotypes. Indian J. Agron. 2015, 60, 70–75. [Google Scholar]
  21. Srinivasagam, K.; Stephan, H. Integrated nutrient management and LCC based nitrogen management on soil fertility and yield of rice (Oryza sativa L.). Sci. Res. Essays 2013, 8, 2059–2067. [Google Scholar] [CrossRef]
  22. Bhavana, B.; Laxminarayana, P.; Latha, A.M.; Anjaiah, T. Judicious Nitrogen Management using Leaf Colour Chart for Enhancing Growth and Yield of Short Duration Transplanted Rice (Oryza sativa L). Int. J. Curr. Microbiol. Appl. Sci. 2020, 9, 2850–2856. [Google Scholar] [CrossRef]
  23. Moharana, S.; Gulati, J.; Jena, S. Effect of LCC-based nitrogen application on growth and yield of rice (Oryza sativa L.) varieties during dry season. Indian J. Agric. Res. 2017, 51, 49–53. [Google Scholar]
  24. Najarb, G.; Mehmoodc, M.A. Nitrogen Management in Rice through Leaf Colour Chart under Kashmir Conditions. Int. J. Eng. Res. Technol. 2017, 6, 50–54. [Google Scholar]
  25. Liu, J.; Jiang, B.; Shen, J.; Zhu, X.; Yi, W.; Li, Y.; Wu, J. Contrasting effects of straw and straw-derived biochar applications on soil carbon accumulation and nitrogen use efficiency in double-rice cropping systems. Agric. Ecosyst. Environ. 2021, 311, 107286. [Google Scholar] [CrossRef]
  26. Iqbal, B.; Anwar, S.; Iqbal, F.; Khattak, W.; Islam, M.; Khan, S. Response of wheat crop to humic acid and nitrogen levels. Ec Agric. 2016, 3, 558–565. [Google Scholar]
  27. Sen, A.; Srivastava, V.K.; Singh, M.K.; Singh, R.K.; Kumar, S. Leaf colour chart vis-a-vis nitrogen management in different rice genotypes. Am. J. Plant Sci. 2011, 2, 223. [Google Scholar] [CrossRef]
  28. Ahmad, N.; Zada, A.; Junaid, M.; Ali, A. Bridging the Yield Gap in Rice Production by Using Leaf Color Chart for Nitrogen Management. J. Bot. 2016, 2016, 2728391. [Google Scholar] [CrossRef]
  29. Maiti, D.; Das, D.; Karak, T.; Banerjee, M. Management of nitrogen through the use of leaf color chart (LCC) and soil plant analysis development (SPAD) or chlorophyll meter in rice under irrigated ecosystem. Sci. World J. 2004, 4, 709561. [Google Scholar] [CrossRef]
  30. Ali, A.M.; Thind, H.S.; Sharma, S.; Singh, Y. Site-specific nitrogen management in dry direct-seeded rice using chlorophyll meter and leaf colour chart. Pedosphere 2015, 25, 72–81. [Google Scholar] [CrossRef]
  31. Jahan, N.A.; Yeasmin, S.; Anwar, M.P.; Islam, M.A.; Rahman, H.; Islam, A.M. Efficacy and economics of different need based nitrogen management approaches in winter rice. Am. J. Plant Sci. 2018, 9, 2601–2611. [Google Scholar] [CrossRef]
  32. Bhupender, S.; Sharma, P. Effect of nitrogen management using leaf colour chart (LCC) on growth, yield attributes and yield in transplanted rice (Oryza sativa L.). Asian J. Soil Sci. 2016, 11, 151–154. [Google Scholar]
  33. Nachimuthu, G.; Velu, V.; Malarvizhi, P.; Ramasamy, S.; Sellamuthu, K. Effect of real time N management on biomass production, nutrient uptake and soil nutrient status of direct seeded rice (Oryza sativa L.). Am. J. Plant Physiol. 2007, 2, 214–220. [Google Scholar] [CrossRef]
Figure 1. Mean meteorological data during rice crop growth season of 2019. Where SSH means sunshine hours, RH1 and RH2 mean maximum and minimum relative humidity.
Agronomy 12 02229 g001
Figure 2. Mean meteorological data during rice crop growth season of 2020. Where SSH means sunshine hours, RH1 and RH2 mean maximum and minimum relative humidity.
Agronomy 12 02229 g002
Figure 3. Effect of rice varieties on grain and straw yield during the year 2019.
Agronomy 12 02229 g003
Figure 4. Effect of rice varieties on grain and straw yield during the year 2020.
Agronomy 12 02229 g004
Figure 5. Effect of LCC N application on grain and straw yield during 2019. Where, A—Control; B—Recommended N dose; C—20 kg N (Basal) +LCC ≤3 with 20 kg ha−1; D—30 kg N (Basal) +LCC ≤3 with 30 kg ha−1; E—20 kg N (Basal) +LCC ≤4 with 20 kg ha−1; F—30 kg N (Basal) +LCC ≤4 with 30 kg ha−1; G—20 kg N (Basal) +LCC ≤5 with 20 kg ha−1; H—30 kg N (Basal) +LCC ≤5 with 30 kg ha−1.
Agronomy 12 02229 g005
Figure 6. Effect of LCC N application on grain and straw yield during 2020. Where, A—Control; B—Recommended N dose; C—20 kg N (Basal) +LCC ≤3 with 20 kg ha−1; D—30 kg N (Basal) +LCC ≤3 with 30 kg ha−1; E—20 kg N (Basal) +LCC ≤4 with 20 kg ha−1; F—30 kg N (Basal) +LCC ≤4 with 30 kg ha−1; G—20 kg N (Basal) +LCC ≤5 with 20 kg ha−1; H—30 kg N (Basal) +LCC ≤5 with 30 kg ha−1.
Agronomy 12 02229 g006
Figure 7. Linear regression line of grain yield with yield attributes.
Agronomy 12 02229 g007
Table 1. Physico-chemical status of soil at the experimental field of rice.
CharacteristicsStatusRangeMethod Used
A.
Physical Texture
International Pipette Method
(Piper, 1966) [14]
coarse sand10.50
Silt (%)54.20
Clay (%)35.30
Texture Silty-clay–loam
B.
Chemical Analysis
pH6.94NeutralBlackman’s glass method [15]
OC0.99 (%)MediumBlack and Walkley method [16]
Available N292 (kg ha−1)MediumPotassium permanganate method [17]
Available P9.7 (kg ha−1)MediumExtraction with 0.5M NaoHCO3 [18]
Available K280 (kg ha−1)MediumFlame photometer method [15]
Table 3. Effect of need-based N application on plant height and dry matter of rice varieties (SR-3 and SR-4).
TreatmentsPlant Height (cm)Dry Matter (t ha−1)
2019202020192020
Factor A: Varieties
SR-3118.95 b117.05 b14.59 b14.14 b
SR-4123.95 a122.47 a15.62 a15.21 a
LSD (p ≤ 0.05)2.031.900.480.52
Factor B: LCC N application
Control110.93 d109.25 d13.25 d12.82 d
Recommended N dose120.83 bc119.14 bc14.97 bc14.54 bc
20 kg N (Basal) + LCC ≤3 with 20 kg ha−1118.07 c116.38 c14.62 c14.19 c
30 kg N (Basal) + LCC ≤3 with 30 kg ha−1118.63 bc116.95 bc14.80 bc14.38 bc
20 kg N (Basal) + LCC ≤4 with 20 kg ha−1122.54 b120.86 b15.26 b14.83 b
30 kg N (Basal) + LCC ≤4 with 30 kg ha−1124.74 b123.06 b15.55 b15.12 b
20 kg N (Basal) + LCC ≤5 with 20 kg ha−1126.77 ab125.08 ab15.91 ab15.48 ab
30 kg N (Basal) + LCC ≤5 with 30 kg ha−1129.07 a127.38 a16.51 a16.08 a
LSD (p ≤ 0.05)4.073.900.620.60
Means followed by different letters indicate significance (p ≤ 0.05) among treatments as per DmRT.
Table 4. Effect of need-based N application on different phenological stages (days taken) of rice varieties (SR-3 and SR-4).
TreatmentsMaximum
Tillering
Panicle
Initiation
50% FloweringDough
Stage
Maturity
2019202020192020201920202019202020192020
Factor A: Varieties
SR-352 a50 a64 a61 a85 a83 a118 a116 a137 a136 a
SR-454 a53 a65 a63 a89 a88 a120 a120 a140 a139 a
LSD (p ≤ 0.05)NSNSNSNSNSNSNSNSNSNS
Factor B: LCC N application
Control46 d45 d57 d55 d79 de78 e112 d111 d130 e129 d
Recommended N dose53 bc52 bc65 bc63 b86 cd85 c119 bc118 bc138 bc137 bc
20 kg N (Basal) + LCC≤3 with 20 kg ha−150 c49 c62 c60 c84 d83 d116 c115 c134 cd133 c
30 kg N (Basal) + LCC ≤3 with 30 kg ha−152 bc51 bc63 bc61 bc86 cd85 c118 bc117 bc137 c136 bc
20 kg N (Basal) + LCC ≤4 with 20 kg ha−153 bc52 bc65 bc63 b87 bc86 bc120 b119 b140 bc139 b
30 kg N (Basal) + LCC ≤4 with 30 kg ha−154 ab53 ab66 ab64 b89 b88 b122 ab121 ab141 b140 b
20 kg N (Basal) + LCC ≤5 with 20 kg ha−156 ab55 ab67 ab65 ab90 ab89 ab123 ab122 ab143 ab142 ab
30 kg N (Basal) + LCC ≤5 with 30 kg ha−157 a56 a69 a67 a92 a91 a125 a124 a145 a144 a
LSD (p ≤ 0.05)3.683.453.202.902.822.713.823.633.153.07
Means followed by different letters indicate significance (p ≤ 0.05) among treatments as per DmRT.
Table 5. Effect of need-based N application on yield attributes of rice varieties (SR-3 and SR-4).
TreatmentsPanicles m−2Panicle Length
(cm)
Panicle Weight (g)Filled Grains
Panicle−1
20192019201920202019202020192020
Factor A: Varieties
SR-3349.17 b343.27 b23.11 b21.89 b2.18 b1.92 b75.81 b73.14 b
SR-4371.17 a365.85 a23.51 a22.48 a2.39 a2.15 a81.81 a79.39 a
LSD (p ≤ 0.05)11.529.880.300.230.070.052.302.05
Factor B: LCC N application
Control309.02 d302.84 d21.98 e20.85 e1.99 e1.74 e66.83 e64.29 e
Recommended N dose362.07 b356.48 b23.07 c21.94 c2.19 c1.95 c75.57 c73.03 c
20 kg N (Basal) + LCC ≤ 3 with 20 kg ha−1354.01 bc348.57 bc22.77 cd21.64 cd2.09 cd1.84 cd72.50 cd69.96 cd
30 kg N (Basal) + LCC ≤3 with 30 kg ha−1357.91 cb352.42 cb22.94 bc21.81 cd2.13 cd1.88 cd73.17 cd70.63 cd
20 kg N (Basal) + LCC ≤ 4 with 20 kg ha−1370.34 ab364.80 ab23.45 bc22.33 bc2.36 b2.11 b80.10 bc77.56 bc
30 kg N (Basal) + LCC ≤ 4 with 30 kg ha−1372.24 ab366.69 ab23.76 b22.64 b2.40 b2.16 b83.13 b80.59 b
20 kg N (Basal) + LCC ≤ 5 with 20 kg ha−1375.27 ab369.66 ab24.10 ab22.98 ab2.50 ab2.26 ab87.37 ab84.83 ab
30 kg N (Basal) + LCC ≤ 5 with 30 kg ha−1380.46 a374.99 a24.43 a23.31 a2.61 a2.36 a91.80 a89.26 a
LSD (p ≤ 0.05)16.012.580.610.530.140. 125.004.67
Means followed by different letters indicate significance (p ≤ 0.05) among treatments as per DmRT.
Table 6. Effect of need-based N application on nitrogen use efficiencies (SR-3 and SR-4).
TreatmentsAgronomic Efficiency (kg Grain kg−1 N)Apparent Nutrient Recovery (%)
2019202020192020
Factor A: Varieties
SR-323.56 b23.20 b28.90 b27.60 b
SR-425.80 a26.20 a34.10 a34.64 a
LSD (p ≤ 0.05)1.021.261.801.65
Factor B: LCC N application
Control
Recommended N dose20.62 c20.60 c25.31 d24.78 d
20 kg N (Basal) + LCC ≤ 3 with 20 kg ha−126.46 a26.50 a32.57 b31.89 b
30 kg N (Basal) + LCC ≤ 3 with 30 kg ha−125.51 ab25.50 ab32.10 b32.52 ab
20 kg N (Basal) + LCC ≤ 4 with 20 kg ha−126.58 a26.60 a34.71 ab33.99 ab
30 kg N (Basal) + LCC ≤ 4 with 30 kg ha−123.63 b23.60 b30.76 bc30.41 bc
20 kg N (Basal) + LCC ≤ 5 with 20 kg ha−126.85 a26.90 a36.02 a35.59 a
30 kg N (Basal) + LCC ≤ 5 with 30 kg ha−123.08 b23.10 b29.04 c28.62 c
LSD (p ≤ 0.05)2.101.983.223.04
Means followed by different letters indicate significance (p ≤ 0.05) among treatments as per DmRT.
Table 7. Economics of Different treatments (Pooled data over 2 years).
Treatment CombinationCost of Cultivation
(₹)
Gross Returns (₹)Net Returns
(₹)
B:C Ratio
Variety SR-3
Control50,65571,499.8320,844.830.38
Recommended Dose52,926111,925.2058,999.171.04
20 kg N (Basal) + LCC ≤ 3 with 20 kg ha−152,568105,647.5053,079.500.94
30 kg N (Basal) + LCC ≤ 3 with 30 kg ha−152,470108,697.8056,227.831.00
20 kg N (Basal) + LCC ≤ 4 with 20 kg ha−153,122115,800.5062,678.501.10
30 kg N (Basal) + LCC ≤ 4 with 30 kg ha−153,176118,748.2065,572.171.15
20 kg N (Basal) + LCC ≤ 5 with 20 kg ha−153,676124,949.2071,273.171.24
30 kg N (Basal) + LCC ≤ 5 with 30 kg ha−153,883129,329.2075,446.171.30
Variety SR-4
Control50,65579,386.5028,731.500.57
Recommended Dose52,926119,811.8066,885.831.26
20 kg N (Basal) + LCC ≤ 3 with 20 kg ha−152,568113,534.2060,966.171.16
30 kg N (Basal) + LCC ≤ 3 with 30 kg ha−152,470116,584.5064,114.501.22
20 kg N (Basal) + LCC ≤ 4 with 20 kg ha−153,122123,687.2070,565.171.33
30 kg N (Basal) + LCC ≤ 4 with 30 kg ha−153,176126,634.8073,458.831.38
20 kg N (Basal) + LCC ≤ 5 with 20 kg ha−153,676132,835.8079,159.831.47
30 kg N (Basal) + LCC ≤ 5 with 30 kg ha−153,883137,215.8083,332.831.55
Table 8. Correlation matrix of grain yield with yield attributes.
Grain YieldPanicle
Density
Panicle LengthPanicle WeightFilled Grains per Panicle
Grain yield1.000
Panicle density0.995 **1.000
Panicle length0.925 **0.909 **1.000
Panicle weight0.846 **0.833 *0.982 **1.000
Filled Grains per panicle0.867 **0.847 **0.990 **0.995 **1.000
* is significant at 0.05; ** is significant at 0.01.
Publisher’s Note: MDPI stays neutral with regard to jurisdictional claims in published maps and institutional affiliations.

