Article

Crop Water Requirement and Utilization Efficiency-Based Planting Structure Optimization in the Southern Huang-Huai-Hai Plain

1
Henan Provincial Water Conservancy Research Institute, Center of Efficient Irrigation Engineering and Technology Research of Henan Province, Zhengzhou 450003, China
2
Xuchang Water Science and Technology Extension Center, Xuchang 461000, China
3
Key Laboratory of Crop Water Use and Regulation, Ministry of Agriculture and Rural Affairs, Institute of Farmland Irrigation, Chinese Academy of Agricultural Sciences, Xinxiang 453002, China
*
Author to whom correspondence should be addressed.
Agronomy 2022, 12(9), 2219; https://doi.org/10.3390/agronomy12092219
Submission received: 4 August 2022 / Revised: 9 September 2022 / Accepted: 15 September 2022 / Published: 18 September 2022
(This article belongs to the Section Water Use and Irrigation)

Abstract

:
Optimizing planting structure that balances both high yield and water resources shortage is essential for developing efficient water-saving agriculture. To provide insights about the relationship between planting structure optimization and water resource constraint, crop water requirement, precipitation coupling degree, gross total water requirement and irrigation project metrics were calculated and analyzed with the dataset collected from 16 locations in Xuchang City, China. The strategy of reducing the planting proportion of high water-consumption crops and increasing low consumption and high precipitation coupling degree crops was adopted to determine a suitable water-saving planting scheme based on the IQR (interquartile range) method. Evapotranspiration had a decreasing trend from northwest to southeast areas. There were positive correlations between gross total water requirement (GTWR) and annual total yields (r = 0.825, p = 0.002), and between GTWR and proportion of vegetable planting areas (PVPA) (r = 0.734, p = 0.0101). The GTWR was negatively correlated with the ratio of water-saving irrigated areas to effective irrigated areas (RSEA), proportion of wheat planting areas (PWPA) and proportion of bean planting areas (PBPA), with coefficients of −0.787, −0.936 and −0.828, respectively. The planting proportion of winter wheat, summer maize, vegetables and flowers decreased by 8.8%, 25.8%, 16.2%, and 28.7%, respectively, while oil-beans and tubers increased by 62.4% and 95.6%, respectively. The irrigation water consumption was reduced by 5.2%, saving 3.25 × 10⁷ m3 irrigation water without sacrificing economic benefits after adjusting for the whole region. Consequently, precipitation coupling degree, water-saving technology and historical planting habits should be considered when optimizing cropping distributions. This research provided a new theoretical basis and comprehensive approach for agriculture irrigation water management and regional planting structure optimization from a realistic perspective.

1. Introduction

Freshwater is spatially heterogeneous and often dominated by local dynamics, highlighting its critical role in global sustainability [1,2]. More severely, agriculture water consumption accounts for about 70% of freshwater expenditure across the world [3,4]. In this context, water-saving irrigation that aims to reduce inefficient water use and maximizes beneficial crop water use is regarded as a basic solution to water scarcity, especially in the arid and semi-arid regions [5,6].
Optimizing irrigation water implies maximizing agricultural production for a given quantity of water, namely, maximizing the “crop per drop” [7]. There have been numerous attempts to mitigate the agricultural water consumption, among which several agronomic practices are already being implemented in the traditional winter wheat–summer maize relay cropping system, including increasing planting density or optimizing sowing dates [8,9,10]. In addition, agrotechnical measures [11,12], water-saving irrigation project types [13,14,15], and planting drought-resistant crop varieties [16,17] were also adopted to decrease crop water use. Although the above measures can certainly reduce the rate of groundwater withdrawal, their effects are currently insufficient to halt the water table decline. Therefore, more promising strategies in water saving need to be introduced in terms of diversified crop rotations [18,19].
Crop diversification is a prerequisite for formulating and implementing realistic agricultural water-saving countermeasures. That means including more nutritious crops rather than the conventional wheat or maize into rotation cropping systems to increase yield by efficiently using soil water and nitrogen resources [20,21]. Numerous researchers [22,23,24,25,26] have reported that water-use efficiency, grain yield and economic output can be improved by diversifying crop rotations with reduced seasonal crop water requirements and can mitigate groundwater decline potential, compared with monocropping. From this perspective, diversified crop rotations mean a change in current planting structure. How to adjust cropping structure according to local conditions is a challenge worth considering. In the past years, many studies focused on economic benefits, considering profitability as a major concern for scholars and farmers, and national policies and market demand also played an important role in crop selection [27,28,29]. In recent years, the environmental impact of fertilizer application, climate change, water-use efficiency and ecological efficiency have also been demonstrated as non-negligible factors that affect cropping adjustment [30,31]. As for the optimization method of planting structure, Niu et al. [32] developed an interactive two-stage fuzzy stochastic programming (ITFSP) method to aid the crop planning and water resource allocation under uncertainty, and results revealed that decision makers would be more positive to water allocation of crops of wheat and oil than maize. Luo et al. [33] optimized the crop planting structure based on a multi-objective optimization model and a fast elitist nondominated sorting genetic algorithm method, in which the water-saving potential was estimated, and the trade-off between water resources and agricultural production was quantified. Liu et al. [34] employed the Soil and Water Assessment Tool (SWAT) and a cellular automata model to model the processes of cropping pattern changes, aiming to reduce the irrigation water demand of cultivated land and improve the water productivity. However, when studying the water resource constraint in the past few decades, it is not well-known about the effect of irrigation and drainage construction projects in high-standard farmland on crop structure adjustment, especially for water-saving irrigation technology, with studies only relating to crop evapotranspiration in the field, reckoning without pondering water loss from the intake to the field. Water demand and precipitation spatial coupling degree under different hydrological years still needs to be worked out. Meanwhile, in published literature, multiple objective optimization models were mostly adopted by previous researchers and the optimizing result deviated too much from the historical planting areas, which were greatly different from the actual demand, contributing to great challenges for food security and farmers’ interests. Hence, it is of great significance to reveal the response of cropping systems on water-saving technology, crop water requirement, local planting habit and related irrigation indexes.
Here, the Xuchang high-efficiency water-saving irrigation experimental area (XCA, for short) was selected as the study area to investigate potential relationships between regional gross irrigation water consumption and cropping structure in the case of water constraints. In XCA, wheat, corn, peanuts, cotton, tobacco, vegetables, flowers and herbs were planted in fertile soil texture. After 10 years’ construction of high standard farmland, the advanced water-saving irrigation technologies have been widely applied by many peasants, such as drip irrigation, sprinkler irrigation and micro-sprinkling irrigation. The popularization and application of high efficiency water-saving irrigation technology played an important role in alleviating the regional water resources crisis and developing green agriculture. Based on the above background, the objectives of the present study were (1) to determine crop evapotranspiration (ETc) and precipitation coupling degree of representative crops (i.e., winter wheat, summer maize, flowers, tobacco, Chinese herbs) under a normal rainfall year; (2) to analyze planting structure variation of main crops based on 10 consecutive years and evaluate the gross irrigation water requirement through diversified irrigation methods across the whole study region, and (3) to further develop the correlation between irrigation project metrics and gross total water requirement, moving forward to optimize cropping structure from the perspective of food production, water utilization efficiency and farmer profitability. This research is expected to provide theoretical guidance and a scientific baseline for the distribution of agricultural water rights that aims to ensure national food security and promote rural revitalization.

2. Materials and Methods

2.1. Region Description

Xuchang high-efficiency water-saving irrigation experimental area (33°42′–34°24′ N, 113°03′–114°19′ E) is located in South Central of Huang-Huai-Hai Plain, which belongs to the alluvial plain of Shuang ji River and Yellow River, and has a total area of approximately 5 × 10³ km2 and an average elevation of 79.6 m above sea level with a warm temperate continental monsoon climate (Figure 1). The annual average temperature is 14.7 °C with 2183 h sunshine duration. Generally, the annual average precipitation in the last 30 years was 697.0 mm, of which 55–65% occurred from June to September, with extremely uneven spatial–temporal distribution. Distinctive planting types (i.e., winter wheat, summer maize, peanuts, cotton, tobacco, vegetables, flowers, Chinese herbal medicine, etc.) are irrigated by advanced water-saving facilities, such as intelligent sprinkler irrigation, self-driven capstan sprinkler irrigation, drip irrigation and microspray irrigation in study region. Meteorological stations are distributed in 16 typical representative sites (green dots in Figure 1).

2.2. Data Collection and Analyses

2.2.1. Data Sources

The basic data include crops sown areas, yields, condition of irrigation and conservancy project, meteorological factors and water resources. Particularly, statistics on yields and crop areas planted (representative crops were selected in each administrative region, which are wheat, maize, beans, oil, potato, cotton, tobacco, vegetables, flowers, melons and fruits and traditional Chinese medicine, with a total of 11 categories.) were taken from the Statistical Yearbook of Henan Province and the National Economic and Social Development of Xuchang from 2010 to 2020. Data related to condition of irrigation and conservancy project include water-saving irrigated area and effective irrigated area that are also derived from the Statistical Yearbook of Henan Province. Water resources data (1990–2020) were collected from water Resources Bulletin of Henan Province. Meteorological data from 1990 to 2020, including daily precipitation, maximum temperature, minimum temperature, wind speed, relative humidity and sunshine duration, were collected from 16 meteorological stations (5 national weather stations and 11 local agricultural weather stations) in the XCA.

2.2.2. Crop Water Requirement

The reference evapotranspiration ET0 was calculated with the Penman–Monteith equation (Equation (1)), which was performed with the CropWat model 8.0 software developed by the Land and Water Development Division of FAO (https://www.fao.org/land-water/databases-and-software/cropwat/en/ (accessed on 5 June 2022)).
E T 0 = 0.408 Δ ( R n G ) + γ 900 T + 273 U 2 ( e s e a ) Δ + γ ( 1 + 0.34 U 2 )
where, R n is the net radiation at the crop surface (MJ m−2 day−1), G is the soil heat flux density (MJ m−2 day−1), T is the mean daily air temperature at 2 m height (°C), e s is the saturation vapor pressure (k Pa), e a is the actual vapor pressure (k Pa), U 2 is the wind speed at 2 m height (m s−1), e s e a is the saturation vapor pressure deficit (k Pa), Δ is the slope vapor pressure curve (k Pa °C−1), γ is the psychrometric constant (k Pa° C−1).
Crop water requirement, i.e., actual crop evapotranspiration ( E T c ) was determined with ET0 and crop coefficient (Kc) [35], Based on the Kc values under standard climate conditions recommended by FAO, and climatic characteristics in the XCA, the K c values for different crops were further modified by using (Equation (3)) [36].
E T c = K c E T 0
K c = K c t a b + [ 0.04 ( U 2 2 ) 0.04 ( R H min 45 ) ] ( h 3 ) 0.3 ]
where, K c t a b is crop coefficients under standard conditions at different growth stages, R H min is the mean daily minimum relative humidity during the growth stage, %, h is the average height of crops in this growth stage, m, other symbols have the same meanings as before.
Due to the lack of measured data for flowers (represented by wintersweet, osmanthus and Chinese rose), Chinese herbal medicine (represented by Yunanxing) and tobacco (represented by flue-cured tobacco) in XCA, the following formula was adopted to estimate E T c of these crops (Equation (4)).
E T c = P e f f + I i
where P e f f is the effective rainfall during the growth period of crop, and I i is the seasonal irrigation water amount, referring to The Agricultural and Rural Living Water Quota of Henan Province (http://slt.henan.gov.cn/2021/04-19/2129230.html (accessed on 6 July 2022)). To account for the losses to runoff or percolation, Pi was determined according to the method developed by USDA Soil Conservation Service [15]:
P e f f = [ P i     ( 125 0.6     P i ) ]   /   125 f o r   P i < = 250   /   3   m m P e f f = 125   /   3 + 0.1     P i   f o r   P i > 250   /   3   m m
where, P e f f is the effective rainfall and P i is the natural rainfall for ten days.

2.2.3. Determination of Hydrological Year and Precipitation Coupling Degree

The Pearson-III curve was used to determine the hydrological years for the last 30 years with the frequency value of p = 50% based on the 30-year reference crop water requirement. The total reference crops water requirement was proportionally distributed to every decade and month based on multi-year average reference water requirement to obtain the water requirement value of reference crops under the hydrological year type (50%) [37].
The coupling index between crop water demand and precipitation reflects the utilization of precipitation by crop absorption, and the value is between 0 and 1 [38]. The coupling degree ( λ ) is calculated as following:
λ = p e f f E T c p e f f E T c 1 p e f f > E T c

2.2.4. Macroscopic Basis for Planting Structure Adjustment

High-efficiency water-saving irrigation project improved water resource utilization efficiency and determined the gross crops irrigation water requirement, thus affecting the spatial arrangement of crops. The calculation methods and detailed descriptions of the selected irrigation indices are shown in Table 1.
According to the water consumption of different crop species, the strategy of reducing the planting proportion of high-water consumption crops, increasing low-water consumption and high precipitation coupling degree crops were adopted. The modified planting area was calculated using IQR (interquartile range) as the dependent variable (Figure 2). The specifics were as follows: the formula Q3 + N3 × IQR is used while expanding the planting area. Similar to this, Q1 − N1 × IQR are used while reducing the planting area. N1 and N3 range from 0 to 10, varying by 0.5 each time, and Q1 and Q3 stand for lower quartile and upper quartile, respectively. When there has been little change from the historical planting area, the value is Q1 or M, M refers to median. By doing this, the modified planting area avoids making drastic changes that could damage the continuity of policy and diverge too far from the historical planting area.

2.3. Statistical Analyses

Experimental data were processed by Excel 2010. Statistical methods including analysis of variance (ANOVA), linear regression analysis and correlation analysis were carried out using IBM SPSS Statistics 26, and differences were considered significant at the 0.05 level. The graphics were drawn by Origin 2021. Kriging spherical interpolation method was used ArcGISProV2.6 to perform spatial interpolation analysis of ETc [39,40].

3. Results

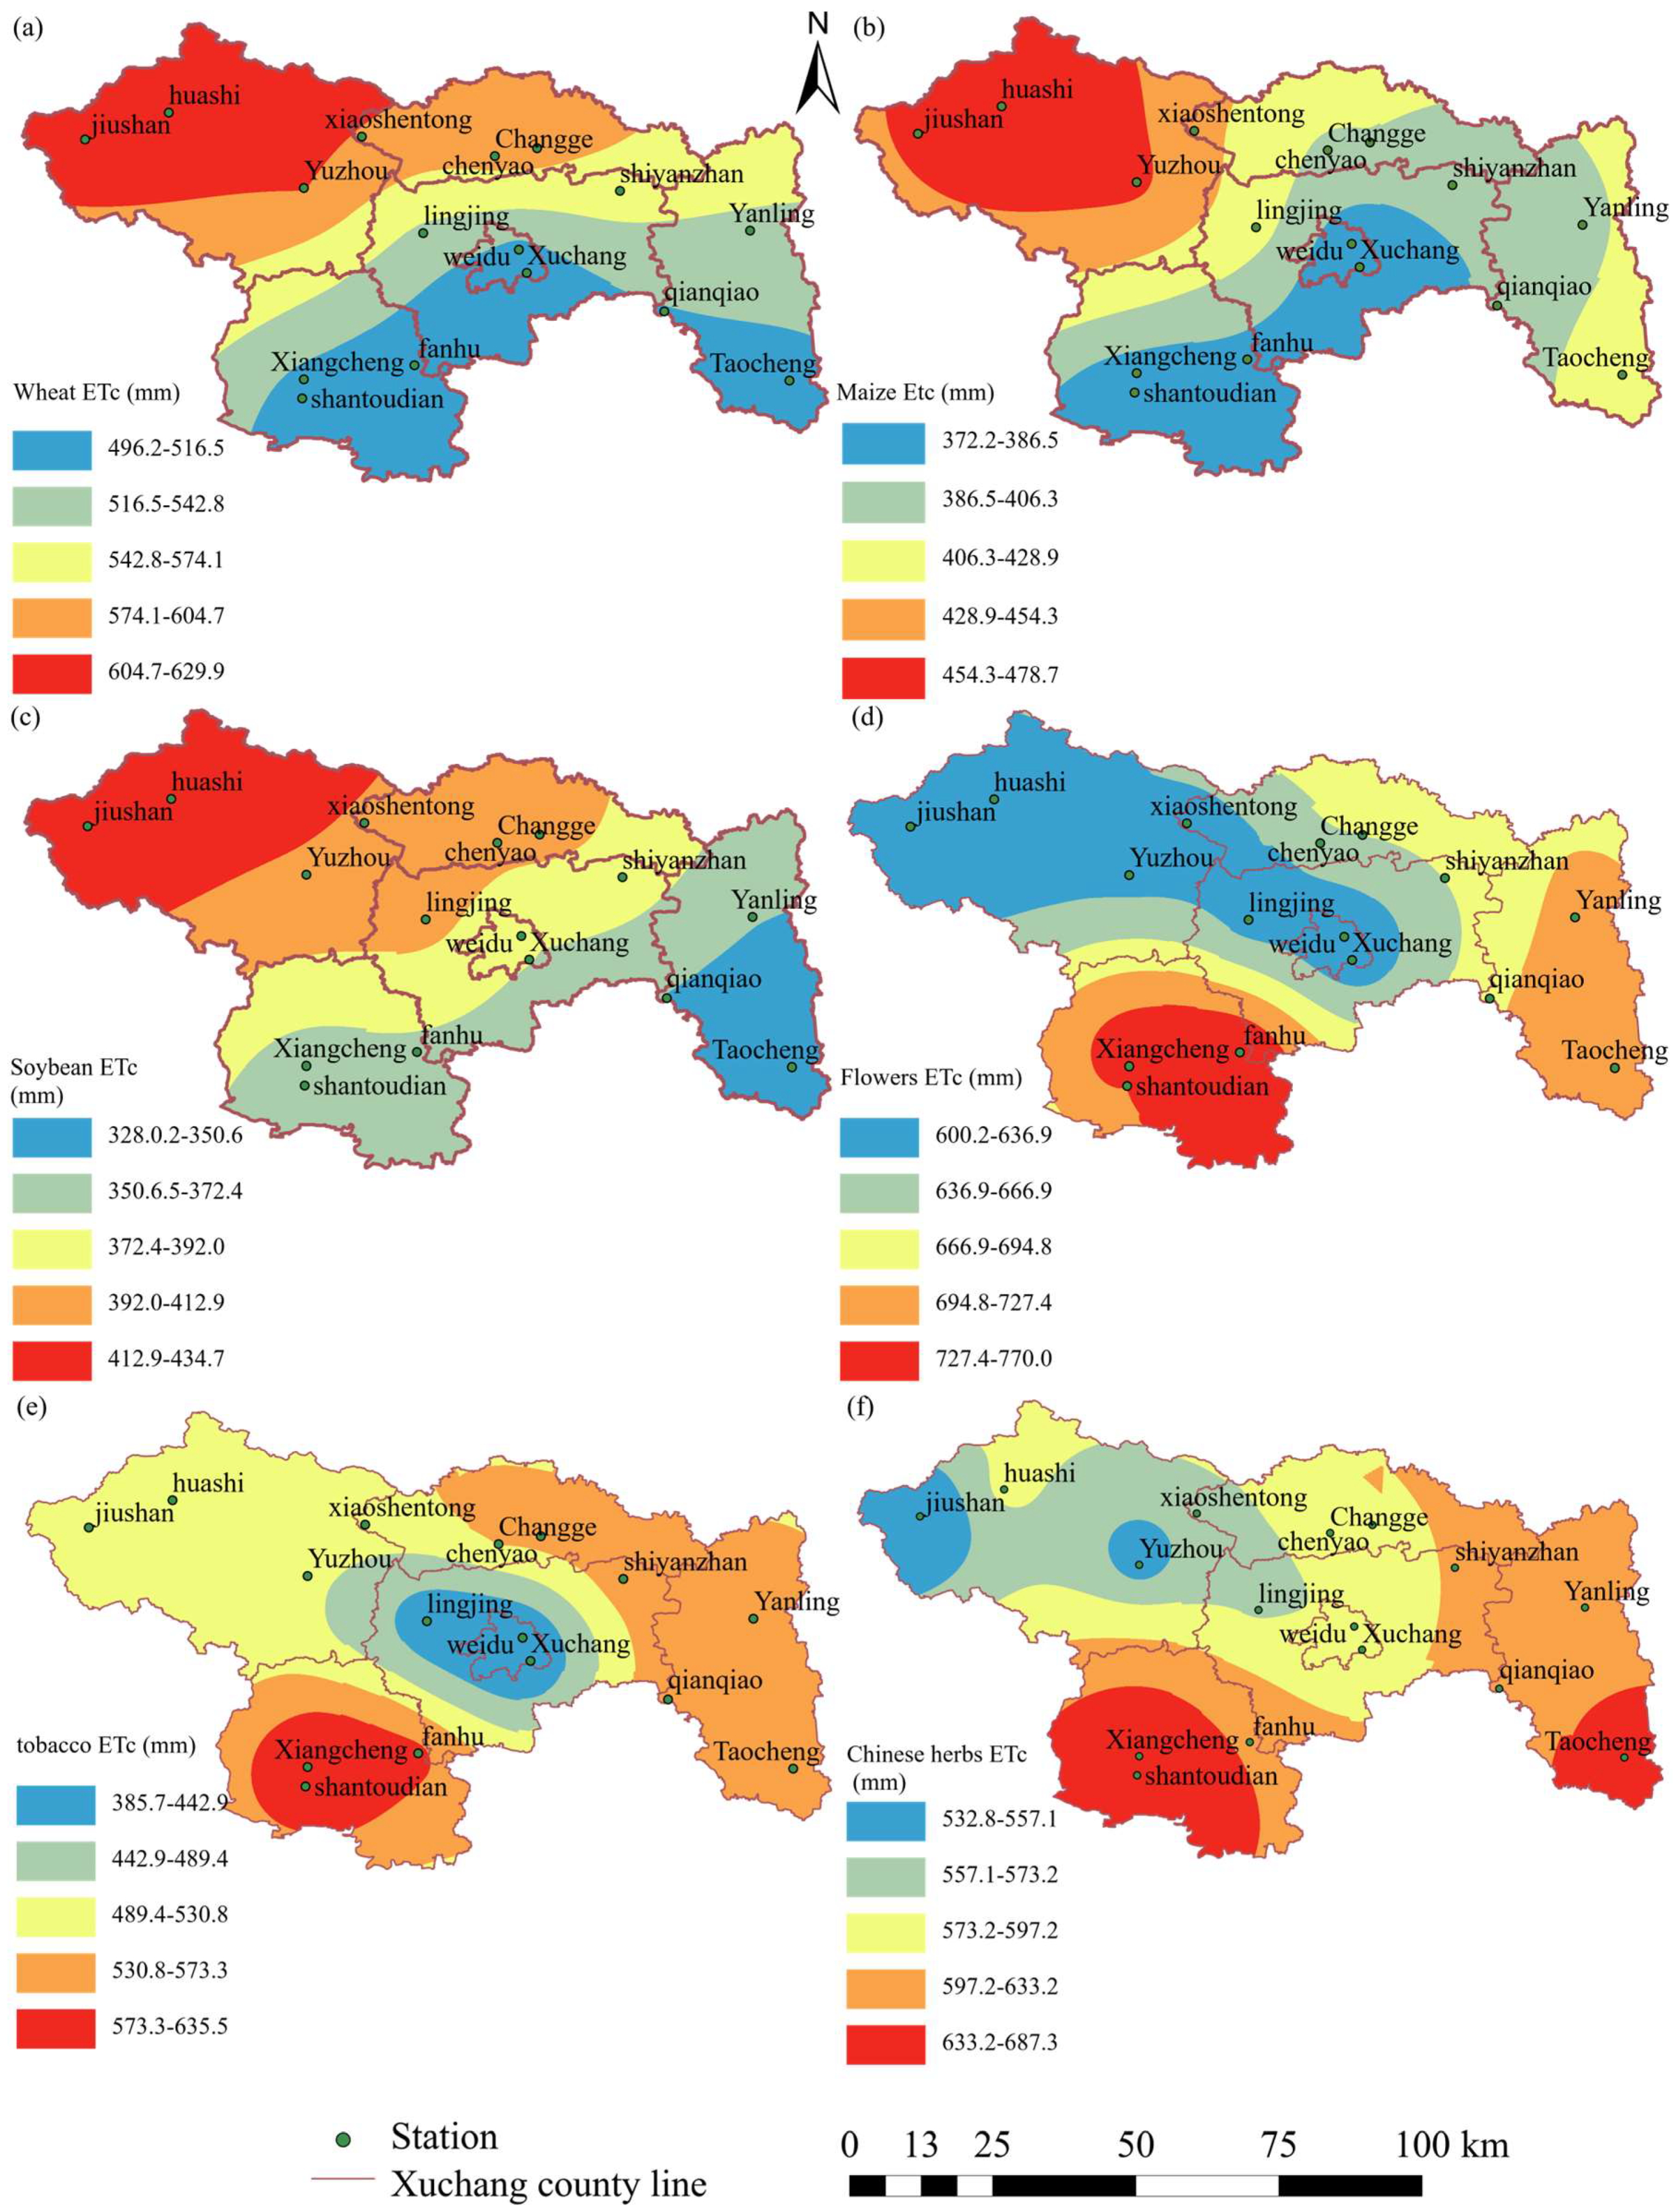
3.1. Spatial Distribution of Main Crops Water Requirement

The monthly ET0 from 1990–2020 in XCA is shown in Table 2. ET0 increased gradually from January to June, then decreased from June to December, reaching the maximum in June with a range of 5.08–5.83 mm day−1. The minimum ET0 appeared in January, ranging from 1.03 to 1.22 mm day−1. The average ET0 in June was 4.82 times than that in January. The annual average of ET0 was 3.20 mm day−1. Evapotranspiration in the whole region was higher in the northwest and lower in the southeast areas. The maximum was obtained at Yuzhou with 3.46 mm day−1, which was higher than the value at Xiangcheng by 14.3%.
In terms of food crops (winter wheat, summer maize and beans), the spatial water requirements from southeast to northwest gradually increased, showing a hierarchical distribution (Figure 3). The seasonal water requirements of winter wheat, summer maize and beans ranged from 496.1 to 630.5 mm, 361.0 to 478.8 mm and 328.0 to 434.7 mm, respectively. According to the spatial distribution of crop water requirements, the planting area of crops with high ETc mainly concentrated around the northwest Yuzhou, which had a relatively higher altitude and less precipitation. ETc in the south Xiangcheng, Xuchang and Yanling, which had a small temperature difference between day and night and a more humid climate, was relatively low.
As for spatial variation characteristics of cash crops (flowers, tobacco and Chinese herbs), ETc in the southern Xiangcheng and most areas of Yanling was markedly higher than that in the northwest central region. The annual average ETc for flowers, tobacco and Chinese herbs fluctuated in the range of 600.0–770.0 mm, 386.0–636.0 mm, and 533.0–688.0 mm, respectively. ETc of flowers was highest, followed by Chinese herbal medicine and tobacco.

3.2. Coupling Analysis of Main Crops Water Requirement and Precipitation

In the whole region of XCA, the coupling degree ( λ ) gradually decreased from southeast to northwest (Figure 4), and the maximum was present in southern Shantoudian and Taocheng areas, while the minimum occurred in the northwest Yuzhou. Tobacco had the highest λ (73.9%), followed by Chinese herbs (72.3%); the mean value of the 16 stations was 66.6% and 61.0%, respectively. The result indicated that the two crops had the potential to take full advantage of natural precipitation. Tobacco with high coupling degree was distributed in Xiangcheng, while Chinese herbs were distributed around the southern Taocheng. There was insignificant difference in λ among flowers, corn and soybean, with an average value of 56.2%. Yuzhou had the lowest coupling degree, lower than all other regions. Significant spatial variation in the coupling degree was observed in soybean planting regions, with the degree from 37.9% to 73.8%. Coupling degree of 24.6% for winter wheat was the lowest among the surveyed crops, causing water deficit seriously. Poor time synchronization was observed between precipitation and winter wheat growing period. To ensure the normal growth of winter wheat, supplementary irrigation was required for the wheat.

3.3. Irrigation Methods and Water Consumption of Main Crops

Winter wheat, summer maize, soybeans, flowers and vegetables are important components of crops in XCA, among which 77.4% were grain crops, and 11.3% are cash crops (tobacco, flowers and Chinese herbs) in 2020 (Table 3). Irrigation methods of grain crops were mainly sprinkler irrigation (90.3%) and economic crops were drip irrigation or micro-sprinkling irrigation (93.2%). Water consumption of the winter wheat–summer maize system accounted for 61.2% of the annual gross total water requirement (GTWR), followed by flowers, vegetables and beans, with GTWR ranging from 0.414 × 10⁸ to 0.878 × 10⁸ m3. Concisely, grain crops accounted for 69.2% of the total gross irrigation water requirement, playing a vital role in consuming irrigation resources. In terms of water consumption capacity of crops (GQIW), flowers had the largest value, followed by Chinese herbs, vegetables, tobacco, winter wheat, and tuber had the minimum.

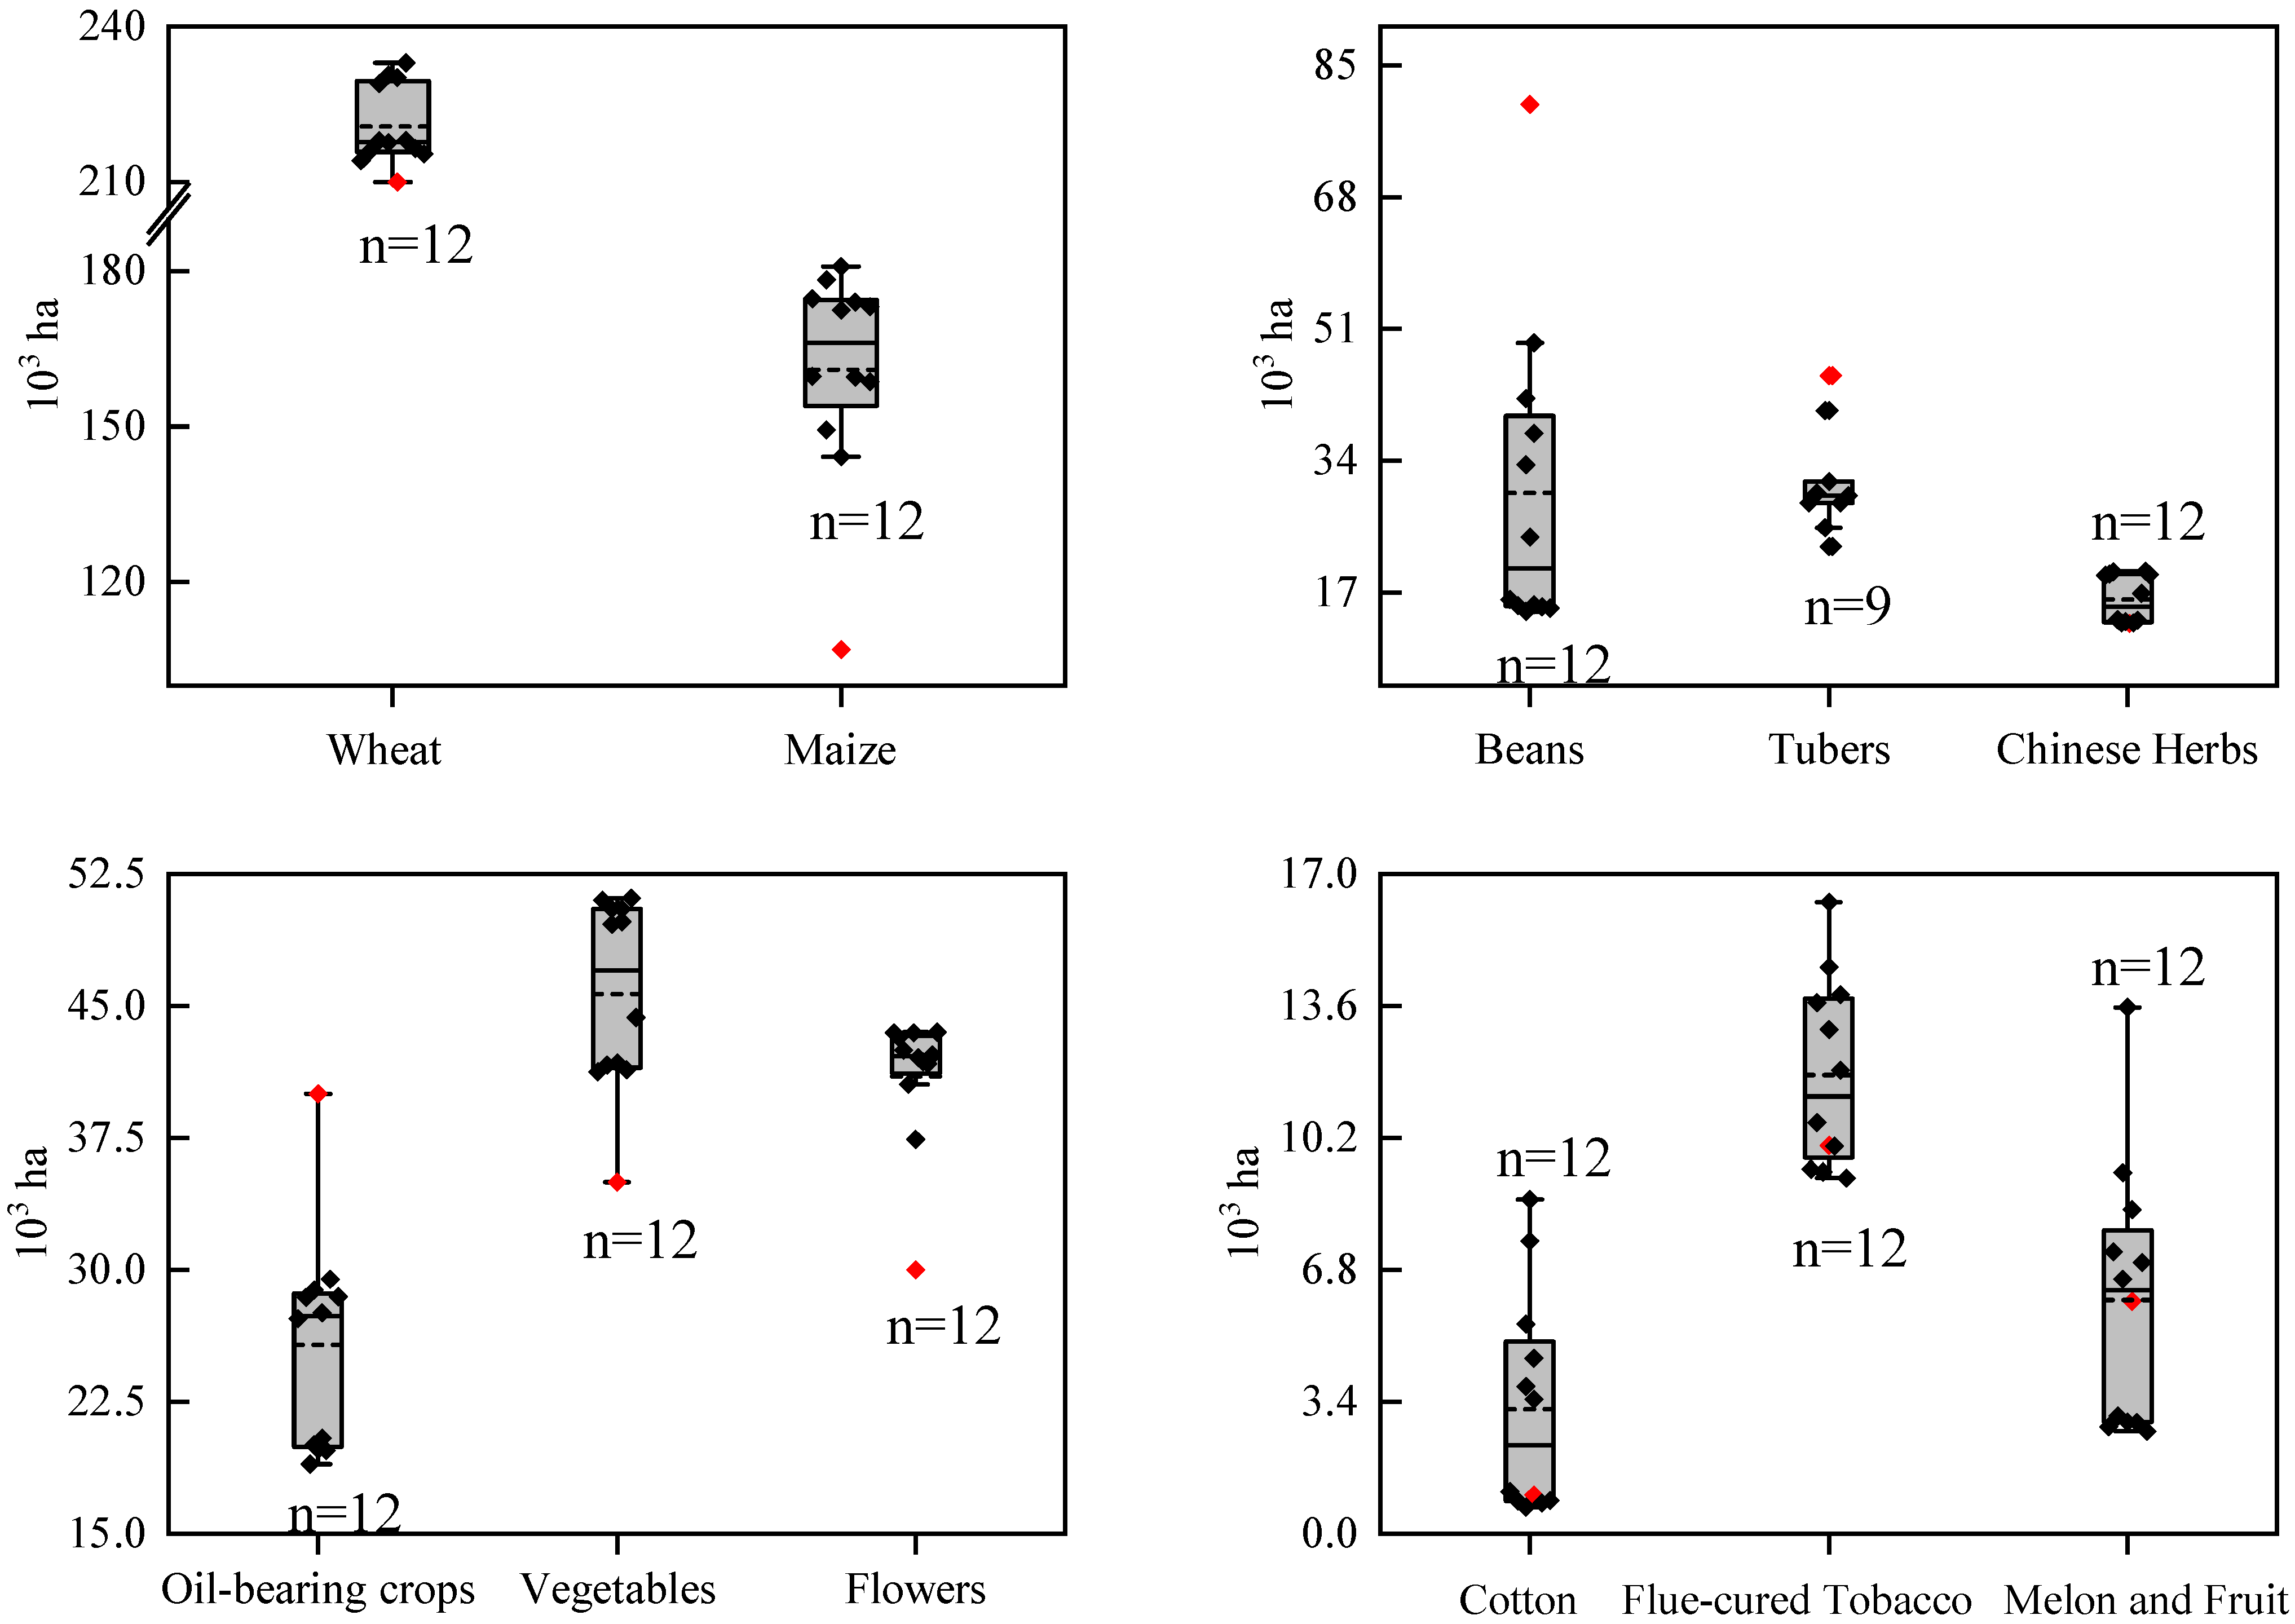
3.4. Changes in Crop Planting Structure

The percent of winter wheat planting area increased from 35.4% in 2010 to 39.9% in 2020, and summer maize increased from 26.2% in 2010 to 30.1% in 2015 and then decreased to 25.0% in 2020 (Figure 5). Over the past decade, the beans planting area has increased, reaching 4.93 × 10⁴ ha in 2020, which is 2.15 times of that in 2010. The percent of tubers, oil-bearing, cotton, vegetables, melon and fruits decreased by 40.3%, 24.4%, 91.6%, 11.8% and 58.4% from 2010 to 2020, respectively. Compared to 2010, the flower planting proportion decreased by 3.3% in 2015, while it increased by 5.0% in 2020. Furthermore, both tobacco and Chinese herbs decreased by 24.8% and 27.9%, respectively, in the past decade.

3.5. Potential Influence of Irrigation Project Metrics on Gross Irrigation Water Requirements

The correlations between GTWR and irrigation project metrics are shown in Figure 6. There were extremely positive correlations between GTWR and TY (r = 0.825, p = 0.002). A significantly positive relationship between GTWR and PVPA (r = 0.734, p = 0.010) was observed, and the correlations suggested that promotion in the vegetable area increased water consumption of the whole region. Therefore, reducing the vegetable planting area is one of the efficient methods for mitigating irrigation water demand risk. The GTWR was negatively correlated with RSEA, PWPA, and PBPA, with coefficients of −0.787, −0.936 and −0.828, respectively. The increased RSEA implied that the perfect irrigation facilities and management level were promoted in more cultivated land, and the water-saving effect was fully reflected. From a planting structure point of view, increasing the proportion of wheat and soybean can also meet the requirement of reducing regional irrigation water. The remaining statistical indexes, such as TWR, AP, PMPA and PFPA had no significant impact on the GTWR.

3.6. Optimization of Crop Planting Structure

In order to reduce more irrigation water consumption, the planting area of crops with high water consumption should be decreased, such as flowers and vegetables. According to the coupling degree of precipitation and irrigation water requirement, the crops with low coupling degree should also be reduced to make full use of rainfall, such as wheat. Similarly, tubers with low water consumption but high coupling degree were recommended. Expanding the soybean planting area was beneficial for improving the utilization efficiency of irrigation water, when taking related indexes affecting crop gross irrigation water demand into account. From the aspect of planting technology, partially replacing the maize planting area with maize–soybean relay strip intercropping was recommended for balancing both high yield and sustainability. Given all the above factors, the adjusted crop planting structure is presented in Table 4.
Consequently, a suitable water-saving planting scheme was determined based on the IQR (interquartile range) (Figure 7). At the grain crops level, winter wheat and summer maize planting proportion should be decreased by 8.8% (Q1 − 0.5IQR) and 25.9% (Q1 − 3.5IQR), respectively, while oil-beans and tubers should be increased by 62.4% (Q3 + 2.5IQR) and 95.6% (Q3 + 6IQR), respectively. At the cash crops level, vegetables and flowers should be decreased by 16.6% (Q1 − IQR) and 28.7% (Q1 − 7IQR), respectively. Oil-bearing should be increased by 102.0% (Q3 + 1.5IQR). After adjustment, the yield of beans, tubers, oil-bearing and melon and fruits would increase by 71.3%, 41.6%, 94.3% and 95.0%, respectively. As a result, the irrigation water consumption in the region would be reduced by 5.2% while save 3.25 × 10⁷ m3 irrigation water use without sacrificing economic benefits for the whole region.

4. Discussion

4.1. Spatiotemporal Variability of ETc and λ

Variation in ETc presents a spatiotemporal uncertainty due to multifarious factors including climate change, landscape pattern evolution, human activities and planting structure variation [41,42,43,44]. The higher ETc value represented more irrigation consumption and lower WUE. Crop water requirement was basically calculated through two major methods, i.e., one using the Penman–Monteith equation and another based on the water balance model. In our research, the crop water requirement was estimated by summing irrigation and precipitation amounts during crop growing seasons when lacking relevant measured data, such as crops of flowers, tobacco and Chinese herbal medicine. For the spatial distribution of water requirements for surveyed crops, as shown in Figure 3, the seasonal water requirement of winter wheat was 496.1–630.5 mm and summer maize was 361.0–478.8 mm. These values were corroborated by previous authors, i.e., winter wheat was about 450.0–520.0 mm [31,45] and summer maize was about 298.0–430.0 mm [46,47]. Vegetables with water consumption of 501.5–704.2 mm were the highest water consumption crops. We also computed the local characteristic crops’ water requirements such as flowers (600.2–770.2 mm), Chinese herbs (532.8–688.0 mm) and Flue-cured tobacco (385.7–636.0 mm). Crop evapotranspiration varies both over time and space, showing both decadal variability and changes of spatial patterns [48]. Liu et al. [36] reported that winter wheat water requirement increased gradually from south to north during the whole growth period, but no significant differences occurred between summer maize due to a short growing season and small heat condition differences between districts. Unlike those of summer maize water demand regulation, in our research, the summer maize crop water requirements decreased from southeast to northwest caused by the small survey region.
The coupling degree of crop water demand and precipitation refers to the satisfaction degree of effective precipitation to crop water demand per unit time. Zhang et al. [38] reported that the coupling degree of water demand and precipitation of spring maize and soybean was 0.821 and 0.814, respectively, suggesting the expansion of the planting areas of spring maize and soybean in the region where water resources were scarce. Our analysis indicated that the average coupling degree of summer maize and soybean was almost the same. Considering maize area has been planted on a large scale, we advocated that the reduced maize planting areas be used to grow soybeans to make the best of rainfall.

4.2. Water-Saving Irrigation Technology and Crop Gross Irrigation Water Requirements

Zhang et al. [49] reported that to cope with water scarcity, over half of the farmers adopted engineering water-saving technologies. Water was saved as the return flow percolated to fresh aquifers was seen as beneficial rather than a loss at regional scale via water-saving irrigation techniques [5]. Through investigation and analysis, cash crops such as tobacco, flowers and vegetables were irrigated by drip irrigation, while large areas of grain crops were irrigated using sprinkler irrigation in the southern regions of Huang-Huai-Hai Plain. Because cash crops consumed more irrigation water compared to grain crops, adopting drip irrigation would save more water than sprinkler irrigation. Throughout the world, water-saving technology increased grain yield, water use efficiency, biomass and nitrogen use efficiency, co-locating the roots and N-fertilizer distribution for winter wheat and summer maize, realizing green and efficient agricultural production [50,51,52,53]. For the optimization of planting structures, most studies have focused on the economic benefits of water use and evapotranspiration itself [54,55], reckoning without the effect of water-saving technology on planting adjustment and transportation water loss. In our research, we calculated gross total water requirements (GTWR), which involved irrigation styles and pipeline irrigation by the quota method. Moreover, the correlation between irrigation project metrics and GTWR was analyzed (Figure 7).
Extremely positive correlations between GTWR and TY (r = 0.825, p = 0.002) indicated that the current planting structure is a high water-consuming system with inadequate irrigation. That is, generally, if GTWR were provided adequately, the total yield would be also increased, which is consistent with Yang et al. [56], who reported that the total grain yield of winter wheat–summer maize generally increased with increasing crop water use, and moderate deficit irrigation improved yield and water productivity. Similarly, a significantly positive relationship between GTWR and the proportion of vegetable planting areas (PVPA) (r = 0.734, p = 0.010) was observed, and the result implied decreasing PVPA is a vital approach for reducing agricultural water consumption, as reported by Luo et al. [33], who found that decreasing the sown scale of vegetables and fruit by 82.0% and 73.0%, respectively, is the maximum potential for water savings when the self-sufficiency of grain is taken into consideration. Furthermore, the effect of the proportion of wheat planting areas (PWPA) and proportion of bean planting areas (PBPA) on GTWR were explored separately, and our findings suggested that increasing the planting proportion of wheat and beans reduced GTWR. All of this provided significant theoretical guidance for cropping structure adjustment under the circumstance of balancing food and water resources. Characteristically, we concluded that the ratio of water-saving irrigated area to effective irrigated area (RSEA) drastically affect GTWR, owing to the efficient water-saving irrigation projects relating to irrigation and drainage network construction that reduced evaporation and deep leakage, thus avoiding the waste of irrigation water [57,58]. In a word, compared to traditional irrigation, water-saving irrigation technology affected crop gross total water requirements and spatial planting arrangement, enhancing the nutrition of agricultural products and ensuring food safety by improving the environment [59].

4.3. Optimization of Crop Planting Structure

Optimizing the regional cropping distribution plays an important role in developing efficient water-saving agriculture. Methods of Interactive two-stage fuzzy stochastic programming (ITFSP), linear programming model, the elitist nondominated sorting genetic algorithm and cellular automata model with the soil and water assessment tool (SWAT) were used to optimize the processes of cropping pattern changes [32,33,34,60]. For instance, Yin et al. [60] proposed a novel framework to optimize cropping systems and minimize total irrigation water consumption without compromising crop production security and economic benefit. According to their research, optimizing the 17 cropping systems can reduce the total irrigation water consumption by more than 10.0% in 23.9% of the prefectures, especially in the north china plain and southwest China. Unlike previous results, we proposed a new method called the IQR (interquartile range) methods from a statistical perspective, and the adjusted planting areas were chosen among lower quartile (Q1), median (M), upper quartile (Q3), Q1−N1 * IQR and Q3 + N3 * IQR to ensure that the adjusted planting area does not deviate too much from the historical planting area. This method provided scientific evidence to understand and determine optimal cropping structure.
A viable option for restructuring the planting structure should involve the regional self-sufficient production of wheat and a moderate surplus of vegetables and fruits to boost farmers’ income, while ensuring regional water resources and appropriate water transfers from external regions [33]. Accordingly, the premise of this experimental research is to ensure national food security and sustain reduction of irrigation water without sacrificing too much yield. From the investigation, the yield per unit area of winter wheat increased 4.79% from 2010 (7049 kg/ha) to 2020 (7386 kg/ha), and summer maize increased from 6449 kg/ha to 7206 kg/ha, with a growth rate of 11.7%. The yield per unit area of winter wheat and summer maize did not increase significantly over the past decade. In addition, field experiments showed that the maximum per unit grain yield of winter wheat and summer maize was 8960 kg/ha and 12,003 kg/ha in study areas, respectively [61,62]. Promotion space was relatively large for crop productivity. Therefore, a small, slight reduction in the planting area of winter wheat and summer maize would not have a significant impact on regional food supply.
Moreover, in high quality grain-producing areas, adequate water and fertilizer management can compensate for the yield decline caused by a reduced planting area. We propose the optimization of regional cropping distribution based on crop evapotranspiration, coupling degree of precipitation, water-saving technology, irrigation engineering, hydrological cycle and local planting habit. It is important to reduce the planting proportion of high water consumption crops (vegetables, flowers) and increase low consumption crops (tubers, soybeans) for conserving water and allocating water resources efficiently, which has also been reported by [33,56]. Planting structure optimization focuses on balancing food production and water conservation [63]. Although the areas of winter wheat and summer maize decreased (Figure 7), we can ensure that grain output does not decline by raising the per unit yield to ensure food security. The areas of soybean and tubers were increased because they have lower water consumption and a higher precipitation coupling degree. Maize–soybean relay strip intercropping increased grain production and resource use efficiency because high land equivalent, light and fertilizer (nitrogen and P) [64,65], which is widely practiced in China, achieved a balance between high productivity and sustainability [66]. Hence, we translated the reduced maize acreage planting into maize–soybean relay strip intercropping, which is consistent with national policy. Oil-bearing crop areas were expanded in our research, considering mainly the improvement of people’s living standards and transformation, and upgrading of consumption.

4.4. Prospects for a More Sustainable Cropping System

Diversified crop rotations play a critically important role in mitigating the over-exploitation of the groundwater, while ensuring food security and boosting the income of farmers [67]. Gao et al. [68] suggested clearly that changing the intensity of cropping systems may help mitigate the water shortage. It is essential to adopt a combined approach of reducing irrigated land reduction, controlling crop scale and using water-saving irrigation methods to develop green and efficient water-saving practices in the agricultural planting structure adjustment [69]. In this paper, based on making full use of rainfall and water saving by crop rotation, we recommend increasing the planting area of tubers in Yuzhou and expanding the planting area of soybeans in Jian’an district and Changge, where maize–soybean relay strip intercropping technology was adopted. Reducing wheat areas by planting rape and increasing the area of melon and fruit in Yanling is also suggested.
Furthermore, diversification of crop rotations should be considered in national policymaking for food, agriculture, water and health [70]. Incorporation of high-value crops into the wheat–maize cycles, such as cotton, peanut and tubers achieved simultaneous benefits for economic output, grain production and groundwater decline [23]. This enlightens that the cropping systems can be designed with the optimized crops as follows, namely (i) spring tubers → winter wheat–summer soybean → winter wheat–summer maize rotation with five harvests in 3 years; (ii) winter rape–summer maize → spring tubers → tobacco → wheat–summer maize rotation with six harvests in 4 years; (iii) spring peanut → wheat–soybeans rotation and spring cotton → wheat–maize rotation with three harvests in 2 years. As is well-known, crop planting provides food, generates income, and consumes water resources to different extents under different spatiotemporal agroclimatic conditions [71]. Exploring the optimal cropping system is a complicated project that involving ecology, resources, society and the economy. For agricultural planting management and water resources optimization and allocation, researchers and policy makers should integrate regional ecosystems and agricultural production systems, and this will be of great significance to regional sustainable development.
However, in this study, the same duration of the crop development stages was considered to calculate crop water requirement in a multiyear study, lack of growth stage durations adjustment and seasonal comparisons. The impacts of high and low flow years on crop cropping structure were not investigated; the next study should focus on enriching the hydrological chronology, adding quantitative indexes, and exploring a model or method for optimizing crop planting structure combining subjective and objective in conjunction with field positioning tests.

5. Conclusions

Our study suggests that the current planting structure is a high water-consuming system. Reducing the planting proportion of high water-consumption crops (vegetables, flowers) and increasing low consumption and high precipitation coupling degree crops (tubers, soybeans) are vital strategies for water-saving agriculture. In addition, water-saving irrigation technology reduced crop gross total water requirements and affected spatial planting arrangement, and efficient water-saving irrigation projects should be strengthened to save more agriculture irrigation water. The Penman–Monteith model and Quota method were combined well to estimate crop water requirement. The IQR method (interquartile range) was reasonable and realistic, and precipitation coupling degree, water-saving technology and historical planting habits should be considered when optimizing cropping distributions. This research provided a new theoretical basis and comprehensive approach for agriculture irrigation water management and regional planting structure optimization from a realistic perspective.

Author Contributions

Conceptualization, J.L. and B.S.; methodology, J.L. and X.Q.; software, J.L.; validation, H.S. and P.D.; formal analysis, J.L. and J.Z.; investigation, H.S., D.N., J.L. and B.S.; resources, B.S.; data curation, J.L. and X.Q.; writing—original draft preparation, J.L.; writing—review and editing, J.L. and X.Q.; visualization, J.L.; supervision, J.Z. and D.N.; project administration, H.S. and P.D.; funding acquisition, X.Q., J.L. and B.S. All authors have read and agreed to the published version of the manuscript.

Funding

This research was funded by the Scientific and Technological Project of Henan Province (212102110069, 222102110306), Water Resources Scientific and Technological Plan of Henan Province (GG202238, GG201946, GG202060), Scientific and Technological Project of Xuchang city (20220212004) and Science and Technology Innovation Project of Chinese Academy of Agricultural Sciences (ASTIP).

Institutional Review Board Statement

Not applicable.

Informed Consent Statement

Not applicable.

Data Availability Statement

Not applicable.

Acknowledgments

The authors thank Xiaoling Yang and Yang Gao for the valuable comments and suggestions on an earlier version of the paper. We also thank the anonymous reviewers for their constructive comments and advice.

Conflicts of Interest

The authors declare no conflict of interest.

References

  1. Huang, J.; Ridoutt, B.G.; Sun, Z.X.; Lan, K.; Thorp, K.R.; Wang, X.H.; Yin, X.G.; Huang, J.L.; Chen, F.; Scherer, L. Balancing Food Production within the Planetary Water Boundary. J. Clean. Prod. 2020, 253, 119900. [Google Scholar] [CrossRef]
  2. Gleeson, T.; Wang-Erlandsson, L.; Porkka, M.; Zipper, S.C.; Jaramillo, F.; Gerten, D.; Fetzer, I.; Cornell, S.E.; Piemontese, L.; Gordon, L.J.; et al. Illuminating Water Cycle Modifications and Earth System Resilience in the Anthropocene. Water Resour. Res. 2020, 56, e2019WR024957. [Google Scholar] [CrossRef]
  3. Simionesei, L.; Ramos, T.B.; Palma, J.; Oliveira, A.R.; Neves, R. Irrigasys: A Web-Based Irrigation Decision Support System Based on Open Source Data and Technology. Comput. Electron. Agric. 2020, 178, 105822. [Google Scholar] [CrossRef]
  4. Liu, X.; Shi, L.-J.; Engel, B.A.; Sun, S.-K.; Zhao, X.-N.; Wu, P.; Wang, Y.-B. New Challenges of Food Security in Northwest China: Water Footprint and Virtual Water Perspective. J. Clean. Prod. 2020, 245, 118939. [Google Scholar] [CrossRef]
  5. Zhou, X.Y.; Zhang, Y.Q.; Sheng, Z.P.; Manevski, K.; Andersen, M.N.; Han, S.M.; Li, H.L.; Yang, Y.H. Did Water-Saving Irrigation Protect Water Resources over the Past 40 Years? A Global Analysis Based on Water Accounting Framework. Agric. Water Manag. 2021, 249, 106793. [Google Scholar] [CrossRef]
  6. Benyezza, H.; Bouhedda, M.; Rebouh, S. Zoning Irrigation Smart System Based on Fuzzy Control Technology and Iot for Water and Energy Saving. J. Clean. Prod. 2021, 302, 127001. [Google Scholar] [CrossRef]
  7. Smilovic, M.; Gleeson, T.; Adamowski, J.; Langhorn, C. More Food with Less Water—Optimizing Agricultural Water Use. Adv. Water Resour. 2019, 123, 256–261. [Google Scholar] [CrossRef]
  8. Xu, W.J.; Liu, C.W.; Wang, K.R.; Xie, R.Z.; Ming, B.; Wang, Y.H.; Zhang, G.Q.; Liu, G.Z.; Zhao, R.L.; Fan, P.P.; et al. Adjusting Maize Plant Density to Different Climatic Conditions across a Large Longitudinal Distance in China. Field Crops Res. 2017, 212, 126–134. [Google Scholar] [CrossRef]
  9. Nasielski, J.; Deen, B. Nitrogen Applications Made Close to Silking: Implications for Yield Formation in Maize. Field Crops Res. 2019, 243, 107621. [Google Scholar] [CrossRef]
  10. Ahmad Dar, E.; Brar, A.S.; Dar, S.A.; Aljuaid, B.S.; El-Shehawi, A.M.; Rashid, R.; Shah, Z.A.; Yousuf, A.; Amin Bhat, M.; Ahmed, M.; et al. Quantitative Response of Wheat to Sowing Dates and Irrigation Regimes Using Ceres-Wheat Model. Saudi J. Biol. Sci. 2021, 28, 6198–6208. [Google Scholar] [CrossRef]
  11. Wang, J.D.; Zhang, Y.Q.; Gong, S.H.; Xu, D.; Juan, S.; Zhao, Y.F. Evapotranspiration, Crop Coefficient and Yield for Drip-Irrigated Winter Wheat with Straw Mulching in North China Plain. Field Crops Res. 2018, 217, 218–228. [Google Scholar] [CrossRef]
  12. Al-Ghobari, H.M.; Dewidar, A.Z. Integrating Deficit Irrigation into Surface and Subsurface Drip Irrigation as a Strategy to Save Water in Arid Regions. Agric. Water Manag. 2018, 209, 55–61. [Google Scholar] [CrossRef]
  13. Dar, E.A.; Brar, A.S.; Mishra, S.K.; Singh, K.B. Simulating Response of Wheat to Timing and Depth of Irrigation Water in Drip Irrigation System Using Ceres-Wheat Model. Field Crops Res. 2017, 214, 149–163. [Google Scholar] [CrossRef]
  14. Zhai, L.C.; Lu, L.H.; Dong, Z.Q.; Zhang, L.H.; Zhang, J.T.; Jia, X.L.; Zhang, Z.B. The Water-Saving Potential of Using Micro-Sprinkling Irrigation for Winter Wheat Production on the North China Plain. J. Integr. Agric. 2021, 20, 1687–1700. [Google Scholar] [CrossRef]
  15. Mason, B.; Rufí-Salís, M.; Parada, F.; Gabarrell, X.; Gruden, C. Intelligent Urban Irrigation Systems: Saving Water and Maintaining Crop Yields. Agric. Water Manag. 2019, 226, 105812. [Google Scholar] [CrossRef]
  16. Rahimi-Moghaddam, S.; Eyni-Nargeseh, H.; Ahmadi, S.A.K.; Azizi, K. Towards Withholding Irrigation Regimes and Drought-Resistant Genotypes as Strategies to Increase Canola Production in Drought-Prone Environments: A Modeling Approach. Agric. Water Manag. 2021, 243, 106487. [Google Scholar] [CrossRef]
  17. Ben-Zeev, S.; Kerzner, S.; Rabinovitz, O.; Saranga, Y. Optimizing Sowing Depth of Tef for Irrigated Mediterranean Conditions: From Laboratory to Field Studies. Agronomy 2020, 10, 1983. [Google Scholar] [CrossRef]
  18. Liang, H.; Qin, W.; Hu, K.; Tao, H.B.; Li, B.G. Modelling Groundwater Level Dynamics under Different Cropping Systems and Developing Groundwater Neutral Systems in the North China Plain. Agric. Water Manag. 2019, 213, 732–741. [Google Scholar] [CrossRef]
  19. Van Oort, P.A.J.; Wang, G.; Vos, J.; Meinke, H.; Li, B.G.; Huang, J.K.; van der Werf, W. Towards Groundwater Neutral Cropping Systems in the Alluvial Fans of the North China Plain. Agric. Water Manag. 2016, 165, 131–140. [Google Scholar] [CrossRef]
  20. Wang, Y.H.; Li, S.; Liang, H.; Hu, K.L.; Qin, S.J.; Guo, H. Comparison of Water- and Nitrogen-Use Efficiency over Drip Irrigation with Border Irrigation Based on a Model Approach. Agronomy 2020, 10, 1890. [Google Scholar] [CrossRef]
  21. Schlegel, A.J.; Assefa, Y.; Haag, L.A.; Thompson, C.R.; Stone, L.R. Soil Water and Water Use in Long-Term Dryland Crop Rotations. Agron. J. 2019, 111, 2590–2599. [Google Scholar] [CrossRef]
  22. Lenssen, A.W.; Sainju, U.M.; Jabro, J.D.; Allen, B.L.; Stevens, W.B. Dryland Pea Production and Water Use Responses to Tillage, Crop Rotation, and Weed Management Practice. Agron. J. 2018, 110, 1843–1853. [Google Scholar] [CrossRef]
  23. Yang, X.L.; Steenhuis, T.S.; Davis, K.F.; Werf, W.; Ritsema, C.J.; Pacenka, S.; Zhang, F.S.; Siddique, K.H.M.; Du, T.S. Diversified Crop Rotations Enhance Groundwater and Economic Sustainability of Food Production. Food Energy Secur. 2021, 10, e311. [Google Scholar] [CrossRef]
  24. Schlegel, A.J.; Assefa, Y.; Haag, L.A.; Thompson, C.R.; Holman, J.D.; Stone, L.R. Yield and Soil Water in Three Dryland Wheat and Grain Sorghum Rotations. Agron. J. 2017, 109, 227–238. [Google Scholar] [CrossRef]
  25. Sainju, U.M.; Lenssen, A.W.; Allen, B.L.; Jabro, J.D.; Stevens, W.B. Crop Water and Nitrogen Productivity in Response to Long-Term Diversified Crop Rotations and Management Systems. Agric. Water Manag. 2021, 257, 107149. [Google Scholar] [CrossRef]
  26. Bowles, T.M.; Jilling, A.; Morán-Rivera, K.; Schnecker, J.; Grandy, A.S. Crop Rotational Complexity Affects Plant-Soil Nitrogen Cycling During Water Deficit. Soil Biol. Biochem. 2022, 166, 108552. [Google Scholar] [CrossRef]
  27. Groot, J.C.J.; Yalew, S.G.; Rossing, W.A.H. Exploring Ecosystem Services Trade-Offs in Agricultural Landscapes with a Multi-Objective Programming Approach. Landsc. Urban Plan. 2018, 172, 29–36. [Google Scholar] [CrossRef]
  28. Chang, G.Y.; Wang, L.; Meng, L.M.; Zhang, W.X. Farmers’ Attitudes toward Mandatory Water-Saving Policies: A Case Study in Two Basins in Northwest China. J. Environ. Manag. 2016, 181, 455–464. [Google Scholar] [CrossRef]
  29. Zhou, Q.; Wu, F.; Zhang, Q. Is Irrigation Water Price an Effective Leverage for Water Management? An Empirical Study in the Middle Reaches of the Heihe River Basin. Phys. Chem. Earth 2015, 89–90, 25–32. [Google Scholar] [CrossRef]
  30. Yang, X.L.; Chen, Y.Q.; Pacenka, S.; Steenhuis, T.S.; Sui, P. Managing Food and Bioenergy Crops with Declining Groundwater Levels in the North China Plain. Field Crops Res. 2019, 234, 1–14. [Google Scholar] [CrossRef]
  31. Li, J.P.; Xu, X.X.; Lin, G.; Wang, Y.Q.; Liu, Y.; Zhang, M.; Zhou, J.Y.; Wang, Z.; Zhang, Y.H. Micro-Irrigation Improves Grain Yield and Resource Use Efficiency by Co-Locating the Roots and N-Fertilizer Distribution of Winter Wheat in the North China Plain. Sci. Total Environ. 2018, 643, 367–377. [Google Scholar] [CrossRef] [PubMed]
  32. Niu, G.; Li, Y.P.; Huang, G.H.; Liu, J.; Fan, Y.R. Crop Planning and Water Resource Allocation for Sustainable Development of an Irrigation Region in China under Multiple Uncertainties. Agric. Water Manag. 2016, 166, 53–69. [Google Scholar] [CrossRef]
  33. Luo, J.M.; Zhang, H.M.; Qi, Y.Q.; Pei, H.W.; Shen, Y.J. Balancing Water and Food by Optimizing the Planting Structure in the Beijing–Tianjin–Hebei Region, China. Agric. Water Manag. 2022, 262, 107326. [Google Scholar] [CrossRef]
  34. Liu, Q.; Niu, J.; Wood, J.D.; Kang, S.Z. Spatial Optimization of Cropping Pattern in the Upper-Middle Reaches of the Heihe River Basin, Northwest China. Agric. Water Manag. 2022, 264, 107479. [Google Scholar] [CrossRef]
  35. Allen, R.G.; Pereira, L.S.; Raes, D.; Smith, M. Crop Evapotranspiration: Guidelines for Computing Crop Water Requirements, Fao Irrigation and Drainage Paper 56; FAO: Rome, Italy, 1998. [Google Scholar]
  36. Liu, Y.; Wang, L.; Ni, G.H.; Cong, Z.T. Spatial Distribution Characteristics of Irrigation Water Requirement for Main Crops in China. Trans. CSAE 2009, 25, 6–12. [Google Scholar]
  37. Duan, A.W. Quota of Irrigation Water for Major Crops in Northern China; China Agricultural Science and Technology Press: Beijing, China, 2004. [Google Scholar]
  38. Zhang, F.Y.; Chi, D.C.; Chen, T.T. Assessment of Coupling Degree between Water Requirement of Main Cereal Crops and Precipitation in Growing Season in Liaoning Province. Chin. J. Agrometeorol. 2021, 42, 746–760. [Google Scholar]
  39. Han, Y.; Wang, J.L.; Li, P. Influences of Landscape Pattern Evolution on Regional Crop Water Requirements in Regions of Large-Scale Agricultural Operations. J. Clean. Prod. 2021, 327, 129499. [Google Scholar] [CrossRef]
  40. Zhang, H.; Zhan, Y.; Li, J.Y.; Chao, C.Y.; Liu, Q.F.; Wang, C.Y.; Jia, S.Q.; Ma, L.; Biswas, P. Using Kriging Incorporated with Wind Direction to Investigate Ground-Level Pm2.5 Concentration. Sci. Total Environ. 2021, 751, 141813. [Google Scholar] [CrossRef]
  41. Schaldach, R.; Koch, J.; Aus der Beek, T.; Kynast, E.; Flörke, M. Current and Future Irrigation Water Requirements in Pan-Europe: An Integrated Analysis of Socio-Economic and Climate Scenarios. Global Planet. Change 2012, 94–95, 33–45. [Google Scholar] [CrossRef]
  42. Wang, C.; Zhao, J.C.; Feng, Y.P.; Shang, M.F.; Bo, X.Z.; Gao, Z.Z.; Chen, F.; Chu, Q.Q. Optimizing Tillage Method and Irrigation Schedule for Greenhouse Gas Mitigation, Yield Improvement, and Water Conservation in Wheat–Maize Cropping Systems. Agric. Water Manag. 2021, 248, 106762. [Google Scholar] [CrossRef]
  43. Tang, Y.H.; Luan, X.B.; Sun, J.X.; Zhao, J.F.; Yin, Y.L.; Wang, Y.B.; Sun, S.K. Impact Assessment of Climate Change and Human Activities on Ghg Emissions and Agricultural Water Use. Agric. For. Meteorol. 2021, 296, 108218. [Google Scholar] [CrossRef]
  44. Xue, J.Y.; Huo, Z.L.; Kisekka, I. Assessing Impacts of Climate Variability and Changing Cropping Patterns on Regional Evapotranspiration, Yield and Water Productivity in California’s San Joaquin Watershed. Agric. Water Manag. 2021, 250, 106852. [Google Scholar] [CrossRef]
  45. Xu, X.X.; Zhang, M.; Li, J.P.; Liu, Z.Q.; Zhao, Z.G.; Zhang, Y.H.; Zhou, S.L.; Wang, Z.M. Improving Water Use Efficiency and Grain Yield of Winter Wheat by Optimizing Irrigations in the North China Plain. Field Crops Res. 2018, 221, 219–227. [Google Scholar] [CrossRef]
  46. Li, H.R.; Mei, X.R.; Nangia, V.; Guo, R.; Liu, Y.E.; Hao, W.P.; Wang, J.D. Effects of Different Nitrogen Fertilizers on the Yield, Water- and Nitrogen-Use Efficiencies of Drip-Fertigated Wheat and Maize in the North China Plain. Agric. Water Manag. 2021, 243, 106474. [Google Scholar] [CrossRef]
  47. Kuang, N.K.; Ma, Y.-Z.; Hong, S.-Z.; Jiao, F.L.; Liu, C.Y.; Li, Q.Q.; Han, H.F. Simulation of Soil Moisture Dynamics, Evapotranspiration, and Water Drainage of Summer Maize in Response to Different Depths of Subsoiling with Rzwqm2. Agric. Water Manag. 2021, 249, 106794. [Google Scholar] [CrossRef]
  48. Fan, Z.X.; Thomas, A. Decadal Changes of Reference Crop Evapotranspiration Attribution: Spatial and Temporal Variability over China 1960–2011. J. Hydrol. 2018, 560, 461–470. [Google Scholar] [CrossRef]
  49. Zhang, B.; Fu, Z.T.; Wang, J.Q.; Zhang, L.X. Farmers’ Adoption of Water-Saving Irrigation Technology Alleviates Water Scarcity in Metropolis Suburbs: A Case Study of Beijing, China. Agric. Water Manag. 2019, 212, 349–357. [Google Scholar] [CrossRef]
  50. Umair, M.; Hussain, T.; Jiang, H.B.; Ahmad, A.; Yao, J.W.; Qi, Y.Q.; Zhang, Y.C.; Min, L.L.; Shen, Y.J. Water-Saving Potential of Subsurface Drip Irrigation for Winter Wheat. Sustainability 2019, 11, 2978. [Google Scholar] [CrossRef]
  51. Man, J.G.; Yu, J.S.; White, P.J.; Gu, S.B.; Zhang, Y.L.; Guo, Q.F.; Shi, Y.; Wang, D. Effects of Supplemental Irrigation with Micro-Sprinkling Hoses on Water Distribution in Soil and Grain Yield of Winter Wheat. Field Crops Res. 2014, 161, 26–37. [Google Scholar] [CrossRef]
  52. Mon, J.; Bronson, K.F.; Hunsaker, D.J.; Thorp, K.R.; White, J.W.; French, A.N. Interactive Effects of Nitrogen Fertilization and Irrigation on Grain Yield, Canopy Temperature, and Nitrogen Use Efficiency in Overhead Sprinkler-Irrigated Durum Wheat. Field Crops Res. 2016, 191, 54–65. [Google Scholar] [CrossRef]
  53. Rathore, V.S.; Nathawat, N.S.; Bhardwaj, S.; Sasidharan, R.P.; Yadav, B.M.; Kumar, M.; Santra, P.; Yadava, N.D.; Yadav, O.P. Yield, Water and Nitrogen Use Efficiencies of Sprinkler Irrigated Wheat Grown under Different Irrigation and Nitrogen Levels in an Arid Region. Agric. Water Manag. 2017, 187, 232–245. [Google Scholar] [CrossRef]
  54. Tan, M.H.; Zheng, L.Q. Increase in Economic Efficiency of Water Use Caused by Crop Structure Adjustment in Arid Areas. J. Environ. Manag. 2019, 230, 386–391. [Google Scholar] [CrossRef] [PubMed]
  55. Hao, L.N.; Su, X.L.; Singh, V.P. Cropping Pattern Optimization Considering Uncertainty of Water Availability and Water Saving Potential. Int. J. Agric. Biol. Eng. 2018, 11, 178–186. [Google Scholar] [CrossRef]
  56. Yang, X.L.; Wang, G.Y.; Chen, Y.Q.; Sui, P.; Pacenka, S.; Steenhuis, T.S.; Siddique, K.H.M. Reduced Groundwater Use and Increased Grain Production by Optimized Irrigation Scheduling in Winter Wheat–Summer Maize Double Cropping System—A 16-Year Field Study in North China Plain. Field Crops Res. 2022, 275, 108364. [Google Scholar] [CrossRef]
  57. Chen, X.Z.; Thorp, K.R.; van Oel, P.R.; Xu, Z.C.; Zhou, B.; Li, Y.K. Environmental Impact Assessment of Water-Saving Irrigation Systems across 60 Irrigation Construction Projects in Northern China. J. Clean. Prod. 2020, 245, 118883. [Google Scholar] [CrossRef]
  58. Chris, P.; Pasquale, S.; Allen, R.G.; Burt, C.M. Increasing Productivity in Irrigated Agriculture Agronomic Constraints and Hydrological Realities. Agric. Water Manag. 2009, 96, 1517–1524. [Google Scholar]
  59. Cremades, R.; Wang, J.; Morris, J. Policies, Economic Incentives and the Adoption of Modern Irrigation Technology in China. Earth Syst. Dyn. 2015, 6, 399–410. [Google Scholar] [CrossRef]
  60. Yin, L.C.; Tao, F.L.; Chen, Y.; Wang, Y.C. Reducing Agriculture Irrigation Water Consumption through Reshaping Cropping Systems across China. Agric. For. Meteorol. 2022, 312, 108707. [Google Scholar] [CrossRef]
  61. Liu, J.; Ning, D.F.; Qin, A.Z.; Zhang, J.Y.; Liu, Z.D.; Sun, B.; Ding, P.F.; Li, F.; Shen, H.L.; Zhao, D.S. Study on the Grain Filling Characteristics and Optimal Water and Nitrogen Coupling of Sprinkler-Irrigated Winter Wheat in the Southern Reigion of Huang Huai Hai. J. Soil Water Conserv. 2021, 35, 244–250. [Google Scholar]
  62. Liu, J.; Ning, D.F.; Qin, A.Z.; Sun, B.; Liu, Z.D.; Xiao, J.F.; Ding, P.F.; Zang, H.T.; Zhang, J.Y. Impacts of Reducing and Delaying Nitrogen Application on Yield and Water and Nitrogen Use Efficiency of Summer Maize under Sprinkler Fertigation. J. Irrig. Drain. 2020, 39, 42–49. [Google Scholar]
  63. Zhang, Z.Y.; Ma, H.Y.; Li, Q.G.; Wang, X.; Feng, G.X. Agricultural Planting Structure Optimization and Agricultural Water Resources Optimal Allocation of Yellow River Irrigation Area in Shandong Province. Desalination Water Treat. 2013, 52, 2750–2756. [Google Scholar] [CrossRef]
  64. Wu, Y.S.; He, D.; Wang, E.L.; Liu, X.; Huth, N.I.; Zhao, Z.G.; Gong, W.Z.; Yang, F.; Wang, X.C.; Yong, T.W.; et al. Modelling Soybean and Maize Growth and Grain Yield in Strip Intercropping Systems with Different Row Configurations. Field Crops Res. 2021, 265, 108122. [Google Scholar] [CrossRef]
  65. Zhou, T.; Wang, L.; Sun, X.; Wang, X.C.; Pu, T.; Yang, H.; Rengel, Z.; Liu, W.G.; Yang, W.Y. Improved Post-Silking Light Interception Increases Yield and P-Use Efficiency of Maize in Maize/Soybean Relay Strip Intercropping. Field Crops Res. 2021, 262, 108054. [Google Scholar] [CrossRef]
  66. Du, J.B.; Han, T.F.; Gai, J.Y.; Yong, T.W.; Sun, X.; Wang, X.C.; Yang, F.; Liu, J.; Shu, K.; Liu, W.G.; et al. Maize-Soybean Strip Intercropping: Achieved a Balance between High Productivity and Sustainability. J. Integr. Agric. 2018, 17, 747–754. [Google Scholar] [CrossRef]
  67. Yang, X.L.; Chen, Y.Q.; Pacenka, S.; Gao, W.S.; Ma, L.; Wang, G.Y.; Yan, P.; Sui, P.; Steenhuis, T.S. Effect of Diversified Crop Rotations on Groundwater Levels and Crop Water Productivity in the North China Plain. J. Hydrol. 2015, 522, 428–438. [Google Scholar] [CrossRef]
  68. Gao, B.; Ju, X.T.; Meng, Q.F.; Cui, Z.L.; Christie, P.; Chen, X.P.; Zhang, F.S. The Impact of Alternative Cropping Systems on Global Warming Potential, Grain Yield and Groundwater Use. Agric. Ecosyst. Environ. 2015, 203, 46–54. [Google Scholar] [CrossRef]
  69. Yu, H.; Liu, K.L.; Bai, Y.Y.; Luo, Y.; Wang, T.; Zhong, J.; Liu, S.Q.; Bai, Z.Y. The Agricultural Planting Structure Adjustment Based on Water Footprint and Multi-Objective Optimisation Models in China. J. Clean. Prod. 2021, 297, 126646. [Google Scholar] [CrossRef]
  70. Tao, S.L.; Zhang, H.; Feng, Y.H.; Zhu, J.L.; Cai, Q.; Xiong, X.Y.; Ma, S.H.; Fang, L.Q.; Fang, W.J.; Tian, D.; et al. Changes in China’s Water Resources in the Early 21st Century. Front. Ecol. Environ. 2020, 18, 188–193. [Google Scholar] [CrossRef]
  71. Wang, S.; Fu, G.R.; Ma, X.Q.; Xu, L.; Yang, F.L. Exploring the Optimal Crop Planting Structure to Balance Water Saving, Food Security and Incomes under the Spatiotemporal Heterogeneity of the Agricultural Climate. J. Environ. Manag. 2021, 295, 113130. [Google Scholar] [CrossRef]
Figure 1. Distributions of spatial elevation, meteorological stations and rivers of research region.
Agronomy 12 02219 g001
Figure 2. Method for planting structure adjustment. S3 and S1 represented crop planting areas after adjusting.
Agronomy 12 02219 g002
Figure 3. Spatial distribution of main crops water requirement, (af) represent the ETc (mm) of wheat, maize, soybean, flowers, tobacco and Chinese herbs, respectively.
Agronomy 12 02219 g003
Figure 4. Spatial precipitation coupling degree analysis of main crops during crop growing period, (af) represent the coupling degree (%) of wheat, maize, beans, flowers, tobacco and Chinese herbs, respectively.
Agronomy 12 02219 g004
Figure 5. Planting structure variation of main crops from 2010 to 2020. Data in parentheses are planting areas of corresponding crop, areas unit (103 ha).
Agronomy 12 02219 g005aAgronomy 12 02219 g005b
Figure 6. Correlation analysis of metrics related to gross total irrigation water requirement. Gross total water requirement (GTWR, m3), planting proportion of wheat, beans, maize, flowers and vegetable (PWPA, PBPA, PMPA, PFPA and PVPA, %), total water resources (TWR, m3), annual precipitation (AP, mm), ratio of water-saving irrigated area to effective irrigated area (RSEA, %), total yields (TY, kg). * Significance at the 0.05 probability level, ** Significance at the 0.01 probability level.
Agronomy 12 02219 g006
Figure 7. Adjustment scheme of water-saving planting structure based on IQR method. Black and red dots indicate before and after planting areas adjustment over investigated years.
Agronomy 12 02219 g007
Table 1. Selected irrigation project metrics for optimizing crop structure.
IndicatorsAbbreviationAnnotation and Calculation MethodComputational Formula
Water saving irrigated area (ha)WSIAThe area of water-saving irrigation such as pipe irrigation, sprinkler irrigation and micro-irrigation. W S I A = i = 1 m j = 1 n S i j
Effective irrigated area (ha)EIAThe land is relatively flat, with a certain water source and irrigation facilities supporting. Normal irrigation can be implemented in the current year under normal circumstances. It is the index that measures agricultural production unit and area water utilization degree and agricultural production stability degree. E I A = i = 1 m S i
Ratio of water saving irrigated area to effective irrigated area (%)RSEAThe index indicate that popularity of the efficient irrigation techniques applications. R S E A = W S I A E I A
Basic quota of irrigate water (m3/ha)BQIWIrrigation water consumption per unit area for a specific crop over the course of a growing season (one year for perennial crops), taking into account water loss for field irrigation and an additional water consumption quota (water for pre-sowing irrigation), all while adhering to the reference irrigation conditions. B Q I W = i = 1 m I i
Quota correction factorQCFThe coefficient F j and F k reflect the influence of irrigation methods and water transportation patterns on BQIW, respectively. Q C F 1 = F j Q C F 2 = F k
Quota of irrigate water (m3/ha)QIWProduct of the basic quota of irrigate water and coefficient F j , reflecting irrigation water requirement for various irrigation techniques. Q I W = i = 1 m j = 1 n I i F j
Gross quota of irrigated water (m3/ha)GQIWQuota of irrigate water divided by channel or pipework water utilization coefficient (water transportation patterns) for one crop. G Q I W = i = 1 m j = 1 n I i F j k = 1 r F k
Gross total water requirement (m3)GTWRThe cumulative sum of planting area multiplied gross quota of irrigated water for one crop. G T W R = G Q I W × S i
Total water resources (m3)TWRSum of surface water resources and underground water resources while deducting the repeated calculation of their mutual transformation. The index is used to assess how much surface and subsurface water the research area’s local precipitation has produced overall (excluding the inflow amounts from outside the area). T W R = W c + W u W d
Annual precipitation (mm)APWater amount formed by natural precipitation is expressed in height (mm) per unit area for one year. A P = P y
Total yield (kg)TYSum of the various crop yields. T Y = i = 1 m Y i
Crop structure CPThe proportion of crop plant area for one crop in a region. For example, planting proportion of wheat, beans, maize, flowers and vegetable were abbreviated to
PWPA, PBPA, PMPA, PFPA and PVPA, respectively.
C P = S i i = 1 m S i
Note: i, j, k and y represent the i-th crop (i from 1 to m), the j-th irrigation method (j from 1 to n), the k-th water delivery type (k from 1 to r) and the y-th year rainfall (y from 1 to s), respectively. S i , Y i , I i and P y represent the i-th crop planting areas, crop yields, irrigation water consumption per unit area during a growing season and the y-th rainfall, respectively. Accordingly, W c , W u and W d represent the total surface water, underground water and the repeated calculation amount of their mutual transformation produced by precipitation in the research area at one year. F j and F k represent correction coefficient of irrigation methods, including the utilization coefficient of canal system water and pipeline water, the values refer to the national standard (https://slt.henan.gov.cn/2021/04-19/2129230.html (accessed on 15 March 2022)), https://www.mohurd.gov.cn/gongkai/fdzdgknr/tzgg/201904/20190403_239996.html (accessed on 21 March 2022)).
Table 2. Monthly reference evapotranspiration ET0/(mm day−1) under the hydrological year type (p = 50%).
MonthXiangchengXuchangYanlingYuzhouChange
January1.111.151.031.221.21
February1.271.211.221.371.37
March3.113.233.173.463.55
April3.393.353.483.713.63
May4.764.984.805.615.65
June5.085.595.355.725.83
July4.894.975.085.525.34
August4.064.033.994.744.19
September3.343.553.413.823.59
October2.252.322.162.62.56
November1.811.861.722.12.01
December1.231.211.071.621.49
Average3.033.123.043.463.37
Table 3. Irrigation methods and water demand of main crops in XCA in 2020.
Staple CropsIrrigation MethodsAreas/104 haGTWR/108 m3GQIW/(104 m3/ha)
Winter-wheatSprinkler/pipe irrigation23.02.620.114
Summer-maizeSprinkler irrigation14.41.390.096
BeansSprinkler irrigation4.930.4140.084
TubersSprinkler/pipe irrigation2.300.1100.048
Oil-bearing cropsSprinkler/pipe irrigation1.980.2060.104
CottonSprinkler/Pipe irrigation0.0690.0080.118
TobaccoDrip irrigation0.9980.1240.124
VegetablesDrip/Micro-sprinkling irrigation4.170.5610.134
FlowersDrip/Micro-sprinkling irrigation4.210.8780.209
Chinese herbsDrip/Micro-sprinkling irrigation1.330.2110.159
Melon and FruitDrip/Micro-sprinkling irrigation0.2890.0290.099
Table 4. Analysis of water-saving and economic benefits before and after planting structure adjustment.
Staple CropsAdjusted Area/107 haUnadjusted Planting Structure/%Adjusted Planting Structure/%Growth Rates for Planting Structure/%Growth Rates for Yields/%Growth Rates for Water-Saving/%Growth Rates for Earning/%
Winter-wheat210.039.8936.40−8.75−12.3−8.75−12.3
Summer-maize107.025.0018.54−25.8−11.6−23.7−11.6
Beans80.08.5413.8662.471.362.471.31
Tubers45.03.997.8095.641.695.641.6
Oil-bearing crops40.03.436.93102.094.3102.094.3
Cotton1.000.120.1744.222.944.222.9
Tobacco10.01.731.730.202.810.202.81
Vegetables35.07.236.07−16.2−30.7−16.2−30.7
Flowers30.07.295.20−28.6-−28.7-
Chinese herbs13.02.302.25−1.96−21.3−24.621.3
Melon and Fruit6.000.501.04107.695.0107.695.0
Note: (-): indicated a lack of statistical data.
Publisher’s Note: MDPI stays neutral with regard to jurisdictional claims in published maps and institutional affiliations.

