Article

Design and Optimization of a Machine-Vision-Based Complementary Seeding Device for Tray-Type Green Onion Seedling Machines

1
College of Mechanical & Electronic Engineering, Shandong Agricultural University, Tai’an 271018, China
2
Shandong Agricultural Equipment Intelligent Engineering Laboratory, Tai’an 271018, China
*
Author to whom correspondence should be addressed.
Agronomy 2022, 12(9), 2180; https://doi.org/10.3390/agronomy12092180
Submission received: 27 July 2022 / Revised: 9 September 2022 / Accepted: 11 September 2022 / Published: 14 September 2022

Abstract

:
Green onion (Allium fistulosum L.) is mainly available as factory-produced seedlings. Although factory seedling production is highly automated, miss-seeding during the seeding process considerably affects subsequent transplanting and the final yield. To solve the problem of miss-seeding, the current main method is manual complementary seeding, which is labor-intensive and inefficient work. In this study, an automatic machine-vision-based complementary seeding device was proposed to reduce the miss-seeding rate and as a replacement of manual complementary seeding. The device performs several main functions, including the identification of miss-seeding holes, control of seed case movement, and the seed uptake and release from the seed suction nozzle array. A majority-mechanism-based miss-seeding tray hole rapid-detection method was proposed to enable the real-time identification of miss-seeding tray holes in the tray under high-speed moving conditions. The structural parameters of the vacuum-generated seed suction nozzle were optimized through numerical simulations and orthogonal experiments, and the seed suction nozzle array and seed case were produced using 3D-printing technology. Finally, the complementary seeding device was installed on the tray-type green onion seeding machine and the effectiveness of the complementary seeding was confirmed by experiments. The results revealed that the average values of the precision, recall, and F1 scores for identifying miss-seeding tray holes were 98.48%, 97.00%, and 97.73%, respectively. The results revealed that the rate of miss-seeding tray holes decreased from 5.37% to 0.89% after complementary seeding.

1. Introduction

Green onion is a vital seasoning vegetable and cash crop widely cultivated in China [1]. Green onions are cultivated on 500,000 hectares of land in Shandong Province, Henan Province, Hebei Province, and other areas and their cultivation is increasing every year [2]. Green onion planting is classified into two categories. In the first category, factory seeding, transplanting, and planting is performed. In the other category, field seeding, transplanting, and planting are performed. Factory seedling is preferred because of more efficient seeding and higher quality [3].
The tray-type green onion seedling machine (TGOSM) satisfies the three-seeds-in-one-hole design for green onion factory seedling [4]. However, under some uncontrollable conditions, such as vibrations and pressure changes, miss-seeding tray holes (tray holes with less than three seeds) and even empty tray holes occur. This condition severely limits TGOSM seeding quality and affects the efficiency of the automatic transplanting machine. To reduce the miss-seeding rate, a test set of complementary seeding devices was constructed based on machine vision for the TGOSM (Figure 1), and experimental verification of the complementary seeding effect.
Machine vision and image processing technologies, such as seed identification [5], poultry identification [6], fruit quality assessment [7,8], pest and disease detection [9], and fruit flower recognition [10], are widely used in agricultural production. Relevant experiments have been conducted to apply machine vision in crop seedling. Fang et al. [11] used YOLOv4-LITE to determine the direction of ginger shoots by calculating the relative position of the largest ginger shoot and ginger. Kim et al. [12] proposed a model that was trained using captured onion images using the filed monitoring system, and six classes including the disease symptom were classified. The detected disease symptom was localized from the background through thresholding of the class activation map. Sun et al. [13], proposed a deep learning optimization method based on contour grouping pre-labeling for counting overlapping rice seeds. Taheri-Garavand et al. [14] developed a chickpea recognition model convolutional neural network. The model is independent of the image acquisition device, lighting environment, and imaging settings and exhibits high-stability chickpea species recognition. However, the aforementioned approach requires considerable computational resources for executing complex deep neural networks. Thus, hardware configuration requirements are high and time consuming. Wang et al. [15] proposed an image processing-based pallet segmentation algorithm for a seedling supplementation device by using image processing methods such as grayscale processing, Otsu thresholding and open operation to eliminate noise. Pixel peaks and peak widths were calculated in rows and columns, and after determining the seed hole boundaries, pixel counts were performed to determine whether the holes were empty or not. Dong et al. [16] proposed a method to obtain the pixel coordinates of grid lines from a grid image. The number of empty tray holes was calculated by scanning the contour lines in each image to evaluate the presence of seeds in tray holes. Li et al. [17] investigated rice seeding using the preferred Lab color model and Otsu method. Although image processing methods previously described are not directly applicable to this device, the processing schemes proposed by these methods can provide references for the development of methods to identify miss-seeding tray holes in order to increase processing speed.
Wang et al. [18] proposed a device in which three sets of cylinders are used to drive a seed suction pin for complementary seeding. Bai et al. [19] proposed a device for complementary seeding using a corn grain suction nozzle and a specific seed release mechanism. Wen et al. [20] used a programmable logic controller (PLC) to control nozzles, reject unqualified seedlings and simultaneously accelerate the conveyor belt speed when empty grids reach the seedling drop funnel to ensure seedling supply continuity. However, when the rate of miss-seeding is high, the device should stop the movement of the tray and use the additional time to complete complementary seeding of all the miss-seeding tray holes, and only one hole complementary seeding can be completed at a time. By contrast, the proposed device is based on the TGOSM, which functions at a speed of up to 600 trays per hour; a pause in complementary seeding severely affects the normal working state of the seedling machine.
After analyzing the above references, this study considers that the application of machine-vision-related methods in the production of various crops has been developed in a relatively mature manner. Therefore, the application of image processing methods such as color threshold interval for the recognition of coated seed images in the factory seedling production of green onion will significantly improve its seedling efficiency and increase the yield. However, the above-mentioned machines involving complementary seeding or seedling production have the problem of not being able to complete the complementary seeding when the rate of miss-seeding is high, resulting in the suspension of tray movement. In summary, in this study, a rapid detection method was proposed for miss-seeding tray holes, and a complementary seeding device was devised for green onion seedling machine that can avoid the pause phenomenon and complete complementary seeding at a time. This will assist in achieving the real-time identification of miss-seeding tray holes in the tray and complete complementary seeding under high-speed moving conditions. The main contents of this study are as follows: (1) a rapid detection method of miss-seeding tray holes based on the majority mechanism was developed. (2) A set of automatic complementary seeding devices for the TGOSM was designed. (3) Vacuum-generated seed suction nozzle (VGSN) were incorporated in the design using a combination of numerical simulations and experiments. The aforementioned study provided a solid foundation for improving the seeding precision of green onion seeds, utilization rate of trays, and quality of green onion seedlings.

2. Materials and Methods

2.1. Hardware System

The complementary seeding unit comprises the following three parts (Figure 2): (1) an information collection unit, including the camera and its auxiliary equipment and sensor group. (2) A control unit, consisting of the central control unit, signal acquisition card, and peripheral circuits. (3) A pneumatic complementary seeding device (Figure 3), including the air source control device, seed suction nozzle array, and liftable sliding seed case.

2.1.1. Information Collection Unit

An industrial-grade camera MV-CE020-10GC (IKVISION, Hangzhou, Zhejiang, China) with a resolution of 1920 (horizontal pixels) × 1080 (vertical pixels), a light panel, a signal transmission line, and power supply equipment constituted the camera and its auxiliary equipment. An MVL-HF0828M-6MP lens was used in the study. The light panel consists of 128 LEDs with brightness thresholds between 12,000 to 13,000 lumens. The two light panels are installed at an angle on both sides below the industrial camera to provide a uniform light source for capturing images. The industrial camera faces the tray and is mounted vertically. The image acquisition area covers part of the tray. The sensor group consists of four diffuse photoelectric sensors (E3F-DS100C4) mounted on the side of the disk movement path and connected to the control unit for triggering the camera to capture pictures. The distance between the sensors is set to six tray holes. The angle and length of collected signals of the sensors was adjusted to prevent interference from other moving parts while collecting the moving signal of the tray.

2.1.2. Control Unit

A PC, Arduino (Uno R3) unit, signal acquisition card (NI USB-6009), two switching power supplies (12 V and 5 V), 60 groups of relays, and peripheral circuits constitute the control unit, whose primary function is to obtain sensor signals to send to PC and receive data processed by PC and send to Arduino. Arduino expands the aforementioned signals to 60 signal outputs by controlling the MCP23017 module to achieve individual control of all relays.

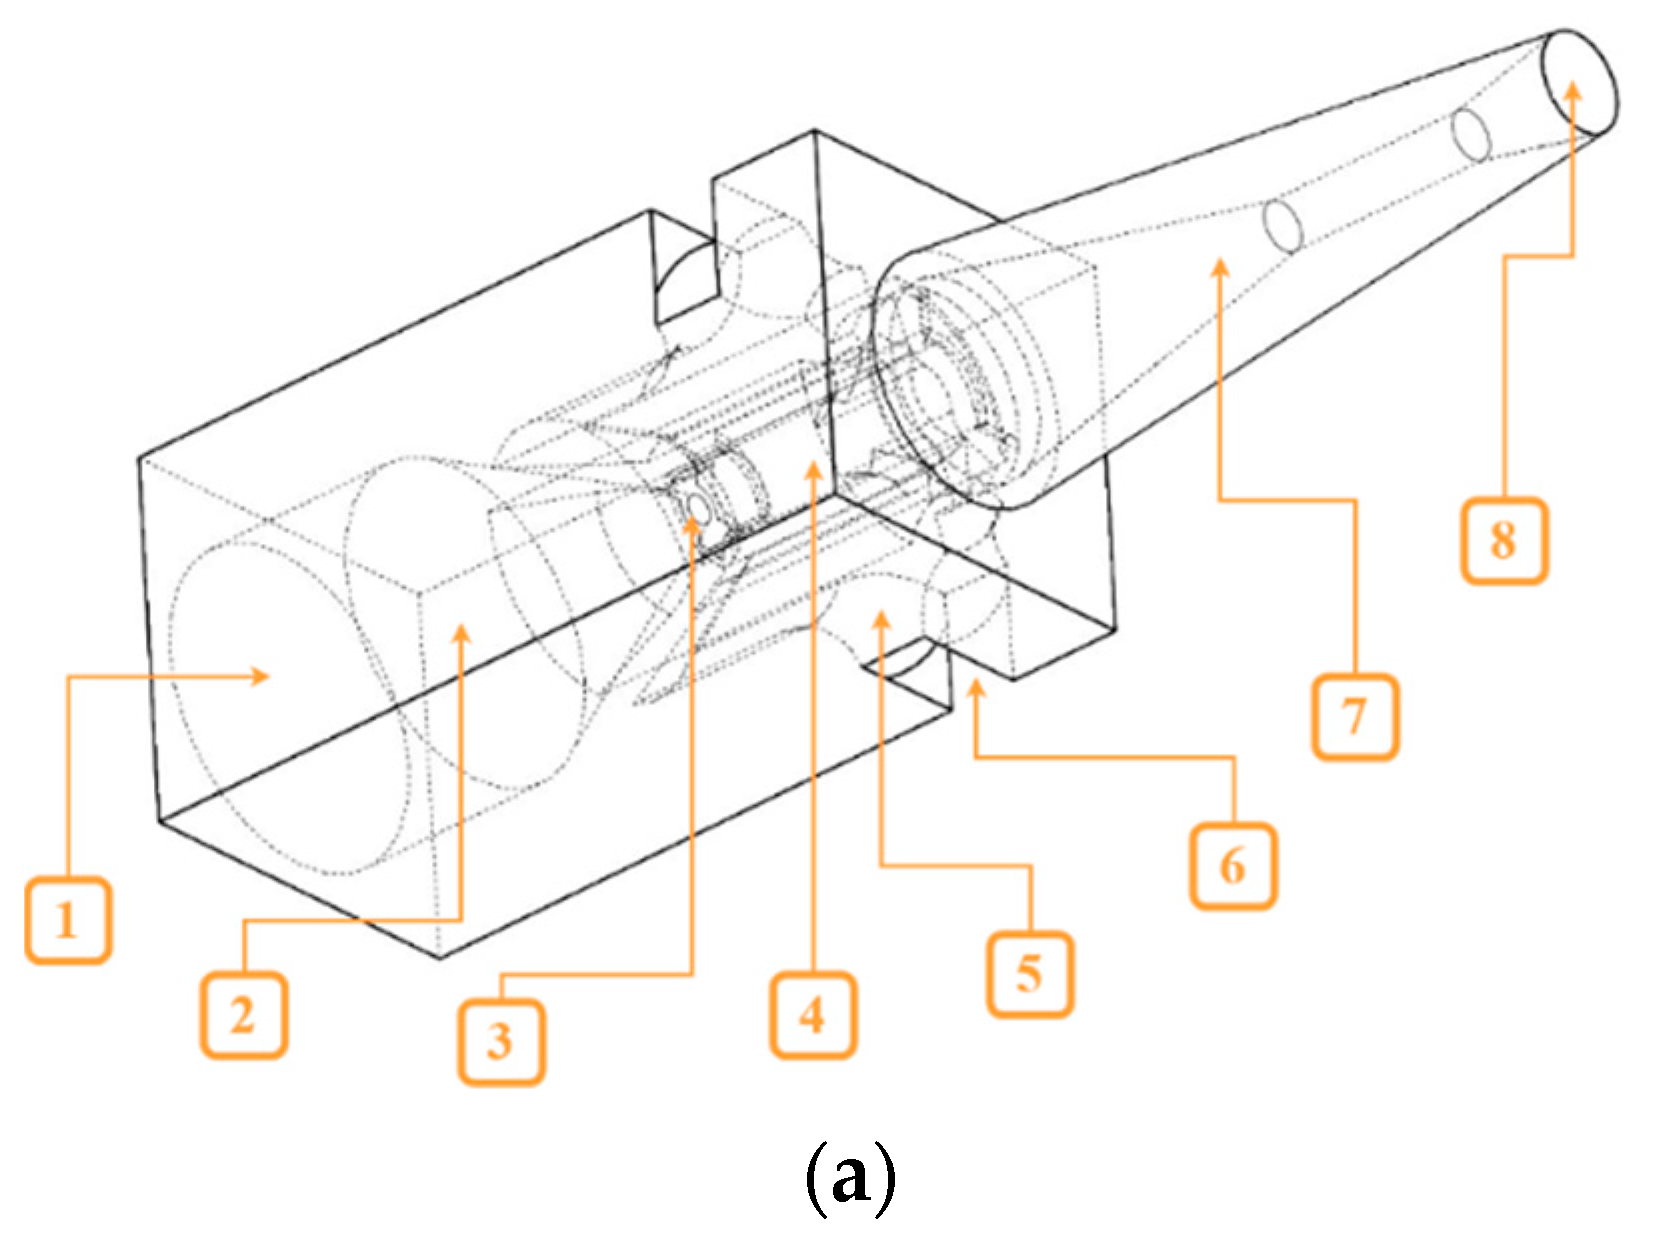
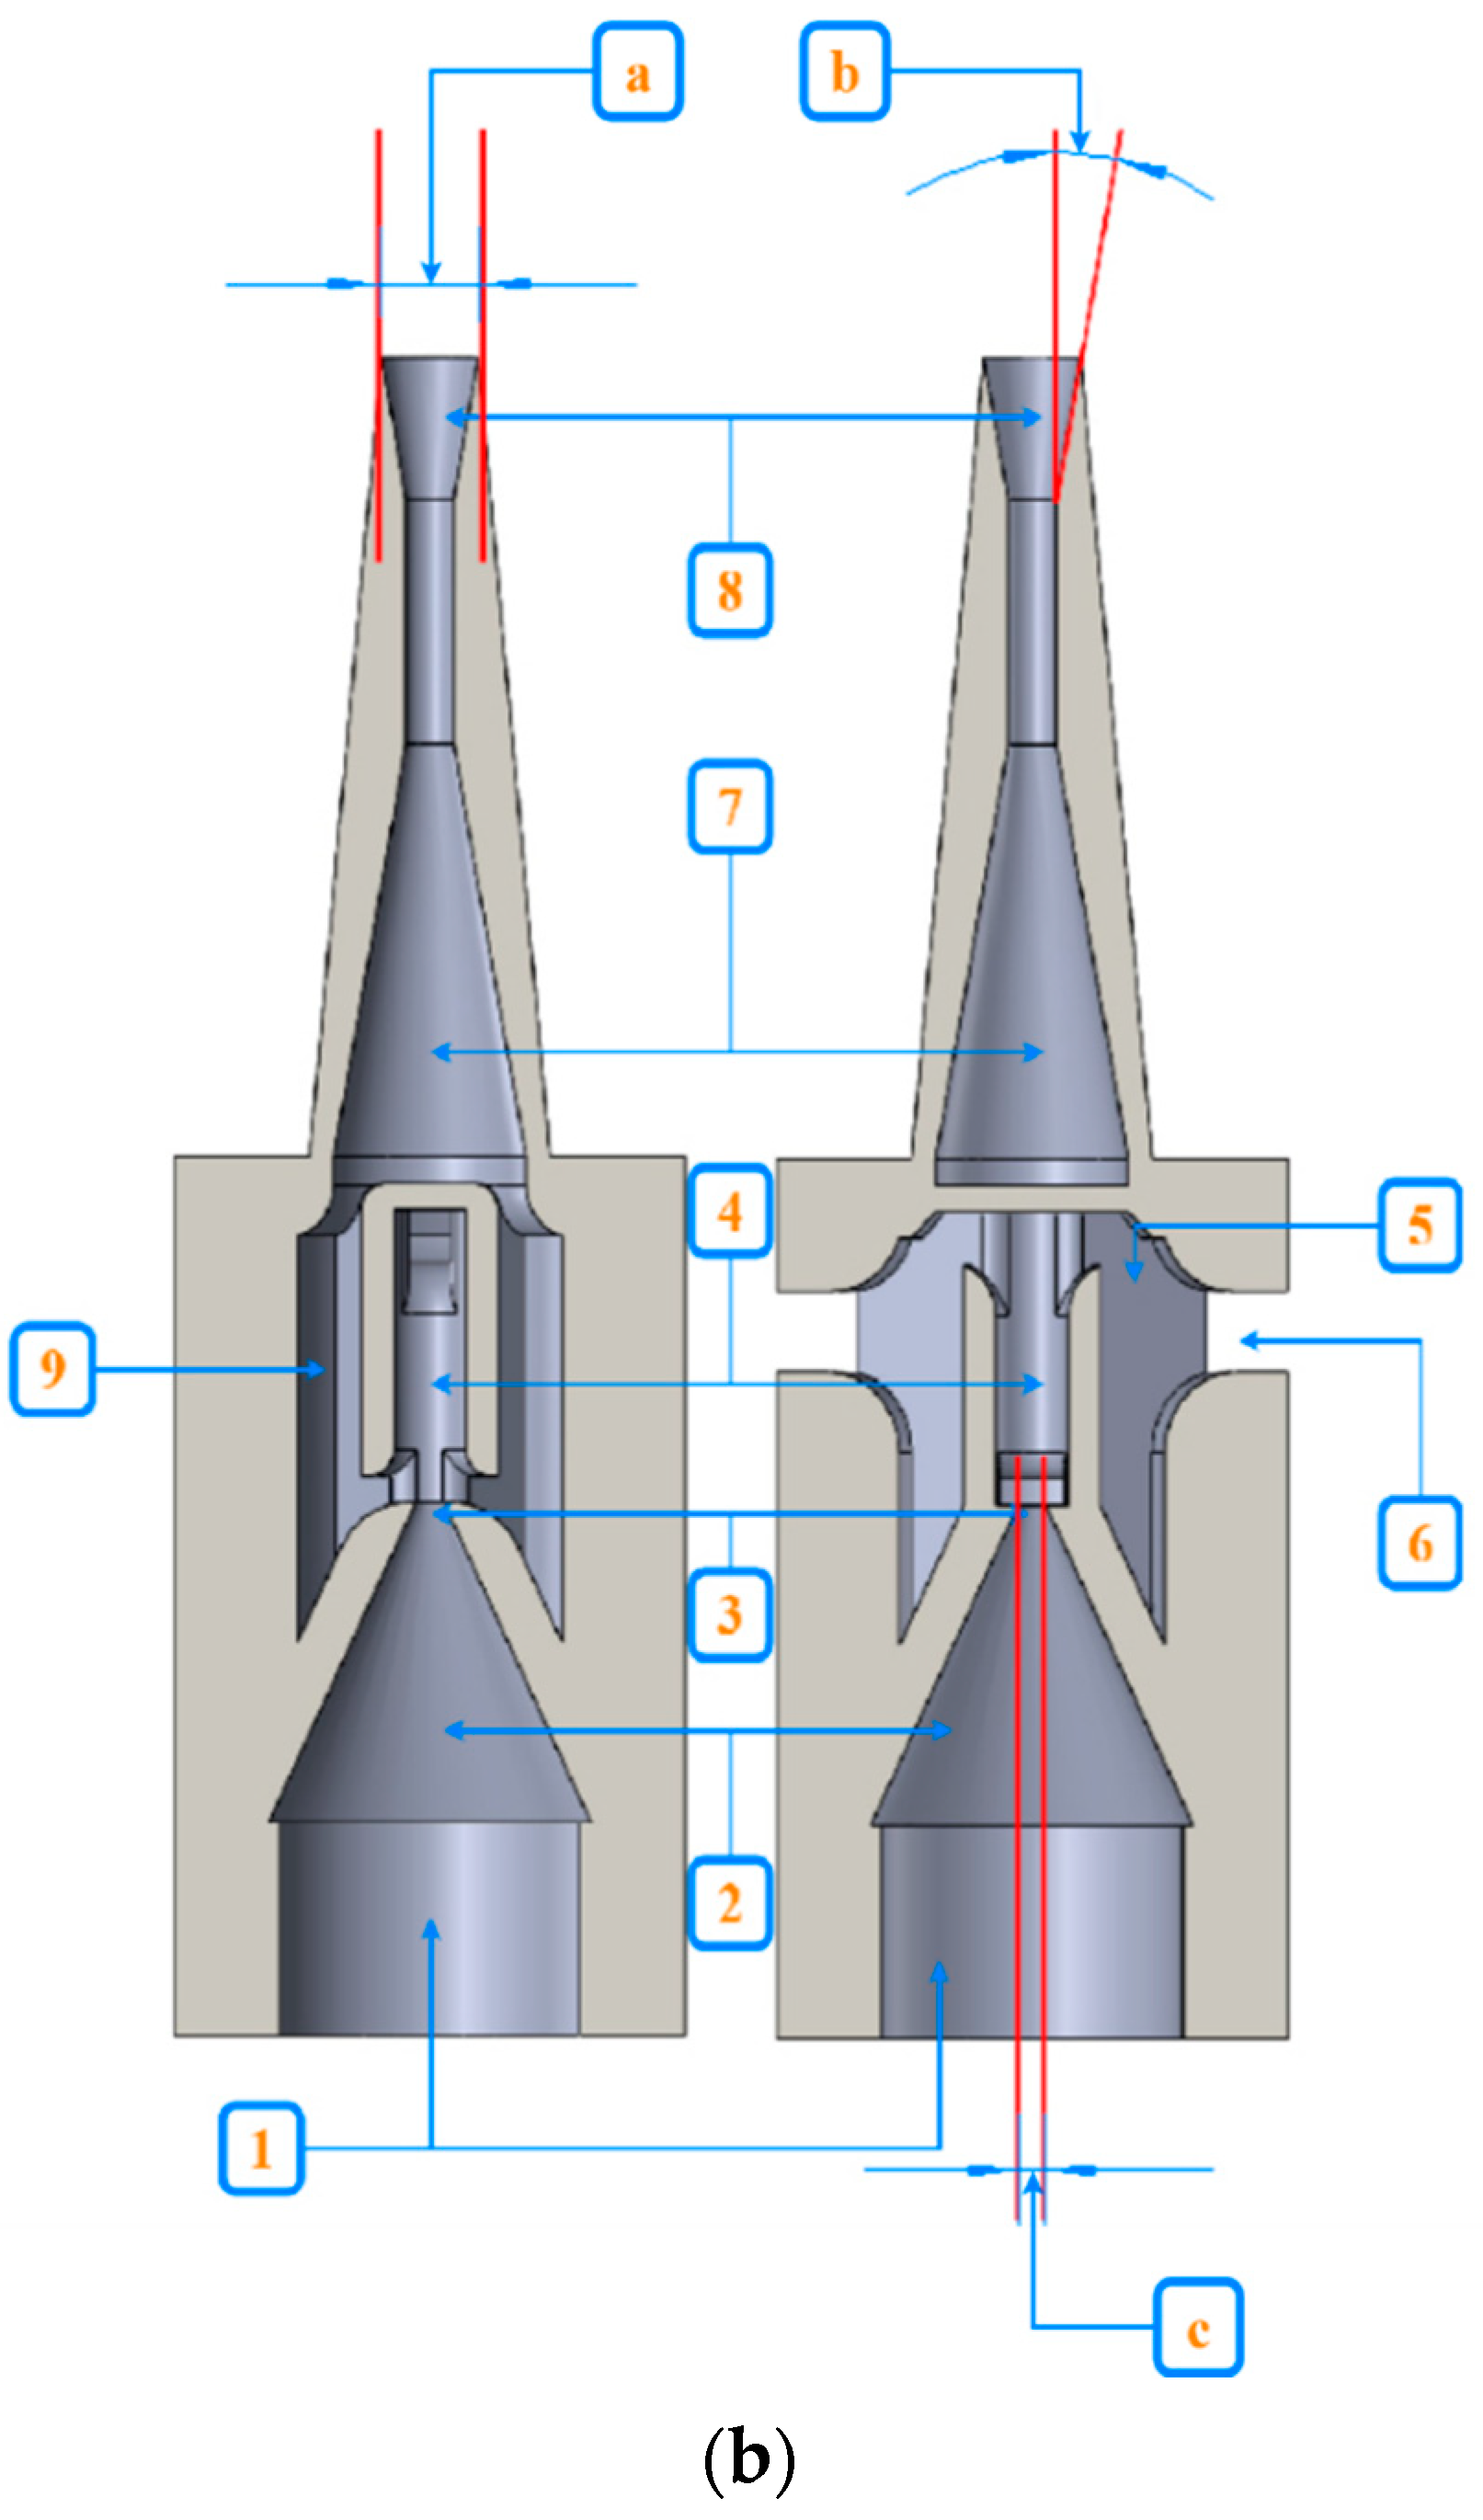
2.1.3. Complementary Seeding Unit

The pneumatic complementary seeding unit includes the air source control device, seed suction nozzle array, and liftable sliding seed case. The details are detailed as follows.
The air source control device (Figure 4) consists of six solenoid valve sets and an air compressor, which supplies compressed air to the inlet of the solenoid valve sets through polyurethane tubing (PU). The solenoid valve group consists of ten solenoid valves, each of which can be controlled individually.
The seed suction nozzle array (Figure 5) consists of 60 VGSNs arranged in a 6 × 10 array, corresponding to the tray holes. The air inlet of the seed suction nozzle array connects to the working port of the solenoid valve set through a PU tubing. This study is the first to design VGSNs; 3D printing is used to produce the apparatus.
The liftable sliding seed case (Figure 6) includes a case body, the main-bracket, and the sub-bracket. The case exhibits seed storage holes corresponding to each nozzle of the seed suction nozzle array. The main bracket is fixed to the movable end of the cylinder, and is hinged to the sub-bracket by four sets of connecting rods. The sub-bracket fastens the bottom surface of the case, and two front convex blocks are attached to the side of the sub-bracket away from the cylinder. The limiter corresponding to the front convex block fastens under the frame of the pneumatic complementary seeding device.
To ensure that the seeds in the storage holes do not fall out because of the suction nozzle drive, and to ensure that seed case vibration and seed stability is improved during the movement of the seed case, a bundle mouth structure was used.

2.2. Software System

This section details image acquisition, image processing, identification, and location of miss-seeding tray holes, data processing, and control of the complementary seeding mechanism. Image processing, data processing, and mechanical control programs were expressed using LabVIEW 2020 with the NI-DAQmx 20.0 and NI-IMAQmx 20.0 introduced, and Arduino was used to express signal expansion and output programs. The flowchart of the software system is shown in Figure 7. After initialization, the information collection unit was activated to collect the movement signal of the tray. The tray is photographed at a predetermined area and image processing is performed. If miss-seeding of holes in the tray image is determined during image processing, the holes are located and the compensative seeding unit is implemented. The system is reset and waits for the next command.

2.2.1. Image Acquisition

The TGOSM is equipped with a tray positioning baffle (Figure 8). To ensure that the trays are in the exact position for seeding, photographing, and complementary seeding, the trays move only in the center of the conveyor chain. When the conveyor chain drags the tray, the photoelectric sensor receives the contact signal from the tray, and the industrial camera is triggered to photograph the tray. The acquired images should cover six rows of plate holes accurately, with each tray processed in four passes. An example of the image acquired by the industrial camera is shown in Figure 9.

2.2.2. Image Processing

A majority mechanism method was proposed for identifying and detecting miss-seeding tray holes in green onion seedling machines based on the voting mechanism [19,21,22]. First, the color thresholding of images is performed on three color spaces. Image grayscale and morphological processing are performed simultaneously to reduce matrix and tray noise. The H-Dome algorithm is subsequently used to highlight the morphological features of the coated seeds. After image reconstruction, the image is segmented into regions. The pixel intensity threshold determination is performed on the coated seeds within each segmented region to locate miss-seeding holes. The image processing results in the three-color spaces are compared in the output, and the final results are determined based on a majority mechanism. The specific process is shown in Figure 10.

Color Thresholding

Because the target of image recognition is the coated seeds, and the color and morphological features of the coated seeds are distinctly different from the matrix background. Therefore, to distinctly highlight the morphological features of the coated seeds, color thresholding was applied to the RGB, HSL, and HSV color spaces. A total of 200 images were analyzed to obtain the following optimal parameter combinations: the thresholds for red, green, blue (RGB) space were set to R < 95, G > 90, B > 108; the thresholds for hue, saturation, lightness (HSL) space were set to 60 < H < 160, S > 70, L > 40; and the thresholds for the hue, saturation, value (HSV) space were set to 79 < H < 158, S > 50, V > 111. To preserve seed information, noise generated by the soil matrix and trays is left behind (Figure 11a).

Image Grayscale and Morphological Processing

IMAQ Cast Image 2 provided by NI Vision was used to obtain the greyscale. Morphological processing of the grayscale image is required to remove the interference noise described in the previous section. To ensure that the morphological characteristics of the circular coated seeds are not affected, erosion is used to process the grayscale image in this study. This method removes most noise. In this study, IMAQ Find Circles, an NI Vision function specializing in classifying and locating circular particles was used in grayscale images. This function separates overlapping circular seed particles in grayscale images to enhance the accuracy of subsequent grayscale threshold judgments.

H-Dome Algorithm and Image Reconstruction

The H-Dome algorithm (Figure 12) was used to process the grayscale images in the previous section [23,24,25] to obtain the highlighted “domes” of coated seeds to remove noise to obtain accurate images of coated seeds. The H-Dome algorithm requires reconstructing the coated seeds in the source image by subtracting the grayscale value of the high-brightness “dome” from the grayscale value of the source image. After obtaining the “dome image (Figure 11b),” the image was reconstructed again and resized to 1280 × 750 pixels for subsequent calls. After analyzing the processing results of 200 images, the grayscale value of the aforementioned high-brightness “dome” was set at 25 to obtain the best processing effect.

Image Region Segmentation

As shown in Figure 11c, the reconstructed image was regionally segmented and numbered based on the size and interval distance of the tray holes. Next, all segmented regions were polled for the pixel intensities threshold judgment, where the pixel intensity (Figure 11d) is obtained using the function IMAQ Light Meter (Rectangle) VI in NI Vision. The mask segmentation area below the threshold amount is determined to be a pending miss-seeding tray hole. The pixel intensities threshold of the RGB color space was 6.26; the pixel intensities threshold of the HSL color space was 7.67, and the pixel intensities threshold of the HSV color space was 9.93.

Majority Mechanism

Analysis of 200 images after color thresholding in Section 2.2.2 revealed that the RGB space is effective for processing distortion-free areas in the center of the image. By contrast, the distortion areas at the edges of the image did not affect the HSL and HSV spaces. To speed up image processing, instead of correcting the distortion area, image partition can be performed. Therefore, the red zone in Figure 13 is set as the RGB space weight area, and the blue area is set as the average weight area.
The majority mechanism is used to judge processing results in three color spaces for each image segmentation region. When the segmentation region to be judged is in the red zone, the RGB space analysis result is high weight. No weight is set when the segmented region is in the blue area.
y R = A B ¯ · A C ¯ ¯
y B = A B ¯ · A C ¯ · B C ¯ ¯
where: A is the analysis result in the RGB space, B is the analysis result in the HSL space, C is the analysis result in the HSV space, yR is the decision result of miss-seeding tray holes in the red zone, yB is the decision result of miss-seeding tray holes in the blue zone.
The analysis result (Figure 11e) of the tray image is obtained by combining yR and yB, and the order number of the segmented image judged to be a miss-seeding tray hole is counted and output. The final processing results are shown in Figure 14; the top left corner of each image is the origin, the X-axis is the horizontal axis, and the Y-axis is the vertical axis. The miss-seeding tray holes are first counted from left to right by using the X-axis, and subsequently, from top to bottom by the Y-axis. The top left corner is set as number 1 to start counting, and the final output number of miss-seeding tray holes is {18,25,28,29,31,39,40}.

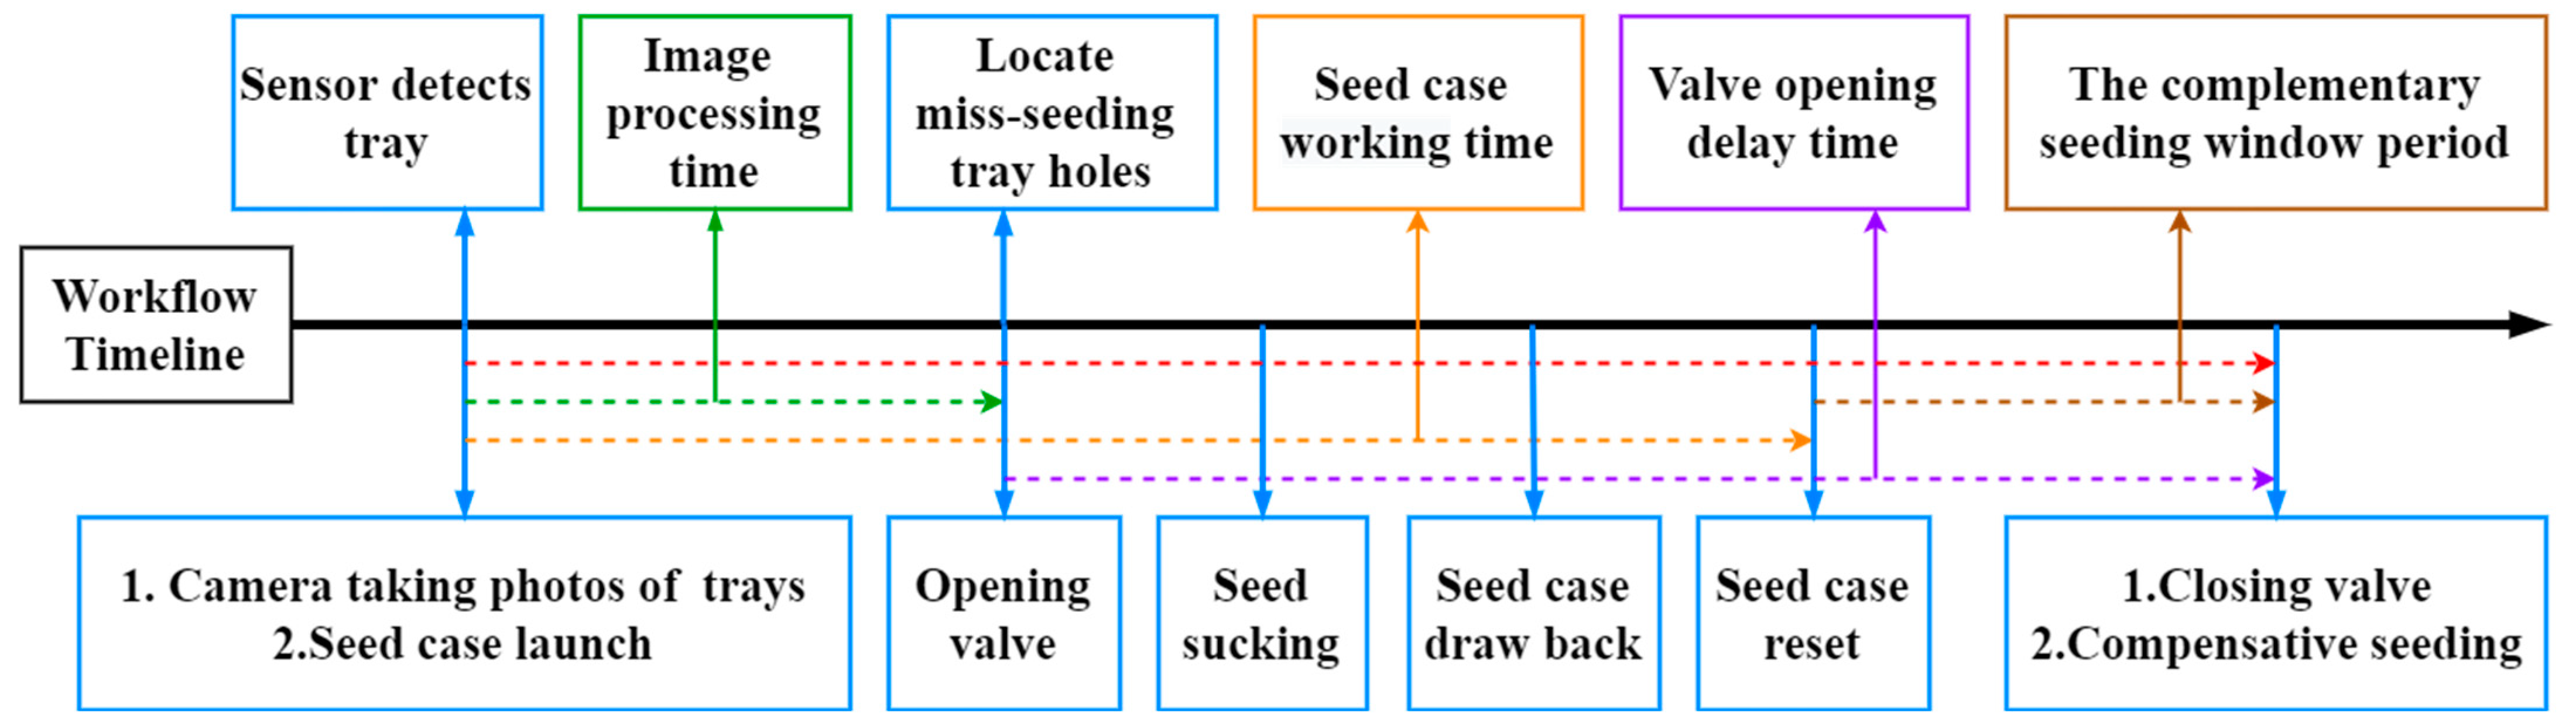
2.2.3. Complementary Seeding Workflow

Figure 15 displays the time flow of each part of the pneumatic complementary seeding unit. In the figure, the blue arrow denotes the time point, and the red, green, purple, and yellow lines denote the periods. The red line indicates the time available for the complementary seeding process. The green line denotes the image processing time, which includes the time from the acquisition of the tray image to the output of the image processing result. The purple line is the seed case working time, the yellow line is the valve opening delay time of the air source control device, and the brown line is the window period for the seeds to be placed into miss-seeding tray holes.

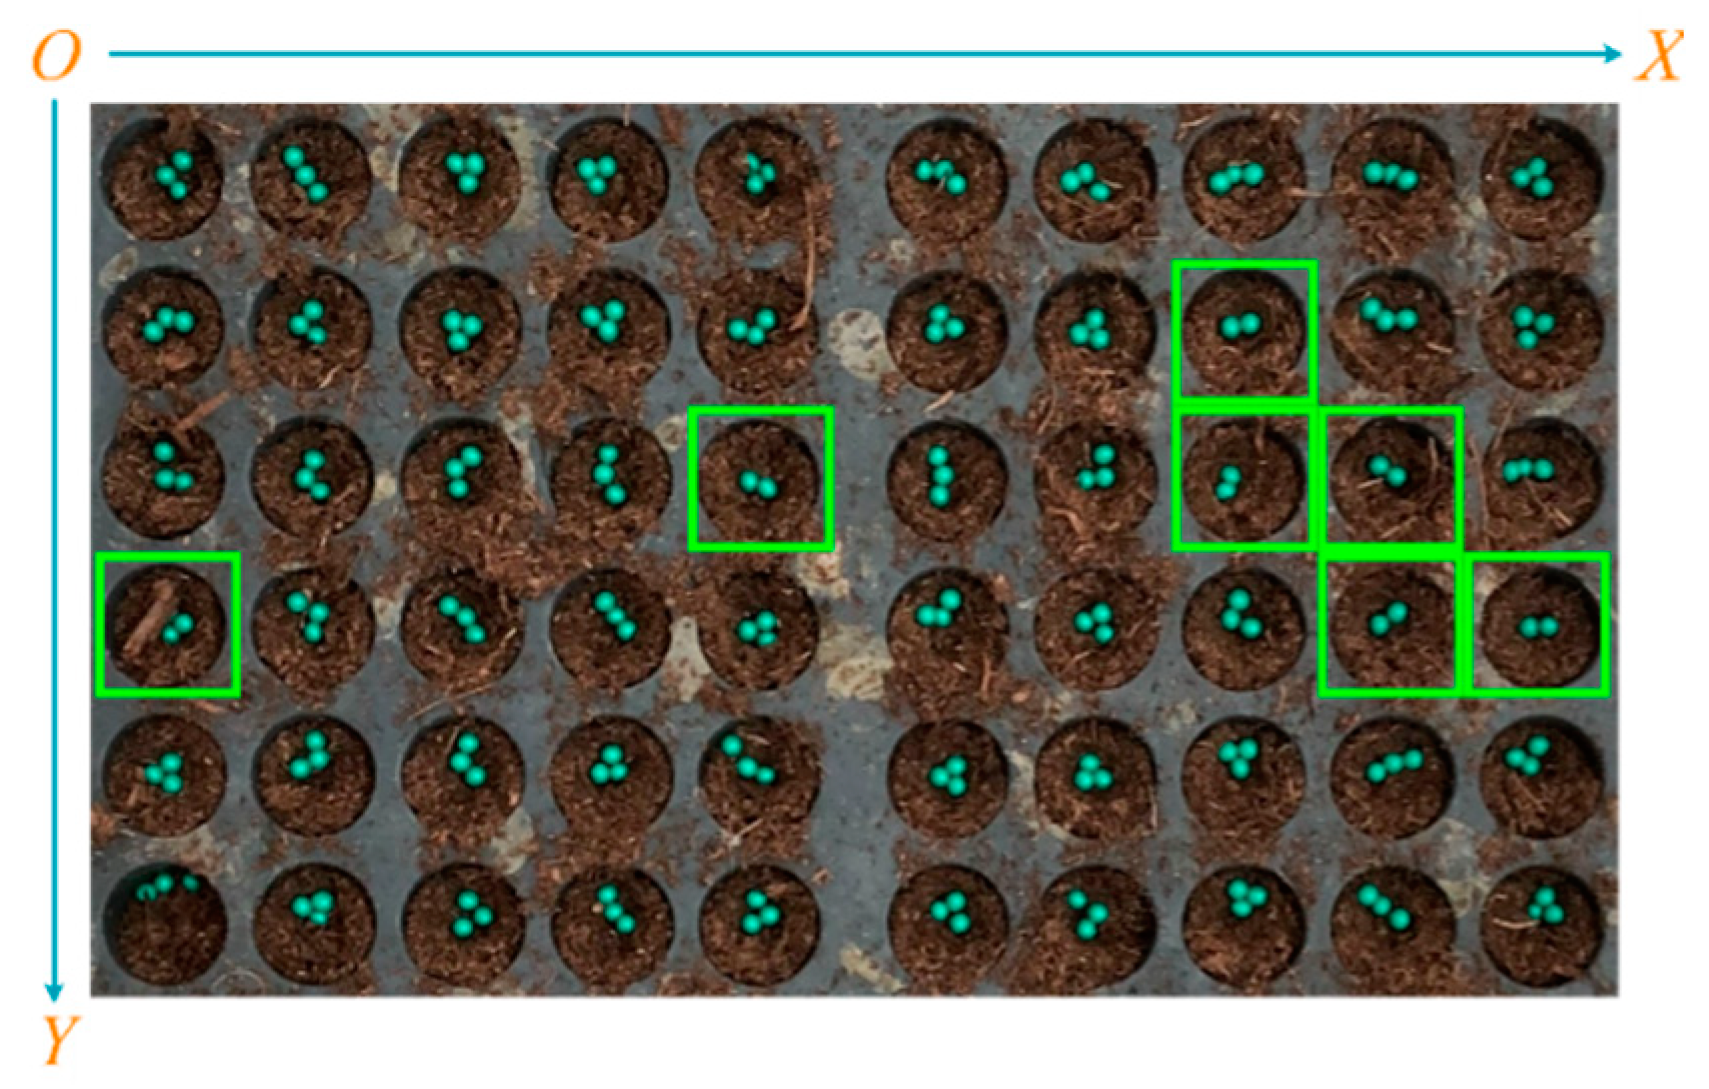
Locating Miss-Seeding Tray Holes

The missed seeding holes in the image are located and the specific nozzle location where the valve should open are determined according to the identification results of the miss-seeding tray holes in Section 2.2.2 and the specifications of the seed suction nozzle array (6 × 10 nozzles). After positioning, the solenoid valve in the same position on the air source control device is immediately opened to feed compressed air into the corresponding VGSNs to generate suction. As displayed in Figure 16, the red blocks in the figure are the nozzles on the seed suction nozzle array that should suck the seed.

Seed Case Launch and Seed Suction

When the contact signal of the tray is detected by the sensor, the seed case is immediately pushed out by the cylinder, and the sliding stand on the main support moves laterally along the slide groove. The movement of the seed case changes from horizontal to vertical under the action of four sets of connecting-rod mechanisms when the front convex block, which is on the sub-bracket, is held by the limiter. Thus, the seed case and seed suction nozzle synchronize to take the seed. The working process of the liftable sliding seed case is shown in Figure 17.

Seed Case Reset and Seed Release

After the seed suction nozzle takes up the seed, the cylinder drags the seed case to reset, resulting in the complementary seeding channel of the seed suction nozzle array. A time delay is started when the photoelectric sensor detects the movement signal of the tray; the air source control device opens the valve and feeds compressed air into the nozzle array. When the time delay ends, the tray reaches the bottom of the seed suction nozzle array. When the valve is closed and the air stops, the negative pressure of the seed suction nozzle array disappears, and the seeds fall into the corresponding miss-seeding tray holes by gravity, completing the replanting. The system enters standby mode when the entire tray passes and no new trays are detected.

2.3. VGSN Experimental Program

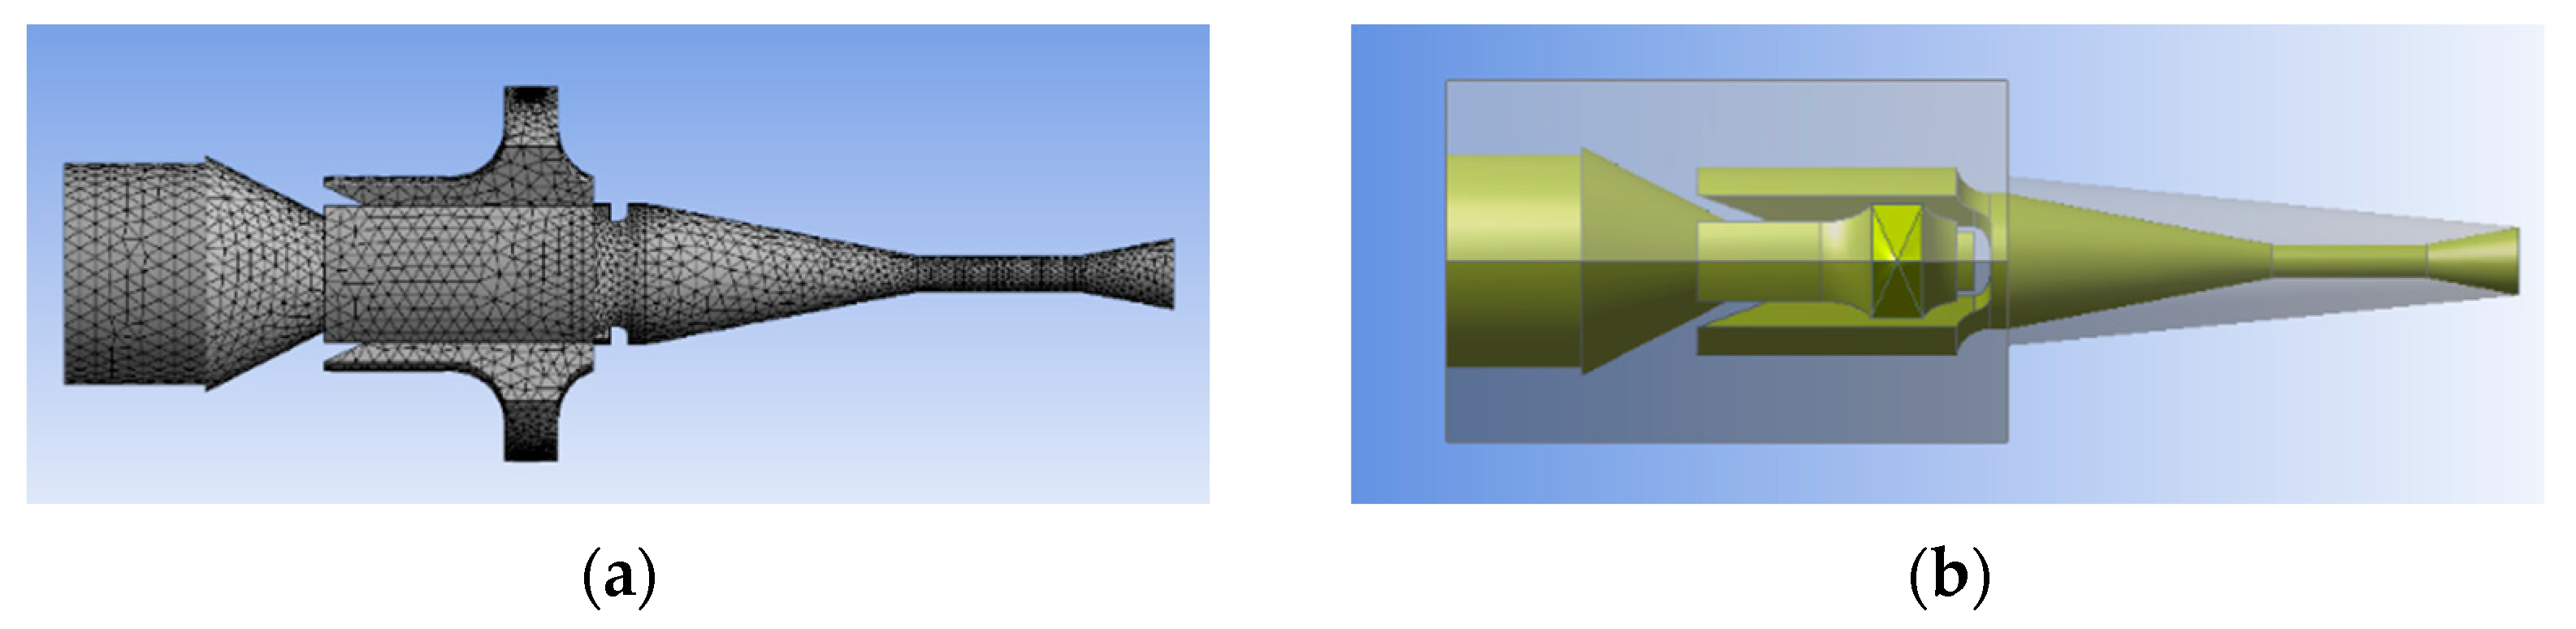
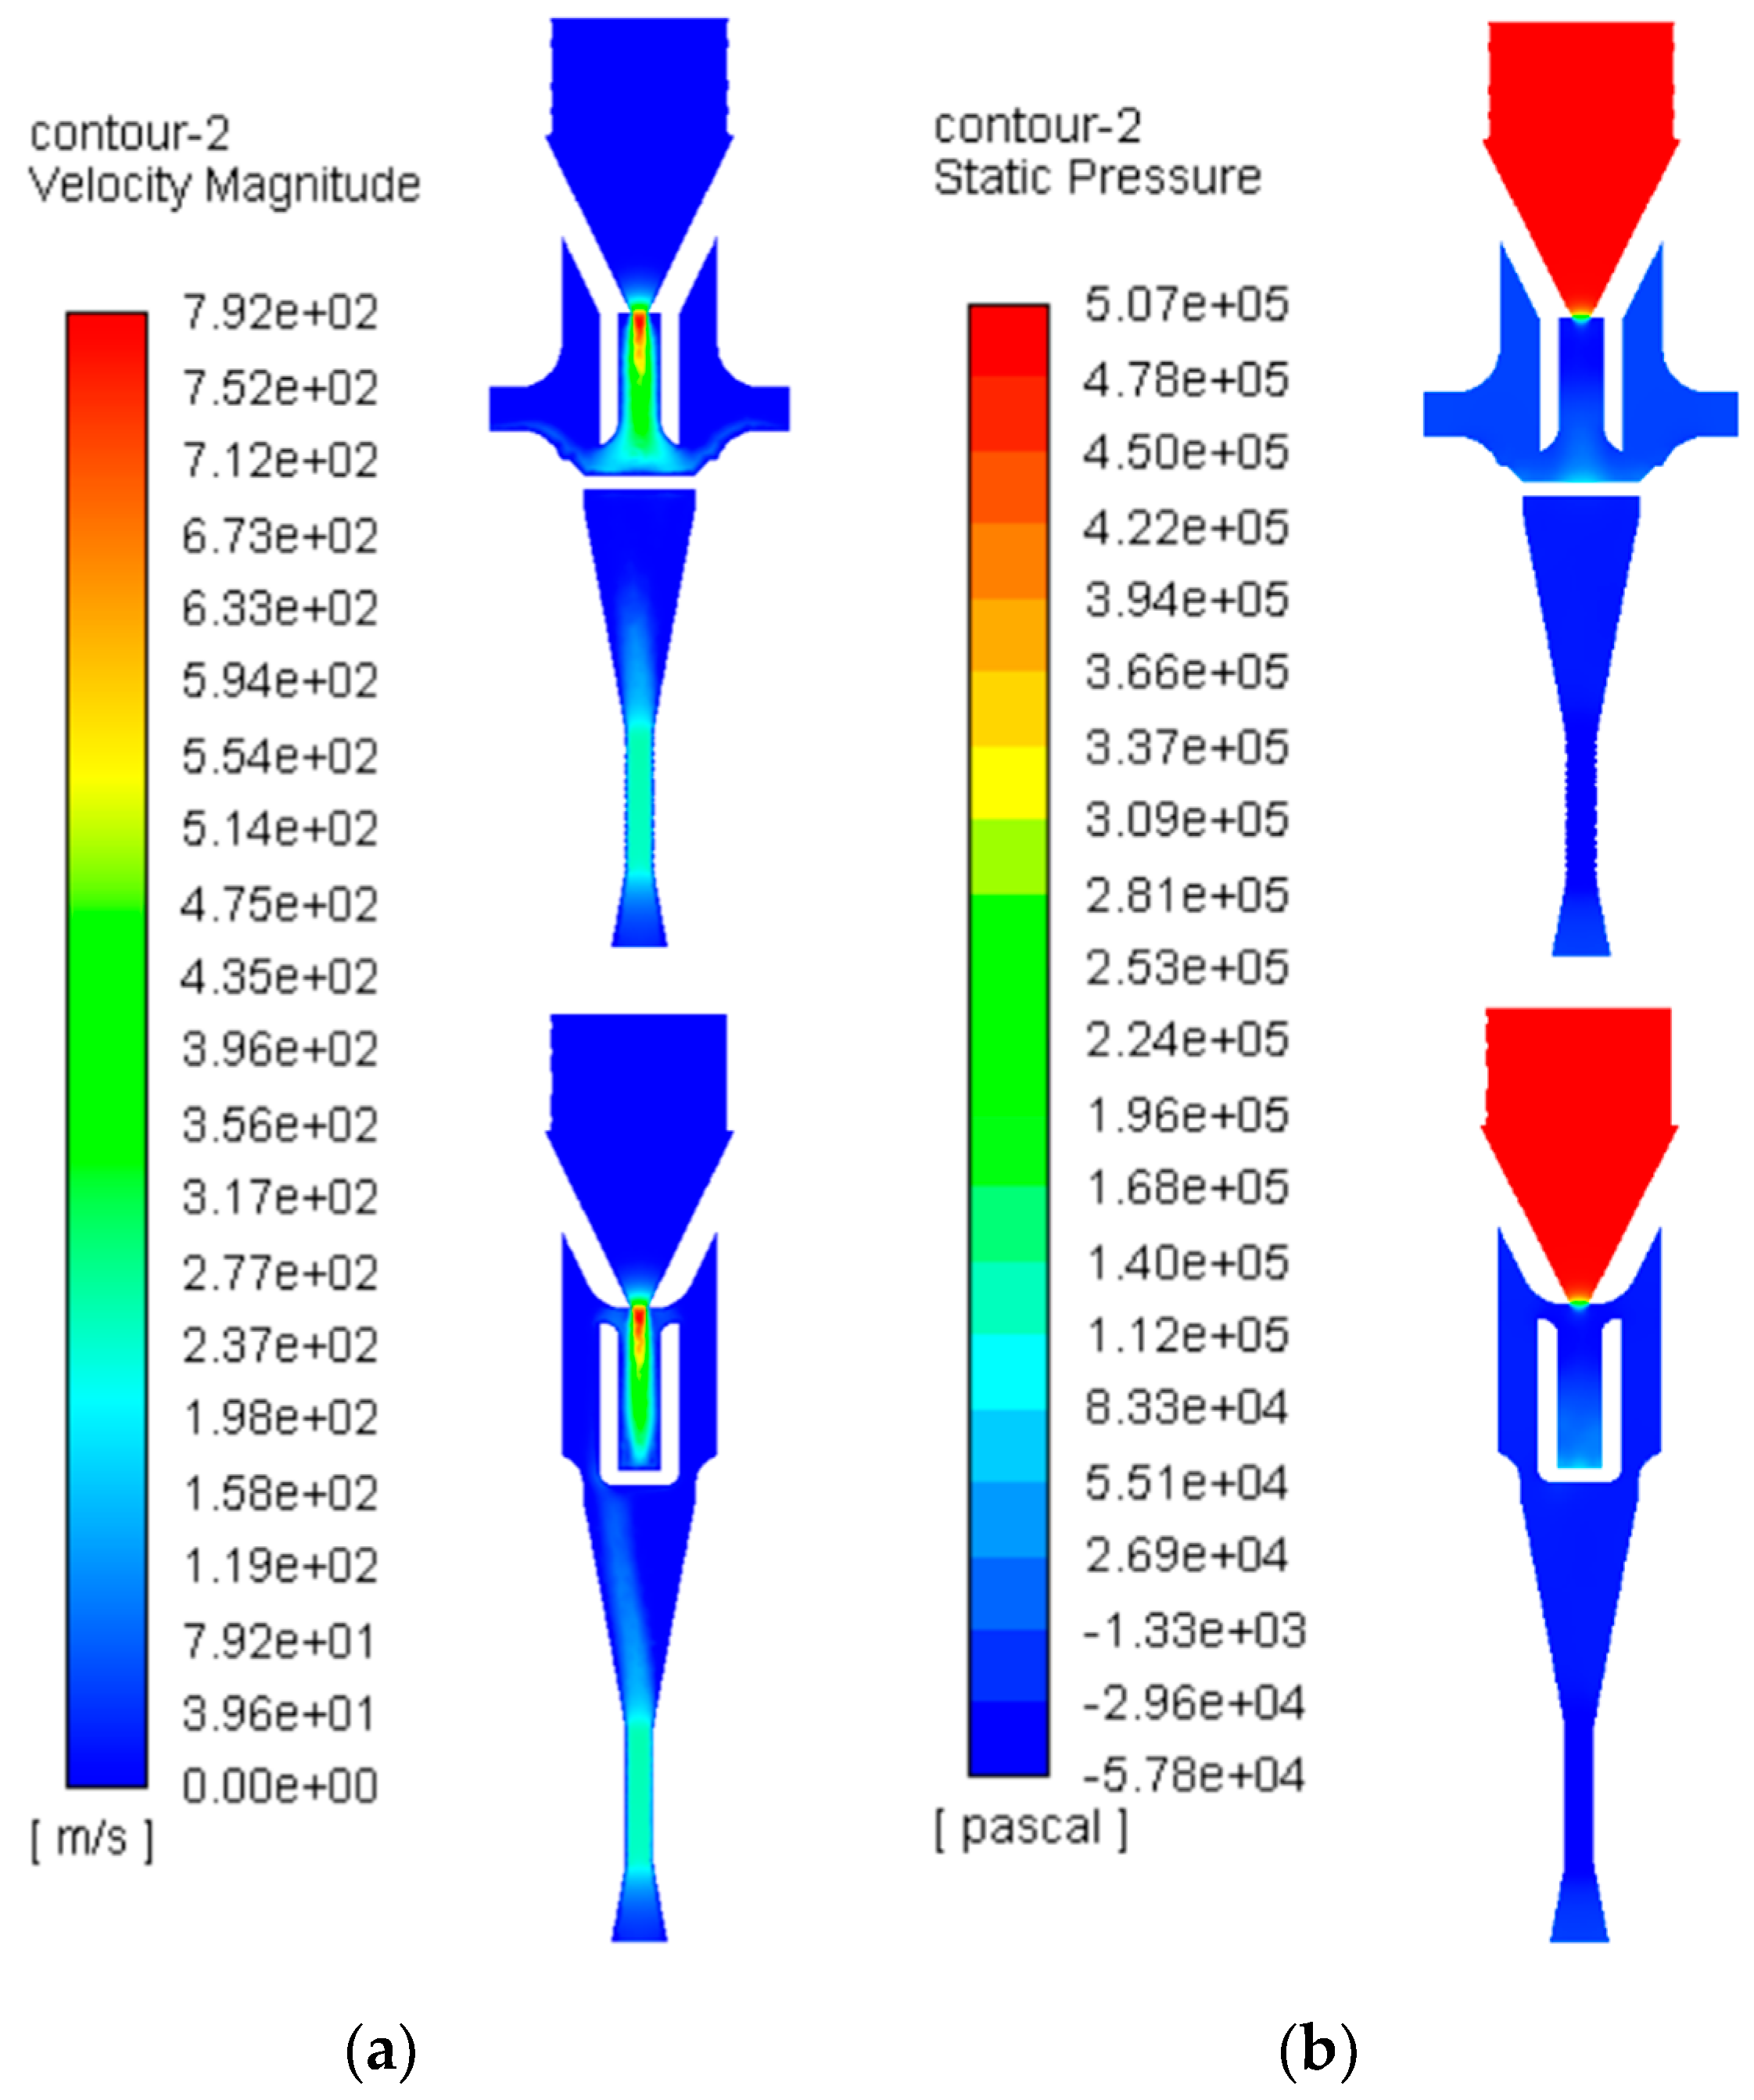
2.3.1. Internal Flow Characteristics

As shown in Figure 18, when the VGSN operates, compressed air enters the seed suction nozzle through the air inlet and is compressed by the contraction section and subsequently ejected through the spout to produce an air jet. This air jet flows in the throat at high speed and is discharged from the exhaust port through the exhaust airway. The high-speed airflow in the throat drives the air in the vacuum chamber and the vacuum air channel to flow to the throat; thus, negative pressure arises in the vacuum chamber and the vacuum airway. The internal air pressure at the seed suction port becomes lower than the external atmospheric pressure; thus, a suction force is generated that sucks up the seeds.

2.3.2. CFD Numerical Simulation

The model is simplified. Only the fluid area of the VGSN to be calculated is drawn by SolidWorks software and imported into ICEM software for meshing. The mesh quality of each model is controlled above 0.3, as shown in Figure 19a. Fluent 18.2 numerical simulation software was used to select the standard k–ε turbulence model, and a SIMPLE algorithm was used to calculate it. The pressure inlet was used for the compressed air input port and the set pressure was 0.5 MPa; the pressure outlet was used for the exhaust port, and the set pressure was 0.1 MPa; that is, the pressure at the exhaust port is atmospheric pressure. Other boundary conditions are as follows: no-slip wall surface and the wall roughness are set to 0.03 mm. Other parameters were set to improve calculation accuracy; the calculation residual was set to 1.0 × 10⁻⁴.
The flow characteristics of the VGSN at a simulated input air pressure of 0.5 MPa are presented in Figure 20. Figure 20a shows that compressed air entered the throat through the spout. The maximum velocity of the high-speed airflow can reach 792 m/s at the entrance of the throat, and the velocity decreases to 100 m/s by the time the airflow reaches the bottom of the throat. The figure displays an apparent airflow toward the throat in the vacuum airway, and its maximum velocity reaches 200 m/s. In Figure 20b, the lowest negative pressure in the narrowest part of the vacuum airway reaches −57.8 kPa, and the negative pressure at the seed suction port reaches less than −13.3 kPa.
The diameter of the suction nozzle was set to 3 mm in the 3D model for the numerical simulation, and the seed suction port was calculated using Equation (3) to achieve a suction weight of 38.4 g. Based on the seed weight measurement results in Section 3.1 (3.07 g per 100 seeds), this structure can satisfy seed extraction requirements. Numerical simulation revealed that the VGSN structure proposed in this study was reasonable and can generate sufficient suction force to satisfy the seed suction requirements.
m = F g = P S g = P π r 2 g
where: m is the weight that can be sucked up, g(gram), p is the input air pressure, kPa, π is the circumference (constant), r is the radius of the seed suction port in mm, and g is the gravity acceleration (constant). F is the suction force at the seed suction port, N, and S is the area of the seed suction port plane, mm2.

2.3.3. Key Details of Design Experimental Methods

As shown in Figure 21, the test nozzle was dragged 1000 times by a short-distance cylinder for the seed sucking test and the success rate of seed sucking and the repetition rate of seed sucking were counted. The repetition rate of seed sucking was included in the success rate of seed sucking.
(1)
Successful seed suction is defined as follows: first, the VGSN sucks a seed from the seed storage box. After disengaging the seed storage box, the seed remains stable at the suction port and falls down when the input air is cut off.
(2)
Repetitionary seed suction is defined as follows: first, the VGSN sucks more than one seed in the seed storage box. After disengaging from the seed storage box, multiple seeds are in a stable state at the suction port, and multiple seeds fall simultaneously when the air is cut off.

2.3.4. Seed Suction Nozzle Test Results and Analysis

According to the four-factor and three-level analysis experiment designed by Box-Behnken central composite design, the experimental scheme adopted 29 experimental points, including 24 analysis factors and five 0-point estimation errors. The experimental scheme and response values are presented in Table 1.

Regression Modeling and Significance Testing

According to the experimental scheme and results in Table 1, a multiple regression fitting analysis was performed using Design-Export 11 data analysis software to find the optimal working parameters. The quadratic polynomial regression models of the success rate of seed sucking Y1 and repetition rate of seed sucking Y2 on spout diameter X1, suction port angle X2, suction port diameter X3, and input air pressure X4 were established as shown in Equations (4) and (5). The analysis of variance is presented in Table 2.
The p-values for the models of the success rate of seed sucking Y1 and repetition rate of seed sucking Y2 were less than 0.01, indicating that the regression models were highly significant. The p-values of the lack of fit items were all greater than 0.05, indicating that the regression models fit well. The coefficients of determination R2 are 0.9579 and 0.9571, indicating that the regression model explained more than 95% of the sample data. The regression model could predict and analyze the success rate and repetition rate of seed sucking. For the success rate of seed sucking Y1, the regression terms X1, X2, X3, X 1 2 , X 2 2 had a highly significant impact (p < 0.01), and X 4 2 had a significant impact (p < 0.05). The order of significance of each factor was X3 > X2 > X1 > X4. For the repetition rate of seed sucking Y2, the regression terms X1, X2, X3, X 3 2 had a highly significant impact (p < 0.01); other regression terms did not have a significant effect. The order of significance of each factor was X2 > X3 > X1 > X4.
Y 1 = 98.56 + 0.658 X 1 + 0.733 X 2 + 1.66 X 3 + 0.25 X 4     0.1 X 1 X 2 0.125 X 1 X 3 0.1 X 1 X 4 0.15 X 2 X 3 0.1 X 2 X 4 0.2 X 3 X 4     0.763 X 1 2 1.4 X 2 2 0.313 X 3 2 0.451 X 4 2
Y 2 = 0.74 + 0.192 X 1 + 0.258 X 2 + 0.417 X 3 + 0.067 X 4     0.025 X 1 X 2 + 0.025 X 1 X 3 0.025 X 1 X 4 + 0.05 X 2 X 3 0.05 X 2 X 4 + 0.025 X 3 X 4     0.058 X 1 2 + 0.068 X 2 2 + 0.53 X 3 2 + 0.08 X 4 2

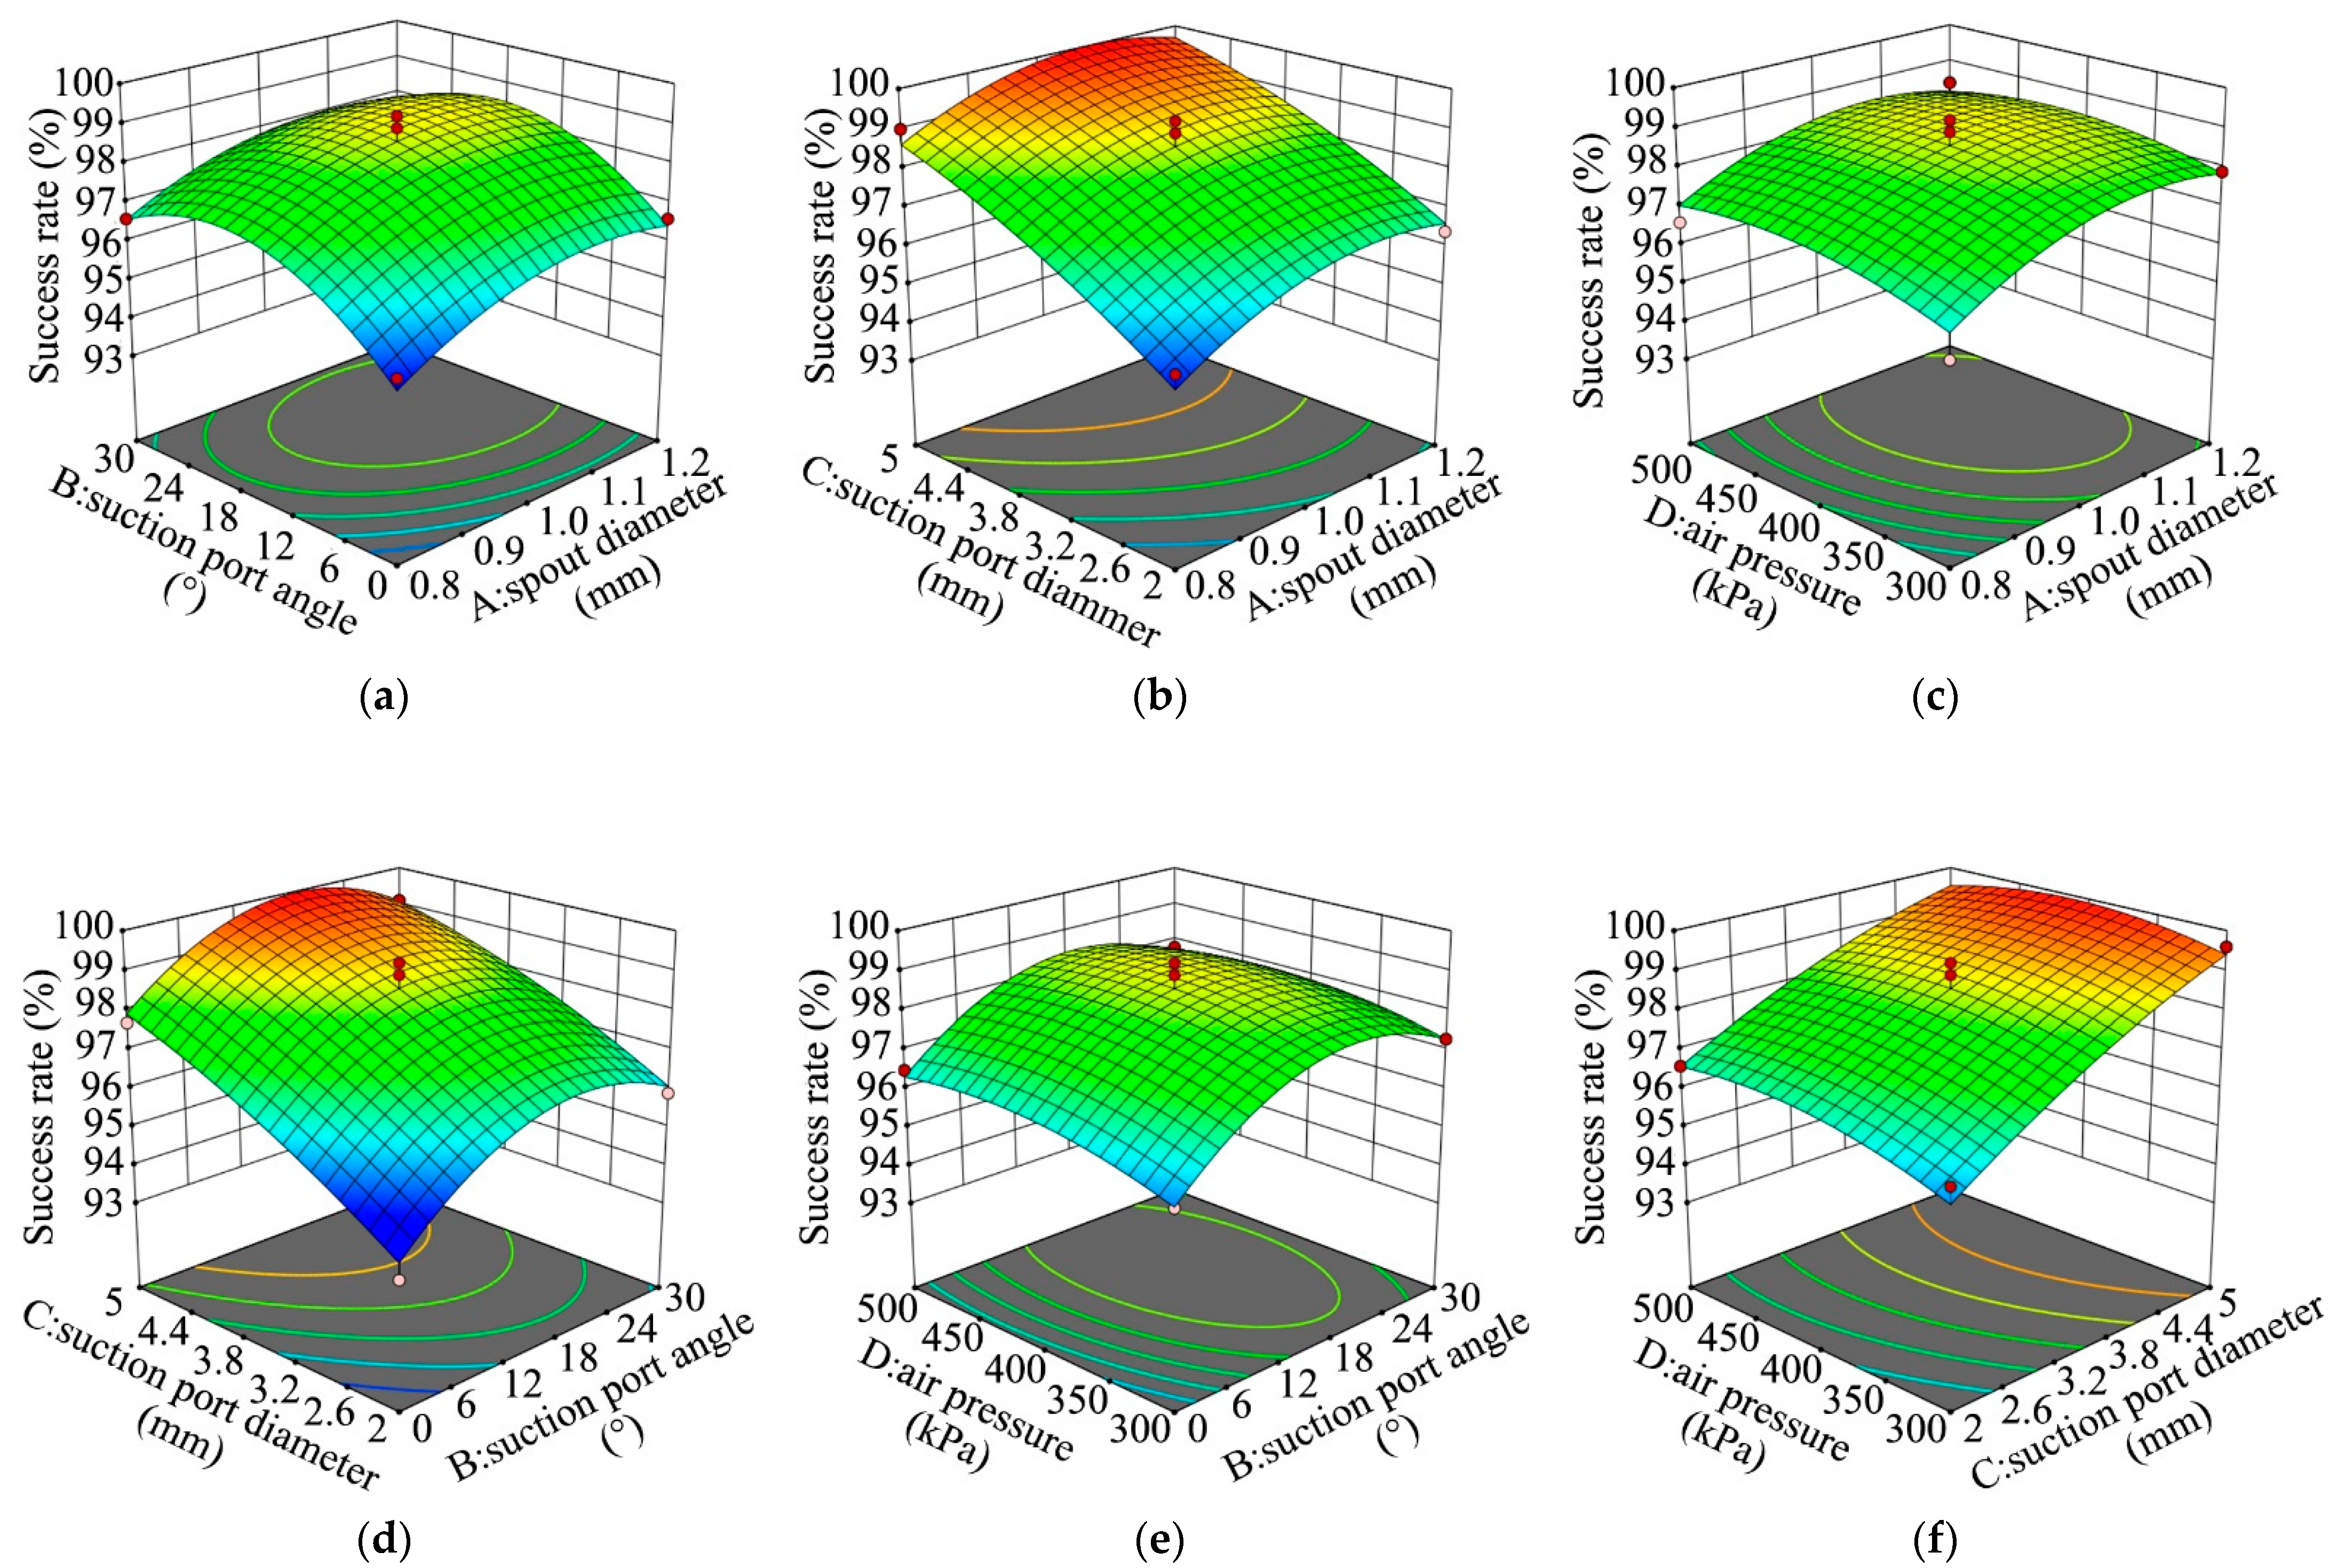
Response Surface Analysis

According to the regression model of seed-taking success rate and repetition rate, two of the test factors, X1, X2, X3, and X4, were placed at the 0-level in this experiment to analyze the effects of other factors on the evaluation index. The corresponding response surface plots were drawn, as shown in Figure 22 and Figure 23.
(1)
Response surface analysis of success rate of seed sucking
Figure 22a shows the response surface between the spout diameter and the suction port angle when the suction port diameter and the input air pressure are at the center level (X3 = 0, X4 = 0). When the suction port angle is certain, with the increase in the spout diameter, the success rate of seed sucking increases first and then decreases, and there is an optimal value of 1~1.1 mm. When the diameter of the spout is certain, with the increase of the suction port angle, the success rate of seed sucking is the first to increase and then slightly decreases, with an optimal value of 12~24°.
Figure 22b shows the response surface between the spout diameter and the suction port diameter when the suction port angle and the input air pressure are at the center level (X2 = 0, X4 = 0). When the spout diameter is certain, the success rate of seed sucking increases as the suction port diameter increases. When the seed suction port diameter is certain, with the increase in the spout diameter, the success rate of seed sucking increases first and then decreases, and there is an optimal value at about 1.1 mm.
Figure 22c shows the response surface between the spout diameter and the input air pressure when the suction port angle and the suction port diameter are at the center level (X2 = 0, X3 = 0). When the spout diameter is certain, with the increase of the input air pressure, the seeding success rate increases slightly and then decreases, but the overall change is small. When the input air pressure is certain, with the increase in the spout diameter, the success rate of seed sucking at first rises rapidly and then falls slowly, with optimal values of 1~1.2 mm.
Figure 22d shows the response surface between the suction port angle and the suction port diameter when the spout diameter and the input air pressure are at the center level (X1 = 0, X4 = 0). When the suction port angle is certain, the success rate of seed sucking increases as the suction port diameter increases. When the suction port diameter is certain, with the increase in the suction port angle, the success rate of seed sucking at first increases rapidly and then decrease, with the optimal value of 18~24°.
Figure 22e shows the response surface between the suction port angle and the input air pressure when the spout diameter and the suction port diameter are at the center level (X1 = 0, X3 = 0). When the suction port angle is certain, with the increase in the input air pressure, the success rate of seed sucking is the first to increase and then remain stable. When the input air pressure is certain, with the increase in the suction port angle, the success rate of seed sucking at first increases and then decreases, with the optimal value of 16~20°.
Figure 22f shows the response surface between the suction port diameter and the input air pressure when the spout diameter and the suction port angle are at the center level (X1 = 0, X2 = 0). When the suction port diameter is certain, with the increase of the input air pressure, the success rate of seed sucking at first increases and then slightly decreases, with an optimal value of 400~450 kPa. When the input air pressure is certain, the success rate of seed sucking increases as the suction port diameter increases.
(2)
Response surface analysis of repetition rate of seed sucking
Figure 23a shows the response surface between the spout diameter and the suction port angle when the suction port diameter and the input air pressure are at the center level (X3 = 0, X4 = 0). When the suction port angle is certain, the repetition rate of seed sucking grows with the increase in the spout diameter, but the growth rate gradually decreases. When the spout diameter is certain, the repetition rate of seed sucking increases as the suction port angle increases.
Figure 23b shows the response surface between the spout diameter and the suction port diameter when the suction port angle and the input air pressure are at the center level (X2 = 0, X4 = 0). When the suction port diameter is certain, the repetition rate of seed sucking slightly increases as the spout diameter increases. When the spout diameter is certain, with the increase in the suction port diameter, the repetition rate of seed sucking at first remains stable and then increases rapidly, with the optimal value of 2.6~3.2 mm.
Figure 23c shows the response surface between the spout diameter and the input air pressure when the suction port angle and the suction port diameter are at the center level (X2 = 0, X3 = 0). When the spout diameter is certain, the repetition rate of seed sucking decreases slightly as the input air pressure increases. When the input air pressure is certain, the repetition rate of seed sucking increases slightly as the spout diameter increases.
Figure 23d shows the response surface between the suction port angle and the suction port diameter when the spout diameter and the input air pressure are at the center level (X1 = 0, X4 = 0). When the suction port diameter is certain, the repetition rate of seed sucking increases as the suction port angle increases. When the suction port angle is certain, with the increase of the suction port diameter, the repetition rate of seed sucking is the first to decrease lightly and then increase rapidly.
Figure 23e shows the response surface between the suction port angle and the input air pressure when the spout diameter and the suction port diameter are at the center level (X1 = 0, X3 = 0). When the suction port angle is certain, with the increase of the input air pressure, the repetition rate of seed sucking at first remains stable and then decreases slightly. When the input air pressure is certain, the repetition rate of seed sucking increases slightly as the suction port angle increases.
Figure 23f shows the response surface between the suction port diameter and the input air pressure when the spout diameter and the suction port angle are at the center level (X1 = 0, X2 = 0). When the input air pressure is certain, with the increase in the suction port diameter, the repetition rate of seed sucking at first decreases and then increases rapidly, with an optimal value of 2.6~3.2 mm. When the suction port diameter is certain, with the increase in the input air pressure, the repetition rate of seed sucking remains stable.

Optimal Working Parameters Determination

Based on the results of ANOVA and response surface analysis, under the premise of meeting the requirements of complementary tray seeding, the regression models of the above seeding success rate Y1 and seeding repetition rate Y2 were optimized using Design-Export 11 and excluded the non-significant terms, and the results are shown in Equations (6) and (7).
Y 1 = 98.56 + 0.658 X 1 + 0.733 X 2 + 1.66 X 3 0.763 X 1 2 0.313 X 3 2 0.451 X 4 2
Y 2 = 0.74 + 0.192 X 1 + 0.258 X 2 + 0.417 X 3 + 0.068 X 2 2
Regarding the actual TGOSM operation methods, it is required that success and repetition rate of seed sucking reach the optimal level. Due to the inconsistent influence of various factors on the target value, global multi-objective optimization is needed. The optimized mathematical model is as follows
max Y 1 ( X 1 , X 2 , X 3 , X 4 ) 95 % min Y 2 ( X 1 , X 2 , X 3 , X 4 ) 1.8 % s . t . { 0.8 mm X 1 1.2 mm 0 X 2 30 2 mm X 3 5 mm 350 kPa X 4 500 kPa
The objective function was solved to obtain the optimal values of each influencing factor: the spout diameter was 1.014 mm, the suction port angle was 14.78°, the suction port diameter was 3.684 mm, and the input air pressure was 401.746 kPa, at which the model predicted the success rate of seed sucking was 98.79% and the repetition rate of seed sucking was 0.67%. The optimized parameters were rounded off as follows: the spout diameter was 1 mm, the suction port angle was 15°, the suction port diameter was 3.7 mm, and the input air pressure was 400 kPa.

3. Results and Discussion

3.1. Experimental Material Selection

As shown in Figure 24, coated seeds (Jia Lu No.3, Shandong Zhangqiu Green Onion Seeds), dry soil matrix, and trays for seed seeding and identification performance testing were used in this study. Coated seeds were placed in the seed box of the seed sower, and the moistened soil matrix was incorporated into the matrix loading device for testing. In this study, the number and percentage of miss-seeding tray holes are calculated under practical conditions, and the effect of morphological characteristics of miss-seeding tray holes on the identification method test was investigated.
The coated seeds were dimensionally measured and weighed to determine the effect of seed shape and weight on the performance of subsequent studies and complementary seeding units. Statistically, the 100 seed weight of the coated seeds was 3.07 g and the average shaft diameter was 3.65 mm.

3.2. Seeding EFFECT TEST of the TGOSM

Fifty trays were produced using TGOSM for 11,000 holes, some of the trays which are shown in Figure 25. The number and percentage of various tray holes were counted and are presented in Table 3.
These data revealed that the number of empty tray holes and one seed tray hole in the miss-seeding tray holes is minimal, and the vast majority of these trays are two-seed tray holes. Therefore, complementary seeding detects all tray holes with less than three seeds, that is, miss-seeding tray holes. Repeat seeding tray holes are those with more than three seeds. All the miss-seeding tray holes are complemented with one seed at a time to ensure that most of the tray holes are fully sown, and all empty holes are eliminated to ensure the quality of sowing.

3.3. Seed Suction Nozzle Suction Effect Testing and Verification

The study verified the effectiveness of the seed nozzle based on the final optimization results in Section 2.3.4. The test was repeated 1000 times, with the statistical results presented in Table 4.
The experimental results show that the relative errors between the tested values and the predicted values are less than 5%, and the tested values are in good agreement with the predicted values, indicating that the regression model is reliable.

3.4. Testing the Performance of Miss-Seeding Tray Hole Recognition

The image recognition tests were performed using the RGB, HSL, HSV, and majority mechanism-based image recognition method. Manual identification was also performed, and the statistics of each resultant parameter are presented in Table 5.
The precision (P) and recall (R, the proportion of correctly identified miss-seeding holes) of tray can be calculated by substituting the parameters in Table 6 into the function. These values are used to measure the model performance. The F1 score (weighted summed average of precision and recall) can also be calculated using p and R to measure the model performance.
P = T P T P + F P × 100 %
R = T P T P + F N × 100 %
F 1 = 2 P R P + R × 100 %
The statistics derived from all tested trays are shown in Figure 26. This details precision, recall, and F1 score of the miss-seeding tray hole identification method based on the majority mechanism, indicating superior image processing compared with the single-color space. The miss-seeding tray hole identification method based on the majority mechanism ensures precision close to 99% based on recall of approximately 97% and F1 score of approximately 98%. These values indicate that this method can satisfy the identification requirements for the miss-seeding tray holes and lays the data foundation for subsequent replanting.

3.5. Performance Testing of the Complementary Seeding Unit

To test the performance of the pneumatic complementary seeding unit, the complementary seeding experiments were conducted in the practical production pipeline (Figure 27). The proposed device was placed before the soil matrix covering device and after the precision seeding device.
The test was performed using an input air pressure of 400 kPa. The conveyor chain speed in normal working conditions was 0.1 m/s, and the production speed of the tray was 600 trays per hour, which is approximately 6 s per tray, which denotes that the available time for the complementary seeding process is 1.5 s per quarter of the tray (red line in Figure 15). The average image processing time was 0.21 s (green line in Figure 15), the average seed case working time was 0.9 s (orange line in Figure 15), and the average window period used to put the seeds into the miss-seeding tray holes was 0.6 s (brown line in Figure 15). Because the height from the seed suction port to the tray is 110 mm, the free-fall time of the coated seeds can be obtained as 0.15 s. When the air supply to the seed suction nozzle array is cut off, the coated seeds exhibit sufficient time to be released into the miss-seeding tray holes. When the interval between trays is larger than 1 cm, the photoelectric sensor can accurately pick up the approach signal of the trays.
As shown in Figure 28, the test results revealed that the complementary device reduces the empty tray hole rate from 0.084% to 0.003%, the single seed tray hole rate from 0.486% to 0.094%, the double seed tray hole rate from 4.809% to 0.811%, and the miss-seeding tray holes rate from 5.374% to 0.890%. The reduction in misidentified tray holes resulted in a slight increase in the repetition rate (from 1.070% to 1.406%), but the germination rate is not affected.

3.6. Discussion

In this study, an automatic complementary seeding device based on machine vision is proposed instead of manual complementary seeding. The device can realize real-time identification of the miss-seeding tray holes in the tray under high-speed moving conditions, and also can completely avoid the pause phenomenon and automatically finish the complementary seeding at one time. This can be proven by the experimental results in Section 3.5; by using this equipment the number of miss-seeding holes in the TGOSM can be greatly reduced, which improves seeding accuracy, seedling quality and even directly affects the yield. However, the identification method proposed in this paper can only be applied to pelletized seeds, which has a narrow applicability; meanwhile, the operation of the complementary seeding device is noisy due to the large number of pneumatic components involved. Next, further research will be conducted on the identification method with wider applicability, while using a suitable scheme to solve the noise problem.

4. Conclusions

A machine-vision-based complementary seeding device of tray-type green onion seedling machine was designed. In this study, a real-time detection of miss-seeding tray holes was proposed. The control system and mechanical structure of the complementary seeding device were investigated, and the following conclusions were obtained:
(1)
A majority mechanism-based miss-seeding tray hole rapid detection method was proposed, which uses image processing techniques including: color thresholding, morphological processing, the H-Dome method, and image reconstruction. The experimental results revealed that regarding the average values of precision, recall, and F1 scores for miss-seeding tray holes identification, the majority mechanism-based methods are better than those using only a single space.
(2)
The structural parameters of the vacuum-generated seed suction nozzle were designed and optimized, and the real object was produced using 3D printing technology. The performance of the parameters was verified through numerical simulation and experiment. The test results revealed that the vacuum nozzle can satisfy the seed suction requirements.
(3)
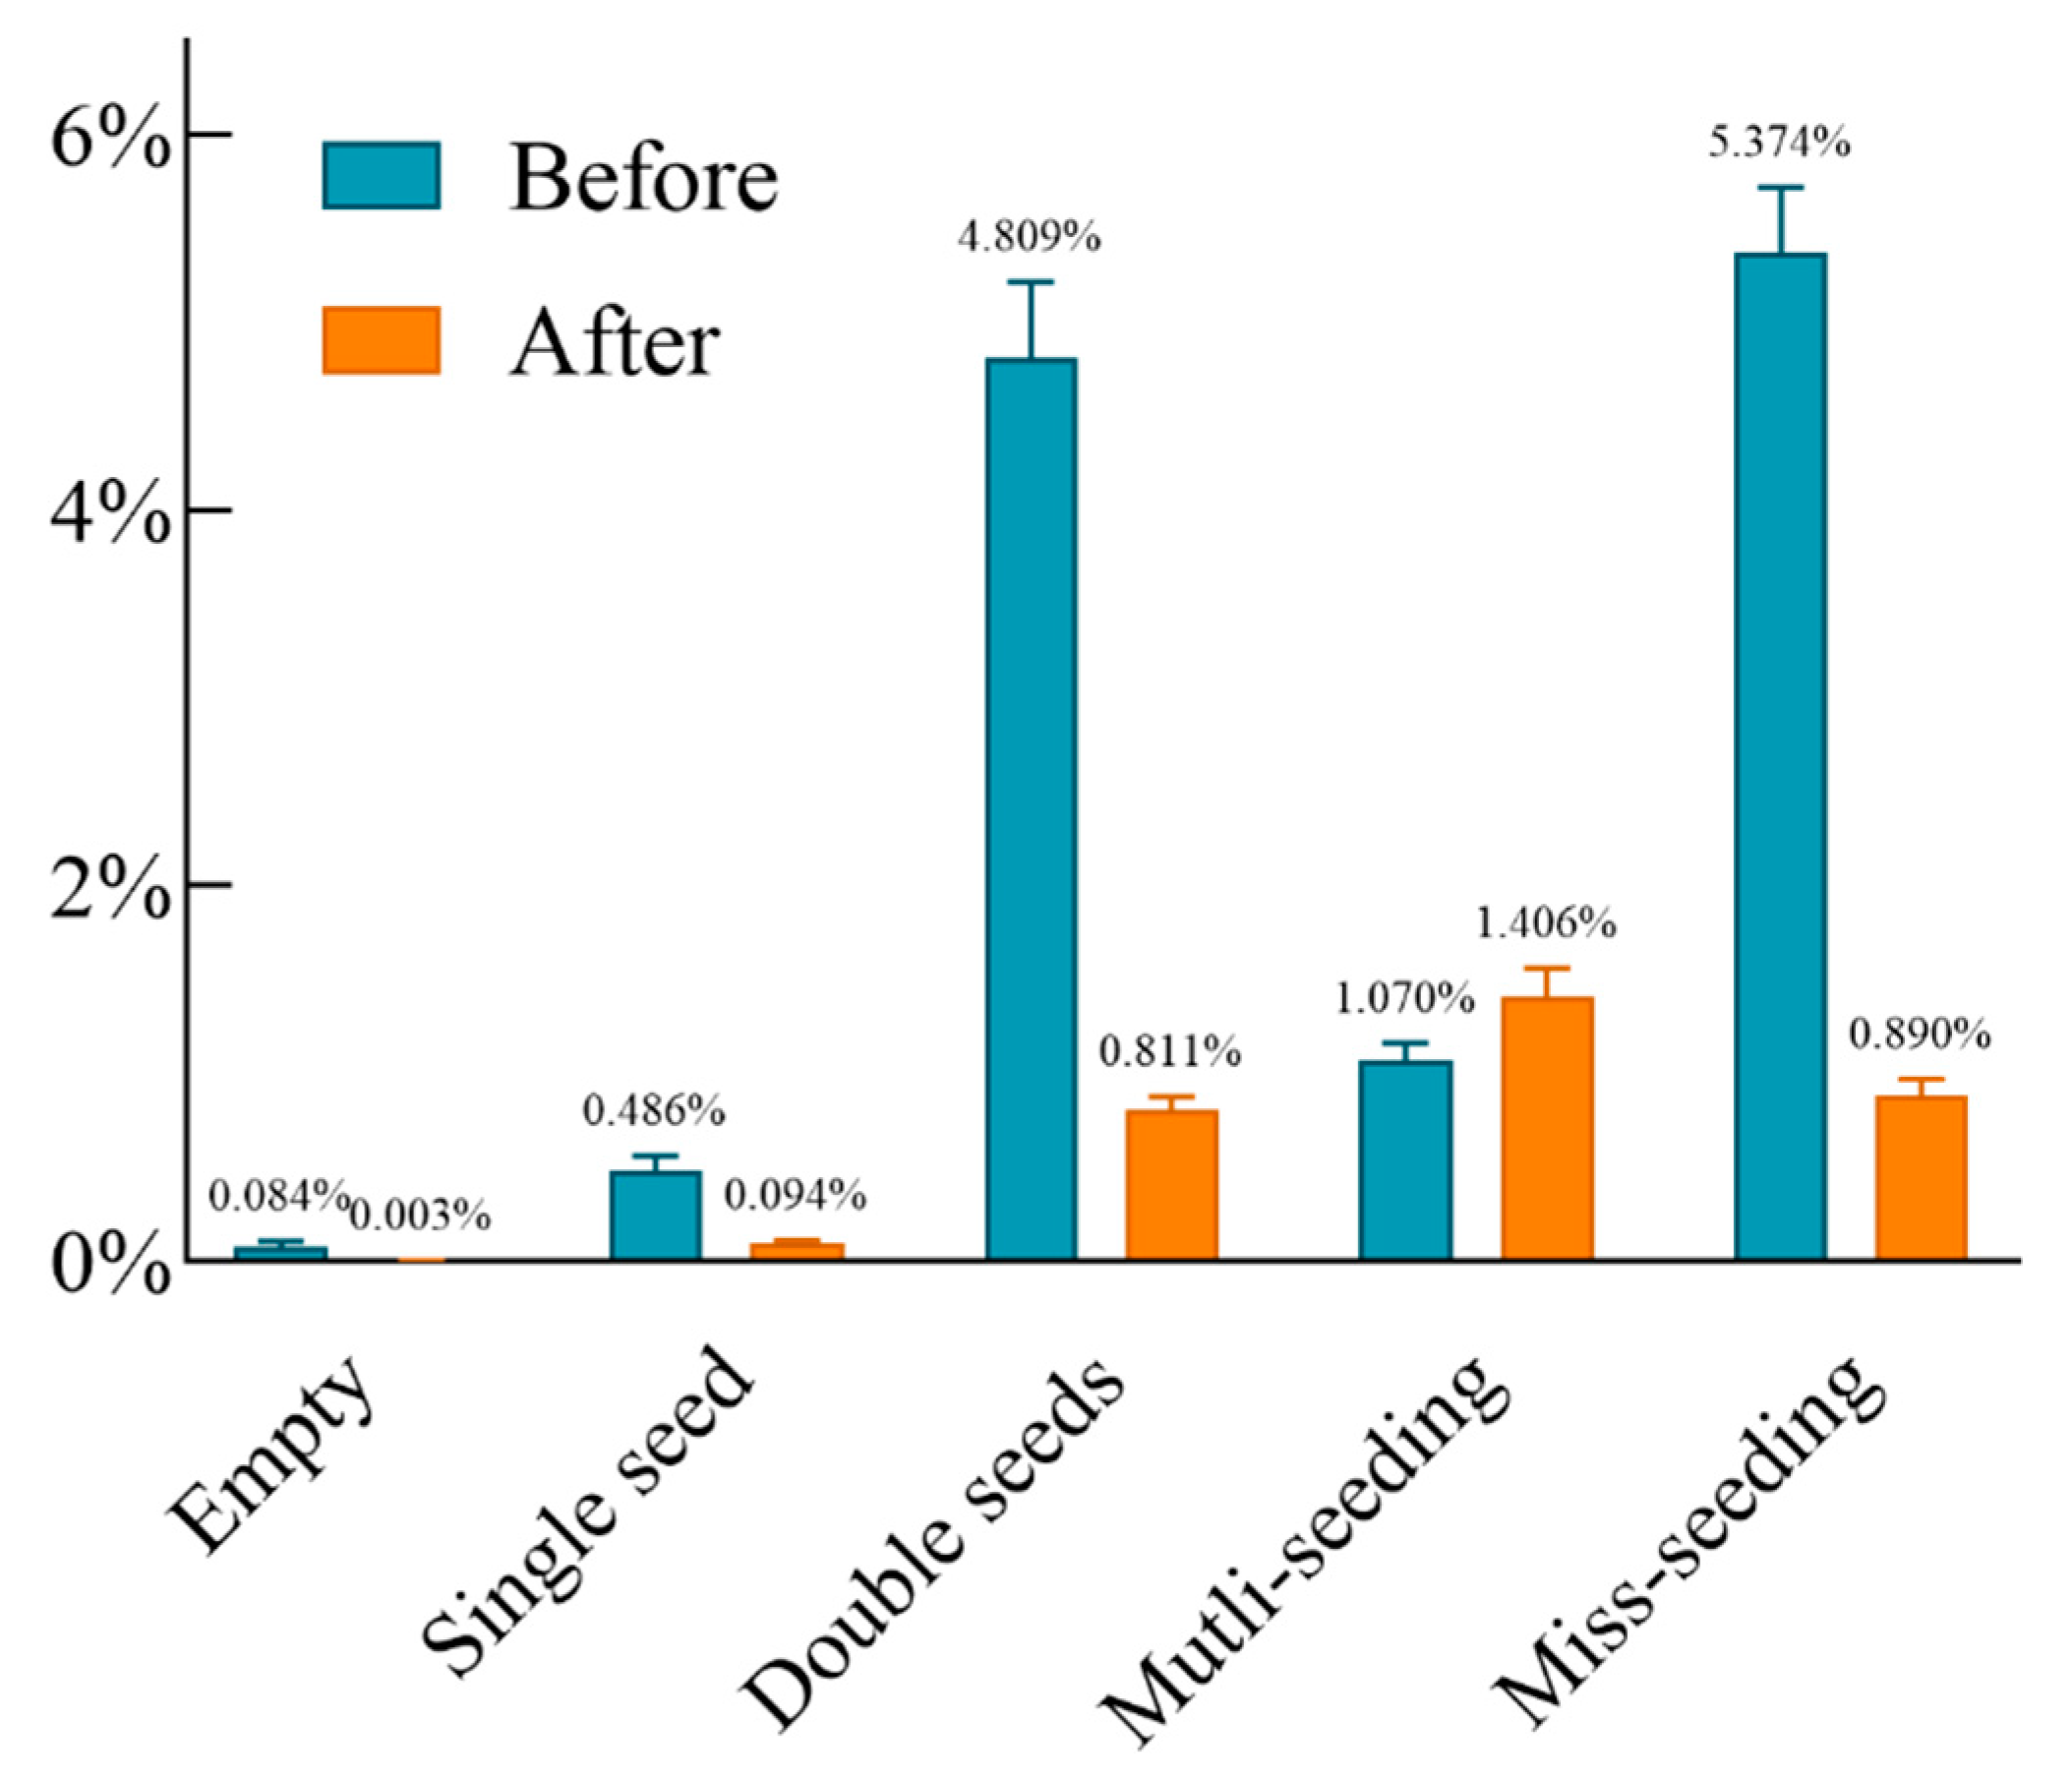
A complementary seeding device based on a tray-type green onion seedling machine was proposed to replace manual complementary seeding. The device includes the identification of miss-seeding holes, the control of seed case movement, and the seed uptake and release from the seed suction nozzle array. The effect of complementary seeding was also studied experimentally by the seedling process in the actual state. The results revealed that the complementary seeding device reduced the miss-seeding tray holes rate from 5.374% to 0.890%, which can fully satisfy the seedling requirements of onion (Figure S1).
The seeding precision of green onion seeds and the utilization rate of trays were considerably improved using the seed replenishment device proposed in this study. Furthermore, a technical guarantee was achieved for green onion factory seedlings.

Supplementary Materials

The following supporting information can be downloaded at: https://www.mdpi.com/article/10.3390/agronomy12092180/s1, Figure S1: Code.

Author Contributions

All authors contributed to the research. Conceptualization, J.G. and Y.L.; methodology, J.G. and Y.L.; software, J.G.; validation, J.G.; formal analysis, J.G. and Y.L.; investigation, J.G., K.Z., Y.W. and J.H.; resources, J.H. and Y.L.; data curation, J.G.; writing—original draft preparation, J.G. and J.H.; writing—review and editing, J.H., K.Z. and Y.W.; visualization, J.G.; supervision, J.H.; project administration, J.H.; funding acquisition, J.H. All authors have read and agreed to the published version of the manuscript.

Funding

This research was funded by the Shandong Province Key Research and Development Program (Major Science and Technology Innovation Project), grant number 2022CXGC010611, and the China Agriculture Research System of MOF and MARA, grant numbers: CARS-24-D-01.

Data Availability Statement

Not applicable.

Acknowledgments

The authors wish to express sincere gratitude to Shandong Hualong Agricultural Equipment Co., Ltd. for allowing the TGOSM to be fitted with the proposed complementary seeding device and their site support.

Conflicts of Interest

The authors declare no conflict of interest.

References

  1. Kayat, F.; Mohammed, A.; Ibrahim, A.M. Spring Onion (Allium fistulosum L.) Breeding Strategies. In Advances in Plant Breeding Strategies: Vegetable Crops; Al-Khayri, J.M., Jain, S.M., Johnson, D.V., Eds.; Springer: Cham, Switzerland, 2021; pp. 135–182. [Google Scholar] [CrossRef]
  2. Padula, G.; Xia, X.; Hołubowicz, R. Welsh Onion (Allium fistulosum L.) Seed Physiology, Breeding, Production and Trade. Plants 2022, 11, 343. [Google Scholar] [CrossRef] [PubMed]
  3. Dai, J.; Dong, H. Intensive Cotton Farming Technologies in China: Achievements, Challenges and Countermeasures. Field Crops Res. 2014, 155, 99–110. [Google Scholar] [CrossRef]
  4. Shao, W.; Li, T.; Wu, Y.; Chen, Y.; Li, G.; Hou, J. Design and test of precision seed metering device for the seedling raising machine of chinese onion. J. Agric. Mech. Res. 2022, 44, 119–127, (In Chinese with English abstract). [Google Scholar] [CrossRef]
  5. Altuntaş, Y.; Cömert, Z.; Kocamaz, A.F. Identification of Haploid and Diploid Maize Seeds Using Convolutional Neural Networks and a Transfer Learning Approach. Comput. Electron. Agric. 2019, 163, 104874. [Google Scholar] [CrossRef]
  6. Zhuang, X.; Bi, M.; Guo, J.; Wu, S.; Zhang, T. Development of an Early Warning Algorithm to Detect Sick Broilers. Comput. Electron. Agric. 2018, 144, 102–113. [Google Scholar] [CrossRef]
  7. Benelli, A.; Cevoli, C.; Fabbri, A.; Ragni, L. Ripeness Evaluation of Kiwifruit by Hyperspectral Imaging. Biosyst. Eng. 2021. [Google Scholar] [CrossRef]
  8. Gai, R.; Chen, N.; Yuan, H. A Detection Algorithm for Cherry Fruits Based on the Improved YOLO-v4 Model. Neural Comput. Appl. 2021. [Google Scholar] [CrossRef]
  9. Kasinathan, T.; Singaraju, D.; Uyyala, S.R. Insect Classification and Detection in Field Crops Using Modern Machine Learning Techniques. Inf. Process. Agric. 2021, 8, 446–457. [Google Scholar] [CrossRef]
  10. Sun, K.; Wang, X.; Liu, S.; Liu, C. Apple, Peach, and Pear Flower Detection Using Semantic Segmentation Network and Shape Constraint Level Set. Comput. Electron. Agric. 2021, 185, 106150. [Google Scholar] [CrossRef]
  11. Fang, L.; Wu, Y.; Li, Y.; Guo, H.; Zhang, H.; Wang, X.; Xi, R.; Hou, J. Ginger Seeding Detection and Shoot Orientation Discrimination Using an Improved YOLOv4-LITE Network. Agronomy 2021, 11, 2328. [Google Scholar] [CrossRef]
  12. Kim, W.-S.; Lee, D.-H.; Kim, Y.-J. Machine Vision-Based Automatic Disease Symptom Detection of Onion Downy Mildew. Comput. Electron. Agric. 2020, 168, 105099. [Google Scholar] [CrossRef]
  13. Sun, J.; Zhang, Y.; Zhu, X.; Zhang, Y. Deep Learning Optimization Method for Counting Overlapping Rice Seeds. J. Food Process Eng. 2021, 44. [Google Scholar] [CrossRef]
  14. Taheri-Garavand, A.; Nasiri, A.; Fanourakis, D.; Fatahi, S.; Omid, M.; Nikoloudakis, N. Automated In Situ Seed Variety Identification via Deep Learning: A Case Study in Chickpea. Plants 2021, 10, 1406. [Google Scholar] [CrossRef] [PubMed]
  15. Wang, Y.; Xiao, X.; Liang, X.; Wang, J.; Wu, C.; Chen, J. Plug hole positioning and seedling shortage detecting system on automatic seedling supplementing test-bed for vegetable plug seedlings. Trans. Chin. Soc. Agric. Eng. 2018, 34, 35–41, (In Chinese with English abstract). [Google Scholar] [CrossRef]
  16. Dong, W.; Ma, X.; Li, H.; Tan, S.; Guo, L. Detection of Performance of Hybrid Rice Pot-Tray Sowing Utilizing Machine Vision and Machine Learning Approach. Sensors 2019, 19, 5332. [Google Scholar] [CrossRef] [PubMed]
  17. Li, H.; Li, Z.; Dong, W.; Cao, X.; Wen, Z.; Xiao, R.; Wei, Y.; Zeng, H.; Ma, X. An Automatic Approach for Detecting Seedlings per Hill of Machine-Transplanted Hybrid Rice Utilizing Machine Vision. Comput. Electron. Agric. 2021, 185, 106178. [Google Scholar] [CrossRef]
  18. Wang, G.; Liu, W.; Wang, A.; Bai, K.; Zhou, H. Design and experiment on intelligent reseeding devices for rice tray nursing seedling based on machine vision. Trans. Chin. Soc. Agric. Eng. 2018, 34, 35–42, (In Chinese with English abstract). [Google Scholar] [CrossRef]
  19. Bai, J.; Hao, F.; Cheng, G.; Li, C. Machine Vision-Based Supplemental Seeding Device for Plug Seedling of Sweet Corn. Comput. Electron. Agric. 2021, 188, 106345. [Google Scholar] [CrossRef]
  20. Wen, Y.; Zhang, L.; Huang, X.; Yuan, T.; Zhang, J.; Tan, Y.; Feng, Z. Design of and Experiment with Seedling Selection System for Automatic Transplanter for Vegetable Plug Seedlings. Agronomy 2021, 11, 2031. [Google Scholar] [CrossRef]
  21. Asadi, M.; Jabraeil Jamali, M.A.; Parsa, S.; Majidnezhad, V. Detecting Botnet by Using Particle Swarm Optimization Algorithm Based on Voting System. Future Gener. Comput. Syst. 2020, 107, 95–111. [Google Scholar] [CrossRef]
  22. Atallah, R.; Al-Mousa, A. Heart Disease Detection Using Machine Learning Majority Voting Ensemble Method. In Proceedings of the 2019 2nd International Conference on New Trends in Computing Sciences (ICTCS), Amman, Jordan, 9–11 October 2019; pp. 1–6. [Google Scholar]
  23. Gregoretti, F.; Cortesi, A.; Oliva, G.; Bodega, B.; Antonelli, L. An Algorithm for the Analysis of the 3D Spatial Organization of the Genome. Capturing Chromosome Conform. 2021, 299–320. [Google Scholar] [CrossRef]
  24. Schwegmann, C.P.; Kleynhans, W.; Salmon, B.P.; Mdakane, L. Ship Detection in Sentinel-1 Imagery Using the H-Dome Transformation. In Proceedings of the 2015 IEEE International Geoscience and Remote Sensing Symposium (IGARSS), Milan, Italy, 26–31 July 2015; pp. 3711–3714. [Google Scholar]
  25. Vincent, L. Morphological Grayscale Reconstruction in Image Analysis: Applications and Efficient Algorithms. IEEE Trans. Image Process. 1993, 2, 176–201. [Google Scholar] [CrossRef] [PubMed] [Green Version]
Figure 1. Tray-type green onion seedling machine.
Agronomy 12 02180 g001
Figure 2. Hardware system.
Agronomy 12 02180 g002
Figure 3. Pneumatic complementary seeding device. The pneumatic complementary seeding device hardware system consists of the following: 1. industrial camera, 2. light panel, 3. limiters, 4. tray, 5. photoelectric sensors a–d, 6. pneumatic cylinder, 7. liftable sliding seed case, 8. seed suction nozzle array, and 9. air source control device.
Agronomy 12 02180 g003
Figure 4. Air source control device. (a) Three-dimensional (3D) diagram. (b) Object diagram.
Agronomy 12 02180 g004
Figure 5. Seed suction nozzle array; (a) 3D diagram; (b) Object diagram.
Agronomy 12 02180 g005
Figure 6. Liftable sliding seed case. (a) 3D diagram. (b) Object diagram. (c) Cross-sectional view of the seed case. Liftable sliding seed case structure composition: ① front convex block, ② main bracket, ③ sub-bracket, ④ sliding stand, ⑤ connecting rod, ⑥ cylinder, ⑦ case body, ⑧ seed storage hole.
Agronomy 12 02180 g006aAgronomy 12 02180 g006b
Figure 7. Software system flowchart.
Agronomy 12 02180 g007
Figure 8. Tray positioning baffle. (a) 3D diagram. (b) Object diagram.
Agronomy 12 02180 g008
Figure 9. Schematic of the tray segment.
Agronomy 12 02180 g009
Figure 10. Image processing flowchart. Note: The green arrows in Figure 10 represent the simultaneous processing of the same image in three color spaces. The bright green circle in the output array represents the position of the detected miss-seeding holes.
Agronomy 12 02180 g010
Figure 11. Image processing flow. (a) RGB space, HSL space, HSV space. Color thresholding and image grayscale; (b) RGB space, HSL space, HSV space. Morphological processing and H-Dome algorithm; (c) RGB space, HSL space, HSV space. Image region segmentation; (d) RGB space, HSL space, HSV space. Statistical data analysis; (e) RGB space, HSL space, HSV space. Results of data analysis. Note: The lower left corner of the RGB space in Figure 11e is incorrectly identified as miss-seeding tray holes.
Agronomy 12 02180 g011
Figure 12. Schematic of the H-Dome.
Agronomy 12 02180 g012
Figure 13. Schematic of the color space weight distribution.
Agronomy 12 02180 g013
Figure 14. Image processing results.
Agronomy 12 02180 g014
Figure 15. Complementary seeding process.
Agronomy 12 02180 g015
Figure 16. Positioning of the positioned seed suction nozzle.
Agronomy 12 02180 g016
Figure 17. Working process of the liftable sliding seed case. (a) Horizontal movement process. (b) Front convex block touches the limiter. (c) Vertical movement process.
Agronomy 12 02180 g017
Figure 18. Schematic of the vacuum-generated seed suction nozzle. (a) VGSN structure view; (b) VGSN cross-section diagram. a. Diameter of the seed suction port, b. Suction port angle, c. Diameter of the spout. 1. air inlet (air pipe interface), 2. contraction section, 3. spout, 4. throat, 5. exhaust airway, 6. exhaust port, 7. vacuum airway, 8. seed suction port, 9. vacuum chamber.
Agronomy 12 02180 g018aAgronomy 12 02180 g018b
Figure 19. Seed suction nozzle grid and internal fluid domain diagrams. (a) Internal grid diagram. (b) Internal fluid domain diagram.
Agronomy 12 02180 g019
Figure 20. Numerical simulation of VGSN. (a) Velocity cloud map. (b) Pressure cloud map.
Agronomy 12 02180 g020
Figure 21. Test nozzle experiment. (a) Seed suction test stand. (b) Seed suction port of each diameter.
Agronomy 12 02180 g021
Figure 22. Response surfaces of test factors influence on success rate of seed sucking. (a) Y1(X1, X2, 0, 0); (b) Y1(X1, 0, X3, 0); (c) Y1(X1, 0, 0, X4); (d) Y1(0, X2, X3, 0); (e) Y1(0, X2, 0, X4); (f) Y1(0, 0, X3, X4).
Agronomy 12 02180 g022
Figure 23. Response surfaces of test factors influence on repetition rate of seed sucking. (a) Y2(X1, X2, 0, 0); (b) Y2(X1, 0, X3, 0); (c) Y2(X1, 0, 0, X4); (d) Y2(0, X2, X3, 0); (e) Y2(0, X2, 0, X4); (f) Y2(0, 0, X3, X4).
Agronomy 12 02180 g023aAgronomy 12 02180 g023b
Figure 24. Experimental materials: (a) Coated seeds; (b) Tray; (c) Soil matrix.
Agronomy 12 02180 g024
Figure 25. Some of the trays used in the experiment.
Agronomy 12 02180 g025
Figure 26. Test results of image identification methods. (a) Precision. (b) Recall. (c) F1 score.
Agronomy 12 02180 g026
Figure 27. Proposed complementary seeding unit.
Agronomy 12 02180 g027
Figure 28. Comparison of the effect before and after complementary seeding.
Agronomy 12 02180 g028
Table 1. Test scheme and response value results.
No.X1X2X3X4Success Rate Y1/%Repetition Rate Y2/%
1−1−10095.20.2
21−10096.60.6
3−110096.60.8
4110097.61.1
500−1−196.10.8
6001−199.61.5
700-1196.61.0
8001199.31.8
9−100−195.70.5
10100−197.91.1
11−100196.60.6
12100198.41.1
130−1−1093.90.8
1401−1095.91.1
150−11097.71.6
16011099.12.1
17−10−1095.40.7
1810−1096.40.9
19−101099.01.5
20101099.51.8
210−10−195.60.5
22010−197.31.2
230−10196.50.6
24010197.81.2
25000098.10.7
26000098.30.6
27000099.20.8
28000098.20.7
29000098.90.9
Table 2. Variance analysis of regression Equation.
Source of VarianceSuccess Rate Y1Repetition Rate Y2
Sum of SquaresDegree of FreedomMean Squarep-ValueSum of SquaresDegree of FreedomMean Squarep-Value
Model60.09144.29<0.0001 **5.45140.3896<0.0001 **
X15.2015.200.0001 **0.440810.44080.0002 **
X26.4516.45<0.0001 **0.853310.8533<0.0001 **
X333.00133.00<0.0001 **2.0812.08<0.0001 **
X40.750010.75000.06610.040810.04080.1485
X1X20.040010.04000.65240.002510.00250.7108
X1X30.062510.06250.57420.002510.00250.7108
X1X40.040010.04000.65240.002510.00250.7108
X2X30.090010.09000.50120.010010.01000.4618
X2X40.040010.04000.65240.002510.00250.7108
X3X40.160010.16000.37280.002510.00250.7108
X 2 1 3.6813.680.0006 **0.018510.01850.3215
X 2 2 12.55112.55<0.0001 **0.022710.02270.2733
X 3 2 0.596810.59680.09711.8511.85<0.0001 **
X 4 2 1.2611.260.0216 *0.033310.03330.1889
Residual2.64140.1888 0.2445140.0175
Lack of fit1.71100.17110.68590.1925100.01930.3758
Pure error0.932040.2330 0.052040.0130
Correct total62.7328 5.7028
Note: p < 0.01 (highly significant, **); p < 0.05 (significant, *).
Table 3. Seeding effect of the TGOSM.
CategoryEmpty Tray HoleSingle Seed
Tray Hole
Double Seeds
Tray Hole
Triple Seeds
Tray Hole
Repeat Seeding Tray Hole
Total95354010,281117
Percentage0.082%0.482%4.909%93.464%1.064%
Table 4. Results of validation experiments.
ResultsSuccess Rate/%Repetition Rate/%
Test results98.40.7
Predicted value98.790.67
Relative error0.404.29
Table 5. Statistical results.
Image Processing MethodTPFNFPTN
HSL-Based561382410,377
RGB-Based543494110,367
HSV-Based554312710,388
Decision by majority58318910,389
Table 6. Definition of TP, TN, FP, and FN.
Recognizable Miss-Seeding Tray HoleRecognizable Full-Seeding Tray Hole
Actual miss-seeding tray holeTP (True positive)FN (False negative)
Actual full-seeding tray holeFP (False positive)TN (False negative)
where: TP indicates correctly identified miss-seeding tray holes, TN indicates correctly identified full-seeding tray holes, FP indicates incorrectly identified miss-seeding tray holes, FN indicates incorrectly identified full-seeding tray holes.
Publisher’s Note: MDPI stays neutral with regard to jurisdictional claims in published maps and institutional affiliations.

