Article

Effect of a Biostimulant Based on Polyphenols and Glycine Betaine on Tomato Plants’ Responses to Salt Stress

by
Javier Zuzunaga-Rosas
1,2,
Sara González-Orenga
3,4,
Ana Maria Tofei
4,5,
Monica Boscaiu
3,*,
Héctor Moreno-Ramón
1,
Sara Ibáñez-Asensio
1 and
Oscar Vicente
4
1
Department of Plant Production, Universitat Politècnica de València, Camino de Vera s/n, 46022 Valencia, Spain
2
Innovak Global S. A. de C. V., Blvd. Lombardo Toledano 6615, La Concordia, Chihuahua 31375, Mexico
3
Mediterranean Agroforestry Institute (IAM), Universitat Politècnica de València, Camino de Vera s/n, 46022 Valencia, Spain
4
Institute for the Conservation and Improvement of Valencian Agrodiversity (COMAV), Universitat Politècnica de València, Camino de Vera s/n, 46022 Valencia, Spain
5
Faculty of Agriculture, The Banat University of Agricultural Sciences and Veterinary Medicine “King Mihai I of Romania” Timisoara, 119 Aradului Avenue, 3000645 Timisoara Judet Timis, Romania
*
Author to whom correspondence should be addressed.
Agronomy 2022, 12(9), 2142; https://doi.org/10.3390/agronomy12092142
Submission received: 11 August 2022 / Revised: 31 August 2022 / Accepted: 7 September 2022 / Published: 9 September 2022

Abstract

:
Climate change accentuates abiotic stress conditions putting at risk several commercial cultivars particularly vulnerable to salinity in the early stages of development, which makes adopting new technologies in tune with the environment necessary to mitigate its impact. In this study, we tested the possible effects of a commercial biostimulant (BALOX®) on enhancing salt stress tolerance in salt-treated tomato plants, analysing plant growth and several stress biochemical markers: photosynthetic pigments, ion contents in roots and leaves, leaf concentrations of different osmolytes, oxidative stress markers, non-enzymatic antioxidants, and the specific activities of major antioxidant enzymes. The experimental design consisted of three soil salinity levels (non-saline, saline, and very saline), two biostimulant doses (0.4 mL and 0.8 mL of the BALOX® stock per litre of irrigation water), and the non-treated control (without biostimulant), evaluated at 30 and 60 days of treatment. The biostimulant favoured plant growth, especially at the root level and in saline soils. In addition, it helped reduce Na+ and Cl uptake by the roots and seemed to stimulate, to some extent, K+ and Ca2+ transport to the aerial part of the plant. The BALOX® application significantly reduced the level of stress affecting the plants in saline soils, as shown by the decrease in the contents of proline and oxidative stress biomarkers and the activity of salt-induced antioxidant enzymes. Some of the biostimulant effects were also observed under low salinity conditions; therefore, in addition to enhancing salt stress responses, BALOX® appears to stimulate the growth of tomato plants through a general improvement of photosynthesis and primary metabolism.

1. Introduction

Environmental abiotic stresses, stimulated by accelerated climate change, have become the main threat to plant growth, development, and survival. Factors, such as drought, extreme temperatures, and salinity, hinder many crops’ growth, biomass accumulation, and yield [1]. In specific cases, anthropogenic activities, such as irrigation with low-quality water, cause cropland salinisation due to an excessive accumulation of soluble salts in groundwater and soils [2].
Salinity affects more than 109 ha of land worldwide, including about 77 × 106 ha of agricultural land, of which up to 1.5 million are abandoned yearly because of salinisation [3,4]. It is estimated that 50% of all arable lands will be significantly affected by salinity by 2050 [5]. Consequently, the accumulation of soluble salts in the rhizosphere is one of the main reasons for low crop productivity [2]. Furthermore, plant physiology is very susceptible to soil salinity, which negatively affects seed germination, vegetative growth, reproductive development, and crop yield [6].
Salinity negatively affects plant growth and yield through three main mechanisms: generating osmotic stress, toxicity of Na+ and Cl ions, and inducing oxidative stress as a secondary effect [7]. Osmotic stress, caused by high concentrations of salts in the soil and/or irrigation water, produces an imbalance of the water potential at the root surface, limiting water absorption, which causes cellular dehydration in the plants [8]. In addition to its osmotic component, salinity’s most acute deleterious effects are due to the accumulation of toxic sodium and chloride ions in plant tissues [9]. These negative effects include, amongst others, a reduction of the availability of mineral nutrients by competition during absorption, translocation or distribution within the plant, inhibition of photosynthesis by degradation of photosynthetic pigments, or damage of cell membranes and organelles, all contributing to salt-induced growth inhibition [10,11]. In addition, salt stress increases the production of reactive oxygen species (ROS), causing oxidative stress [12], which can be estimated by the accumulation of several biochemical markers, such as malondialdehyde (MDA) or hydrogen peroxide (H2O2) [13,14]. Oxidative stress negatively affects vital processes, such as transpiration, chlorophyll biosynthesis, and water and nutrient uptake dynamics [15,16,17,18]. Under high salinity and other abiotic stress conditions, plants activate a series of conserved responses, including the control of ion transport and ion homeostasis [19,20], synthesis and accumulation of compatible solutes for cellular osmotic adjustment [21,22], and ROS detoxification through the activation of antioxidant enzymes and the synthesis of antioxidant compounds [23,24].
Developing new crop varieties with enhanced abiotic stress tolerance through both traditional breeding and genetic engineering or genome editing appears to be the most sensible approach to address the challenge of global food security in the present climate change scenario [25]. However, other strategies can contribute to improving the tolerance of our present crop cultivars and mitigate climate change effects, for example, by using biostimulants. Agricultural biostimulants are a diverse collection of substances and micro-organisms that can be applied to plants to improve nutritional efficiency, tolerance to abiotic stress, and crop quality traits, regardless of their nutrient content [26,27]. They are increasingly integrated into production systems to modify plant physiological processes and optimise productivity, thus reducing crop losses [28]. Biostimulants are not nutrients themselves but facilitate nutrient uptake or contribute beneficially to growth promotion or stress resistance [29]. The main advantages of biostimulants are the absence of negative or detrimental impact on plants, people, animals, or the environment; increasing the biodiversity of beneficial microorganisms; and improving soil properties [30]. Under high salinity conditions, biostimulants have been suggested to act on plants directly, improving seed germination and plant growth and enhancing salt tolerance, and also indirectly, improving physical, chemical, and biological soil properties [31].
Tomato (Solanum lycopersicum) is one of the horticultural crops of greatest importance to the economy and consumption of humankind. The leading producers are countries in subtropical and temperate zones, such as China, India, Turkey, the United States, Egypt, Iran, Italy, Spain, Mexico, Brazil, Indonesia, Nigeria, Algeria, and Tunisia. According to FAO [32], approximately 182 million tonnes of tomatoes were produced worldwide in 2017, grown on 4.8 × 10⁶ ha. Spain is the second European producer, with about 5 million tonnes of tomato, grown on 61,000 ha [32].
The present study was designed to evaluate the possible effects of a commercial biostimulant (BALOX®) on tomato plants grown under salt stress conditions. BALOX® contains polyphenols and glycine betaine as bioactive ingredients, but its mechanism of action is unknown. Tomato plants in the vegetative developmental stage were grown in the greenhouse, in substrates of different salinities, and applying the biostimulant at different doses for 30 and 60 days. After the treatments, plants were harvested, and the effects of salinity, the biostimulant, and their combination on plant growth were assessed by measuring several growth parameters. In addition, different biochemical stress markers were also determined to establish how the biostimulant can affect the plants’ responses to salinity. The performed measurements included the levels of photosynthetic pigments (chlorophyll a, chlorophyll b, and carotenoids), ion (Na+, K+, Ca2+, and Cl) contents in roots and leaves, and foliar concentrations of common plant osmolytes (proline (Pro), glycine betaine (GB), and total soluble sugars (TSS)). In addition, the degree of salt-induced oxidative stress was estimated by quantifying reliable oxidative stress biomarkers (malondialdehyde (MDA) and hydrogen peroxide (H2O2)). Finally, the activation of antioxidant systems was studied by measuring the leaf levels of representative antioxidant compounds (total phenolic compounds (TPCs) and total flavonoids (TFs)) and the specific activities of major antioxidant enzymes, such as superoxide dismutase (SOD), catalase (CAT), and glutathione reductase (GR). The aim of these experiments was 2-fold: first, to confirm the beneficial effect of the biostimulant on plant growth and second, to gain insights into its mechanisms of action. The work was based on the hypothesis that BALOX® acts primarily by enhancing the natural responses to salt stress of tomato plants, although additional effects could not be excluded a priori.

2. Materials and Methods

2.1. Plant Growth, Stress Treatments, and Biostimulant Application in the Greenhouse

Tomato seeds (Solanum lycopersicum L. var. DIEZMIL97 F1) were purchased from Intersemillas S.A. (Valencia, Spain). Seed germination was carried out in trays containing commercial peat mixed with vermiculite (1:1) in a greenhouse at Universitat Politècnica de València (UPV) (Valencia, Spain). One month after sowing, young plants (with three true leaves) were transferred to individual pots (14 cm diameter) containing 2 kg of soil with different salinities, prepared as described below.
The soil was obtained from the Albufera area, Valencia province; the original material was quaternary alluvial sedimentary, with a clay loam texture, an exchange capacity of 14.94 meq/100 g soil, and 1.02% organic matter. The soil, originally ‘non-saline’ (NS, 2.77 dS/m), was salinised using a 35 mM NaCl solution, until reaching 7.99 dS/m (‘saline’, S) and 12.44 dS/m (‘very saline’, VS). The salinised soils were dried and sieved at 2 mm (Table 1).
The biostimulant used in this study was BALOX®, formulated by Innovak Global, SA de CV (Chihuahua, Mexico). Its main active components are polyphenols at 1.4% (w/w) and glycine betaine at 3.0% (w/w). Two doses of the biostimulant were applied to the plants: 0.4 mL and 0.8 mL of the BALOX® stock per litre of irrigation water, roughly equivalent to the range recommended by the manufacturer for treatments in the field, 2 L per ha (D2) and 4 L per ha (D4), respectively.
Treatments were initiated when the plants were transplanted into individual pots, on 30 March 2021, one month after sowing the seeds. The plants were grown in the greenhouse, under long-day conditions (14 h light/10 h darkness) provided by natural light supplemented with 315 W, 3100 K Philips lamps (LEC Sun System lighting kit, Growlet, Vigo, Spain). The relative humidity ranged from 50% to 80%, and the temperature ranged from 17 °C to 23 °C; heating and cooling systems were automatically switched on to maintain the temperature within the indicated values throughout the treatments. Temperature and relative humidity were monitored with a HOBO U23 Pro v2 Data Logger (Onset Computer Corporation, Bourne, MA, USA). The experiments were arranged in a multivariate design consisting of three salinity conditions (non-saline: NS, saline: S, and very saline: VS soils), two doses of the biostimulant BALOX® (D2 and D4), and two evaluation periods (30 and 60 days after transplanting). Control plants (D0, without biostimulant) were grown in parallel, maintaining the same experimental design. In general, six plants per treatment were used. Irrigation was carried out twice a week, pouring into each pot 175 mL of tap water (EC = 0.9 dS m−1) (D0) or 175 mL water containing BALOX® at 0.4 mL L−1 (D2) or 0.8 mL L−1 (D4), according to the described dosage. Half of the plants received two biostimulant applications together with irrigation. The first application was made at transplanting and the second 15 days later. All plants of this group were harvested after 30 days, still at the vegetative growth stage. The other half received four biostimulant applications also together with irrigation. The first application was made at the time of transplanting, and the following applications at 15, 30, and 45 days after transplanting. The plants were harvested after 60 days, at the onset of reproductive development.
In all plants, the roots and the aerial part were collected separately. The roots were cleaned with a brush; clean roots, the stems, and the detached leaves of each plant were weighed on a precision balance to register their fresh weight (FW). A fraction of each plant sample was frozen in liquid N2 and stored at −75 °C until further use; the remaining material was weighed (FW), dried at 65 °C for about 72 h until a constant weight was reached, and weighed again to determine the corresponding dry weight (DW). The water content percentage of each sample was then calculated according to the following formula:
WC% = [(FW − DW)/FW] × 100.

2.2. Quantification of Photosynthetic Pigments

The concentrations of chlorophyll a (Chl a), chlorophyll b (Chl b), and total carotenoids (Caros) in leaf tissue of the tomato plants were determined according to a previously published method [33] using spectrophotometric techniques. First, pigments were extracted from fresh, ground plant material (50 mg) with 1 mL of 80% (v/v) ice-cold acetone. The samples were then mixed for 12 h on a shaker in the absence of light, and after centrifugation at 13,300× g for 10 min at 4 °C, the supernatant was collected, and its absorbance was measured at 663, 646, and 470 nm. Chl a, Chl b, and Caro concentrations in the extract were calculated using the equations described in [33], and pigment contents were finally expressed as mg g−1 DW.

2.3. Ion Quantification

Concentrations of mono (Na+, Cl, and K+) and divalent (Ca2+) ions were determined in plant water extracts, separately for roots and leaves [34], from 100 mg of ground dried plant material, mixed in a shaker with 2 mL Milli-Q water for 24 h. Samples were incubated at 95 °C in a water bath for 30 min, cooled on ice, and filtered through a 0.45 μm nylon filter. Na+, K+, and Ca2+ concentrations were quantified with a PFP7 flame photometer (Jenway Inc., Burlington, VT, USA) and Cl with a chlorimeter (Sherwood, model 926, Cambridge, UK).

2.4. Osmolyte Determination

Three common plant osmolytes were analysed in the leaves of tomato plants: proline (Pro), glycine betaine (GB), and total soluble sugars (TSSs). Pro content was determined following the protocol of Bates et al. [35]. Fresh leaf material (50 mg) was extracted in 3% (w/v) aqueous sulphosalicylic acid and subsequently mixed with acid ninhydrin, then incubated for 1 h at 95 °C, cooled on ice, and extracted with two volumes of toluene. Finally, the absorbance of the organic phase was measured with a spectrophotometer at 520 nm, using toluene as a blank. Samples with known Pro concentrations were assayed in parallel to obtain a calibration curve. The concentration of Pro was expressed as µmol g−1 DW.
GB extraction and quantification were performed according to a published procedure [36], with some modifications [37]. First, fresh leaf material (150 mg) was extracted with 1.5 mL of Milli Q water; after shaking for 24 h at 4 °C, the sample was centrifuged at 13,300× g for 10 min. The supernatant was combined with a 2 N H2SO4 solution (1:1) and kept on ice for 60 min. Next, 125 µL of the above sample was mixed with 50 µL of cold KI-I2 solution to induce GB precipitation in the form of golden crystals. All subsequent steps were performed in the dark. The samples were stored for 16 h at 4 °C and centrifuged at 13,300× g for 45 min at 0 °C. After carefully removing the supernatant, the GB crystals were dissolved in 1.4 mL cold 1,2-dichloroethane. The samples were then kept for 2.5 h under cold and dark conditions. Finally, the absorbance was measured at 365 nm. The glycine betaine concentration was calculated from a standard calibration curve, and the GB content was expressed as µmol g−1 DW.
TSSs were extracted and quantified according to the method described by Dubois et al. [38]. Fresh leaf material (50 mg) was ground in liquid N2 and extracted with 2 mL of 80% (v/v) methanol. After mixing in a shaker for 24 h, the samples were centrifuged at 13,300× g for 10 min; then, the supernatants were diluted conveniently with water and mixed with sulphuric acid and phenol (95% and 5%, respectively). After 20 min incubation at room temperature, the absorbance was measured at 490 nm. TSS concentration was expressed in glucose equivalents, used as standard (mg eq. glucose g−1 DW).

2.5. Determination of Oxidative Stress Markers and Non-Enzymatic Antioxidants

Malondialdehyde (MDA) and hydrogen peroxide (H2O2) contents were measured in tomato leaf extracts to evaluate the level of oxidative stress affecting the plants subjected to the different experimental treatments. Total phenolic compound (TPC) and total flavonoid (TF) concentrations were measured as representative non-enzymatic antioxidants.
MDA, TPCs, and TFs were determined in the same 80% (v/v) methanol extracts used for TSS determination. A previously described method [39], with some modifications [40], was used for MDA quantification. Methanol extracts were mixed with 0.5% (w/v) thiobarbituric acid (TBA) prepared in 20% (w/v) trichloroacetic acid (TCA)—or with 20% TCA without TBA for the controls—and then incubated for 20 min at 95 °C, cooled on ice, and centrifuged at 13,300× g for 10 min at 4 °C. The absorbance of the supernatants was measured at 532 nm. The non-specific absorbance at 600 and 400 nm was subtracted, and the MDA concentration was calculated using the equations in [40]. MDA contents were expressed as nmol g−1 DW.
H2O2 content was quantified according to the method described by Loreto and Velikova [41] after extraction from fresh plant material (50 mg) with a 0.1% (w/v) solution of trichloroacetic acid (TCA) in water. The extract was centrifuged, and the supernatant was thoroughly mixed with one volume of 10 mM potassium phosphate buffer (pH 7.0) and two volumes of 1 M KI. The absorbance of the samples was determined at 390 nm. H2O2 concentrations were expressed as μmol g−1 DW.
TPCs were measured by reaction with the Folin–Ciocalteu reagent [42]. Methanol extracts were mixed with the reagent and Na2CO3, and after 90 min incubation in the dark at room temperature, absorbance was recorded at 765 nm. TPC concentrations were expressed as gallic acid (GA) equivalents used as standard (mg eq. GA g−1 DW).
TFs were determined by nitration with NaNO2 of aromatic rings bearing a catechol group, followed by reaction with AlCl3 under alkaline conditions [43]. The absorbance of the sample was measured at 510 nm, and the total flavonoid content in the leaves was expressed in equivalents of the standard catechin (mg eq C. g−1 DW).

2.6. Antioxidant Enzyme Activities

The specific activity of three major antioxidant enzymes, namely superoxide dismutase (SOD), catalase (CAT), and glutathione reductase (GR), was determined at room temperature (25 °C) in crude protein extracts prepared from tomato leaves and stored frozen at −75 °C, as previously described [44]. Protein quantification in the extracts was determined according to Bradford [45], using the commercial Bio-Rad reagent and bovine serum albumin (BSA) as the standard. The specific activities in protein extracts of the selected antioxidant enzymes were determined by spectrophotometric assays and expressed in units per mg protein.
SOD activity in protein extracts was determined spectrophotometrically at 560 nm, measuring the inhibition of nitroblue tetrazolium (NBT) photoreduction in reaction mixtures containing riboflavin as the source of superoxide radicals [46]. One unit of SOD was defined as the amount of enzyme causing 50% inhibition of NBT photoreduction under the assay conditions.
CAT activity was assessed from the consumption of H2O2 added to the extract, following the decrease in absorbance at 240 nm [47]. One unit of CAT was defined as the amount of enzyme that decomposes one mmol H2O2 per minute at 25 °C.
GR activity was quantified as previously described [48] by the decrease in absorbance at 340 nm, due to the oxidation of NADPH during the GR-catalysed reduction of oxidised glutathione (GSSG) to its reduced form (GSH). One unit of GR was defined as the amount of enzyme required to oxidise one mmol of NADPH per minute at 25 °C. The minor modifications introduced to the initially published SOD, CAT, and GR assays have been described previously [44].

2.7. Statistical Analyses

Statistical analysis was performed using a one-way analysis of variance (ANOVA) to evaluate separately biostimulant treatments, soil salinity conditions, and treatment times, with a 95% confidence level. In addition, for all measured traits, the significance of differences among biostimulant doses for each soil salinity level, the soil salinity level for each biostimulant dose, and their interactions were assessed by two-way ANOVAs, independently for each treatment period (30 and 60 days). Post hoc comparisons were then performed using Tukey’s honestly significant difference (HSD) test with the statistical package Stagraphics Centurion, v. XVIII (Statpoint Technologies, Warrenton, VA, USA). The values indicated in figures and tables represent the means and standard errors (SE) of the different parameters. Relationships among the 27 traits measured for each biostimulant dose (D2, D4) and the control (D0) were obtained calculating pairwise Spearman’s rank correlation coefficients and then testing their significance with α = 0.05 [49]. Subsequently, a principal component analysis (PCA) was performed on all data using R 6.3.6 statistical software with the FactoMineR package [50]; the R packages ggplot2 [51] and corrr [52] were used to extract and visualise the results.

3. Results

3.1. Electrical Conductivity of the Substrate

Electrical conductivity in 1:5 (soil: water) extracts (EC1:5) was measured in substrate samples from all pots at the beginning (0 days) and the end of the treatments (30 and 60 days). As expected, this value increased as a function of the degree of soil salinity, showing slight variations among periods (Table 2).

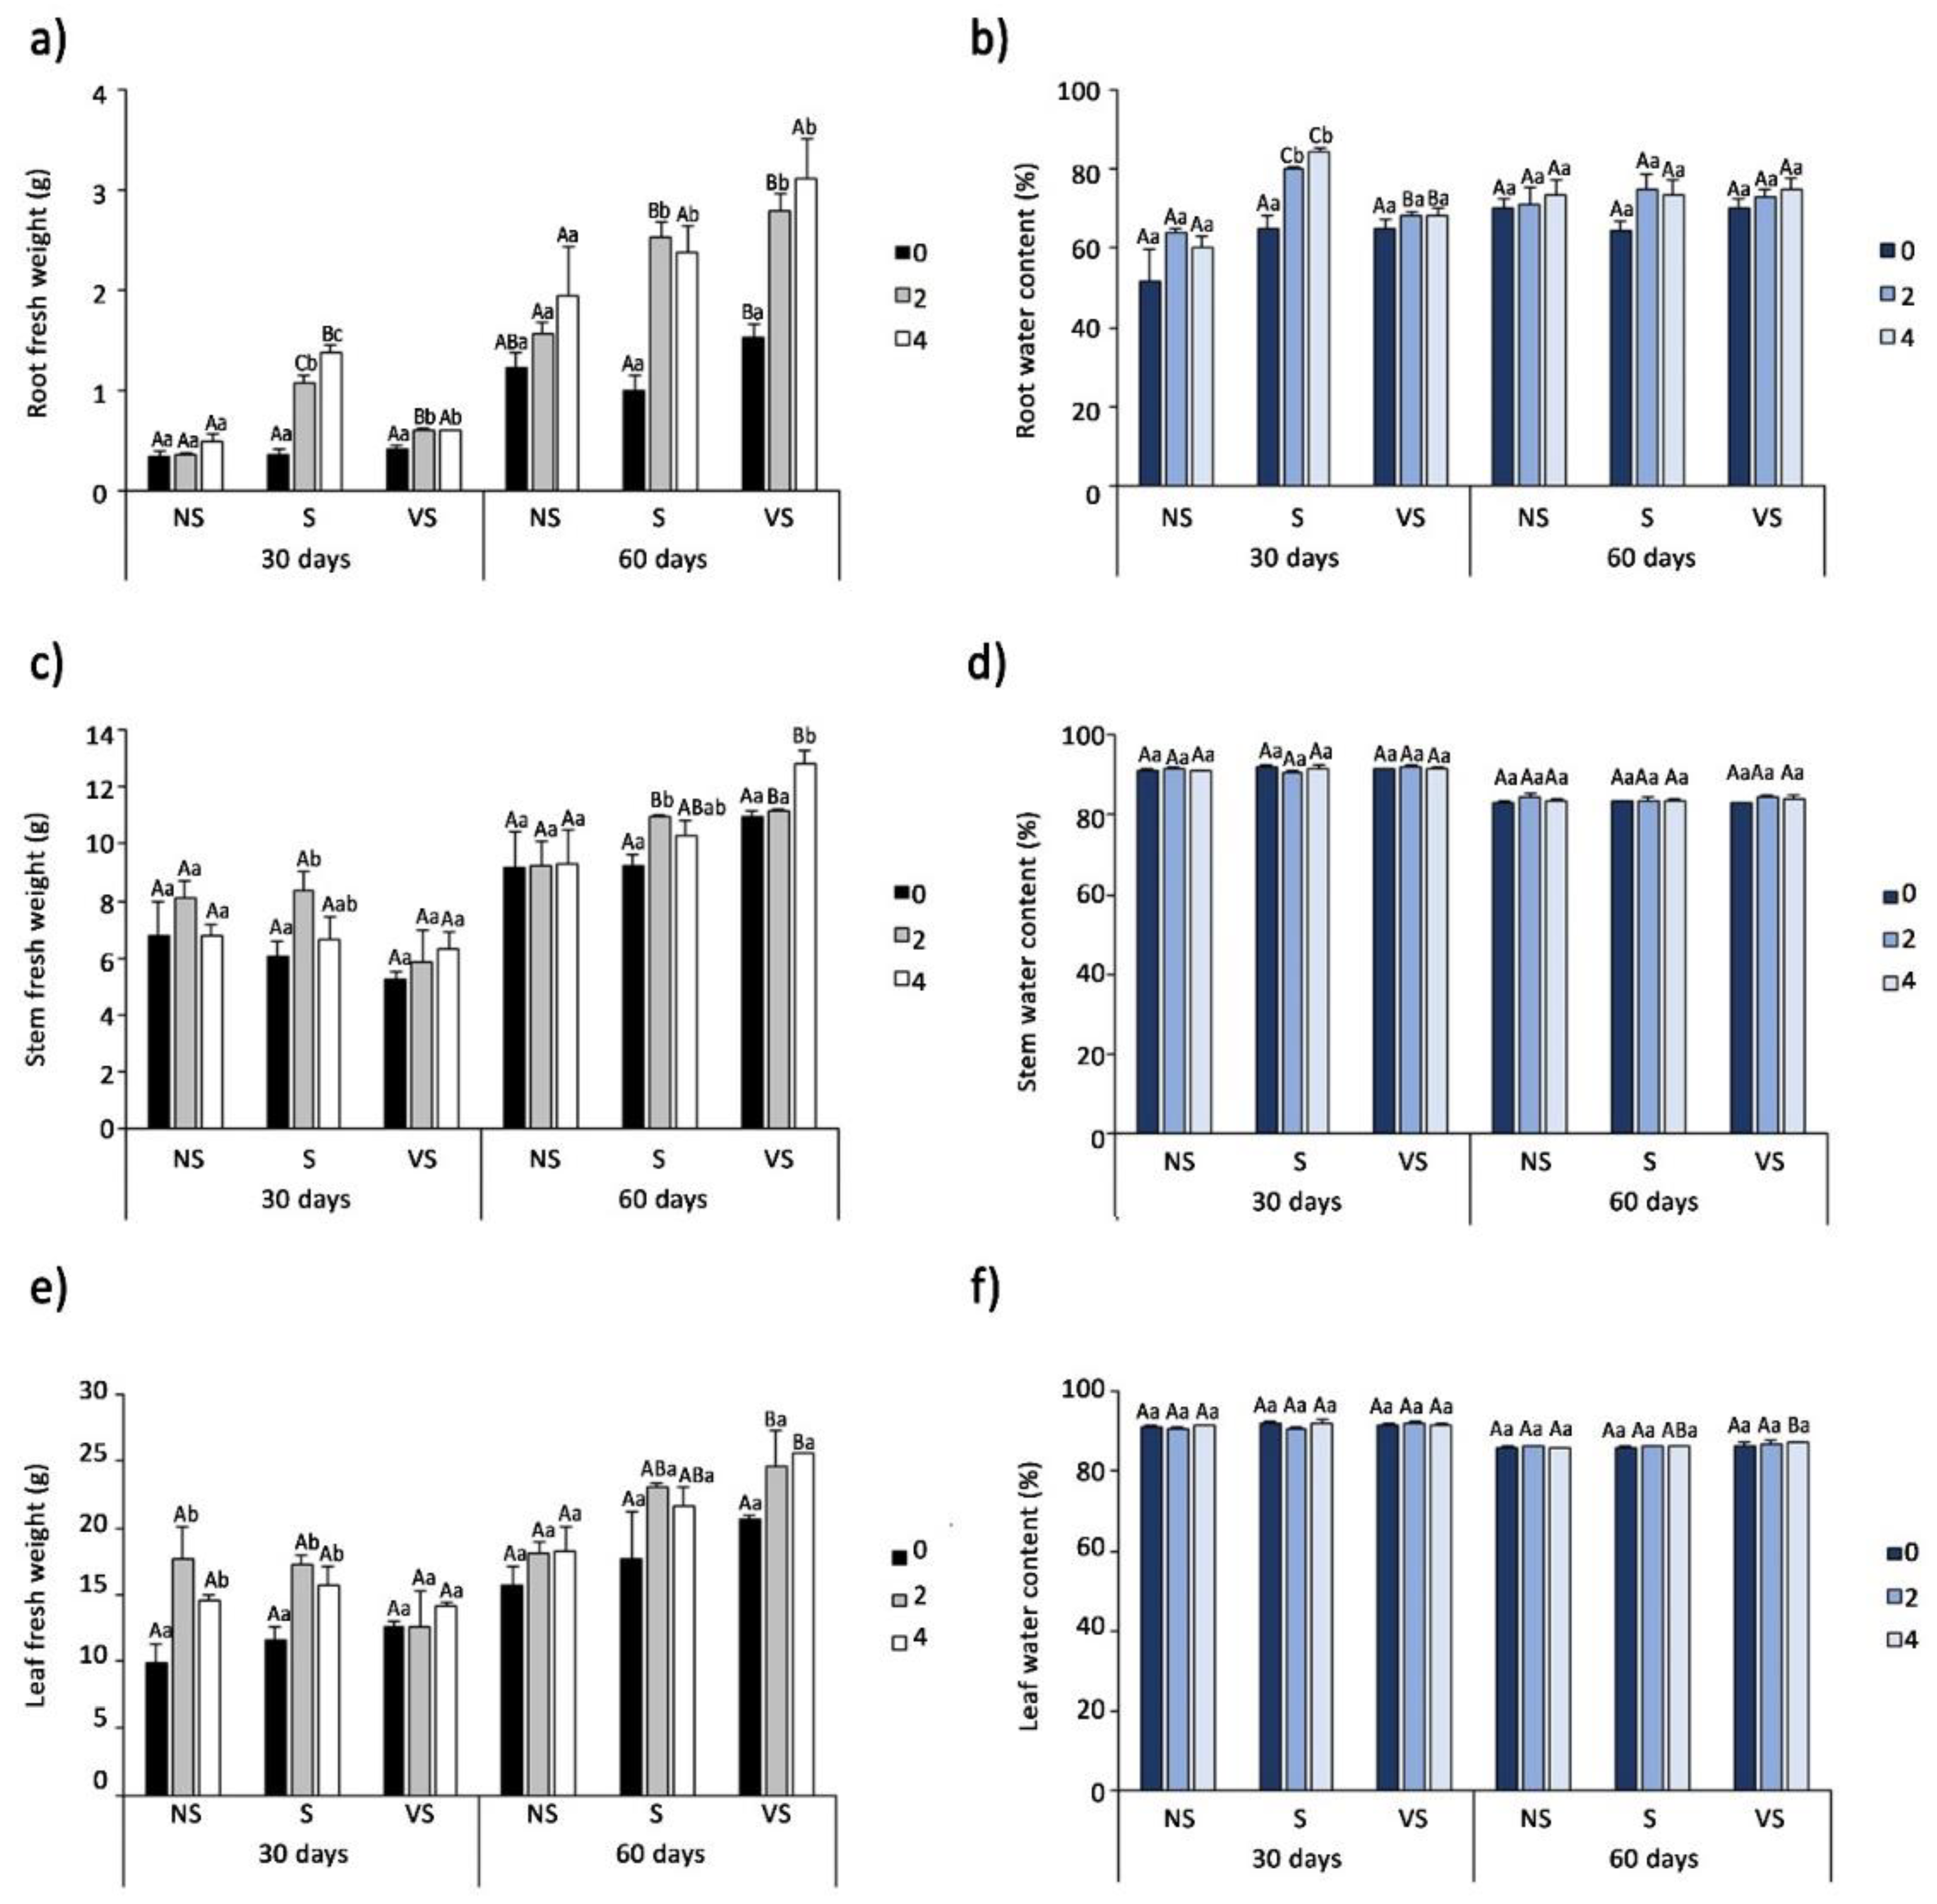
3.2. Effect of Salt Treatments on Plant Growth

The effects of salt stress and biostimulant application on the growth of the tomato plants were assessed by measuring some relevant growth parameters, such as the fresh weight (FW) and water content (WC%) of roots, stems, and leaves (Figure 1).
The soil salinity levels tested in the experiments apparently did not affect plant growth in the absence of the biostimulant, as no significant differences with the control, non-saline soil were observed in the FW of roots, stems, or leaves, neither after 30 days of treatment nor after 60 days; logically, since the plants grew for an additional month, the average values were higher at day 60 than at day 30, especially regarding root FW (Figure 1a,c,e).
A general trend of growth stimulation was observed in plants treated with BALOX®, considering that mean FW values were in most cases higher in the presence than in the absence of the biostimulant (Figure 1a,c,e); however, in non-saline soils, the differences were not statistically significant, except for leaf FW after 30 days of treatment (Figure 1e). The biostimulant’s growth-inducing effect was more clearly observed in the saline soils, particularly in the roots, where FW increased significantly under all tested conditions, saline and very saline soil, 30 and 60 days of treatment, and both BALOX® doses; for example, in saline soil and at the highest dose (D4), the biostimulant increased root FW about 4-fold at 30 days, and 2.4-fold at 60 days, over the corresponding control values (Figure 1a). Figure 2 shows representative photos of the plant roots from all treatments, where a somewhat larger root system can be visually observed in plants treated with the biostimulant, as compared to the controls (D0), in agreement with the data in Figure 1. Regarding stem and leaf FW, the increases were significant only for some combinations of soil salinity, biostimulant dose, and treatment period, namely S/D2/30 and S/D2/60 days and VS/D4/60 days for stem FW (Figure 1c) and S/D2/30 and S/D4/30 days for leaf FW (Figure 1e).
The tomato plants appeared to be highly resistant to stress-induced dehydration under all tested conditions, not showing any significant reduction in the WC of roots, stems, or leaves by growing them in S or VS soil for 30 or 60 days (Figure 1b,d,f). Biostimulant application, in general, also did not affect the hydration level, except for a significant increase in root WC of plants cultivated in saline soil for 30 days (Figure 1b).

3.3. Photosynthetic Pigments Contents

An assessment of the effects of biostimulant treatments on photosynthesis pigment concentrations under different soil salinity conditions provided a general picture roughly similar to that obtained for growth parameters. Chlorophylls a and b and carotenoid contents did not vary significantly in tomato plants cultivated without biostimulant in non-saline, saline, and very saline soils for 30 or 60 days (Figure 3). On the other hand, the BALOX® application significantly increased the average levels of the three pigments after 30 days of treatment. However, statistically significant differences with the control without biostimulant (D0) were detected only for some treatments, namely BALOX® applied at D2 dose in saline soil for Chl a (1.6-fold higher than the D0 control, Figure 3a) and Caro (1.6-fold higher than the D0 control, Figure 3c) and BALOX® applied at D4 dose in saline soil and for Chl b (2.2-fold higher than the D0 control, Figure 3b).
After 60 days of treatment, when plants were at the onset of reproductive development, the biostimulant effect disappeared; very small, non-significant differences in pigment contents were observed among all treatments (Figure 3).

3.4. Ion Accumulation in Roots and Leaves

Ion (Na+, Cl, K+, and Ca2+) contents were determined in the roots and leaves of all plants at the end of the treatments (Figure 4).
A general trend of increasing Na+ contents in the plants, as salinity conditions increased in soils, was observed in the experiments (Figure 4a,b). In the absence of biostimulant (D0), soil salinity increased the mean Na+ values in roots and leaves at 30 and 60 days of treatment, although not all differences were statistically significant. For example, significant differences were found between the mean Na+ concentrations in roots (1.6-fold higher in VS than in NS soil, Figure 4a) and leaves (1.8-fold higher in VS than in NS soil, Figure 4b) at 30 and 60 days.
In plants treated with BALOX®, lower Na+ levels were found in general, in both roots and leaves, at 30 and 60 days, as compared to the tomato plants grown in the absence of the biostimulant. These differences were statistically significant for some combinations of soil salinity, biostimulant dose, and treatment time, namely NS/D2/30, S/D2/30, NS/D2/60, S/D2/60, NS/D4/60, S/D4/60, and VS/D4/60 for Na+ in roots (Figure 4a) and S/D2/60, VS/D2/60, NS/D4/60, S/D4/60, and VS/D4/60 for Na+ in leaves (Figure 4b). A similar pattern was observed for the Cl concentration in roots and leaves at 30 and 60 days of treatment (Figure 4c,d). Therefore, it appears that the biostimulant application reduced the uptake of toxic ions by the plants. It is also important to note that both Na+ and Cl concentrations were similar in roots and leaves in all tested treatments.
Regarding mean K+ values, in the absence of the biostimulant, the results show an increase in salinity in roots and leaves at 30 and 60 days, although the effect was relatively weaker after 60 days of treatment (Figure 4e,f). In the roots of plants grown in non-saline soil, K+ concentrations increased significantly in response to the application of BALOX® at the highest dose (D4), whereas small, generally non-significant differences were found in saline soils (Figure 4e). The pattern of K+ content variation was similar in leaves than in roots but without significant differences observed with the corresponding controls for each treatment (Figure 4f). However, it should be noted that, under the same experimental conditions, the K+ concentration in leaves was much higher than in roots; for example, the maximum mean value reached in roots was 553 μmol g−1 DW, whereas that in leaves was 1435 μmol g−1 DW (Figure 4f,e).
The increase in soil salinity did not affect Ca2+ contents in the absence of the biostimulant after 30 or 60 days of growth, neither in roots nor in leaves—except for a significant increase in Ca2+ in leaves in VS soil (Figure 4h). Plants treated with BALOX® showed a tendency to increase Ca2+ content at 30 days, in roots and leaves and under non-saline and saline conditions although differences with the D0 control were significant only for NS soil, whereas at 60 days, there was no significant effect. As for K+ contents, Ca2+ concentrations measured in leaves were much higher than in roots; for example, for the NS/D2/30 treatment, leaf Ca2+ levels were about 9-fold higher than in roots (Figure 4h,g).

3.5. Osmolyte Quantification

Pro contents in leaves of the tomato plants increased significantly in all treatments, in parallel with increased soil salinity, after 30 and 60 days of growth (Figure 5a). For example, at 30 days of treatment, the concentration of Pro increased about 7-fold in S soil and 11-fold in VS soil, as compared to the NS control soil, reaching maximum absolute values close to 200 µmol g−1 DW. The effect of the BALOX® application on the plants was a significant and dose-dependent reduction of Pro accumulation under all tested experimental conditions. Thus, in plants treated for 30 days in the presence of the highest biostimulant dose (D4), relative reductions of Pro concentration of 40% and 36% were determined in S and VS soils, respectively, when compared with the corresponding D0 controls; after 60 days of growth, the differences were relatively smaller but still significant (Figure 5a).
Mean TSS levels decreased with increasing soil salinity, although significant differences with NS soil were only observed after 30 days of treatment (Figure 5b). The application of the biostimulant resulted, for each type of soil, in the dose-dependent increase in TSS contents after 30 and 60 days of treatment; differences with the D0 controls were statistically significant in the presence of BALOX® at the highest dose (D4) but also, in most cases, for the D2 dose (Figure 5b).
Average GB leaf contents increased slightly in response to increasing salinity, but no significant differences with the NS soil were found, neither after 30 days nor at 60 days of growth (Figure 5c). The biostimulant application increased further mean GB concentrations, in a dose-dependent manner and under all experimental conditions. Statistically significant differences with the D0 control were found for both biostimulant doses, D2 and D4, in VS soil after 30 and 60 days of treatment, and also in S soil, but only for D4 at 60 days (Figure 5c).

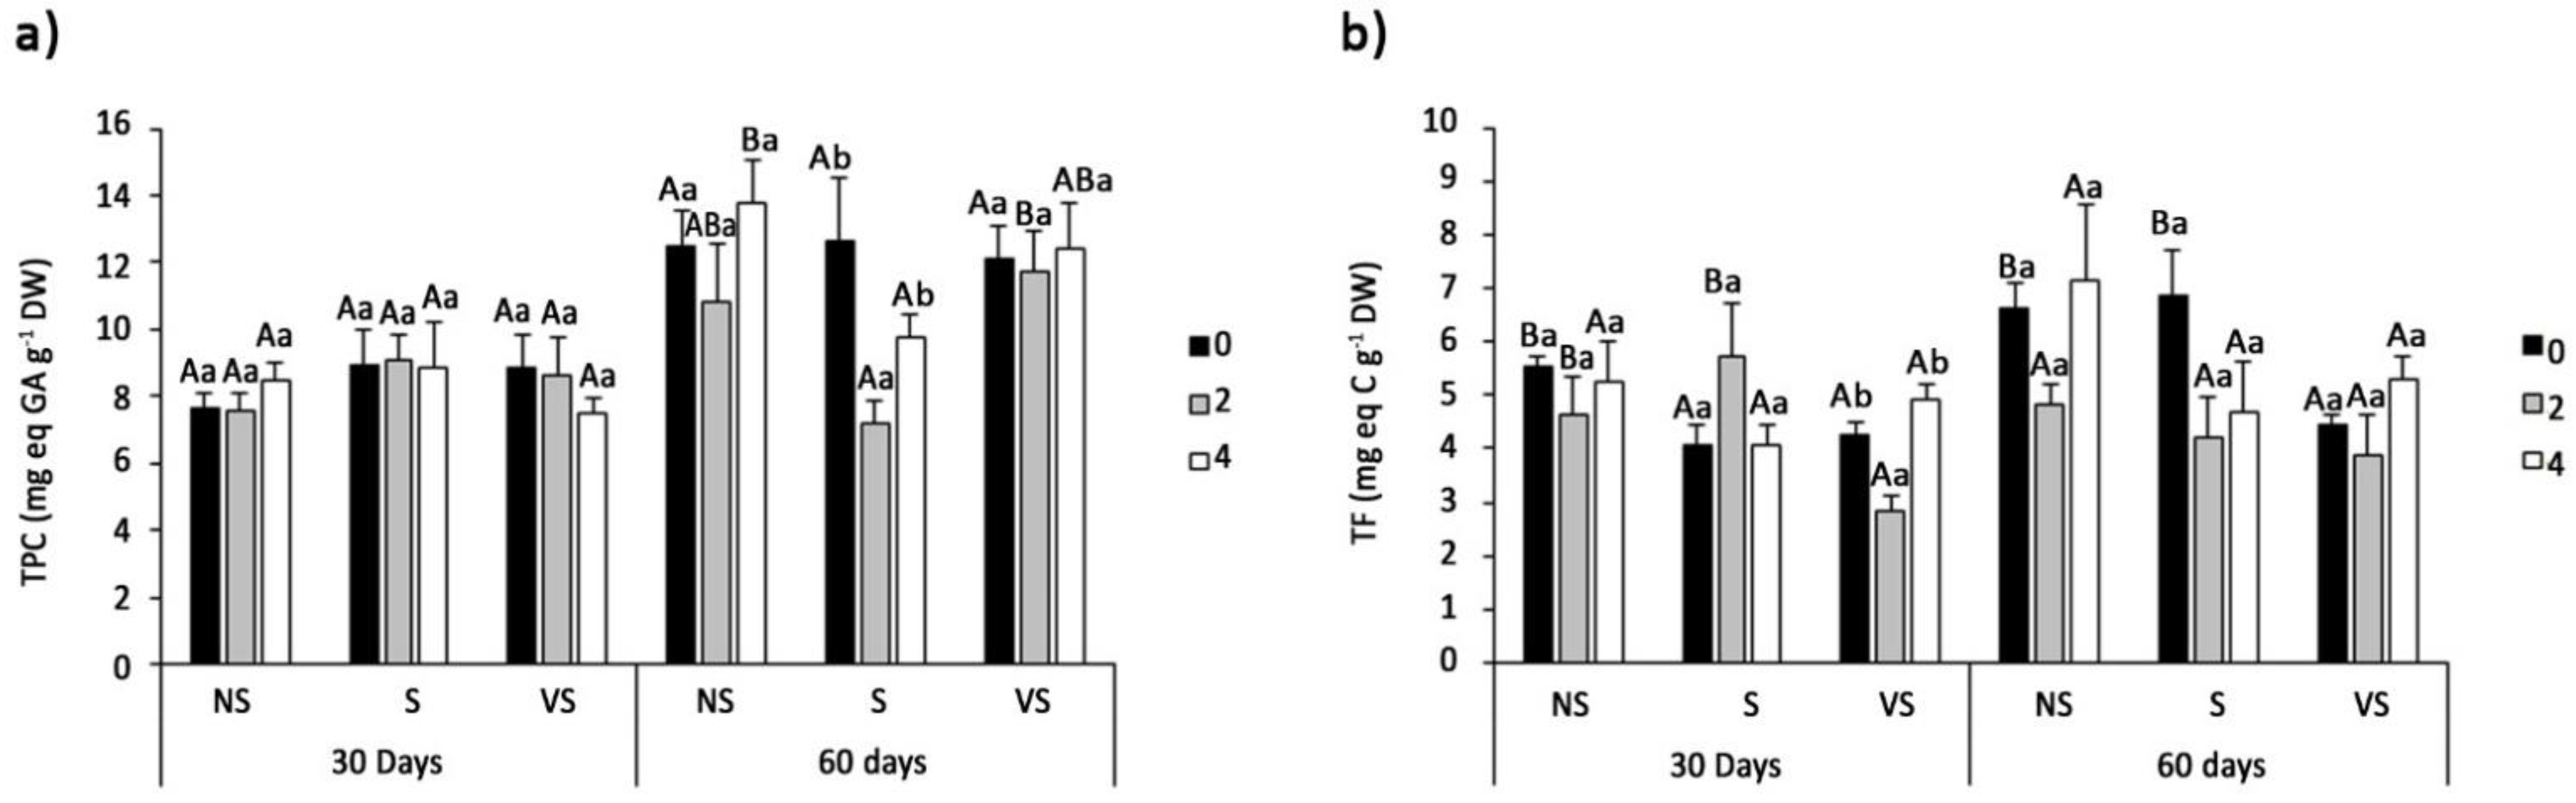
3.6. Oxidative Stress Markers and Non-Enzymatic Antioxidants

Soil salinity generated oxidative stress in the tomato plants, as shown by an increase in the mean leaf levels of the oxidative stress markers malondialdehyde (MDA) and hydrogen peroxide (H2O2) when comparing plants grown in S or VS soils with the non-saline controls (Figure 6). Regarding MDA contents, absolute values were lower at 60 days than at 30 days of treatment for each soil type, whereas, on the contrary, H2O2 accumulated to much higher levels after 60 days (Figure 6).
The general effect of the biostimulant application was a relative reduction of mean MDA contents with respect to the corresponding D0 controls in both non-saline and, especially, saline soils. This reduction was observed under all tested conditions already at the BALOX® low dose (D2) and was statistically significant in most cases (Figure 6a). A similar pattern of variation was observed for leaf H2O2 concentrations in biostimulant-treated plants (Figure 6b).
The leaf contents of total phenolic compounds (TPCs) and total flavonoids (TFs), as representative antioxidant compounds, were determined in the tomato plants after the treatments (Figure 7). In general, no significant effects of salinity or biostimulant application were observed, except for the reduction of TPC levels in S soil at the D2 dose of biostimulant after 60 days of treatment (Figure 7a) and the reduction of TF contents in the VS soil/D2 dose/30 days treatment (Figure 7b), when compared to the corresponding D0 controls.

3.7. Antioxidant Enzyme Activities

The specific activities of the three analysed antioxidant enzymes—superoxide dismutase (SOD), catalase (CAT), and glutathione reductase (GR)—increased significantly in response to increasing soil salinity, both at 30 and 60 days of treatment (Figure 8). For example, SOD activity increased 3.4-fold in S soil and 7.4-fold in VS soil at 30 days, with respect to NS soil (Figure 8a). For the three enzymes and each soil type, specific activities were higher after 60 days compared to the values calculated after 30 days. This is shown, for instance, by the mean value of CAT activity in S soil, at 30 days (54 U. mg−1 protein) and 60 days (90 U. mg−1 protein) of treatment (Figure 8b).
The application of the biostimulant caused a dose-dependent reduction of the specific activity of the three enzymes under all tested conditions: both in saline (S and VS) and non-saline (NS) soils and for the 30 days and 60 days samplings. The differences with the corresponding controls (plants grown without biostimulant) were statistically significant in all cases, except for SOD activity in NS soil after 60 days of growth (Figure 8a). The specific activity reductions varied for each enzyme and experimental condition and could reach more than 50% of the D0 control. For example, GR activity was reduced in the presence of BALOX® at the high dose (D4) by 51%, 55%, and 47% in NS, S, and VS soils, respectively (Figure 8c).

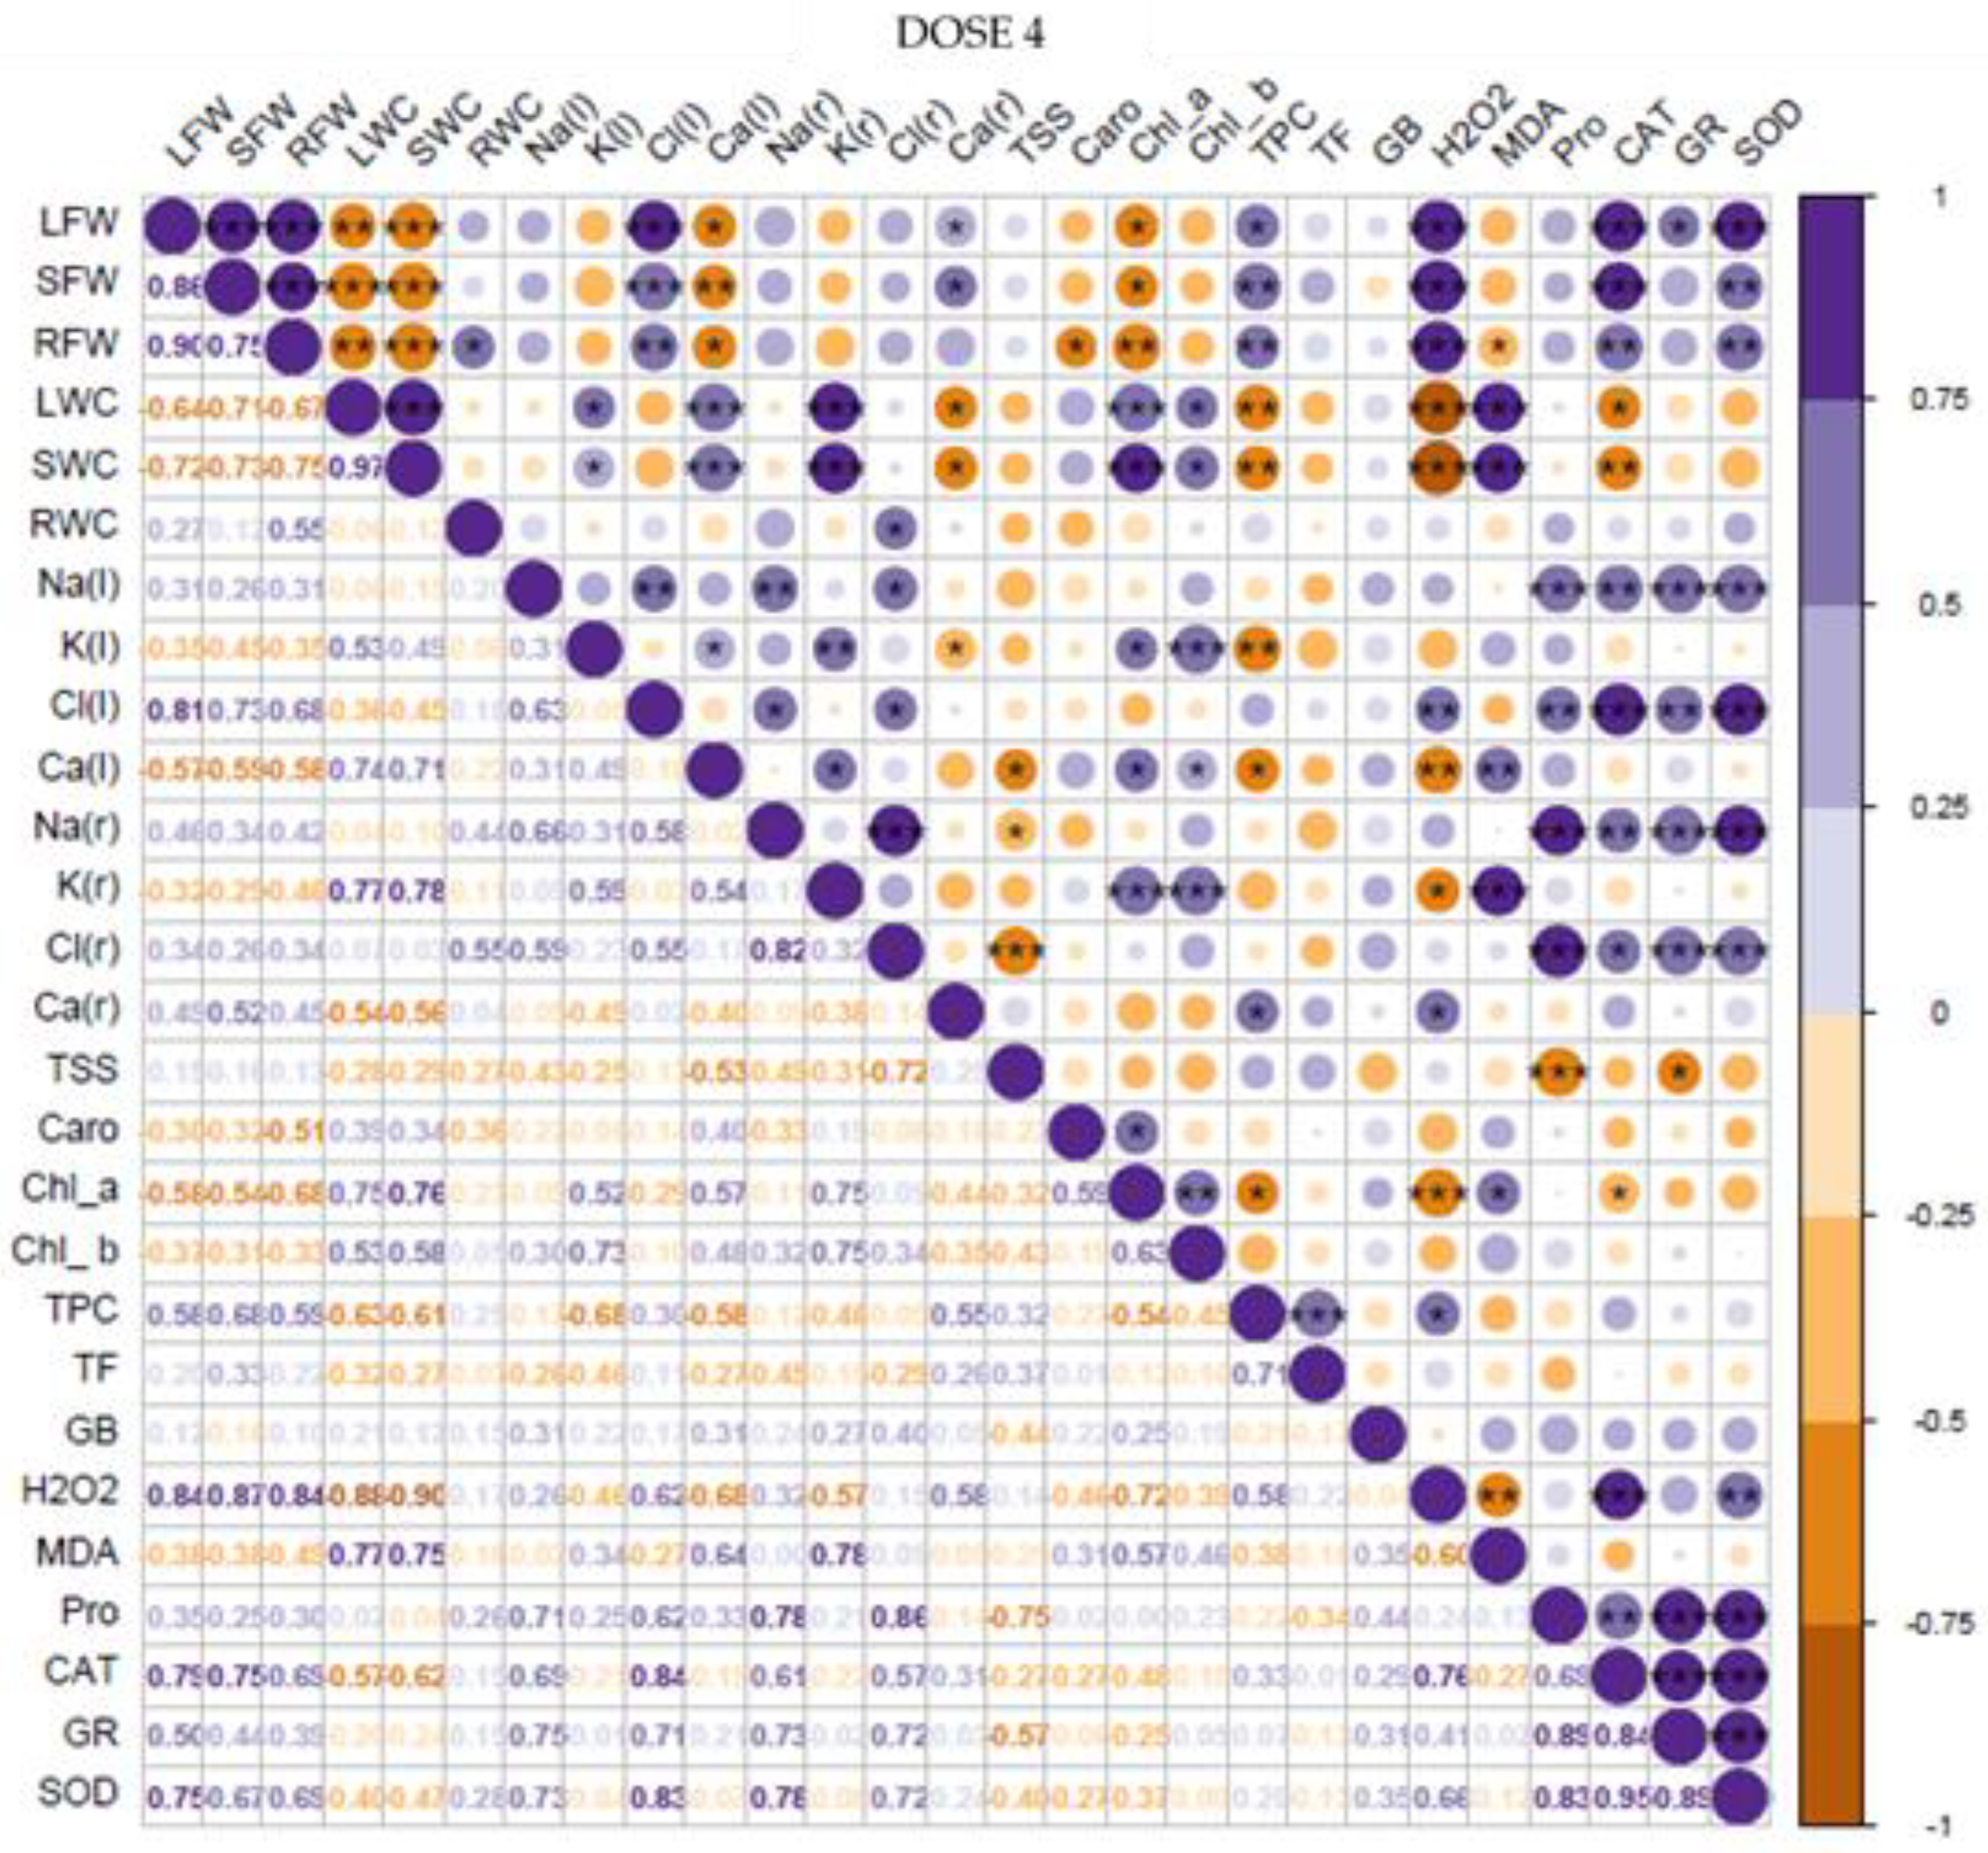
3.8. Correlation and Principal Component Analyses

Pairwise Spearman’s correlation coefficients were calculated for all 27 traits and measured separately for plants grown in the absence of the biostimulant (control, dose 0) and those treated with the biostimulant at the two doses (D2, D4) (Figure 9). First, in the control plants (D0), the increase in Na+ and Cl concentrations in leaves (Na+(l), Cl(l)) and roots (Na+(r), Cl(r)) observed in saline soils showed positive and statistically significant correlations with the increased antioxidant enzyme activities (SOD, CAT, and GR) and proline (Pro), malondialdehyde (MDA), and peroxide (H2O2) contents (Figure 9). Concerning these ion contents, correlation coefficients (ρ) higher than +0.81 were observed for SOD and GR activities or higher than +0.74 for CAT; these values oscillated between +0.65 and +0.88 for Pro contents, and they were around +0.57 for H2O2. It was also observed that these correlation coefficients decreased with biostimulant treatments, D2 and D4, indicating a reduction of the salt stress effects in the plants due to the action of the biostimulant. In the case of the D2 dose, the corresponding ρ values were below +0.81 for SOD and GR activities, with minimum values of +0.71 and +0.65, respectively, and +0.58 for CAT activity. Likewise, correlations between ion contents and Pro levels showed ρ values ranging from +0.57 to +0.87, and ρ values below +0.44 were found in the case of H2O2. Plant responses to both biostimulant doses were very similar.
On the other hand, in control plants (D0), the MDA concentration showed a significant negative correlation with TFs (ρ = −0.72), TSSs (ρ = −0.67), Ca (l) (ρ = −0.62), and RFW (ρ = −0.55). Similarly, Pro contents were negatively correlated with TSSs (−0.83). However, these correlation coefficients decreased significantly in the presence of the biostimulant, indicating that the BALOX® application reduced the level of oxidative stress affecting the plants. For example, for the D4 dose, the following ρ values were calculated when comparing MDA contents with those of TFs (ρ = −0.18), TSSs (ρ = −0.25), Ca2+ (l) (ρ = −0.09), and RFW (ρ = −0.49). Again, a similar behaviour was observed in D2- and D4-treated plants.
Next, we performed a Principal Component Analysis (PCA) to explore the associations among the 27 growth and biochemical traits measured in the control (D0) and biostimulant-treated (D2, D4) plants, under three salinity conditions (NS, S, and VS) and in two evaluation periods (30 and 60 days). The correlation circle and PCA biplot of the variables are presented in Figure 10. The first two components covered 60.3% of the total variability (Figure 10a), with the first one (PC1) explaining 33.2% of the total variability and correlating significantly mainly with the activity of antioxidant enzymes (GR, SOD, and CAT) and Pro concentration and Na+ and Cl contents in the roots (r) and leaves (l). These data are consistent with the association of all these variables (Pro, ion, and enzyme activities) near the barycentre of the very saline (VS) soil (Figure 10b), where the control treatment (D0) is also located. The second component explained an additional 27.1% of the total variability and was mainly correlated with parameters linked to oxidative stress, non-enzymatic antioxidants (TPCs, TFs), and GB, being located near the barycentre of the saline soil (S). Biostimulant treatments (D2 and D4) are positioned near the barycentre of the non-saline soil (NS), which would indicate that biostimulant-treated plants behave similarly to unstressed or less stressed plants when compared to D0 control plants. Likewise, the biostimulant seemed to favour higher levels of photosynthetic pigments, the concentration of Ca2+ and K+ in roots and leaves, and the water content in the plants, mainly in the roots, inducing a protection effect against saline conditions in the plants.

4. Discussion

4.1. Salinity Effects on Plant Growth and Biochemical Stress Markers

In general, growth inhibition is the first and most common response of plants to the application of different stress conditions, including salt stress [6]. However, we did not observe any significant reduction of root, stem, or leaf fresh weight in saline soils with respect to the values measured in non-saline soil, neither after 30 days nor after 60 days of growth. Although an ECe higher than 4 dS m−1 defines a soil as ‘saline’ [53], in our experiments, we did not use extremely high salinities, even in the VS soil, since we did not intend to apply ‘shock’ salt treatments but sought to simulate conditions that can occur in the field when the plants are irrigated with low-quality water. Therefore, the stress conditions were not strong enough to cause a detectable inhibition of growth in a crop, such as tomato, which is moderately resistant to salt stress [54]. In addition, in our experimental conditions, the plants showed a remarkable resistance to salt-induced dehydration, as no reduction of water content was observed in roots, stems, or leaves. A reduction of the fresh weight and water content of different plant organs is probably the most appropriate criterion to assess the negative effects of stress on plant growth. However, we cannot rule out completely the possibility that the salt treatments did affect the growth of the tomato plants in a more subtle way, reducing other growth parameters that were not quantified in our experiments, such as stem length or diameter or the number or area of the leaves. Salinity affects all phases of plant growth, but the severity of its effects depends on the developmental stage, salinity level, and cultivar [55]. It has been reported that, in general, salinity resistance increases with plant age, and cultivars are usually more resistant at the fruit ripening stage [56]. Furthermore, other reports [57] suggest that at low salinity levels (below 5 dS m−1), vegetative growth is limited by nutritional imbalance, whereas at higher salinities (ECe > 6 dS m−1), the osmotic and toxicity effects of salt stress also contribute to growth reduction.
The degradation of photosynthetic pigments is another general response of plants to high salinity and other abiotic stresses, as it has been observed in different crops [58,59,60], even though increases in chlorophyll content under high salinity conditions have also been reported in some cases [61]. In fact, salt-induced photosynthesis inhibition is one of the causes of growth reduction. In the present study, no significant changes in Chl a, Chl b, or Caros were observed when comparing the plants grown in S and VS soils with the controls, in agreement with the measurements of growth parameters.
On the contrary, soil salinity did affect ion homeostasis and transport in the tomato plants. As expected, Na+ and Cl contents increased significantly in parallel with the increasing salt concentration in the soil, both in roots and leaves and after the 30- and 60-day treatment periods. Interestingly, the concentrations of both ions in roots were relatively high (500–600 µmol g−1 DW) even under low salinity conditions (NS soil), suggesting the presence of mechanisms of active uptake of these ions by the roots. On the other hand, ion contents were similar in roots and leaves for each type of soil and treatment period. Therefore, mechanisms of salt tolerance based on blocking the transport of toxic ions to the aerial part of the plants do not appear to operate in tomato, contrary to what has been described in other crops; for example, in some common bean cultivars [62].
Despite the known deleterious effects of toxic ion accumulation [11,12,14], as mentioned above, growth inhibition was not observed in our experiments, suggesting the activation of counteracting mechanisms. One of these defence mechanisms may be based on the uptake of K+ ions from saline soils. Generally, upon an increase in Na+ contents in the tissues of salt-treated plants, K+ levels decrease because both ions compete for the same ion transporters, as reported in different species, including tomato [63,64,65]. In the present work, however, a significant increase in root K+ contents was observed in saline soils compared to the NS soil. Furthermore, for the same type of soil and treatment time, K+ concentrations were substantially higher (more than 2-fold) in leaves than in roots, pointing to the presence of active transport of this ion to the aerial part of the plants. This can explain, at least in part, why no degradation of photosynthetic pigments was observed in saline soils; Na+ accumulation and K+ deficit alter several fundamental physiological processes in plants, including photosynthesis [66], but in this case, the increase in leaf K+ contents helped maintain the Na+/K+ ratio. According to the classification of Flynn [67], K+ concentration in the soils used in this study can be considered very high, exceeding values of 7 meq/L already in the NS soil, which clearly should facilitate uptake of this cation by the roots.
Similarly, Ca2+ levels were much higher, about 10-fold, in leaves than in roots, particularly in very saline soils. As for K+, the active transport of Ca2+ from roots to the aerial plant parts and its accumulation in the leaves can contribute to salt tolerance since it is well known that calcium can partly counteract the adverse effects of sodium in the plant [23]. The observed accumulation of the two cations, K+ and Ca2+, is weaker at 60 days than at 30 days, especially in leaves. This is possibly due to the age of the plant [56] since plants tend to be more tolerant when they are older, so that relatively weaker responses could be sufficient to cope with the applied stress effects.
Plants accumulate compatible solutes, or osmolytes, to maintain osmotic balance under different abiotic stress conditions. Osmolytes are chemically diverse compounds, including, for example, proline (Pro), glycine betaine (GB), and different sugars and sugar alcohols [68]. In tomato, Pro is the most common osmoregulatory compound synthesised in response to abiotic stresses [69] and is accumulated under salt stress in both leaf and root tissues [70]. In fact, this amino acid has been shown to play an active role in the response to salt-induced osmotic stress in different plant species [71,72]. In many cases, a strong positive correlation between the salinity level and the increase in Pro content in the plants has been found [73,74], as was also observed in the present work. Therefore, Pro accumulation can be considered a reliable marker of the salt stress level affecting tomato plants. In addition, its role in osmotic adjustment, Pro has other relevant functions in the mechanisms of abiotic stress tolerance, including scavenging ROS [75]. This is reflected in the correlation and PCA analyses, where Pro is highly correlated with the salinity level and therefore shows a positive and significant correlation with Na and Cl concentrations in roots and leaves and also with MDA contents and antioxidant enzyme activities (SOD, CAT, and GR).
Soluble sugars have been shown to act as functional osmolytes in many plant species, accumulating to high levels in response to high salinity and other abiotic stress treatments [76,77,78,79]. In the present experiments, however, sugar contents actually decreased with increasing soil salinity, suggesting that these compounds do not play any significant role in osmotic adjustment under stress. Nevertheless, considering the multiple biological functions of sugars unrelated to stress responses, as energy sources, components of primary metabolism, or signalling molecules, changes in sugar levels should be interpreted with caution [80,81]. Glycine betaine (GB) is also a common plant osmolyte, with different protective functions in plants subjected to abiotic stress, such as maintaining osmotic balance and membrane stability, protein structure protection, or ROS reduction under stress conditions [82,83,84]. We observed a slight increase in average GB levels in saline soils with respect to the NS soil, but the differences were not significant; in any case, the reached GB concentrations were too low to have any significant osmotic effect. Therefore, at least under our experimental conditions and contrary to Pro, neither TSSs nor GB seemed to be directly involved in the mechanisms of salt tolerance in the tomato plants.
Although not reflected in significant growth inhibition, plants in the S and VS soils were affected by salt-induced oxidative stress. This was revealed by the observed increase in the mean average contents of two reliable oxidative stress markers, MDA and H2O2. The differences with the control, non-saline soil were statistically significant under all tested experimental conditions, except for changes in H2O2 levels at 30 days of treatment. The generation of oxidative stress, estimated by the increase in the levels of these biochemical markers, is a general secondary effect of abiotic stresses and has been described in many plants subjected to high salinity and other stressful conditions (e.g., [13,85,86,87]).
Plants respond to oxidative stress by activating antioxidant systems, both enzymatic and non-enzymatic [23,24]. In the present study, growing the plants in saline soils did not cause any significant accumulation of total phenolic compounds or the subgroup of flavonoids, typical examples of metabolites with high antioxidant activity. However, the specific activity of some of the most relevant antioxidant enzymes, SOD, CAT, and GR, did increase significantly in parallel to increasing salinity in the soil, both after 30 and 60 days of growth. These results agree with many reports in the literature indicating that the activation of antioxidant enzymes is the first line of defence of plants against oxidative stress. Only under extreme stress conditions, when the enzymatic machinery is not efficient enough to cope with cellular redox unbalance, is the synthesis of low molecular weight antioxidant compounds activated [88,89,90,91]. In our experiments, it seems clear that the activation of SOD, CAT, and GR enzymes was sufficient to counteract the salt-induced oxidative stress, and TPC and TF accumulation was not required.

4.2. Biostimulant Effects on Plant Growth and Stress Responses

The biostimulant application had a general positive effect on the growth of treated plants. This stimulatory effect was more clearly observed in roots, where FW increased significantly by applying BALOX® at both doses—D2 and D4—and in the 30- and 60-day treatments, but only in saline soils (S and VS); in NS soil, no significant change of FW was detected. Furthermore, BALOX® promoted increased root water content in plants grown in S soil. However, growth stimulation was not—at least not exclusively—mediated by counteracting the effects of salt stress on the plants, as leaf FW also increased significantly in biostimulant-treated plants grown in non-saline soil. Similarly, BALOX® induced an increase in chlorophyll a and b mean contents in plants after 30 days of treatment in all types of soil, although significant differences with the corresponding controls (D0 dose) were only observed in saline soil.
More specific effects of biostimulant application were observed when analysing ion contents in roots and their transport to the leaves. BALOX® reduced the mean values of Na+ and Cl concentrations in roots under all experimental conditions and the three types of soil, NS, S, and VS. In many cases, the differences with the D0 controls were statistically significant. This means that the biostimulant can partly inhibit the uptake of toxic ions by the roots under all tested salinity conditions. The patterns of variation of ion contents were roughly similar in roots and leaves, as were their absolute concentration values. As mentioned above, there does not seem to be any restriction of ion transport to the aerial part of the plant, which could contribute to salt tolerance, and this is not altered by the biostimulant treatments. On the other hand, the proposed stress response mechanisms based on the accumulation of K+ and Ca2+ in saline soils—with respect to NS soil—and their active transport to the leaves were maintained or even enhanced by using the biostimulant. Mean K+ and Ca2+ concentrations in roots and leaves were generally higher in the presence (D2 and D4) than in the absence (D0) of the biostimulant in the three soil types and two treatment times, although the differences were statistically significant only in some cases.
As already mentioned, there is a positive and strong correlation between Pro contents and the level of stress affecting the plants. The BALOX® application led to a significant, dose-dependent reduction of Pro concentration under all tested experimental conditions, indicating that tomato plants are less stressed in the presence of the biostimulant. Other authors have reported similar results studying the effects of microbial biostimulants in salt-stressed plants, for example, in Vicia faba [92] or Lotus glaber [93].
In the present study, the BALOX® application also induced a dose-dependent increase in TSS contents, in all plants, in NS, S, and VS soils. Since soluble sugars do not seem directly involved in salt tolerance mechanisms, the biostimulant effect is likely also unrelated to stress responses. The increase in sugar contents could be explained instead by the general stimulation of photosynthesis observed in the presence of the biostimulant. On the other hand, mean GB values also increased upon biostimulant application. This was to be expected since BALOX® contains GB as one of its active components. An exogenous GB application has been reported to reduce the effects of abiotic stresses in different plant species, for example, in cereals [94] or strawberries [95]. However, other authors [96] found that a foliar application of GB to tomato plants had a negative effect. This last report does not disagree with our results since BALOX® is applied to the substrate, not directly to the leaves. In any case, even in the presence of the biostimulant, GB concentrations are too low to have any significant osmotic effect.
The analysis of the effects of the BALOX® application on oxidative stress biomarkers confirmed the positive effect of the biostimulant in reducing the relative level of oxidative stress affecting the plants in all tested treatments. Indeed, a statistically significant reduction (in most cases) of MDA and H2O2 contents was detected in biostimulant-treated plants (D2 and D4) compared with the untreated (D0) controls. As expected, this lower degree of oxidative stress was accompanied by a parallel, significant, and dose-dependent reduction of the activities of antioxidant enzymes.

5. Conclusions

Under the conditions used in the present experiments, the salt stress level affecting the tomato plants grown in saline (S and VS) soils was not high enough to be reflected in significant inhibition of growth or reduction of photosynthetic pigments, two general responses of plants to abiotic stress. Nevertheless, the determination of several stress biochemical markers revealed the activation of specific stress tolerance mechanisms. These were based on the active transport and accumulation in leaves of K+ and Ca2+ cations to partly counteract the deleterious effects of toxic Na+ and Cl ions and the synthesis and accumulation of high Pro concentrations, for osmotic balance and osmoprotection. Growth in saline soils induced oxidative stress in the tomato plants, as indicated by the increase in leaf contents of MDA and H2O2, two reliable oxidative stress markers. Consequently, major antioxidant enzymes, such as SOD, CAT, and GR, were activated as a defence mechanism against oxidative stress.
The application of the BALOX® biostimulant had a general positive effect on plant growth, especially at the root level and in saline soils. Average contents of photosynthetic pigments (chlorophylls a and b and carotenoids) also increased, suggesting an improvement in photosynthesis. Furthermore, BALOX® appeared to partially inhibit the uptake by the roots of toxic ions, Na+ and Cl, and to enhance to some extent the accumulation of K+ and Ca2+. The results presented here provide evidence that biostimulant-treated tomato plants are less stressed than the non-treated plants, as shown by a significant, dose-dependent reduction of leaf Pro contents; more specifically, oxidative stress is reduced, as indicated by the decrease in MDA and H2O2 concentrations and antioxidant enzyme-specific activities. BALOX® stimulatory effects can be attributed, in part, to enhancing the plant’s responses to salt stress. However, some of these effects have also been observed under low salinity conditions (NS soil), suggesting that growth stimulation is also mediated by a general improvement of photosynthesis and primary metabolism.

Author Contributions

Conceptualization, J.Z.-R., H.M.-R., S.I.-A., M.B. and O.V.; methodology, J.Z.-R., S.G.-O., H.M.-R., S.I.-A., M.B. and O.V.; software, J.Z.-R. and H.M.-R.; validation, H.M.-R., S.I.-A., M.B. and O.V.; formal analysis, J.Z.-R., S.G.-O. and A.M.T.; investigation, J.Z.-R.; resources, M.B., H.M.-R., S.I.-A. and O.V.; data curation, J.Z.-R. and S.G.-O.; writing—original draft preparation, J.Z.-R.; writing—review and editing, J.Z.-R., H.M.-R., S.I.-A., M.B. and O.V.; visualization, J.Z.-R., H.M.-R. and O.V.; supervision, H.M.-R., S.I.-A., M.B. and O.V.; project administration, H.M.-R., S.I.-A., M.B. and O.V.; funding acquisition, S.I.-A., M.B. and O.V. All authors have read and agreed to the published version of the manuscript.

Funding

This research was partly funded by the company Innovak Global and partly by UPV through internal funds to S.I.-A., M.B. and O.V.

Institutional Review Board Statement

Not applicable.

Informed Consent Statement

Not applicable.

Data Availability Statement

Data are contained within the article.

Acknowledgments

The authors are grateful to Roberta Calone (University of Bologna) for her help with the Principal Component Analysis using R software.

Conflicts of Interest

J.Z.-R. was supported by a contract from Innovak Global. However, the funders had no role in the design of the study; in the collection, analyses, or interpretation of data; in the writing of the manuscript; or in the decision to publish the results.

References

  1. Shu, P.; Li, Y.; Li, Z.; Sheng, J.; Shen, L. SIMAPK3 enhances tolerance to salt stress in tomato plants by scavenging ROS accumulation and up-regulating the expression of ethylene signaling related genes. Environ. Exp. Bot. 2022, 193, 104698. [Google Scholar] [CrossRef]
  2. Hussain, S.; Shaukat, M.; Ashraf, M.; Zhu, C.; Jin, Q.; Zhang, J. Salinity Stress in Arid and Semi-Arid Climates: Effects and Management in Field Crops, Climate Change and Agriculture, Saddam Hussain; Intech Open: London, UK, 2019. [Google Scholar] [CrossRef]
  3. Zaman, M.; Shahid, S.; Heng, L. Guideline for Salinity Assessment, Mitigation and Adaptation Using Nuclear and Related Techniques; Springer: Cham, Switzerland, 2018; p. 164. [Google Scholar]
  4. Food and Agriculture Organization of the United Nations. Mapping of Salt-Affected Soils-Technical Manual; Food and Agriculture Organization of the United Nations: Rome, Italy, 2020. [Google Scholar]
  5. Butcher, K.; Wick, A.F.; DeSutter, T.M.; Chatterjee, A.; Harmon, J. Soil Salinity: A threat to global food security. Agron. J. 2016, 108, 2189–2200. [Google Scholar] [CrossRef]
  6. Munns, R.; Tester, M. Mechanisms of salinity tolerance. Annu. Rev. Plant Biol. 2008, 59, 651–681. [Google Scholar] [CrossRef] [PubMed]
  7. Flowers, T.J. Improving crop salt tolerance. J. Exp. Bot. 2004, 55, 307–319. [Google Scholar] [CrossRef]
  8. Hasegawa, P.M.; Bressan, R.A.; Zhu, J.K.; Bohnert, H.J. Plant cellular and molecular responses to high salinity. Annu. Rev. Plant Physiol. Plant Mol. Biol. 2000, 51, 463–499. [Google Scholar] [CrossRef]
  9. Nishimura, T.; Cha-um, S.; Takagaki, M.; Ohyama, K. Survival percentage, photosynthetic abilities and growth characters of two indica rice (Oryza sativa L. spp. indica) cultivars in response to isosmotic stress. Sp. J. Agric. Res. 2011, 9, 262–270. [Google Scholar] [CrossRef]
  10. Rabie, G.H. Influence of arbuscular mycorrhizal fungi and kinetin on the response of mungbean plants to irrigation with seawater. Mycorrhiza 2005, 15, 225–230. [Google Scholar] [CrossRef]
  11. Siringam, K.; Juntawong, N.; Cha-um, S.; Kirdmanee, C. Salt stress induced ion accumulation, ion homeostasis, membrane injury and sugar contents in salt-sensitive rice (Oryza sajtiva L. spp. indica) roots under isoosmotic conditions. Afri. J. Biotechnol. 2011, 10, 1340–1346. [Google Scholar]
  12. Chawla, S.; Jain, S.; Jain, V. Salinity induced oxidative stress and antioxidant system in salt-tolerant and salt-sensitive cultivars of rice (Oryza sativa L.). J. Plant Biochem. Biotechnol. 2013, 22, 27–34. [Google Scholar] [CrossRef]
  13. González-Orenga, S.; Grigore, M.-N.; Boscaiu, M.; Vicente, O. Constitutive and induced salt tolerance mechanisms and potential uses of Limonium Mill. species. Agronomy 2021, 11, 413. [Google Scholar] [CrossRef]
  14. James, R.A.; Blake, C.; Byrt, C.S.; Munns, R. Major genes for Na+ exclusion, Nax1 and Nax2 (wheat HKT1;4 and HKT1;5), decrease Na+ accumulation in bread wheat leaves under saline and waterlogged conditions. J. Exp. Bot. 2011, 62, 2939–2947. [Google Scholar] [CrossRef]
  15. Cendrero-Mateo, M.P.; Carmo-Silva, A.E.; Porcar-Castell, A.; Hamerlynck, E.P.; Papuga, S.A.; Moran, M.S. Dynamic response of plant chlorophyll fluorescence to light, water and nutrient availability. Funct. Plant Biol. 2015, 42, 746–757. [Google Scholar] [CrossRef]
  16. Rizwan, M.; Ali, S.; Ibrahim, M.; Farid, M.; Adrees, M.; Bharwana, S.A.; Zia-ur-Rehman, M.; Qayyum, M.F.; Abbas, F. Mechanisms of silicon-mediated alleviation of drought and salt stress in plants: A review. Environ. Sci. Pollut. Res. 2015, 22, 15416–15431. [Google Scholar] [CrossRef]
  17. Abdallah, M.M.S.; Ramadan, A.A.; El-Bassiouny, H.M.S.; Bakry, B.A. Regulation of antioxidant system in wheat cultivars by using chitosan or salicylic acid to improve growth and yield under salinity stress. Asian J. Plant Sci. 2020, 19, 114–126. [Google Scholar]
  18. Ma, Y.; Dias, M.C.; Freitas, H. Drought and salinity stress responses and microbe-induced tolerance in plants. Front. Plant Sci. 2020, 11, 591911. [Google Scholar] [CrossRef]
  19. Zhu, J.K. Salt and drought stress signal transduction in plants. Annu. Rev. Plant Biol. 2002, 53, 247. [Google Scholar] [CrossRef]
  20. Roy, S.; Chakraborty, A.P.; Chakraborty, R. Understanding the potential of root microbiome influencing salt-tolerance in plants and mechanisms involved at the transcriptional and translational level. Physiol. Plant. 2021, 173, 1657–1681. [Google Scholar] [CrossRef]
  21. Zhu, J.K. Plant salt tolerance. Trends Plant Sci. 2001, 6, 66–71. [Google Scholar] [CrossRef]
  22. Chen, H.; Jiang, J.G. Osmotic adjustment and plant adaptation to environmental changes related to drought and salinity. Environ. Rev. 2010, 18, 309–319. [Google Scholar] [CrossRef]
  23. He, M.; He, C.Q.; Ding, N.Z. Abiotic stresses: General defenses of land plants and chances for engineering multistress tolerance. Front. Plant Sci. 2018, 9, 1771. [Google Scholar] [CrossRef]
  24. Paes de Melo, B.; Carpinetti, P.d.A.; Fraga, O.T.; Rodrigues-Silva, P.L.; Fioresi, V.S.; de Camargos, L.F.; Ferreira, M.F.d.S. Abiotic stresses in plants and their markers: A practice view of plant stress responses and programmed cell death mechanisms. Plants 2022, 11, 1100. [Google Scholar] [CrossRef] [PubMed]
  25. Fita, A.; Rodríguez-Burruezo, A.; Boscaiu, M.; Prohens, J.; Vicente, O. Breeding and domesticating crops adapted to drought and salinity: A new paradigm for increasing food production. Front. Plant Sci. 2015, 6, 978. [Google Scholar] [CrossRef] [PubMed]
  26. Van Oosten, M.J.; Pepe, O.; De Pascale, S.; Silletti, S.; Maggio, A. The role of biostimulants and bioeffectors as alleviators of abiotic stress in crop plants. Chem. Biol. Technol. Agric. 2017, 4, 1–12. [Google Scholar] [CrossRef]
  27. Du Jardin, P. Plant biostimulants: Definition, concept, main categories and regulation. Sci. Hortic. 2015, 196, 3–14. [Google Scholar] [CrossRef]
  28. Singh, J.; Takhur, J.K. Photosynthesis and abiotic stress in plants. In Biotic and Abiotic Stress Tolerance in Plants; Vats, S., Ed.; Springer Nature Singapore Private Ltd.: Singapore, 2018; pp. 27–46. [Google Scholar]
  29. Brown, P.; Saa, S. Biostimulants in agriculture. Front. Plant Sci. 2015, 6, 671. [Google Scholar] [CrossRef]
  30. Drobek, M.; Frąc, M.; Cybulska, J. Plant Biostimulants: Importance of the quality and yield of horticultural crops and the improvement of plant tolerance to abiotic Stress—A Review. Agron. J. 2019, 9, 335. [Google Scholar] [CrossRef]
  31. De Vasconcelos, A.C.F.; Chaves, L.H.G. Biostimulants and their role in improving plant growth under abiotic stresses. In Biostimulants in Plant Science; Mirmajlessi, S.M., Ed.; Intech Open: London, UK, 2019; pp. 3–16. [Google Scholar]
  32. Food and Agriculture Organization of the United Nations. FAO Statistical Databases (FAOSTAT). Available online: http://www.fao.org/faostat/es (accessed on 6 January 2020).
  33. Lichtenthaler, H.K.; Wellburn, A.R. Determinations of total carotenoids and chlorophylls a and b of leaf extracts in different solvents. Biochem. Soc. Trans. 1983, 11, 591–592. [Google Scholar] [CrossRef]
  34. Weimberg, R. Solute adjustments in leaves of two species of wheat at two different stages of growth in response to salinity. Physiol. Plant. 1987, 70, 381–388. [Google Scholar] [CrossRef]
  35. Bates, L.S.; Waldren, R.P.T. Rapid determination of free proline for water—Stress Studies. Plant Soil. 1973, 39, 205–207. [Google Scholar] [CrossRef]
  36. Grieve, C.M.; Grattan, S.R. Rapid assay for determination of water soluble quaternary ammonium compounds. Plant Soil. 1983, 70, 303–307. [Google Scholar] [CrossRef]
  37. Valadez-Bustos, M.G.; Aguado-Santacruz, G.A.; Tiessen-Favier, A.; Robledo-Paz, A.; Muñoz-Orozco, A.; Rascón-Cruz, Q.; Santacruz-Varela, A. A reliable method for spectrophotometric determination of glycine betaine in cell suspension and other systems. Anal. Biochem. 2016, 498, 47–52. [Google Scholar] [CrossRef]
  38. Dubois, M.; Gilles, K.A.; Hamilton, J.K.; Rebers, P.A.; Smith, F. Colorimetric method for determination of sugars and related substances. Anal. Chem. 1956, 28, 350–356. [Google Scholar] [CrossRef]
  39. Hodges, D.M.; Delong, J.M.; Forney, C.F.; Prange, R.K. Improving the thiobarbituric acid-reactive-substances assay for estimating lipid peroxidation in plant tissues containing anthocyanin and other interfering compounds. Planta 1999, 207, 604–611. [Google Scholar] [CrossRef]
  40. Taulavuori, E.; Hellström, E.; Taulavuori, K.; Laine, K. Comparison of two methods used to analyse lipid peroxidation from Vaccinium myrtillus (L.) during snow removal, reacclimation and cold acclimation. J. Exp. Bot. 2002, 52, 2375–2380. [Google Scholar] [CrossRef]
  41. Loreto, F.; Velikova, V. Isoprene produced by leaves protects the photosynthetic apparatus against ozone damage, quenches ozone products, and reduces lipid peroxidation of cellular membranes. Plant Physiol. 2001, 127, 1781–1787. [Google Scholar] [CrossRef]
  42. Blainski, A.; Lopes, G.; Mello, J. Application and analysis of the Folin Ciocalteu method for the determination of the total phenolic content from Limonium brasiliense L. Molecules 2013, 18, 6852–6865. [Google Scholar] [CrossRef]
  43. Zhishen, J.; Mengcheng, T.; Jianming, W. The determination of flavonoid contents in mulberry and their scavenging effects on superoxide radicals. Food Chem. 1999, 64, 555–559. [Google Scholar] [CrossRef]
  44. Gil, R.; Bautista, I.; Boscaiu, M.; Lidón, A.; Wankhade, S.; Sánchez, H.; Llinares, J.; Vicente, O. Responses of five Mediterranean halophytes to seasonal changes in environmental conditions. AoB Plants 2014, 6, plu049. [Google Scholar] [CrossRef]
  45. Bradford, M.M. A rapid and sensitive method for the quantitation of microgram quantities of protein utilizing the principle of protein-dye binding. Anal. Biochem. 1976, 72, 248–254. [Google Scholar] [CrossRef]
  46. Beyer, W.; Fridovich, I. Assaying for superoxide dismutase activity: Some large consequences of minor changes in conditions. Anal. Biochem. 1987, 161, 559–566. [Google Scholar] [CrossRef]
  47. Aebi, H. Catalase in vitro. Method. Enzymol. 1984, 105, 121–126. [Google Scholar] [CrossRef]
  48. Connell, J.P.; Mullet, J.E. Pea chloroplast glutathione reductase: Purification and characterization. Plant Physiol. 1986, 82, 351–356. [Google Scholar] [CrossRef]
  49. Fieller, E.C.; Pearson, E.S. Tests for rank correlation coefficients. I. Biometrika 1957, 44, 470–481. [Google Scholar] [CrossRef]
  50. Lê, S.; Josse, J.; Husson, F. FactoMineR: An R package for multivariate analysis. J. Stat. Softw. 2008, 25, 1–18. [Google Scholar] [CrossRef]
  51. Wickham, H. ggplot2: Elegant Graphics for Data Analysis. Available online: https://ggplot2.tidyverse.org/reference/ (accessed on 15 May 2022).
  52. Kuhn, M.; Jackson, S.; Cimentada, J. Corrr: Correlations in R. R Package Version 0.4. Available online: https://cran.r-project.org/web/packages/corrr/corrr.pdf (accessed on 15 May 2022).
  53. Chhabra, R. Classification of salt-affected soils. Arid Land Res. Manag. 2004, 19, 61–79. [Google Scholar] [CrossRef]
  54. Raza, M.A.; Saeed, A.; Munir, H.; Ziaf, K.; Shakeel, A.; Saeed, N.; Munawar, A.; Rehman, F. Screening of tomato genotypes for salinity tolerance based on early growth attributes and leaf inorganic osmolytes. Arch. Agron. Soil Sci. 2017, 63, 501–512. [Google Scholar] [CrossRef]
  55. Hajer, A.S.; Malibari, A.A.; Al-Zahrani, H.S.; Almaghrabi, O.A. Responses of three tomato cultivars to sea water salinity 1. Effect of salinity on the seedling growth. Afr. J. Biotechnol. 2006, 5, 855–861. [Google Scholar]
  56. Bolarín, M.C.; Perez-Alfocea, F.; Estan, M.T.; Caro, M. Response of tomato cultivars to salinity. Plant Soil. 1993, 150, 203–211. [Google Scholar]
  57. Cuartero, J.; Fernández-Muñoz, R. Tomato and salinity. Sci. Hortic. 1999, 78, 83–152. [Google Scholar] [CrossRef]
  58. Zengin, F.K.; Munzuroglu, O. Effects of some heavy metals on content of chlorophyll, proline and some antioxidant chemicals in bean (Phaseolus vulgaris L.) seedlings. Acta Biol. Cracov. Bot. 2005, 47, 157–164. [Google Scholar]
  59. Al Hassan, M.; Fuertes, M.M.; Sánchez, F.J.R.; Vicente, O.; Boscaiu, M. Effects of salt and water stress on plant growth and on accumulation of osmolytes and antioxidant compounds in cherry tomato. Not. Bot. Horti Agrobot. Cluj-Napoca 2015, 43, 1–11. [Google Scholar] [CrossRef]
  60. Plazas, M.; Nguyen, H.T.; González-Orenga, S.; Fita, A.; Vicente, O.; Prohens, J.; Boscaiu, M. Comparative analysis of the responses to water stress in eggplant (Solanum melongena) cultivars. Plant Physiol. Biochem. 2019, 143, 72–82. [Google Scholar] [CrossRef]
  61. Landa-Faz, A.; González-Orenga, S.; Boscaiu, M.; Rodríguez-Vázquez, R.; Vicente, O. Effect of the pesticide endosulfan and two different biostimulants on the stress responses of Phaseolus leptostachyus plants grown in a saline soil. Agronomy 2021, 11, 1208. [Google Scholar] [CrossRef]
  62. Al Hassan, M.; Morosan, M.; López-Gresa, M.P.; Prohens, J.; Vicente, O.; Boscaiu, M. Salinity-induced variation in biochemical markers provides insight into the mechanisms of salt tolerance in common (Phaseolus vulgaris) and runner (P. coccineus) beans. Int. J. Mol. Sci. 2016, 17, 1582. [Google Scholar] [CrossRef] [Green Version]
  63. Gong, B.; Wen, D.; Vanden Langenberg, K.; Wei, M.; Yang, F.; Shi, Q.; Wang, X. Comparative effects of NaCl and NaHCO3 stress on photosynthetic parameters, nutrient metabolism, and the antioxidant system in tomato leaves. Sci. Hortic. 2013, 157, 1–12. [Google Scholar] [CrossRef]
  64. Wang, X.; Geng, S.; Ri, Y.J.; Cao, D.; Liu, J.; Shi, D.; Yang, C. Physiological responses and adaptive strategies of tomato plants to salt and alkali stresses. Sci. Hortic. 2011, 130, 248–255. [Google Scholar] [CrossRef]
  65. De la Torre-González, A.; Montesinos-Pereira, D.; Blasco, B.; Ruiz, J.M. Influence of the proline metabolism and glycine betaine on tolerance to salt stress in tomato (Solanum lycopersicum L.) commercial genotypes. J. Plant Physiol. 2018, 231, 329–336. [Google Scholar] [CrossRef]
  66. Li, R.; Shi, F.; Fukuda, K.; Yang, Y. Effects of salt and alkali stresses on germination, growth, photosynthesis and ion accumulation in alfalfa (Medicago sativa L.). Soil Sci. Plant Nutr. 2010, 56, 725–733. [Google Scholar] [CrossRef]
  67. Flynn, R. Interpreting Soil Tests: Unlock the Secrets of Your Soil; Cooperative Extension Service, College of Agricultural, Consumer and Environmental Sciences, New Mexico State University: Las Cruces, NM, USA, 2015; pp. 1–12. [Google Scholar]
  68. Ahmad, F.; Singh, A.; Kamal, A. Osmoprotective role of sugar in mitigating abiotic stress in plants. In Protective Chemical Agents in the Amelioration of Plant Abiotic Stress: Biochemical and Molecular Perspectives; John Wiley & Sons: Hoboken, NJ, USA, 2020; pp. 53–70. [Google Scholar]
  69. Verbruggen, N.; Hermans, C. Proline accumulation in plants: A review. Amino Acids 2008, 35, 753–759. [Google Scholar] [CrossRef]
  70. Aziz, A.; Martin-Tanguy, J.; Larher, F. Salt stress-induced proline accumulation and changes in tyramine and polyamine levels are linked to ionic adjustment in tomato leaf discs. Plant Sci. 1999, 145, 83–91. [Google Scholar] [CrossRef]
  71. Watanabe, S.; Kojima, K.; Ide, Y.; Sasaki, S. Effects of saline and osmotic stress on proline and sugar accumulation in Populus euphratica in vitro. Plant Cell Tissue Organ Cult. 2000, 63, 199–206. [Google Scholar] [CrossRef]
  72. Chen, Z.; Cuin, T.A.; Zhou, M.; Twomey, A.; Naidu, B.P.; Shabala, S. Compatible solute accumulation and stress-mitigating effects in barley genotypes contrasting in their salt tolerance. J. Exp. Bot. 2007, 58, 4245–4255. [Google Scholar] [CrossRef]
  73. Sarabi, B.; Bolandnazar, S.; Ghaderi, N.; Ghashghaie, J. Genotypic differences in physiological and biochemical responses tosalinity stress in melon (Cucumis melo L.) plants: Prospects for selection of salt tolerant landraces. Plant Physiol. Biochem. 2017, 119, 294–311. [Google Scholar] [CrossRef]
  74. Derkaoui, K.M.; Sahnoune, M.; Belkohodja, M. The effect of salinity on accumulation proline, glycine betaine and mineral elements in four varieties of tomatoes. Ukr. J. Ecol. 2022, 12, 58–63. [Google Scholar]
  75. Alvarez, M.E.; Savouré, A.; Szabados, L. Proline metabolism as regulatory hub. Trends Plant Sci. 2022, 27, 39–55. [Google Scholar] [CrossRef]
  76. Nishizawa, A.; Yabuta, Y.; Shigeoka, S. Galactinol and raffinose constitute a novel function to protect plants from oxidative damage. Plant Physiol. 2008, 147, 1251–1263. [Google Scholar] [CrossRef]
  77. Anjum, N.A.; Aref, I.M.; Duarte, A.C.; Pereira, E.; Ahmad, I.; Iqbal, M. Glutathione and proline can coordinately make plants withstand the joint attack of metal (loid) and salinity stresses. Front Plant Sci. 2014, 5, 662. [Google Scholar] [CrossRef]
  78. Slama, I.; Abdelly, C.; Bouchereau, A.; Flowers, T.; Savouré, A. Diversity, distribution and roles of osmoprotective compounds accumulated in halophytes under abiotic stress. Ann. Bot. 2015, 115, 433–447. [Google Scholar] [CrossRef]
  79. Singh, M.; Kumar, J.; Singh, S.; Singh, V.P.; Prasad, S.M. Roles of osmoprotectants in improving salinity and drought tolerance in plants: A review. Rev. Environ. Sci. Biotechnol. 2015, 14, 407–426. [Google Scholar] [CrossRef]
  80. Gil, R.; Boscaiu, M.; Lull, C.; Bautista, I.; Lid, A.N.; Vicente, Ó. Are soluble carbohydrates ecologically relevant for salt tolerance in halophytes? Funct. Plant Biol. 2013, 40, 805–818. [Google Scholar] [CrossRef]
  81. Calone, R.; Mircea, D.-M.; González-Orenga, S.; Boscaiu, M.; Lambertini, C.; Barbanti, L.; Vicente, O. Recovery from salinity and drought stress in the perennial Sarcocornia fruticosa vs. the annual Salicornia europaea and S. veneta. Plants 2022, 11, 1058. [Google Scholar] [CrossRef]
  82. Kaya, C.; Sönmez, O.; Aydemir, S.; Dikilitas, M. Mitigation effects of glycinebetaine on oxidative stress and some key growth parameters of maize exposed to salt stress. Turk. J. Agric. For. 2013, 37, 188–194. [Google Scholar] [CrossRef]
  83. Paradisone, V.; Barrameda-Medina, Y.; Montesinos-Pereira, D.; Romero, L.; Esposito, S.; Ruiz, J.M. Roles of some nitrogenous compounds protectors in the resistance to zinc toxicity in Lactuca sativa cv. Phillipus and Brassica oleracea cv. Bronco. Acta Physiol. Plant 2015, 37, 137. [Google Scholar] [CrossRef]
  84. Mahboob, W.; Khan, M.A.; Shirazi, M.U. Characterization of salt tolerant wheat (Triticum aestivum) genotypes on the basis of physiological attributes. Int. J. Agric. Biol. 2017, 19, 726–734. [Google Scholar] [CrossRef]
  85. Chakraborty, U.; Pradhan, B. Oxidative stress in five wheat varieties (Triticum aestivum L.) exposed to water stress and study of their antioxidant enzyme defense system, water stress responsive metabolites and H2O2 accumulation. Braz. J. Plant Phys. 2012, 24, 117–130. [Google Scholar] [CrossRef] [Green Version]
  86. Moussouraki, M.A.; Eleni, T.; Velliou, A.; Goufa, M.; Psychogiou, M.; Papadakis, I.E.; Abraham, E.M. Growth, physiological and biochemical responses of two greek cotton cultivars to salt stress and their impact as selection indices for salt tolerance. Not. Bot. Horti Agrobot. Cluj-Napoca 2019, 47, 706–715. [Google Scholar] [CrossRef]
  87. Zhu, Y.; Luo, X.; Nawaz, G.; Yin, J.; Yang, J. Physiological and biochemical responses of four cassava cultivars to drought stress. Sci. Rep. 2020, 10, 6968. [Google Scholar] [CrossRef]
  88. Gill, S.S.; Tuteja, N. Reactive oxygen species and antioxidant machinery in abiotic stress tolerance in crop plants. Plant Physiol. Biochem. 2010, 48, 909–930. [Google Scholar] [CrossRef]
  89. Miller, G.; Suzuki, N.; Ciftci-Yilmaz, S.; Mittler, R. Reactive oxygen species homeostasis and signaling during drought and salinity stresses. Plant Cell Environ. 2010, 33, 453–467. [Google Scholar] [CrossRef]
  90. Vicente, O.; Boscaiu, M. Flavonoids: Antioxidant compounds for plant defence … and for a healthy human diet. Not. Bot. Horti Agrobot. Cluj-Napoca 2018, 46, 14–21. [Google Scholar] [CrossRef]
  91. Al Hassan, M.; Chaura, J.; Donat-Torres, M.P.; Boscaiu, M.; Vicente, O. Antioxidant responses under salinity and drought in three closely related wild monocots with different ecological optima. AoB Plants 2017, 9, plx009. [Google Scholar] [CrossRef] [PubMed]
  92. Rabie, G.H.; Almadini, A.M. Role of bioinoculants in development of salt-tolerance of Vicia faba plants under salinity stress. Afri. J. Biotechnol. 2005, 4, 210–222. [Google Scholar] [CrossRef]
  93. Sannazzaro, A.I.; Echeverría, M.; Albertó, E.O.; Ruiz, O.A.; Menéndez, A.B. Modulation of polyamine balance in Lotus glaber by salinity and arbuscular mycorrhiza. Plant Physiol. Biochem. 2007, 45, 39–46. [Google Scholar] [CrossRef]
  94. Agboma, P.C.; Jones, M.G.K.; Peltonen-Sainio, P.; Rita, H.; Pehu, E. Exogenous glycine betaine enhances grain yield of maize, sorghum and wheat grown under two supplementary watering regimes. J. Agron. Crop Sci. 1997, 178, 29–37. [Google Scholar] [CrossRef]
  95. Rajashekar, C.B.; Zhou, H.; Marcum, K.B.; Prakash, O. Glycine betaine accumulation and induction of cold tolerance in strawberry (Fragaria X ananassa Duch.) plants. Plant Sci. 1999, 148, 175–183. [Google Scholar] [CrossRef]
  96. Heuer, B. Influence of exogenous application of proline and glycinebetaine on growth of salt-stressed tomato plants. Plant Sci. 2003, 165, 693–699. [Google Scholar] [CrossRef]
Figure 1. Fresh weight and water content of roots ((a,b), respectively), stems (c,d), and leaves (e,f) of biostimulant-treated tomato plants at three salinity levels. Control treatments without biostimulant (D0, dark colour columns); biostimulant treatments at dosages D2 (0.4 mL L−1 irrigation water, intermediate colour columns); and D4 (0.8 mL L−1, light colour columns). Salinity conditions: non-saline soil (NS), saline soil (S), and very saline soil (VS). Evaluation periods: 30 days and 60 days of treatments. Values are means ± SE (n = 3). Different lowercase letters above the bars indicate significant differences among biostimulant doses for each soil salinity, and different uppercase letters show significant differences among different soil salinity conditions for each biostimulant dose, according to the ANOVA test (p < 0.05). Statistical analyses were performed independently for the two treatment periods.
Agronomy 12 02142 g001
Figure 2. Roots of tomato plants evaluated after 30 days (vegetative development stage) and 60 days (beginning of reproductive development) of treatments in non-saline (NS), saline (S), and very saline (VS) soil, without (control, D0) and with two doses (D2: 0.4 mL L−1 and D4: 0.8 mL L−1) of the BALOX® biostimulant. After 60 days, the amount of root debris collected during root cleaning was higher than at 30 days.
Agronomy 12 02142 g002
Figure 3. Chlorophyll a (a), chlorophyll b (b), and total carotenoid (c) leaf contents of biostimulant-treated tomato plants at three salinity levels. Control treatments without biostimulant (D0: dark colour columns); biostimulant treatments at dosages D2 (0.4 mL L−1 irrigation water, intermediate colour columns); and D4 (0.8 mL L−1, light colour columns). Salinity conditions: non-saline soil (NS), saline soil (S), and very saline soil (VS). Evaluation periods: 30 days and 60 days of treatments. Values are means ± SE (n = 3). Different lowercase letters above the bars indicate significant differences among biostimulant doses for each soil salinity, and different uppercase letters show significant differences among different soil salinity conditions for each biostimulant dose, according to the ANOVA test (p < 0.05). Statistical analyses were performed independently for the two treatment periods.
Agronomy 12 02142 g003
Figure 4. Ion concentration in roots and leaves (in μmol g−1 DW): (a,b) sodium (Na+), (c,d) chloride (Cl), (e,f) potassium (K+), and (g,h) calcium (Ca2+) of biostimulant-treated tomato plants at three salinity levels. Control treatments without biostimulant (D0: dark colour columns); biostimulant treatments at dosages D2 (0.4 mL L−1 irrigation water, intermediate colour columns); and D4 (0.8 mL L−1, light colour columns). Salinity conditions: non-saline soil (NS), saline soil (S), and very saline soil (VS). Evaluation periods: 30 days and 60 days of treatments. Values are means ± SE (n = 3). Different lowercase letters above the bars indicate significant differences among biostimulant doses for each soil salinity, and different uppercase letters show significant differences among different soil salinity conditions for each biostimulant dose, according to the ANOVA test (p < 0.05). Statistical analyses were performed independently for the two treatment periods.
Agronomy 12 02142 g004
Figure 5. Proline (Pro, (a)); total soluble sugar (TSS, (b)); and glycine betaine (GB, (c)) leaf contents of biostimulant-treated tomato plants at three salinity levels. Control treatments without biostimulant (D0: dark colour columns); biostimulant treatments at dosages D2 (0.4 mL L−1 irrigation water, intermediate colour columns); and D4 (0.8 mL L−1, light colour columns). Salinity conditions: non-saline soil (NS), saline soil (S), and very saline soil (VS). Evaluation periods: 30 days and 60 days of treatments. Values are means ± SE (n = 3). Different lowercase letters above the bars indicate significant differences among biostimulant doses for each soil salinity, and different uppercase letters show significant differences among different soil salinity conditions for each biostimulant dose, according to the ANOVA test (p < 0.05). Statistical analyses were performed independently for the two treatment periods.
Agronomy 12 02142 g005
Figure 6. Malondialdehyde (MDA, (a)) and hydrogen peroxide (H2O2, (b)) leaf contents of biostimulant-treated tomato plants at three salinity levels. Control treatments without biostimulant (D0: dark colour columns); biostimulant treatments at dosages D2 (0.4 mL L−1 irrigation water, intermediate colour columns); and D4 (0.8 mL L−1, light colour columns). Salinity conditions: non-saline soil (NS), saline soil (S), and very saline soil (VS). Evaluation periods: 30 days and 60 days of treatments. Values are means ± SE (n = 3). Different lowercase letters above the bars indicate significant differences among biostimulant doses for each soil salinity, and different uppercase letters show significant differences among different soil salinity conditions for each biostimulant dose, according to the ANOVA test (p < 0.05). Statistical analyses were performed independently for the two treatment periods.
Agronomy 12 02142 g006
Figure 7. Total phenolic compound (TPC, (a)) and total flavonoid (TF, (b)) leaf content of biostimulant-treated tomato plants at three salinity levels. Control treatments without biostimulant (D0: dark colour columns); biostimulant treatments at dosages D2 (0.4 mL L−1 irrigation water, intermediate colour columns); and D4 (0.8 mL L−1, light colour columns). Salinity conditions: non-saline soil (NS), saline soil (S), and very saline soil (VS). Evaluation periods: 30 days and 60 days of treatments. Values are means ± SE (n = 3). Different lowercase letters above the bars indicate significant differences among biostimulant doses for each soil salinity, and different uppercase letters show significant differences among different soil salinity conditions for each biostimulant dose, according to the ANOVA test (p < 0.05). Statistical analyses were performed independently for the two treatment periods.
Agronomy 12 02142 g007
Figure 8. Specific activities of superoxide dismutase (SOD, (a)); catalase (CAT, (b)); and glutathione reductase (GR, (c)) in leaf extracts of biostimulant-treated tomato plants at three salinity levels. Control treatments without biostimulant (D0: dark colour columns); biostimulant treatments at dosages D2 (0.4 mL L−1 irrigation water, intermediate colour columns); and D4 (0.8 mL L−1, light colour columns). Salinity conditions: non-saline soil (NS), saline soil (S), and very saline soil (VS). Evaluation periods: 30 days and 60 days of treatment. Values are means ± SE (n = 3). Different lowercase letters above the bars indicate significant differences among biostimulant doses for each soil salinity, and different uppercase letters show significant differences among different soil salinity conditions for each biostimulant dose, according to the ANOVA test (p < 0.05). Statistical analyses were performed independently for the two treatment periods.
Agronomy 12 02142 g008
Figure 9. Graph of the pairwise Spearman’s correlation coefficients calculated for the 27 traits, measured for each dose of the applied biostimulant (D2 and D4) and the control (D0). The circle size and transparency of the circles represented above the diagonal indicate the correlation’s strength, so the larger the circle and the more intense the colour, the stronger the correlation. The blue colour represents a positive correlation (from 0 to 1), and the orange colour represents a negative correlation (0 to −1). The asterisks (*, **, and ***) express significant correlations at p < 0.05, 0.01, and 0.001, respectively. Below the diagonal, the correlation coefficients’ numerical values are shown. Abbreviations: Root fresh weight (RFW), stem fresh weight (SFW), leaf fresh weight (SFW), root water content (RWC), stem water content (RWC), leaf water content (LWC), chlorophyll a (Chl_a), chlorophyll b (Chl_b), total carotenoids (Caros), Na+ concentration in roots and leaves (Na+(r); Na+(l)), Cl concentration in roots and leaves (Cl(r); Cl(l)), K+ concentration in roots and leaves (K+(r); K+(l)), Ca2+ concentration in roots and leaves (Ca2+(r); Ca2+(l)), proline (Pro), total soluble sugars (TSSs), glycine betaine (GB), malondialdehyde (MDA), hydrogen peroxide (H2O2), total phenolic compounds (TPCs), total flavonoids (TFs), superoxide dismutase (SOD), catalase (CAT), and glutathione reductase (GR).
Agronomy 12 02142 g009aAgronomy 12 02142 g009b
Figure 10. Correlation circle of the principal component analysis (PCA) of growth and biochemical parameters in tomato plants (a). The increasing length of the arrow and the intensity of the colour shades, from light green to blue, indicate the increasing contribution of the variables to the definition of the first two principal components. Biplot PCA (b) of the variables of the 27 measured parameters in the plants of the control treatment (D0: without biostimulant) and the biostimulant-treated plants (D2: 0.4 mL L−1 irrigation water, D4: 0.8 mL L−1) in three salinity conditions: non-saline soil (NS), saline soil (S), and very saline soil (VS) and two evaluation periods: vegetative development 30 days and beginning of reproductive development 60 days. The percentages of total variability explained by the first two components are shown (in parentheses) on the X and Y axes, respectively. Abbreviations: Root fresh weight (RFW), stem fresh weight (SFW), leaf fresh weight (SFW), root water content (RWC), stem water content (RWC), leaf water content (LWC), chlorophyll a (Chl_a), chlorophyll b (Chl_b), total carotenoids (Caros), Na+ concentration in roots and leaves (Na+(r); Na+(l)), Cl concentration in roots and leaves (Cl(r); Cl(l)), K+ concentration in roots and leaves (K+(r); K+(l)), Ca2+ concentration in roots and leaves (Ca2+(r); Ca2+(l)), proline (Pro), total soluble sugars (TSSs), glycine betaine (GB), malondialdehyde (MDA), hydrogen peroxide (H2O2), total phenolic compounds (TPCs), total flavonoids (TFs), superoxide dismutase (SOD), catalase (CAT), and glutathione reductase (GR).
Agronomy 12 02142 g010
Table 1. Physicochemical characterisation of the soil before starting the treatments.
Soil CharacteristicsNon-Saline (NS)Saline (S)Very Saline (VS)
pH7.677.717.88
ECe (dS m−1)2.777.9912.44
EC1:5 (dS m−1)0.431.321.74
Na+ (meq L−1)1.202.635.20
K+ (meq L−1)7.8312.6718.22
Ca2+ (meq L−1)0.921.571.75
Mg2+ (meq L−1)15.3038.5342.31
Sand (%)27.0022.5028.10
Clay (%)35.2036.5035.90
Silt (%)37.841.036.0
ECe: electrical conductivity of the saturated paste extract; EC1:5 electrical conductivity at a ratio of 1:5 (soil: water).
Table 2. Electrical conductivity (EC1:5) of pot soils at transplanting (0 days) and after 30 days (vegetative development) and 60 days (beginning of reproductive development) of treatment, under three soil salinity conditions: NS, non-saline soil; S, saline soil; VS, very saline soil. The values shown are means ± SE (n = 9).
EC1:5 (dS m−1)NSSVS
0 days (start of treatment)0.51 ± 0.001.50 ± 0.011.71 ± 0.01
30 days (end of period 1 *)0.46 ± 0.021.49 ± 0.081.59 ± 0.07
60 days (end of period 2 **)0.56 ± 0.061.52 ± 0.011.98 ± 0.03
* Vegetative development; ** Onset of reproductive development.
Publisher’s Note: MDPI stays neutral with regard to jurisdictional claims in published maps and institutional affiliations.

