Article

Effect of Chlorella vulgaris on the Growth and Phytochemical Contents of “Red Russian” Kale (Brassica napus var. Pabularia)

1
Smart Farm Research Center, KIST Gangneung Institute of Natural Products, 679, Saimdang-ro, Gangneung 25451, Korea
2
Department of Bio-Medical Science & Technology, Korea Institute of Science and Technology (KIST) School, University of Science and Technology, Seoul 02792, Korea
3
Natural Product Informatics Center, KIST Gangneung Institute of Natural Products, Gangneung 25451, Korea
*
Author to whom correspondence should be addressed.
Agronomy 2022, 12(9), 2138; https://doi.org/10.3390/agronomy12092138
Submission received: 18 August 2022 / Revised: 31 August 2022 / Accepted: 6 September 2022 / Published: 8 September 2022
(This article belongs to the Topic Biostimulants in Agriculture)

Abstract

:
Kale is a prominent leafy vegetable because of its high content of bioactive compounds and various health benefits. Microalgae have been suggested as a biostimulator that can replace chemical fertilizers by enhancing crop yield and supporting soil carbon sequestration. In this study, the effect of Chlorella vulgaris as a plant biostimulant on the growth and secondary metabolite contents of “Red Russian” kale (Brassica napus var. Pabularia) with green leaves and purple veins has been demonstrated. Three Chlorella treatments were used: CS, C. vulgaris suspension; CB, C. vulgaris biomass; and CFS, filtered C. vulgaris-free supernatant. The plant growth rates, phytochemical contents, and individual glucosinolate and anthocyanin contents were determined. There was no significant difference under the CS and CB treatments, while CFS negatively influenced on kale growth with 37% reduction of dried weight. In contrast, metabolite production differed according to Chlorella treatments. Total contents of chlorophyll and carotenoid were increased by 1.57 and 1.41 folds by CS treatment, whereas total contents of phenol and flavonoids were enhanced by 1.30 and 1.22 folds by CFS treatment. Totally, seven glucosinolates and four anthocyanins were characterized and quantified individually. Notably, CFS treatment increased gluconasturtiin and all anthocyanins the most, 10.28-fold and 5.90-fold, respectively.

1. Introduction

Kale, a popular leafy vegetable grown worldwide, is primarily classified as Brassica oleracea, with some cultivars classified as Brassica napus [1]. Kale occurs in several varieties, including green, dwarf, marrow-stem, bore, curled leafy, scotch, tree, and tronchuda kales, and their size and nutritional range vary based on the variety and growth conditions [2]. This plant has been traditionally used as a garnish but is becoming prominent as the main ingredient because of public awareness that it is one of the healthiest foods [1]. This is because kale is rich in fiber, minerals, prebiotic carbohydrates, unsaturated fatty acids, and vitamins [2]. For instance, kale has the highest potassium concentration (4.16–1350 mg·100 g−1) among all vegetables cultivated in temperate regions [2]. In addition, it is much higher in protein than other members of the Brassica family of vegetables, although protein concentrations on a fresh weight basis vary more than that on a dry weight basis [3]. The vitamin C content of kale is 62.27–969 mg·100 g−1, which is higher than that of all other leafy green vegetables and meets the recommended dietary allowance (RDA) for both males and females [4]. Kale is also rich in flavonoids, such as quercetin (44–139 mg·100 g−1) and kaempferol (58–537 mg·100 g−1), which have various biological properties, including antioxidant, anti-inflammatory, antimicrobial, anti-diabetic, and anti-carcinogenic activities [5]. The health benefits of Brassica plants are primarily attributed to sulfur-containing compounds called glucosinolates [6]. The glucosinolate concentration of kale is 2.25–93.90 μmol·g−1 (dry weight basis), which is comparable to that of other Brassica plants. Based on these targeted analyses, the health benefits of kale may be related to its high content of health-promoting phytochemicals, such as glucosinolates, polyphenols, and carotenoids [6]. Moreover, kale has been shown to have various health benefits, including a protective function in coronary artery disease, anti-inflammatory activity, antigenotoxic ability, gastroprotective activity, inhibition of carcinogenic compound formation, positive effects on gut microbes, and antimicrobial activity against specific microorganisms [2].
Chemical fertilizers increase agricultural output by providing readily accessible nutrients to plants; however, their overuse can be detrimental to the environment and their use implies a price increase, which limits the economic viability of agricultural products [7,8]. A potential way to reduce these problems is to use microorganism inoculation to enhance soil fertility; microalgae may be valuable in this regard [9]. Microalgae are a large class of microscopic, primarily photosynthetic organisms [10]. They can grow both in marine and freshwater environments and can also be cultivated on wastewater, reducing production costs [11]. Commercially available microalgal species include Arthrospira spp., Chaetoceros spp., Chlorella spp., Dunaliella spp., and Isochrysis spp., of these, the most common industrially cultivated and used microalgal species are Arthrospira spp. and Chlorella spp. [11]. Microalgae have several potential applications owing to their rapid growth rates, adaptability to environmental conditions, and high production of biochemical compounds [10]. The potentials of eukaryotic microalgae as substitutes for conventional feedstuffs, dietary supplements, nutraceuticals, and pharmaceuticals have been investigated [10]. Recently, the potential of microalgae as plant biostimulants in agriculture has been widely recognized. A plant biostimulant is any substance or microorganism administered to plants to enhance their nutrient use efficiency, stress tolerance, and/or other desirable qualities, regardless of the nutrients they contain [12]. In crop fields, microalgae increase soil fertility and contribute to plant development, reducing the reliance on chemical pesticides and fertilizers. Microalgae favor soil nutrient cycling and stimulate plant growth by increasing nutrient utilization, producing bioactive compounds such as phytohormones, establishing root associations, or protecting plants from pests and pathogens. Additionally, microalgae can affect photosynthetic carbon dioxide fixation to promote carbon capture, and several microalgae release exopolysaccharides that enhance soil structure [13].
Chlorella vulgaris is a green alga widely found in freshwater, oceanic, and geostationary environments [10]. It has a high photosynthetic ability and the potential to develop rapidly under autotrophic, mixotrophic, and heterotrophic conditions [14]. Owing to these characteristics, it was among the first microalgae to be regarded for large-scale cultivation and commercialization [15]. Moreover, numerous beneficial components, including essential amino acids, dietary fibers, minerals, proteins, bioactive compounds, chlorophylls, and antioxidants, are present in C. vulgaris [16]. Owing to its high nutritional value, various studies have highlighted the tremendous potential of C. vulgaris. Several biochemical components derived from C. vulgaris have been investigated for their use in therapeutics, pharmaceuticals, cosmetics, aquaculture, biofuel production, food industry, and agriculture [10]. In particular, the abundant amino acids in C. vulgaris can serve as chelating agents and phytosiderophores that facilitate the transfer of micronutrients through different plant parts [17]. C. vulgaris may also increase crop yield and growth by improving the aeration and moisture-holding capacity of the soil. These findings suggest that replacing chemical fertilizers with C. vulgaris can enhance agricultural productivity while reducing the environmental impact [10].
To date, Chlorella in agricultural applications have normally relied on changes in growth parameters. These things considered, Chlorella extract or culture has lately been applied as a biological control agent against pathogenic microorganisms and fungi in a variety of agricultural crops, such as strawberry, beet, lettuce and kale [18]. Nonetheless, it was relatively rare to observe changes in metabolites, specifically valuable compounds from plants. Moreover, large amounts of supernatant are produced after industrial Chlorella cultivation, and its disposal can be costly and environmentally hazardous. For instance, 150 tons of Chlorella supernatant is thrown away to produce 10,000 tons of biodiesel annually [19]. Recently, it has been attempted to use industrial waste supernatants in agriculture and horticulture to lessen the reliance on chemical pesticides and genetic modification [20]. Therefore, this study also aimed to examine the utilization of the residual culture fluid after C. vulgaris cultivation for eco-friendly circulation between agriculture and Chlorella cultivation. By recycling supernatants, our findings will contribute to expanding Chlorella’s agricultural applications.
In the present study, the potential of C. vulgaris as a biostimulant for improving crop yield and nutritional value of kale was investigated. A cultivar of kale with green leaves and purple veins, “Red Russian” kale (B. napus var. Pabularia), was used in this study. The plants were subjected to three different Chlorella treatments: (i) C. vulgaris suspension containing both biomass and media (CS); (ii) C. vulgaris biomass (obtained by centrifugation of cultures) resuspended in distilled water (CB); and (iii) filtered C. vulgaris-free supernatant obtained after the biomass was removed (CFS). After treatment, the total bioactive compounds, such as flavonoids, phenolics, chlorophylls, and carotenoids, were determined using spectrophotometric methods. Furthermore, the changes in individual glucosinolate and anthocyanin contents were determined using high-performance liquid chromatography (HPLC) and ultra-high performance liquid chromatography mass spectrometry (UPLC-MS) analyses.

2. Materials and Method

2.1. Reagents and Chemicals

HPLC-grade acetonitrile and water were purchased from Daejung Chemicals & Metals (Siheung, Korea). Barium acetate, lead (II) acetate, formic acid, glucotropaeolin potassium salt, and sulfatase from Helix pomatia (Type H-1, ≥10,000 unit/g sulfatase solid) were purchased from Sigma-Aldrich (St. Louis, MO, USA). DEAE-Sephadex A-25 anion-exchange resin was purchased from Cytiva (Marlborough, MA, USA).

2.2. Plant Materials

The experiment was carried out using commercial “Red Russian” kale plants (Asia Seed Co., Ltd., Seoul, Korea) in an automatically controlled hydroponic plant factory (Smart U-FARM) and greenhouse at the Korea Institute of Science and Technology (KIST, Gangneung, Korea). Kale seeds were sown in moist rockwool cubes (l × b × h, 25 × 25 × 40 mm; Grodan Co., Roermond, The Netherlands) and placed under 200 ± 11 μmol·m2·s−1 light intensity, 25 cm from the fluorescent lamps (TL5 14 W/865; Philips, Amsterdam, The Netherlands) in a 14:10 h light:dark cycle at 18–26 °C and 50–80% relative humidity in closed and controlled cultivation conditions in the Smart U-FARM. Fifteen days after sowing, kale plants with two true leaves and similar growth rates were selected and transplanted to a cultivation box (l × b × h, 23.0 × 64.3 × 16.5 cm) filled with artificial soil containing 51.5% cocopeat, 10% peatmoss, 15% perlite, 13% vermiculite, 10% zeolite, 0.1% humic acid, and 0.4% manure (Hanul Bio, Goesan, Korea). Kale plants were then grown in the greenhouse. During the cultivation period in the greenhouse, the mean temperature and relative humidity during the day were 22.6 ± 3.6 °C and 40.1 ± 15.7%, and during the night were 18.4 ± 2.3 °C and 38.8 ± 11.9%, respectively. In addition, daily light integral in the greenhouse was 35.6 mol·m−2·d−1.The experimental trials consisted of four replications for each treatment and a control in a completely randomized design.

2.3. C. vulgaris Growth and Preparation of Chlorella Stock Solutions

C. vulgaris (AG20696) was obtained from the Korean Collection for Type Cultures (KCTC), Korea Research Institute of Bioscience and Biotechnology (Jeongeup, Republic of Korea). C. vulgaris cells were cultivated in 2 L glass bottles in a growth chamber at 24 ± 2 °C and 200 μmol·m−2·s−1 light intensity using the BG-11 culture medium. The growth curve of C. vulgaris was shown in Figure 1. Fresh Chlorella culture at day 7 (the end of exponential phase) with a cell density of approximately 1 × 10⁷ cells·mL−1 was used for treatment and further preparation Chlorella stock solutions.
The treatments and their descriptions are presented in Table 1. Fresh Chlorella cultures were used as Chlorella suspensions (CS) without any other processing. Chlorella cultures were centrifuged at 3500 rpm for 20 min at 4 °C to separate Chlorella biomass and supernatant from the fresh Chlorella cultures. To prepare the Chlorella biomass (CB), the Chlorella biomass was resuspended in 5 mL distilled water and sonicated at 30% amplification (two cycles at 30 s on and 30 s off), and then dissolved in 2 L of distilled water. The supernatant was used as 
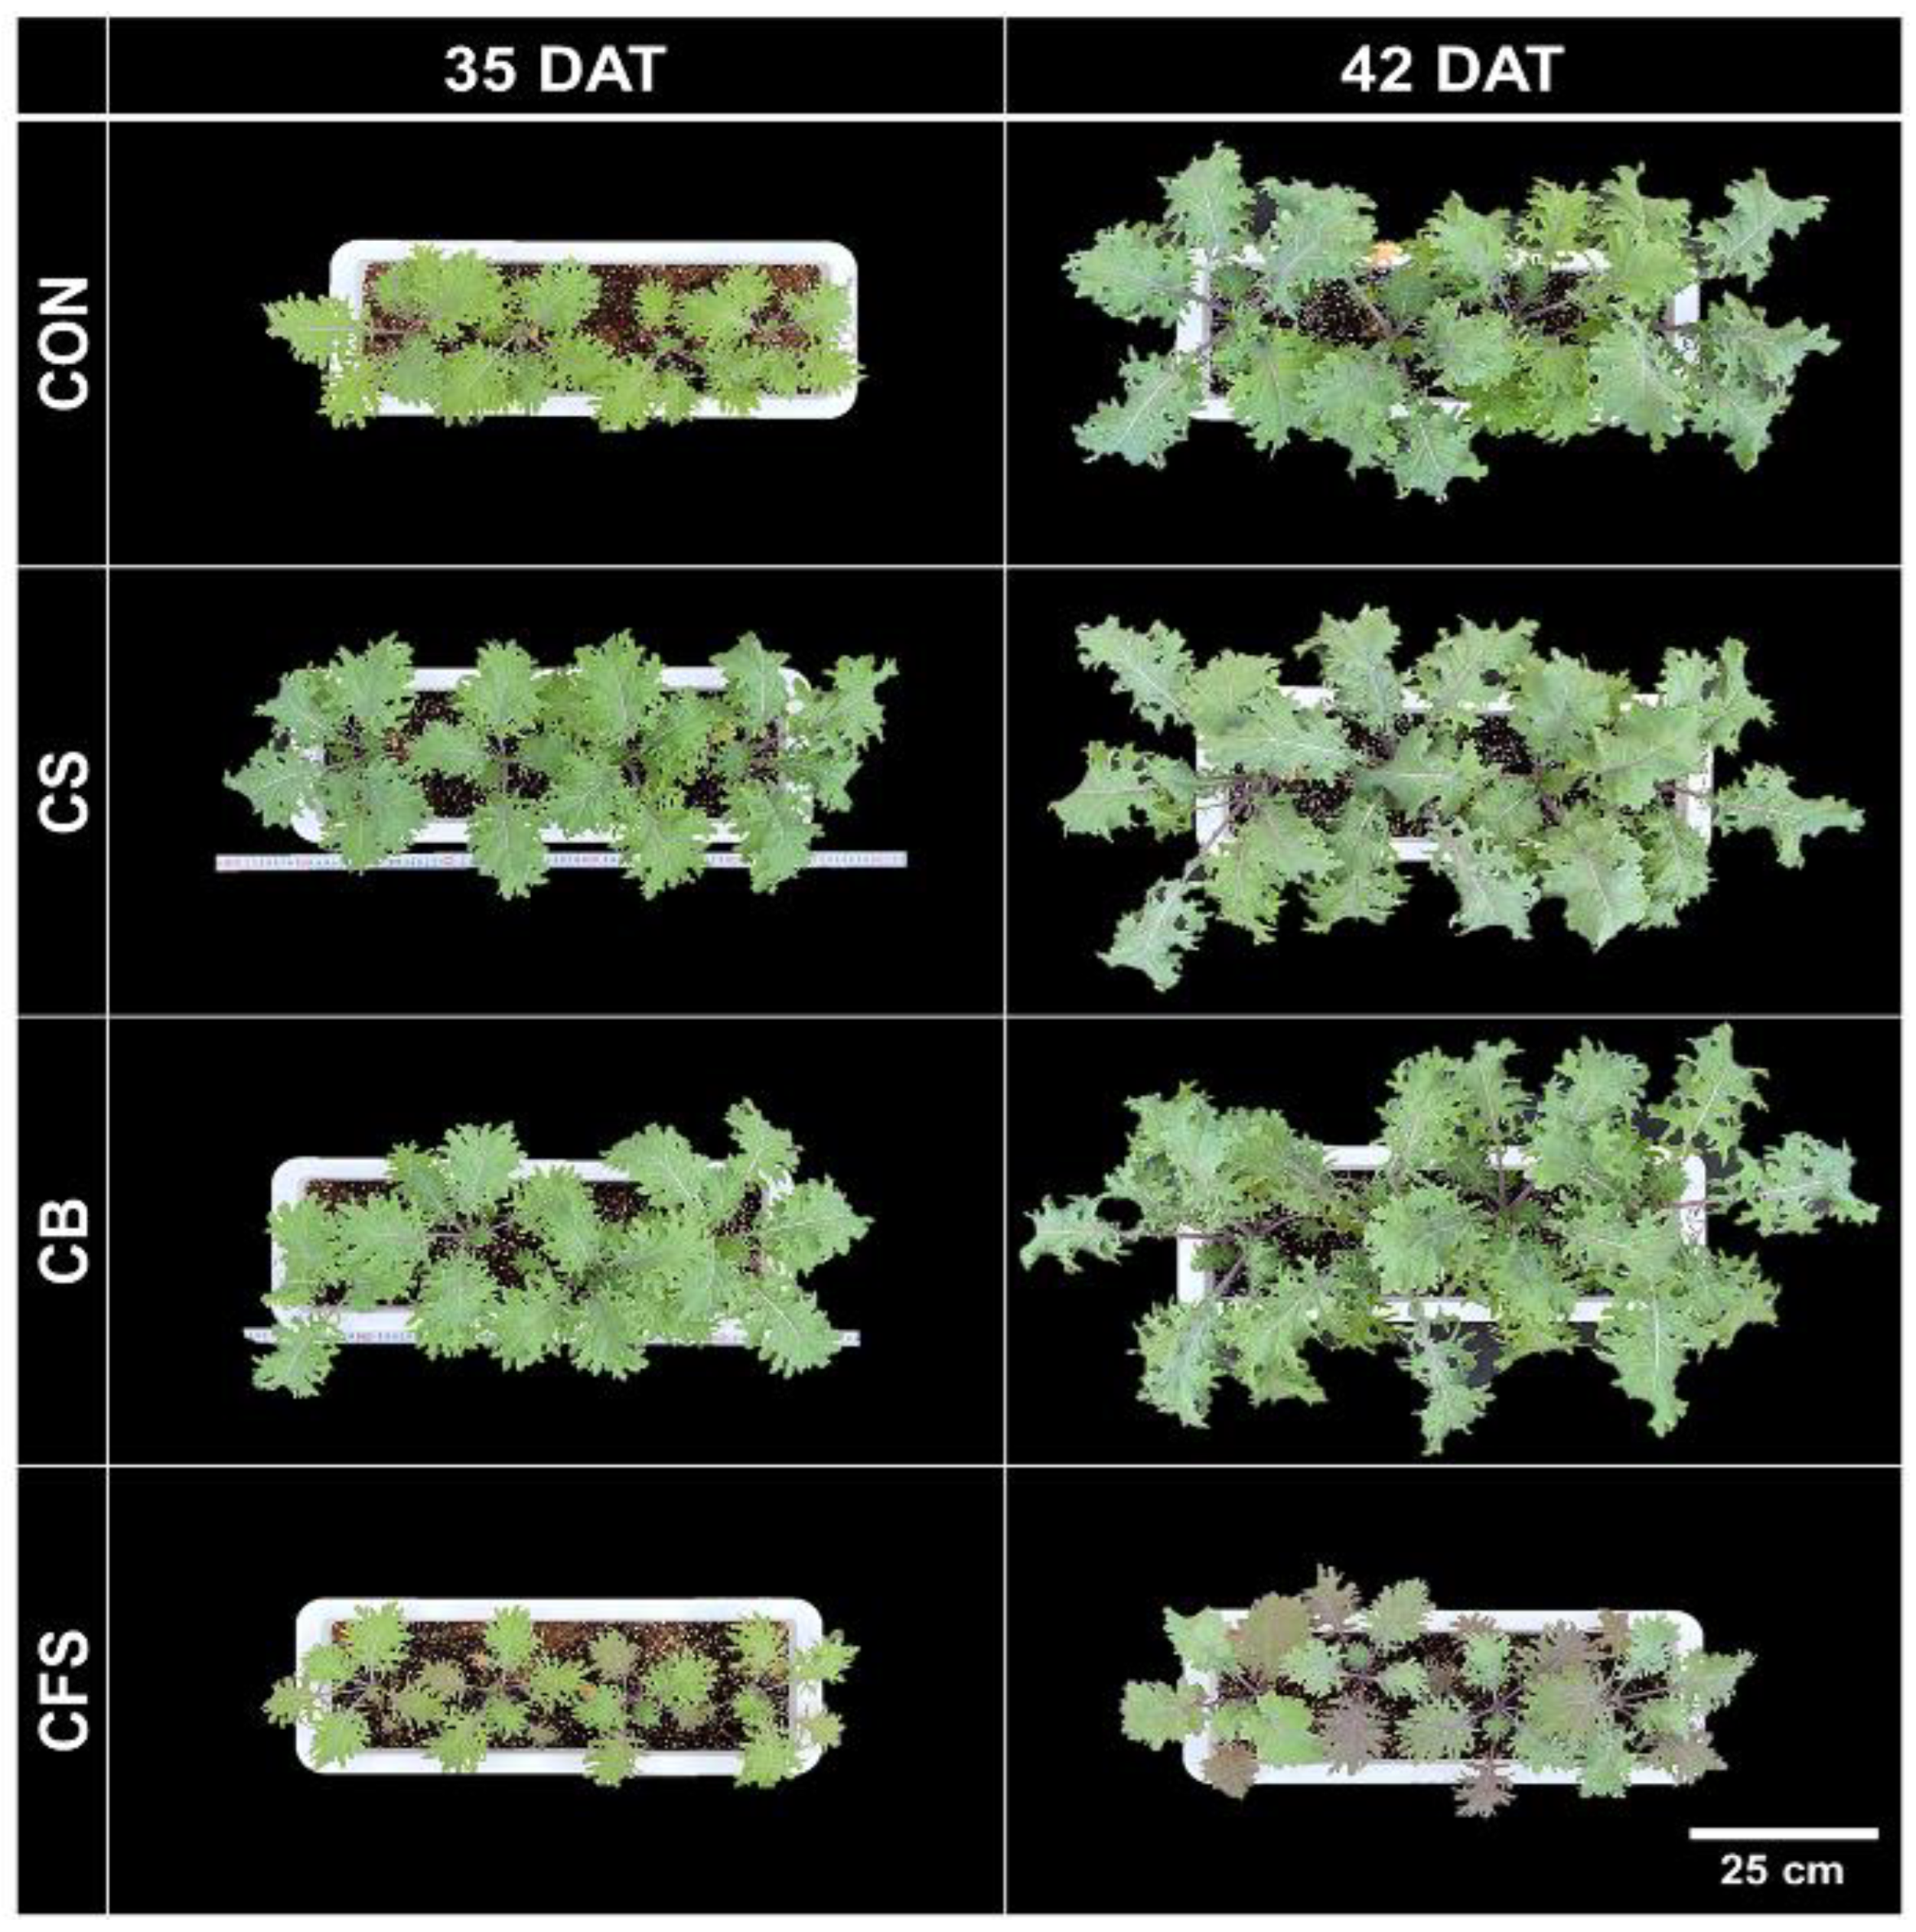
Chlorella-free supernatant (CFS) after further filtration through a 0.45 μm syringe filter. Subsequently, each solution was used as a foliar spray at 50× and 100× dilutions to wet the adaxial and abaxial sides of “Red Russian” kale leaves once a week. The control plants were sprayed with distilled water. Three biological replicates each were harvested 35 and 42 days after transplantation (DAT).

2.4. Analysis of Mineral Contents from Chlorella Treatments

Nutrients, including ammonia (NH4), nitrate (NO3), bicarbonate (HCO3), and chloride, were determined using a Skalar SAN++ Autoanalyzer (Skalar Analytical B.V., Breda, The Netherlands). Other nutrients such as K, Ca, Mg, S, P, Na, Si, Fe, Mn, Zn, B, Cu, and Mo were estimated using an inductively coupled plasma-optical emission spectrometer (ICP-OES; PerkinElmer Optima 8300, PerkinElmer, Inc., Waltham, Massachusetts, USA). The pH and electrical conductivity (EC) of the Chlorella stock solutions and their dilutions (1:50 and 1:100, v/v) were determined using a multi-parameter meter (PC220; Horiba Scientific, Kyoto, Japan).

2.5. Measurement of Phytochemicals

Freeze-dried samples (20 mg) of kale subjected to different Chlorella treatments were used to prepare the extract. Samples were extracted in 2 mL of aqueous methanol (90%, v/v) by sonication at 25 °C for 1 h. After centrifugation at 3500 rpm for 20 min and filtration, a clear supernatant was obtained and used for further analysis.
Total phenolic content was determined using the Folin-Ciocalteu spectrophotometric method [21]. To 1500 μL of distilled water, 100 μL of extract and 100 μL of Folin-Ciocalteu reagent were added, and the mixture was incubated for 5 min. Then, 300 μL of the sodium carbonate solution (7.5%, v/v) was added and mixed well. After incubation for 1 h at 25 °C, the absorbance was measured at 765 nm. Gallic acid was used to prepare a calibration curve (25–250 μg·mL−1, R2 = 0.9995), and the final results were expressed as milligrams of gallic acid equivalents per gram of sample on a dry weight (DW) basis.
Total flavonoid content was determined using the aluminum chloride colorimetric method [22]. First, 150 μL of the extract was mixed with 450 μL of aqueous ethanol (95%, v/v), 30 μL of aluminum chloride solution (10%, w/v), 30 μL of potassium acetate (1 M, w/v), and 600 μL of distilled water. Subsequently, after incubation for 40 min at 25 °C, absorbance was measured at 415 nm. Quercetin was used to prepare the calibration curve (25–100 μg·mL−1, R2 = 0.9995), and the total flavonoid content was expressed as milligrams of quercetin equivalent per gram of sample on a dry weight basis.
Pigments, such as chlorophylls and carotenoids, were obtained from kale subjected to Chlorella treatments using a previously reported method [23]. The quantification of chlorophyll a (Chl a), chlorophyll b (Chl b), and carotenoids in certain whole-pigment extracts primarily depend on the solvent system. Absorbance was measured at 665.2, 652.4, and 470 nm for Chl a, Chl b, and carotenoids, respectively. As described above, 90% of methanol was used to extract and the concentrations of the pigments were calculated using solvent-specific equations:
C h l   a   ( μ g · m L 1 ) = 16.82 × A 665.2 9.28 × A 652.4
C h l   b   ( μ g · m L 1 ) = 36.92 × A 652.4 16.54 × A 665.2
C a r o t e n o i d   ( μ g · m L 1 ) = ( 1000 × A 470 1.91 × C h l   a 95.15 × C h l   b ) / 225

2.6. Desulfo-Glucosinolate Preparation

Glucosinolates were extracted from red kale using a previously described method. Briefly, 100 mg of each sample was extracted using 1 mL of methanol (70%, v/v). The samples were then heated at 75 °C for 20 min. The extract was collected by centrifugation at 5000 rpm for 15 min at 4 °C. The extraction was repeated once with 1 mL of methanol (70%, v/v). All supernatants were pooled. One milliliter of supernatant was transferred into a new tube containing 150 µL of a mixture of lead (II) acetate (1 M, w/v) and barium acetate (1 M, v/v), and 20 µL of 1 mg·mL−1 glucotropaeolin (internal standard). After vortexing, the mixture was centrifuged at 10,000 rpm for 10 min at 4 °C. The supernatant was collected and loaded on a DEAE-Sephadex A-25 column (Bio-Rad, USA). A Poly-Prep column was loaded with 0.5 mL of DEAE-Sephadex A-25 anion-exchange resin pre-activated with sodium acetate (0.1 M, w/v, pH 5.5). Finally, 200 µL of purified sulfatase type H-1 enzyme was added to the column before closing it with an end cap and tip closure. After incubation for 16 h at 25 °C, the desulfoglucosinolates (dsGSLs) were eluted using 1 mL ultrapure water.

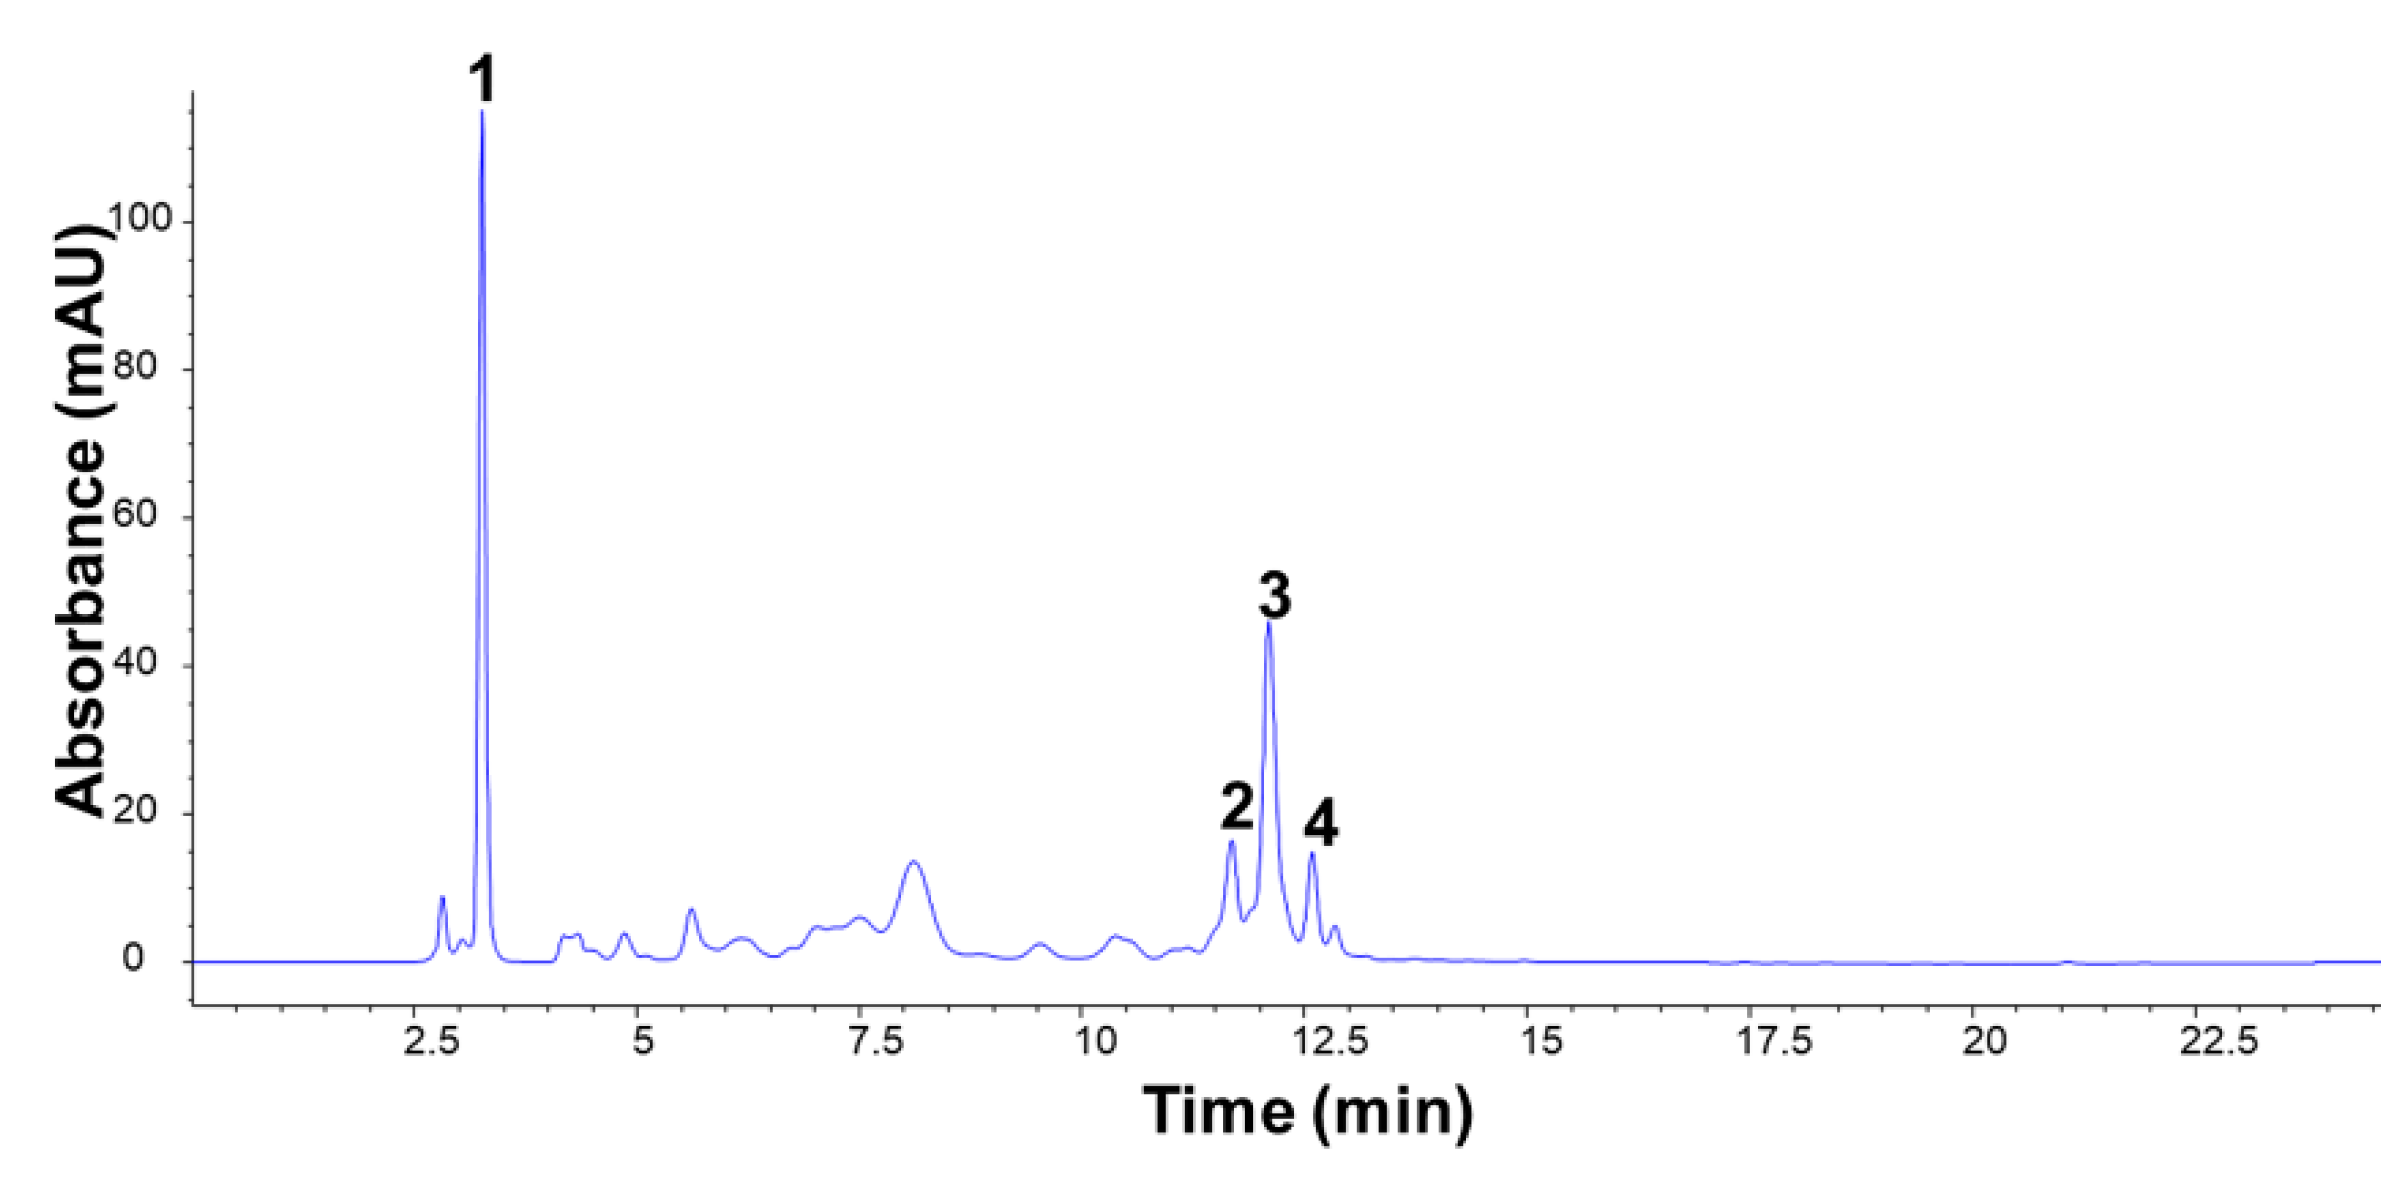
2.7. Identification of dsGSL and Quantification of Glucosinolates in “Red Russian” Kale

The dsGSL quantification was performed using a HPLC-diode array detector (DAD) analysis. The analysis was conducted using an HPLC 1200 series system (Agilent Technologies, Sata Clara, CA, USA) equipped with an ODS-AQ C18 column (4.6 mm × 150 mm, ID × L; 5 µm; YMC, Kyoto, Japan) set at 35 °C. Mobile phases were 0.1% formic acid in water (solvent A) and 0.1% formic acid in acetonitrile (solvent B). The injected sample volume and flow rate were 20 µL and 0.7 mL·min−1, respectively. The gradient program was adjusted linearly between the following ratios of solvent A and solvent B (A: B ratio): 100:0 (v/v) for 1 min, 65:35 (v/v) for 16 min, 35:65 (v/v) for 20 min, 0:100 (v/v) for 22 min, and 0:100 (v/v) for 30 min. Post operation was performed for 5 min. The dsGSLs were detected using a DAD detector at a wavelength of 229 nm. The dsGSLs were identified using UPLC-MS analysis (Shimadzu, Kyoto, Japan) in the positive electrospray ionization (ESI) mode. The full-scan spectra ranged from m/z 70–1000. An ISO standard method with an internal standard was used to calculate the content of individual GSL in red kale samples using the relative response factor at 229 nm [24].
d s G S L   μ m o l g = R R F × A r e a d s G S L A r e a I S × n m × 1000 × H
Here RRF is the relative response factor of the dsGSL to the internal standard, glucotropaeolin. A r e a d s G S L is the area of dsGSL, A r e a I S is the corresponding area of the internal standard, glucotropaeolin, n is the quantity of glucotropaeolin calculated in micromoles per mL, m is the biomass of the sample (mg), and H is the efficiency of desulfation of the internal standard.

2.8. Anthocyanin Analysis

Anthocyanins were extracted and determined as previously described, with several modifications [25]. To prepare the crude anthocyanin extracts, 100 mg of freeze-dried samples were extracted using 2 mL of aqueous solvent (equal volume for 0.1 M HCl and 95% ethanol). After 1 h of incubation at 60 °C, centrifugation and filtration were carried out, and the eluate was used for further analysis.
Chromatographic separation was conducted using an Agilent 1200 series HPLC system (Agilent Technologies, Santa Clara, California, USA) with a DAD detector. The HPLC conditions were set as follows: an analytical CAPCELL PAK C18 (MGII) column (4.6 mm × 250 mm ID × L; 5 µm; Osaka Soda, Japan) was used, and the column temperature was maintained at 40 °C. The injection volume and UV length were set at 20 μL and 520 nm (16 nm interval), respectively. Mobile phase A consisted of 0.05% trifluoroacetic acid (TFA) in water (v/v), whereas mobile phase B consisted of 0.05% of TFA in acetonitrile (v/v). The elution gradient was as follows: 20% B for 5 min, 20–25% B for 3 min, 25–35% B for 5 min, and 100% B for 7 min, at a flow rate of 0.8 mL·min−1. The spectral data were observed in the 190–600 nm range. MS analysis was performed in the positive ionization mode using an Agilent 1290 Infinity UPLC system (Agilent, USA) with a Bruker micrOTOF-Q II MS equipped with an ESI ion source (Bruker Daltonics, Billerica, Massachusetts, USA) to characterize the individual anthocyanins in red kale. Other conditions included: nebulizer pressure, 11.6 psi; nitrogen dry gas flow rate, 7.0 mL·min−1; dry temperature, 200 °C; capillary voltage, 4.5 kV; end plate offset, 500 V. Aglycones were quantified on the basis of external standards of cyanidin-3-glucoside, in the concentration range of 2.5–20 μg·mL−1.

2.9. Statistical Analysis

All assays were carried out in triplicate, and the values are expressed as mean ± standard deviation (SD). The data were processed using IBM SPSS Statistics 26. One-way analysis of variance (ANOVA) followed by Duncan’s multiple range tests were performed to identify significant differences at p < 0.05.

3. Results

3.1. Mineral Contents and Physicochemical Characteristics of Chlorella Treatment

To investigate the effects of Chlorella treatment on the mineral content and physiochemical traits of kale, macro- and microelements, pH values, and EC levels were measured from each Chlorella stock solution. In total, eight macroelements (NH4, NO3, HCO3, K, Ca, Mg, S, and P) and nine microelements (Na, Si, Cl, Fe, Mn, Zn, B, Cu, and Mo) were analyzed, and their contents varied among Chlorella stock solutions. As shown in Table 2, nitrogen sources, such as ammonia and nitrate, exhibited different results depending on the type of Chlorella stock solution, with ammonia being found only in CB and nitrate being found only in CS. Bicarbonate was highest in CS, followed by CFS and CB. Potassium, a macroelement that primarily influences plant growth, was most abundant in CS, followed by CB and CFS. Unlike potassium, phosphorus was present at trace levels and was not detectable in CFS. The concentrations of other elements, such as calcium, magnesium, and sulfur, were in the following order: CS, CFS, and CB. Most of the microelements were present in all stock solutions. However, salty elements, including sodium and chloride, were significantly high in CFS and CS. Compared with CB, the sodium contents in CFS and CS were 4.47- and 1.69-fold higher, whereas the chloride contents were 9.34- and 9.19-fold higher, respectively.
A comparison of the EC levels of the stock solutions revealed that CFS had the highest EC, followed by CS and CB, corresponding to their mineral content. However, all EC levels from dilutes (50× and 100×) were much lower than that in the control (41.70 ± 0.21 μS·cm−1). Similarly, the pH values of the diluents were not significantly different from that of the control. Therefore, it is considered that the mineral content and physicochemical characteristics of Chlorella stock solutions had no impact on the changes in the growth and metabolism of kale.

3.2. Plant Growth

After “Red Russian” kale plants were exposed to each Chlorella treatment, changes in their phenotype were observed at 35 DAT and 42 DAT. As shown in Figure 2, the CS and CB treatments increased growth relative to the control at 35 DAT. However, the phenotypes of the control, CS-, and CB-treated groups were similar at 42 DAT. Furthermore, in the CFS-treated group, plant growth was reduced compared with the control at both 35 and 42 days after transplantation (DAT).
To estimate the effect of the Chlorella treatments, three growth parameters were measured: fresh and dried weights of shoots and the number of leaves. Similar results were observed for the fresh and dried weights of the kale plants. At 42 DAT, 100× CB (78.72 ± 3.57 and 6.23 ± 0.55 g/plant), 100× CS (73.28 ± 7.93 and 6.07 ± 0.74 g/plant), and control (72.32 ± 3.31 and 6.20 ± 0.22 g/plant) showed the highest fresh and dried weights, respectively. Furthermore, a higher growth rate was observed in 50× CB between 35 and 42 DAT (5.5- and 5.4-fold increase in fresh and dried weights, respectively), but the fresh weight of 50× CB (57.02 ± 5.10 g/plant) was lower than that of 100× CB (Figure 3A,B). Kale plants treated with 100× CS had the highest number of leaves at 35 (10.33 ± 0.58) and 42 (12.33 ± 0.58) DAT. However, kale plants treated with 50× (8.67 ± 0.58) and 100× CFS (8.00 ± 0.00) showed the lowest number of leaves at 42 DAT (Figure 3C).

3.3. Effect of Chlorella Treatments on Phytochemical Content

Phytochemical analyses revealed the amount of phenolics, flavonoids, chlorophylls, and carotenoids produced in kale in response to different Chlorella treatments (Figure 4). The total phenolic and total flavonoid contents showed similar patterns based on the time points. At 35 DAT, none of the 50× Chlorella treatments caused any significant change in total flavonoid and total phenolic contents, but the contents decreased when treated with 100× CS and CB. However, when treated with 100× CFS, both compounds tended to increase. At 42 DAT, the total flavonoid and total phenolic contents improved compared to the control when CFS or a 50× CS was applied. Regardless of the concentration, CFS treatment resulted in an increase in the total chlorophyll content at 35 DAT, and CS treatment led to a statistically significant difference at 42 DAT, compared with the control. At both CFS concentrations at 42 DAT, the total carotenoid content was unaffected. However, treatment with 50× CB and CS or 100× CS increased the total carotenoid content.

3.4. Effect of Chlorella Treatments on Glucosinolate Contents in “Red Russian” Kale

To assess the effect of Chlorella treatments on individual glucosinolate content, the levels of glucosinolates in kale exposed to different Chlorella treatments were identified and analyzed using HPLC (Figure 5). Seven glucosinolates, including four indole glucosinolates (hydroxyglucobrassicin, glucobrassicin, methylglucobrassicin, and neoglucobrassicin), two aliphatic glucosinolates (progoitrin and gluconapin), and one aromatic glucosinolate (gluconasturtiin), were eluted and separated individually in the HPLC chromatogram based on the retention time (Table 3).
Among the seven glucosinolates, progoitrin and glucobrassicin were predominant in “Red Russian” kale, comprising approximately 34% and 38% of the total glucosinolate content, respectively. The results showed that various Chlorella treatments induced comparative differences in glucosinolate contents. As shown in Figure 6A, CS and CFS, which contained the supernatant of the Chlorella cultures, significantly increased the content of glucobrassicin and neoglucobrassicin. Treatment with 50× CS enhanced glucobrassicin content by 2.53-fold (3.98 ± 1.65 μmol·g−1 dry weight (DW)), while treatment with 100× CFS improved glucobrassicin content by 3.10-fold (4.87 ± 2.52 μmol·g−1 DW) at 42 DAT. However, the other two indole glucosinolates, hydroxyglucobrassicin and methylglucobrassicin, did not differ significantly at 42 DAT. Treatment with Chlorella biomass, such as CS and CB treatments, slightly increased the contents of aliphatic glucosinolates (Figure 6B). For instance, at 42 DAT, gluconapin increased nearly 1.37-fold (1.25 ± 0.21 μmol·g−1 DW) and 1.38-fold (1.26 ± 0.43 μmol·g−1 DW) at 50× and 100× concentrations of CS, respectively. Interestingly, gluconasturiin, an aromatic glucosinolate found in kale, showed the highest rate of increase among the glucosinolates at 42 DAT when exposed to CFS treatments only (Figure 6C). Specifically, the amount of gluconasturtiin was increased by 8.08-fold (2.02 ± 0.21 μmol·g−1 DW) and 10.28-fold (2.57 ± 1.07 μmol·g−1 DW), respectively, at 42 DAT when kale was subjected to 50× and 100× concentrations of CFS.

3.5. Effect of Chlorella Treatments on Anthocyanin Content in “Red Russian” Kale

Based on the UV-visible spectra, retention time, exact mass, and fragmentation patterns obtained from UPLC-MS analysis in this study, as well as comparisons with previously published data on red-colored kale, four major anthocyanins were characterized in “Red Russian” kale (Figure 7 and Table 4). The anthocyanins identified were in cyanidin-based forms: cyanidin 3-(feruloyl)-diglucoside-5-glucoside, cyanidin 3-(sinapoyl)(p-coumaroyl)-diglucoside-5-glucoside, cyanidin 3-(sinapoyl)(sinapoyl)-diglucoside-5-glucoside, and cyanidin 3-(sinapoyl)-triglucoside-5-glucoside.
The contents of the four main anthocyanins displayed similar patterns depending on the harvest point and concentration (Figure 8). After 50× Chlorella treatment, the levels of all four anthocyanins were higher than those of the control at 35 DAT. However, the 100× CS and CB treatments had no effect on the anthocyanin contents at 35 DAT. Furthermore, the anthocyanin content was significantly improved when plants were treated with a 100× rather than a 50× concentration of CFS. At 42 DAT, all compounds showed the highest increase rate, approximately 4.42- to 5.90-fold increase compared with the control, when treated with 100× CFS. Specifically, 100× CFS treatment enhanced cyanidin 3-(feruloyl)-diglucoside-5-glucoside by 5.90-fold (448.43 ± 38.69 μg·g−1 DW), cyanidin 3-(sinapoyl)(p-coumaroyl)-diglucoside-5-glucoside by 4.42-fold (137.76 ± 15.18 μg·g−1 DW), cyanidin 3-(sinapoyl)(sinapoyl)-diglucoside-5-glucoside by 5.14-fold (335.49 ± 38.27 μg·g−1 DW), and cyanidin 3-(sinapoyl)-triglucoside-5-glucoside by 5.86-fold (88.86 ± 18.50 μg·g−1 DW), compared with the control. Even when 50× CFS was added, the anthocyanin content increased by 2.89–5.08-fold. In addition, after 50× CS treatment, the levels of all anthocyanins except cyanidin 3-(sinapoyl)-triglucoside-5-glucoside wasslightly elevated at 42 DAT. This result can be attributed to the inclusion of the medium after Chlorella cultivation in CS. According to these findings, CFS treatment had an obvious effect on anthocyanin accumulation in “Red Russian” kale. In addition, it was revealed that treatment with 100× CFS rather than 50× CFS was better for anthocyanin production. Therefore, it is assumed that the unidentified substances or factors present specifically in CFS may have contributed to the rise in anthocyanin content in “Red Russian” kale.

4. Discussion

Recently, agrochemical industries and farmers have become interested in microalgae because of its potential as a biostimulant and biofertilizer [11]. Microalgae extracts have demonstrated numerous biostimulant activities on plant species such as lettuce, tomato, sugar beet, and wheat, enhancing their germination and nutrient uptake, influencing biomass yield, allowing root trait appearance, and improving abiotic stress resistance [26]. The presence of primary metabolites, essential amino acids, vitamins, and osmolytes has been related to the biostimulant activity of microalgal extracts [27]. Notably, phytohormone-like compounds, i.e., compounds like auxins, cytokinins, gibberellins, abscisic acid, and brassinosteroids, have been identified in several microalgal strains from the Charaphyceae, Chlorophyceae, Trebouxiophyceae, and Ulvophyceae families [11]. Microalgal extracts rich in natural phytohormones, especially auxins and cytokinins, are considered crucial for enhancing plant growth, yield, and abiotic stress tolerance, and could increase the potential for microalgal value creation [11]. Numerous studies have suggested various putative direct and indirect mechanisms for the beneficial properties of microalgae-based biostimulants, including (i) biochemical (upregulation of chlorophyll and carotenoid biosynthesis) and physiological responses (delayed senescence), (ii) high expression of essential genes associated with the primary and secondary metabolism of plants, and (iii) activation of microbiomes (mycorrhizae and rhizobacteria) through the rhizosphere [28].
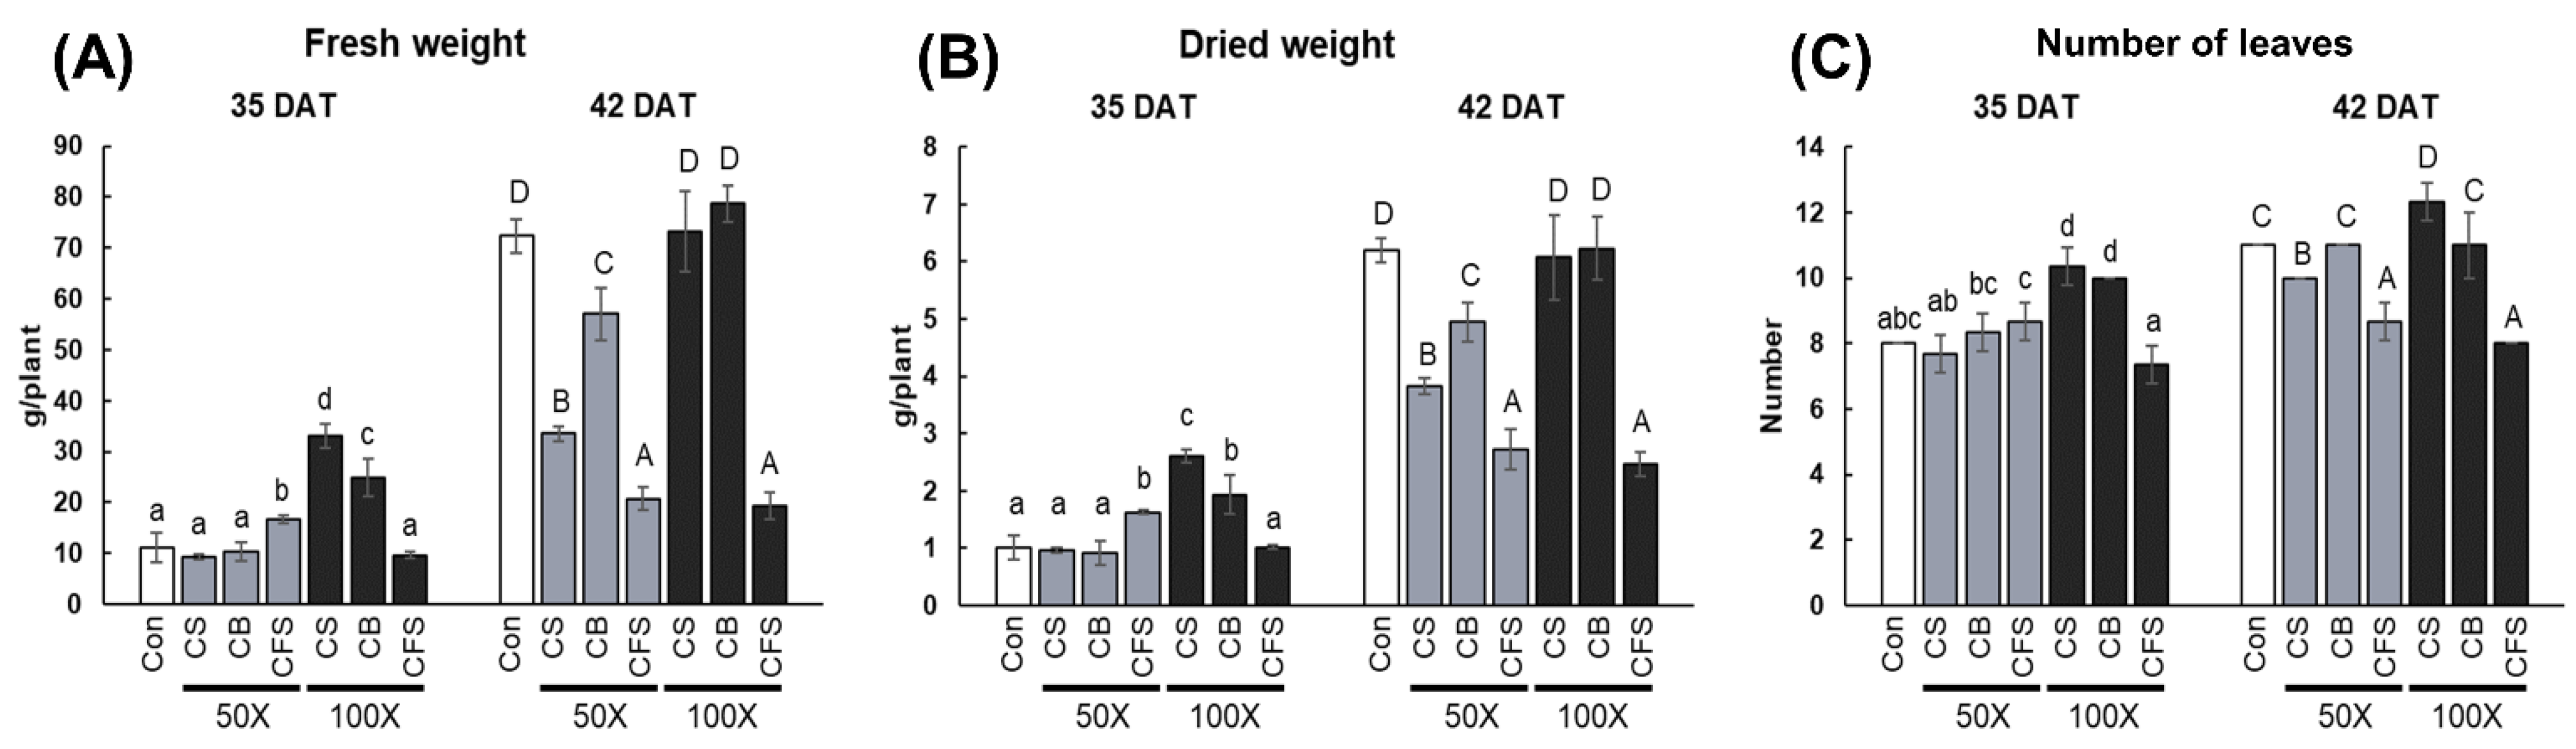
In the present study, the impact of different C. vulgaris treatments on the physiology and secondary metabolism of “Red Russian” kale have been demonstrated. Contrary to expectations, treatment with Chlorella had no discernible impact on kale growth. When exposed to CS and CB, no statistically significant difference in kale growth was observed. Furthermore, compared with the control plants at 42 DAT, treatment with CFS inhibited plant growth, regardless of the concentration used. This result contradicts most of the previously reported findings. For instance, foliar biostimulation with cyanobacteria, such as Microcystis aeruginosa, Anabaena spp., and Chlorella spp., significantly enhanced growth performance in willow (Salix viminalis L.) plants [29]. Moreover, adding C. vulgaris to the culture medium or soil markedly improved the germination, fresh and dry weights of seedlings, and pigment content of lettuce. The most effective treatments were 2 and 3 g dry alga kg−1 soil [30]. The impact of externally applying C. vulgaris aqueous extract in different concentrations on the growth and productivity of wheat plants (Triticum aestivum L.) has also been examined previously. The study demonstrated that applying a 50% (v/v) concentration of C. vulgaris extract to the leaves once (25 days after sowing) was ideal and that it increased wheat growth yield and weight gain by 140% and 40%, respectively [17]. Previous findings have shown that soil inoculation or extract application consistently improve plant growth and performance, and individual plant responses differ depending on the microalgal strain, application method, and experimental procedure [13]. Therefore, further research on optimizing the conditions for improving the growth and quality (in terms of phytochemical content) of “Red Russian” kale using Chlorella is essential before using Chlorella as a biostimulant for kale production.
Currently, industrial Chlorella growth is focused on cell production, and culture supernatants are discarded. Large quantities of supernatant are obtained throughout Chlorella cultivation, and its removal can be costly and environmentally harmful [18]. Moreover, biomolecules naturally secreted into the filtrate and possibly acting as plant growth promoters could enhance plant growth when exposed to aqueous media excluding cells but including extracellular substances [9]. Waste Chlorella supernatants may be used in agriculture to promote plant growth while addressing economic and environmental issues [20]. Recently, the effects of the culture medium remaining after Chlorella cultivation on plant growth and other responses were determined [18,20,31]. Previous findings investigated the D-lactic acid, which is secreted in the C. fusca supernatant as a defense-priming substance in higher plant’s innate immune system [18]. The effects of using 
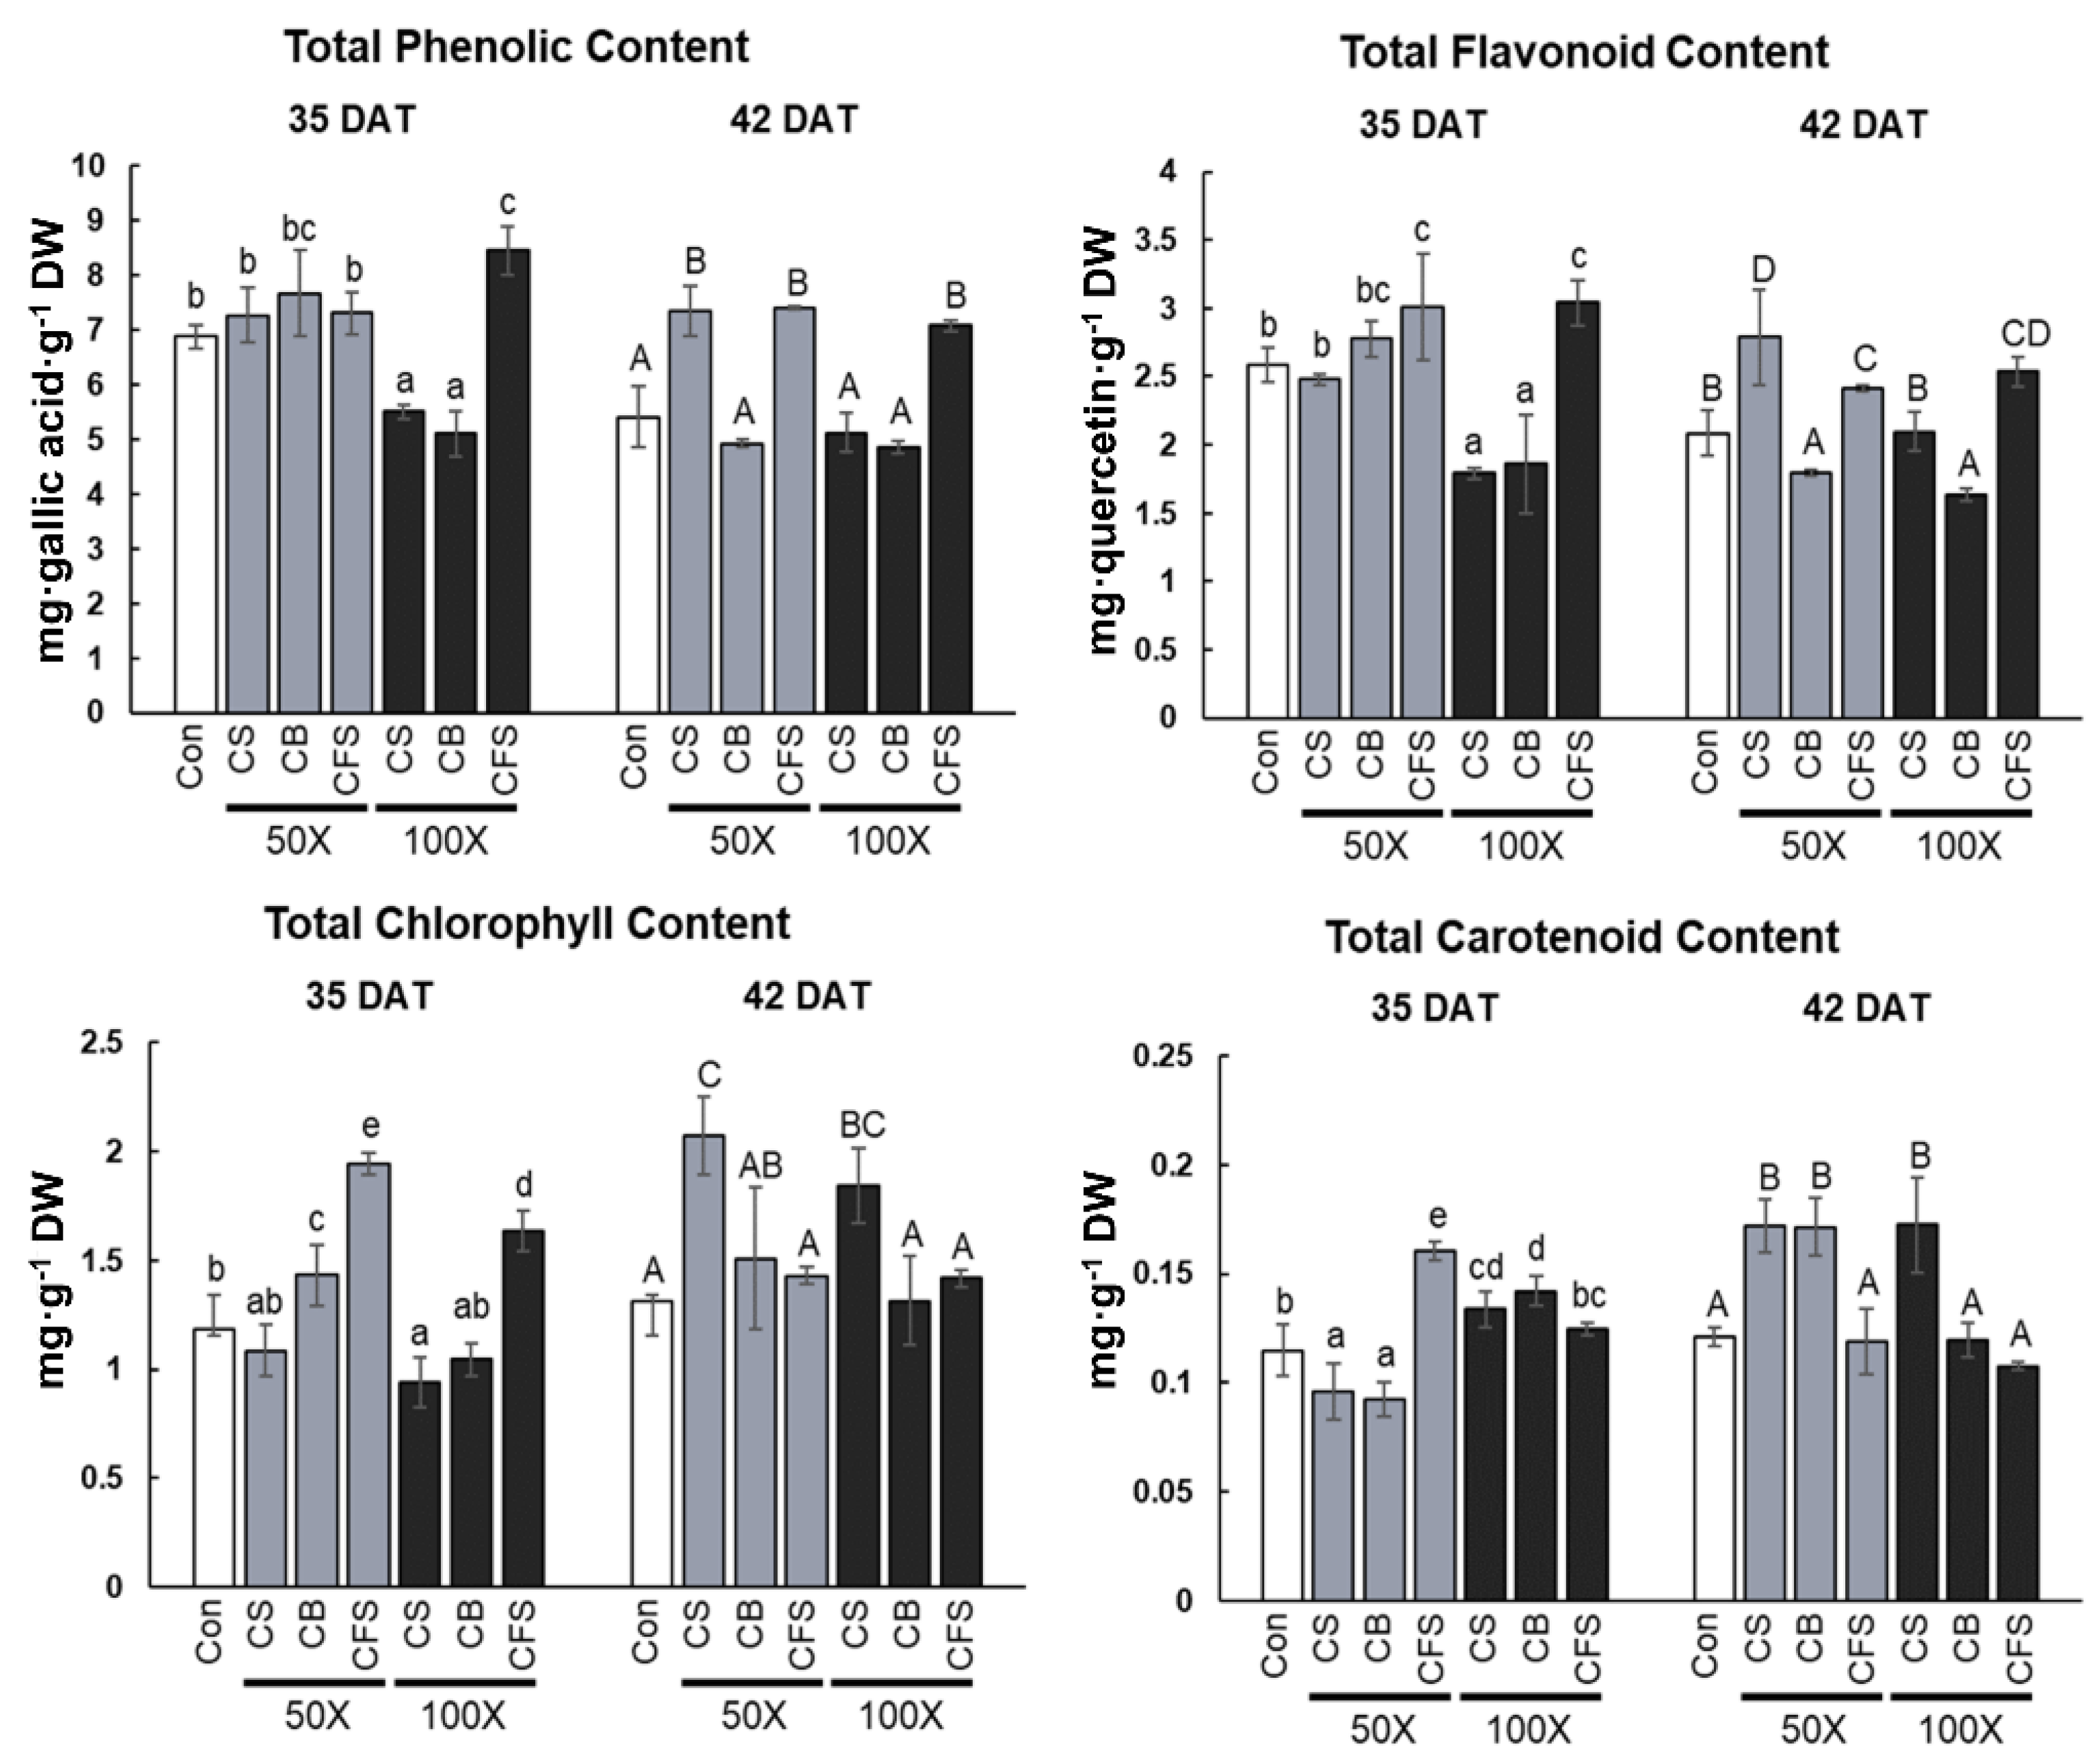
Chlorella supernatant (CFS treatment) were also assessed in the present study to screen for effects on physiological and metabolic changes in “Red Russian” kale. Our findings showed that total phenolic and total flavonoid contents were highest in “Red Russian” kale under CFS treatment, irrespective of the concentration used during the entire cultivation period. In addition, chlorophyll and carotenoid contents were highest after 50× CFS treatment and at 35 DAT, whereas CS containing both Chlorella biomass and culture medium significantly increased the chlorophyll and carotenoid contents at 42 DAT, compared with the control. Similarly, the chlorophyll content of lettuce seedlings was improved by adding fresh and dry C. vulgaris as soil additives [30]. Microalgae are promising tools that have been used for increasing the production of various phytochemicals, particularly natural medicinal products [32,33]. Despite these efforts, relevant knowledge is still scarce.
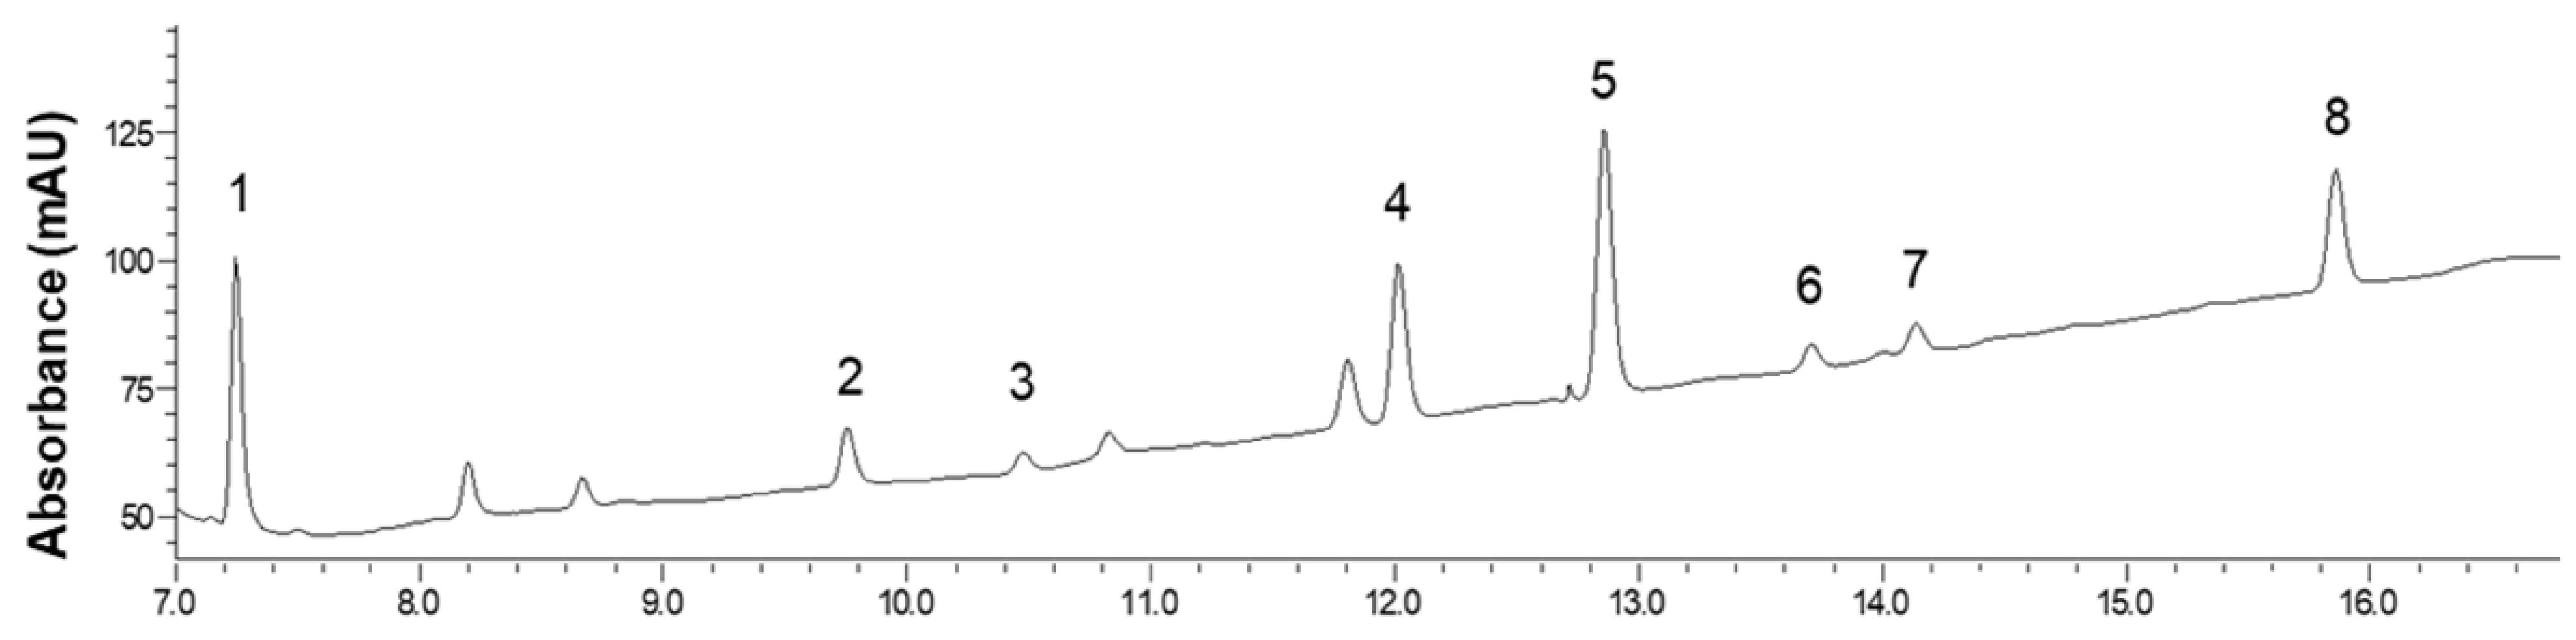
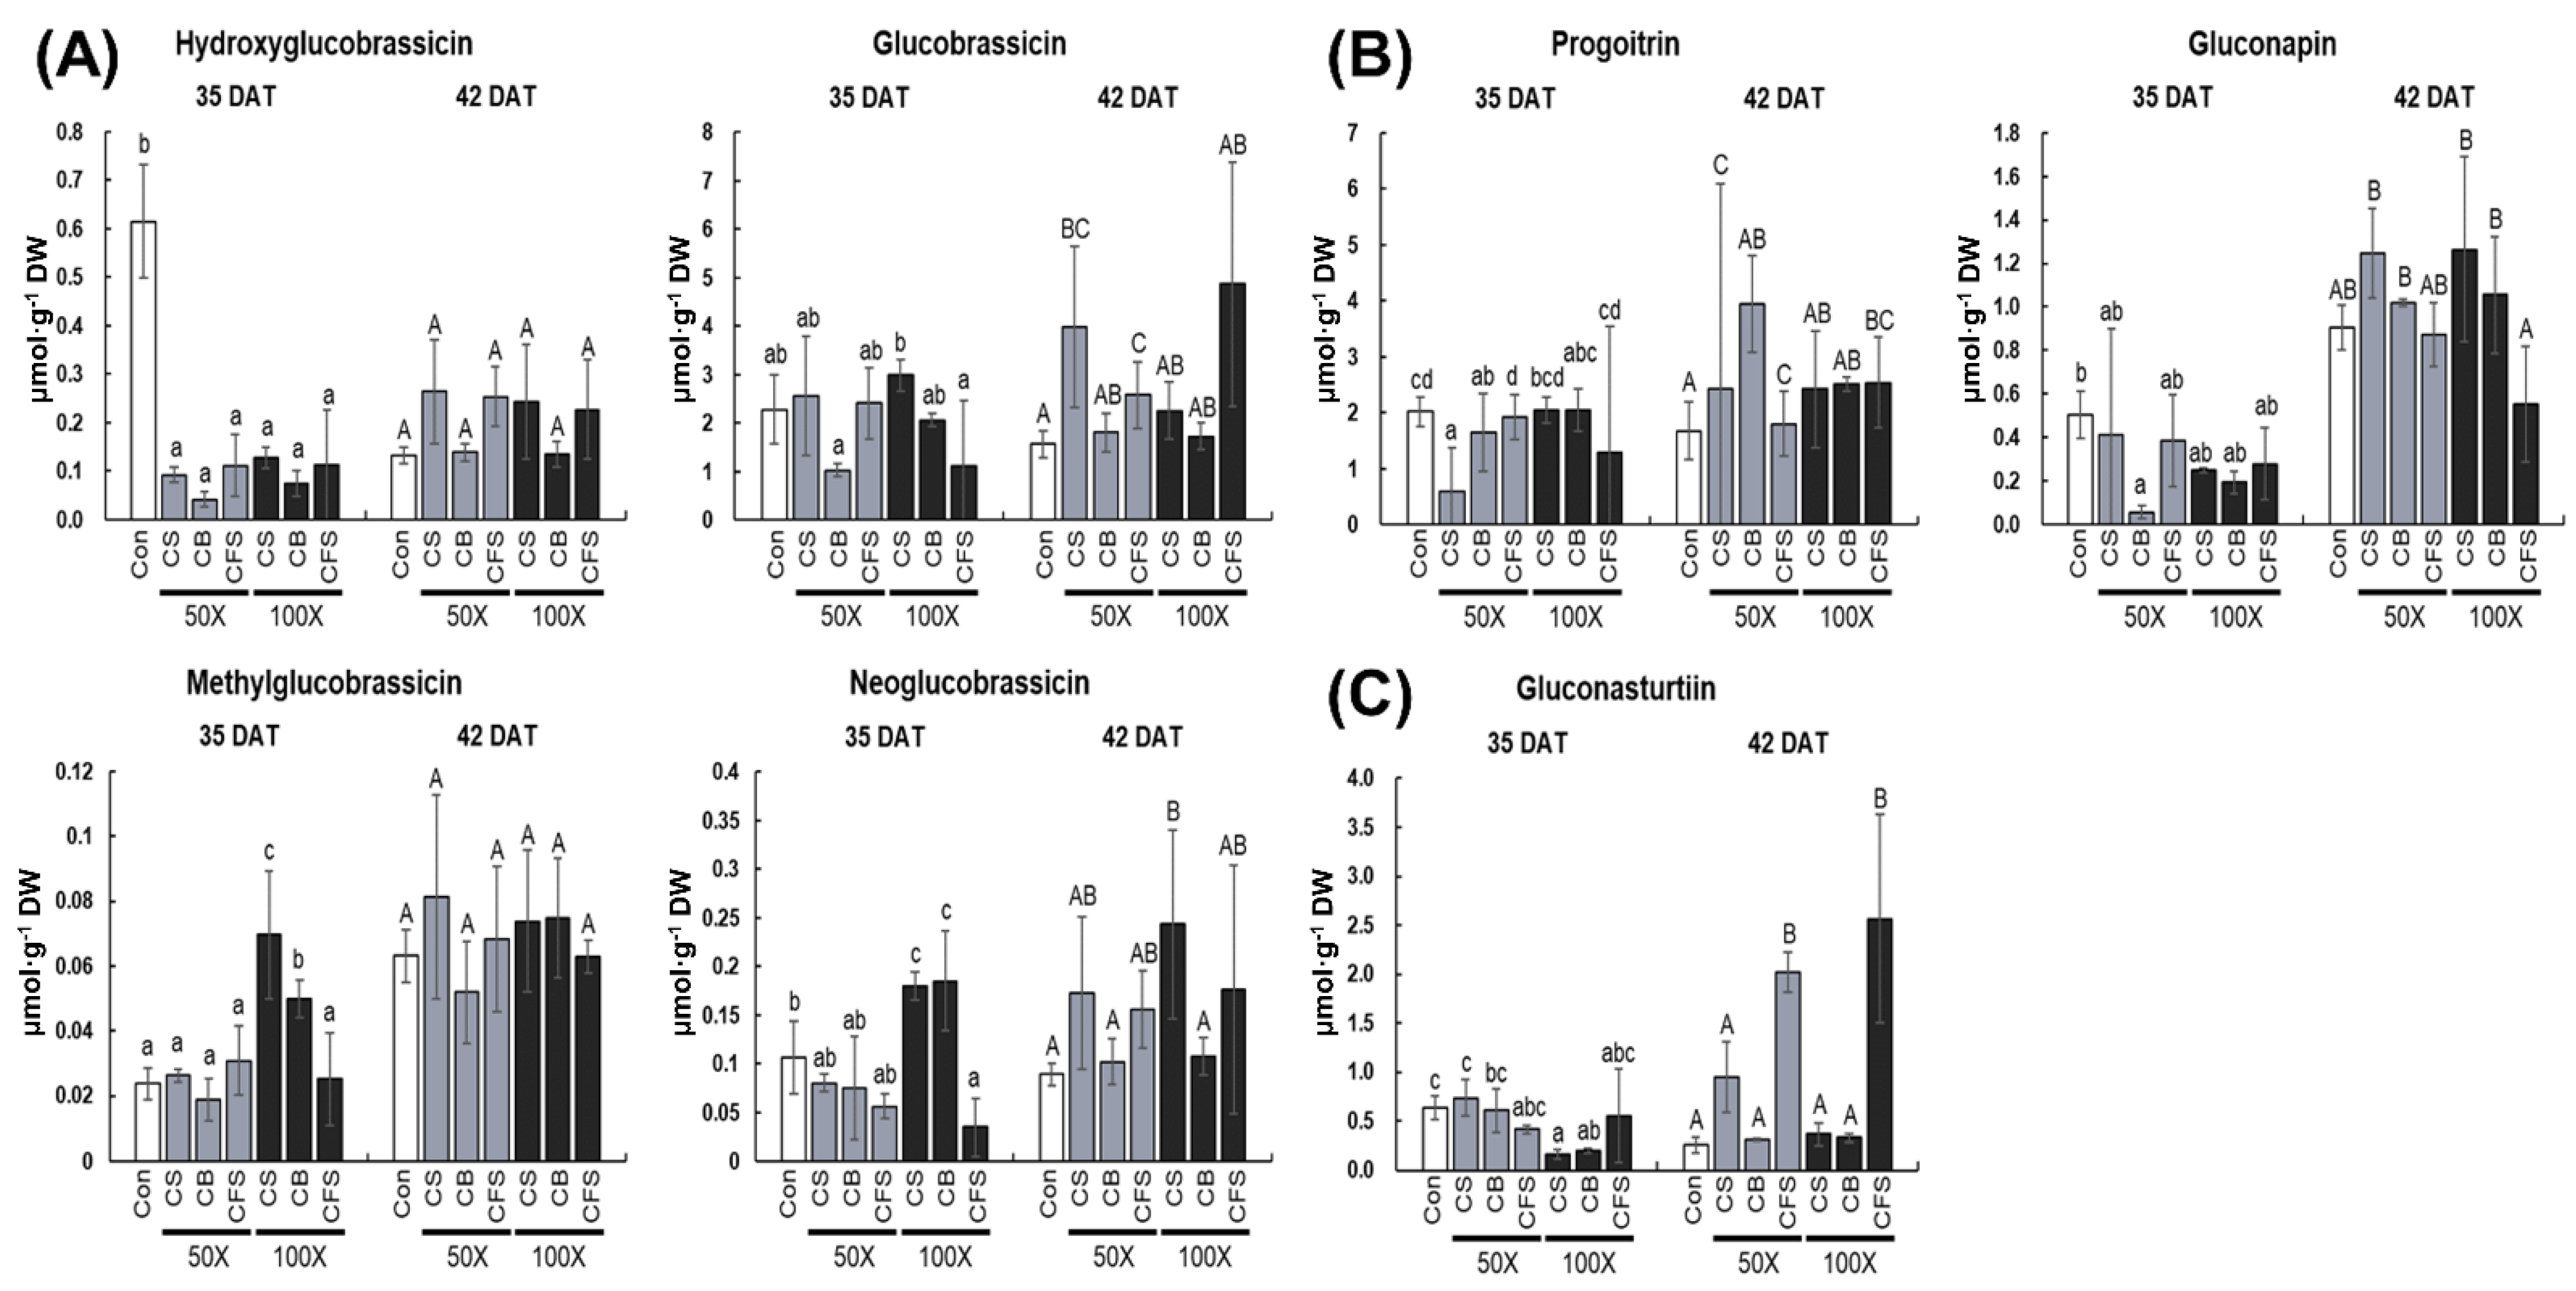
To date, approximately 200 different natural glucosinolates have been identified in Brassica vegetables [6]. Based on the different sources of side chain amino acid precursors, glucosinolates can be divided into three groups: aliphatic glucosinolates, indole glucosinolates, and aromatic glucosinolates [34]. Aliphatic glucosinolates are primarily derived from methionine, whereas indole and aromatic glucosinolates are derived from tryptophan and phenylalanine, respectively [35]. Each kind of cruciferous vegetable exhibits a distinctive glucosinolate profile that contains more than 10 different glucosinolates in each species or variety, although only three to four are dominant [6]. In this study, seven glucosinolates, including four indole, two aliphatic, and one aromatic glucosinolate were identified. Of these, glucobrassicin and progoitrin were predominant in “Red Russian” kale. Previously, glucobrassicin was found to be the most abundant indole glucosinolate in American, Spanish, Polish, Norwegian, and Korean kale varieties [6]. In general, the principal aliphatic glucosinolates in kale are sinigrin, glucoiberin, and glucoraphanin. Previous studies have also shown that progoitrin is predominant in “Red Russian” kale [6,36]. Based on the available literature, kale does not have noticeably higher levels of glucosinolates than other Brassica plants; therefore, numerous studies have examined the effect of various elicitation factors, such as phytohormones, salt, heavy metals, and carbohydrates, on glucosinolate accumulation [6,37]. Our findings revealed that some indole glucosinolates and aromatic glucosinolates were affected by CS and CFS, respectively, but aliphatic glucosinolates did not respond to Chlorella treatments. The presence of glucosinolates is thought to be the result of two distinct processes: inducer-mediated induction of glucosinolate biosynthesis and myrosinase-mediated hydrolysis [38]. Sayed Ahmed et al. have investigated the effect of Chlorella suspension on the expression levels of major genes related to glucosinolate biosynthesis and glucosinolate content in Eruca sativa [39]. It has been shown that key genes, including methylthioalkylmalate synthase 1, myeloblastosis transcription factor 34, myeloblastosis transcription factor 51, and SUPERROOT 1, exhibited the highest expression levels at 4 g·L−1 Chlorella spp. Suspension (seed soaking and foliar spray), which corresponded to the glucosinolate content. The biotic elicitor is an efficient method to enhance glucosinolate content, except for aromatic glucosinolate in Brassicaceae sprouts [40]. Interestingly, aromatic glucosinolate content increased considerably in CFS-treated “Red Russian” kale; however, its mode of action is still unknown.
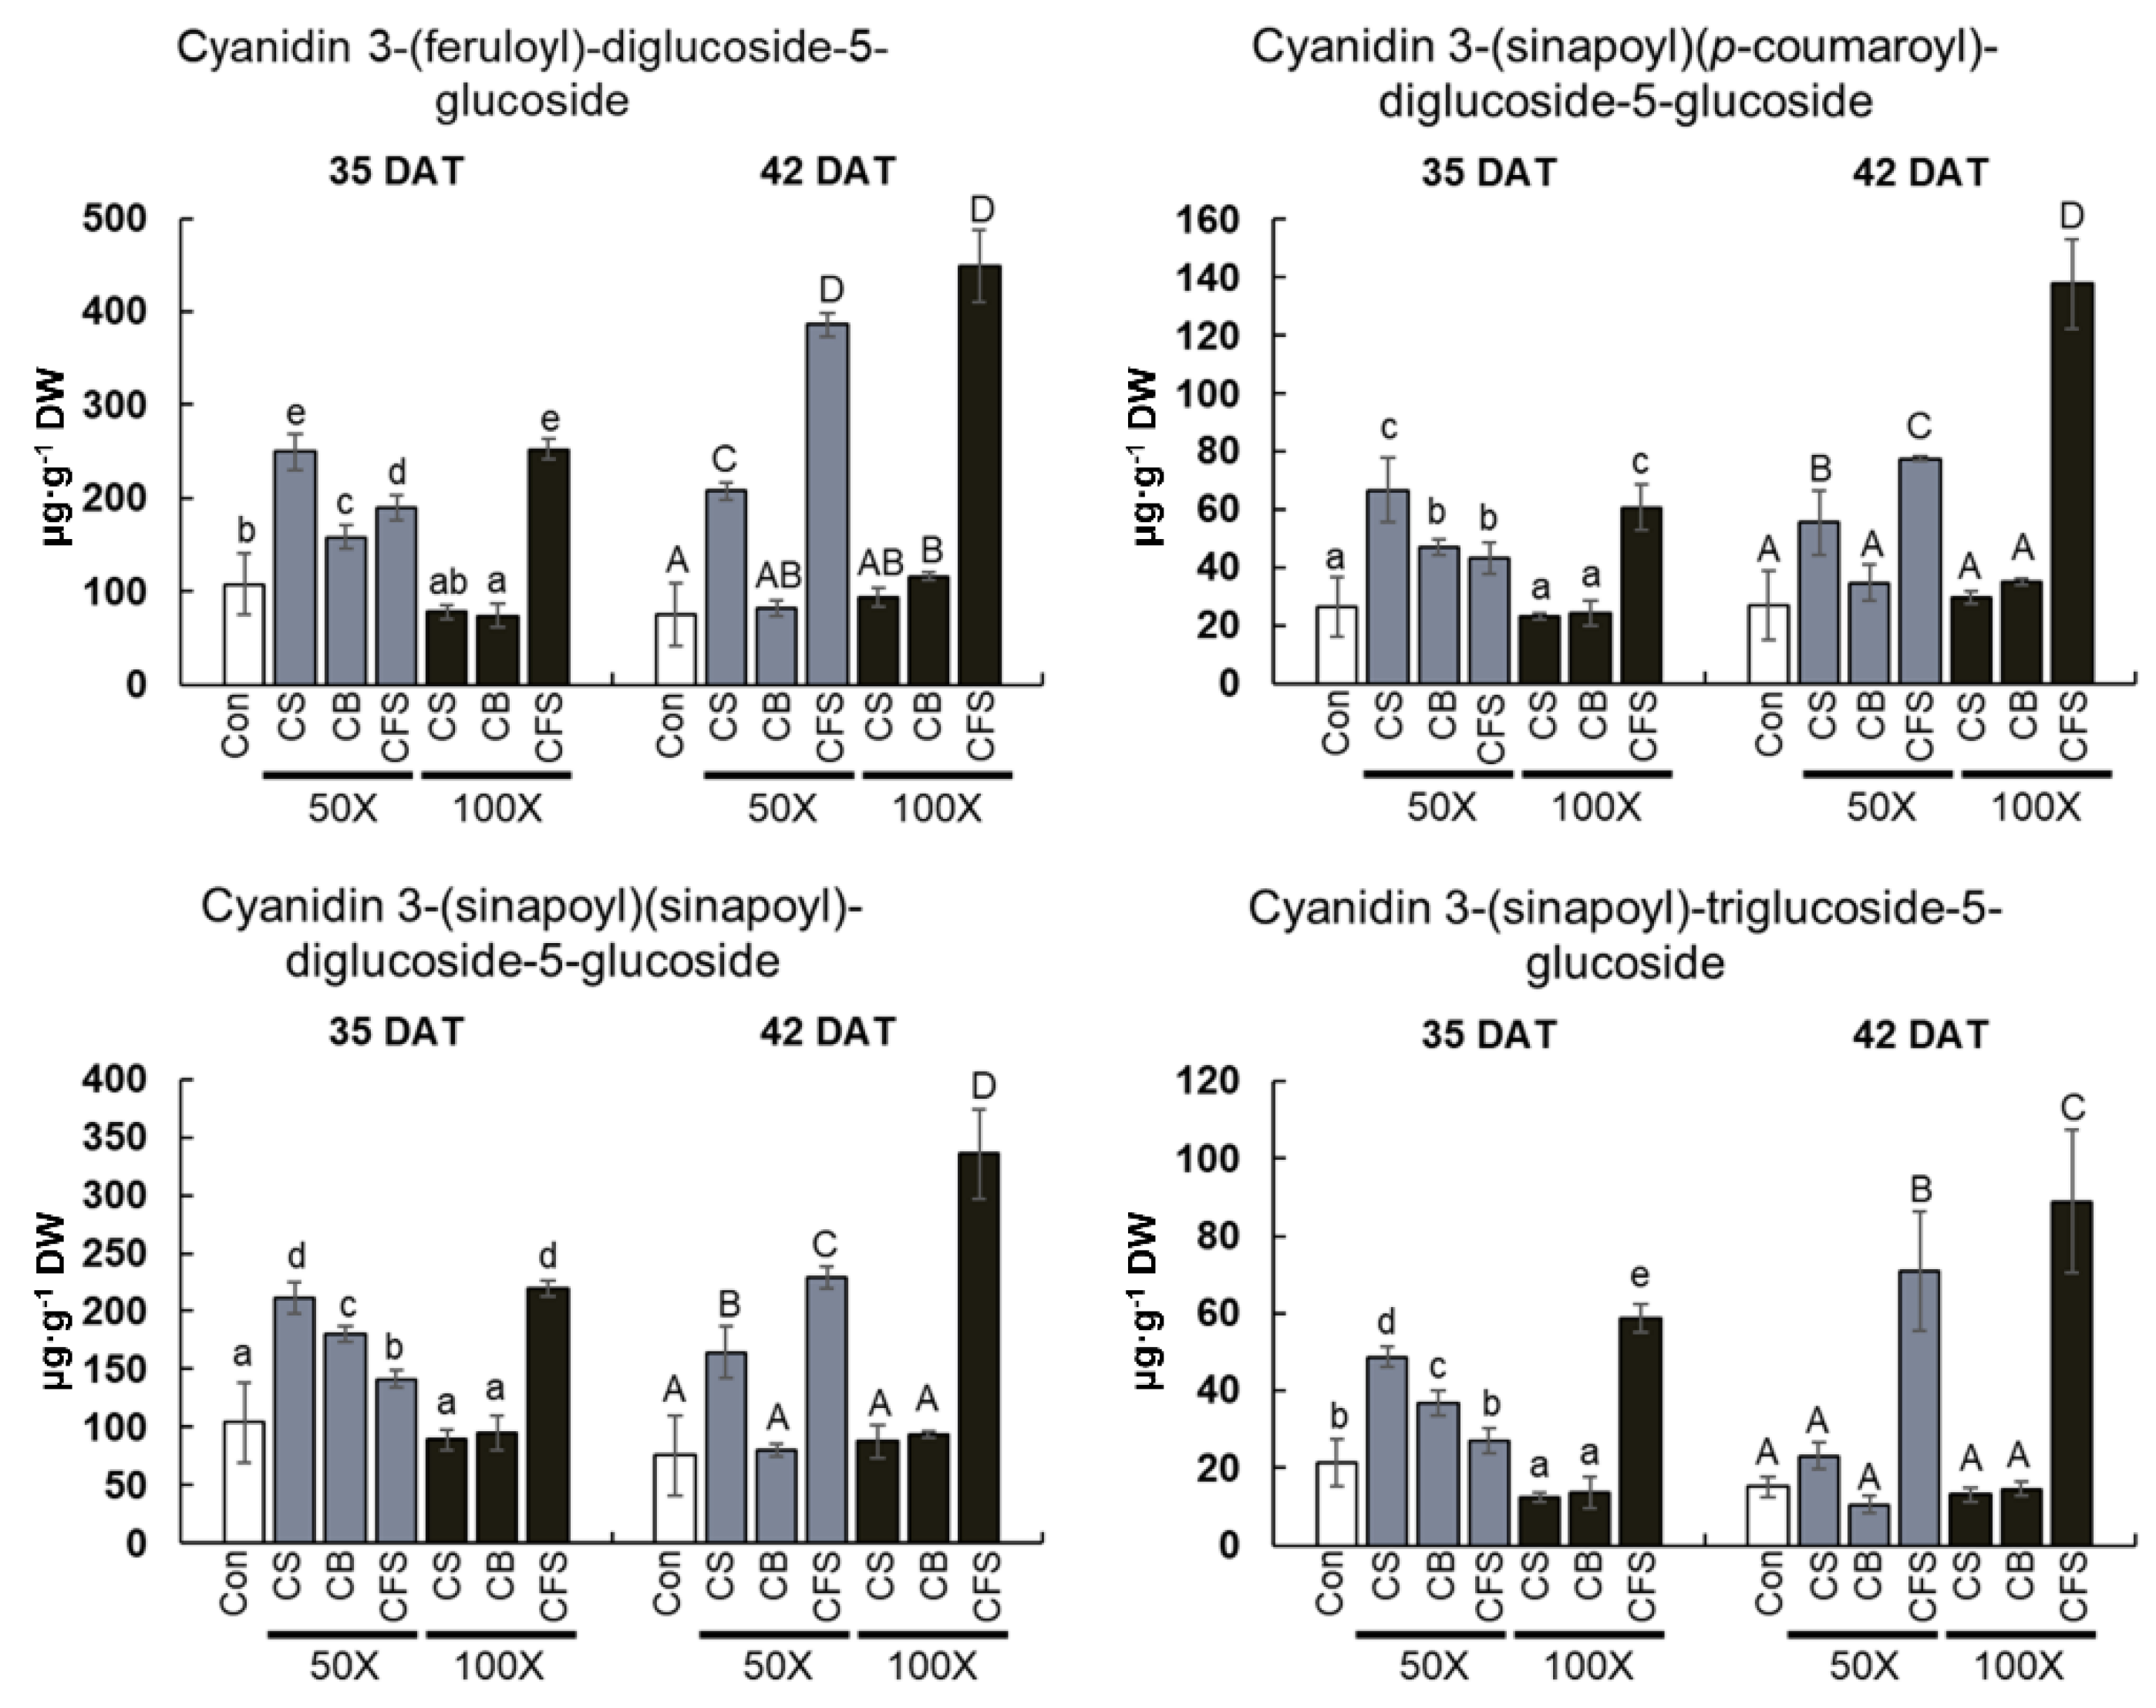
Anthocyanins are natural pigments related to the red, purple, and blue colors of Brassicaceae vegetables and are regarded as essential nutrients with potential health benefits [41]. Plants accumulate anthocyanidins and anthocyanins almost entirely via a branch of the phenylpropanoid pathway, which is also associated with flavonoid biosynthesis [42]. It is well known that anthocyanins play an important role in a number of defense mechanisms, including protection against UV-B and intense light. They also react to oxidative stress induced by water and nutrient deficits and temperature. These compounds are also involved in preventing insect infestations and fungal infections [42]. Anthocyanins support plant physiological processes, such as leaf temperature elevation, senescence, transportation of monosaccharides, regulation of osmotic balance, camouflage, and enhancement of light absorption under non-stress conditions [42]. To date, numerous anthocyanins in nature have been identified, including pelargonidin, cyanidin, delphinidin, peonidin, petunidin, and malvidin [41]. Of these, cyanidin glycosides are the most common in the red variety of curly kale [6]. In this study, four different types of cyanidin-based anthocyanins were obtained from “Red Russian” kale, which is consistent with the previous findings of anthocyanin identification in different cultivars of red kale [43,44].
Remarkably, the contents of all identified anthocyanins and total flavonoids were the highest in “Red Russian” kale under CFS treatment; however, the growth rate of kale was negatively affected under CFS treatment. Therefore, it is evident that CFS triggered flavonoid biosynthesis and, specifically, anthocyanin accumulation in kale. However, we could not clearly demonstrate the induction of anthocyanins in kale after CFS treatment. Based on previous findings, several pieces of evidence to explain this phenomenon were proposed.
First, substances secreted from Chlorella cells might influence different metabolites or biochemical pathways as biostimulants. Farid et al. have demonstrated the effects of crude polysaccharides from green microalgae on plant defense in tomatoes [45]. In particular, C. vulgaris and C. reinharditti crude extracts showed significant antioxidant activities, such as ascorbate peroxidase and peroxidase enzyme activities. Moreover, crude polysaccharides from C. sorokiniana had a significant stimulatory effect on phenylalanine ammonia-lyase (PAL) gene activity, indicating the upregulation of key genes in the phenylpropanoid biosynthetic pathway. The increase in PAL activity could be attributed to the upregulation of the phenylpropanoid pathway, which could lead to the formation of anthocyanins [46]. Similarly, C. vulgaris biomass can improve secondary metabolite production and antioxidant enzyme activities in broccoli under drought stress. Thus, applying C. vulgaris is beneficial for protecting plants from oxidative damage [47].
Second, it is possible that CFS itself could induce stress in “Red Russian” kale owing to several factors, such as dose, method, and frequency of treatment. External factors can negatively affect several processes related to plant growth, development, and secondary metabolism, eventually leading to differences in phytochemical profiles, which play vital roles in the production of bioactive compounds [48]. Plants can decrease morphological traits, including the number of leaves or branches, leaf area, height, and root volume, in response to specific biotic and abiotic stresses. Indeed, plants possess various defense mechanisms that enable them to cope with stressful conditions, lessen abiotic stress at the metabolomics level, and increase secondary metabolite production [48]. Recent studies have shown that environmental stimuli increase the levels of bioactive substances, including phenolic compounds, glucosinolates, and vitamins. In addition, variations could be influenced by the overall effect of several factors, including genetic characteristics, growth phase, cultivation condition, stimuli nature, stimuli dose, and application method (duration, interval, method of treatment, composite or single application) [37].
To date, the majority of studies have described the effects of biostimulant applications of Chlorella spp. on plants. Many growth indicators of plants can be improved by applying the algal extract. This is owing to the algal extract’s metabolic profile, which is high in nitrogenase, nitrate reductase, and minerals, all of which are important nutrients for plant growth [49]. Moreover, the presence of primary metabolites (carbohydrate, proteins, and lipids), essential amino acids (arginine and tryptophan), vitamins, osmolytes (proline, glycine, and betaine), and polysaccharides (β-glucan) has been related to the biostimulant effect of microalgal extracts. Although the release of a number of a bioactive and signaling molecules by green and blue-green algae that are effective on horticultural and agronomic crops is well known, they are still in the early stages of development for their intended uses in plant science [28]. Thus, in future studies, it is critical to concentrate on the chemical composition of the biostimulants used and analyze the biochemical and molecular interactions between the plant and the Chlorella treatments that lead to the plant responses.

5. Conclusions

The current study investigated the effect of C. vulgaris as a biostimulant on “Red Russian” kale. Specifically, three different Chlorella treatments, including Chlorella suspension, Chlorella biomass, and Chlorella-free supernatant were used, and the changes in plant growth parameters and phytochemical accumulation in kale were evaluated. The growth of kale was unaffected by Chlorella treatment; notably, CFS significantly decreased the growth rate. In contrast, the contents of individual metabolites varied depending on the type of Chlorella treatment used. This study is the first to analyze the individual contents of glucosinolates and anthocyanins in “Red Russian” kale treated with Chlorella. A significant increase in aromatic glucosinolates and all anthocyanins was observed when CFS was used. Therefore, CFS can be used as a biostimulant to enhance the yield of such valuable compounds in kale. Further research such as metabolic profiling and phytohormone analysis from Chlorella treatments should be investigated to identify the numerous factors that could influence kale’s growth and biochemical changes. It is also required to discover the interaction between CFS and kale metabolism and determine the optimal conditions for Chlorella treatment to improve growth and bioactive compound production in “Red Russian” kale.

Author Contributions

Conceptualization, Y.J.P., J.-E.P. and S.M.K.; methodology, Y.J.P., J.-E.P. and T.Q.T.; investigation, Y.J.P., J.-E.P. and T.Q.T.; writing-original draft, Y.J.P., J.-E.P. and T.Q.T.; writing-review and editing, S.Y.K., J.-H.C., J.-E.P. and S.M.K.; visualization, Y.J.P. and J.-E.P.; supervision, S.M.K.; funding acquisition, S.M.K. All authors have read and agreed to the published version of the manuscript.

Funding

This work was supported by the Korea Institute of Planning and Evaluation for Technology in Food, Agriculture and Forestry (IPET) and Korea Smart Farm R&D Foundation (KosFarm) through the Smart Farm Innovation Technology Development Program, funded by the Ministry of Agriculture, Food and Rural Affairs (MAFRA), Ministry of Science and ICT (MSIT), and Rural Development Administration (RDA) (421034-04).

Data Availability Statement

Not applicable.

Conflicts of Interest

The authors declare no conflict of interest.

References

  1. Migliozzi, M.; Thavarajah, D.; Thavarajah, P.; Smith, P. Lentil and kale: Complementary nutrient-rich whole food sources to combat micronutrient and calorie malnutrition. Nutrients 2015, 7, 9285–9298. [Google Scholar] [CrossRef] [PubMed]
  2. Satheesh, N.; Workneh Fanta, S. Kale: Review on nutritional composition, bio-active compounds, anti-nutritional factors, health beneficial properties and value-added products. Cogent Food Agric. 2020, 6, 1811048. [Google Scholar] [CrossRef]
  3. McCleary, B.V. Dietary fibre analysis. Proc. Nutr. Soc. 2003, 62, 3–9. [Google Scholar] [CrossRef] [PubMed]
  4. Acikgoz, F.E. Mineral, vitamin C and crude protein contents in kale (Brassica oleraceae var. acephala) at different harvesting stages. Afr. J. Biotechnol. 2011, 10, 17170–17174. [Google Scholar]
  5. Calderon-Montano, J.M.; Burgos-Morón, E.; Pérez-Guerrero, C.; López-Lázaro, M. A review on the dietary flavonoid kaempferol. Mini Rev. Med. Chem. 2011, 11, 298–344. [Google Scholar] [CrossRef] [PubMed]
  6. Šamec, D.; Urlić, B.; Salopek-Sondi, B. Kale (Brassica oleracea var. acephala) as a superfood: Review of the scientific evidence behind the statement. Crit. Rev. Food Sci. Nutr. 2019, 59, 2411–2422. [Google Scholar] [CrossRef] [PubMed]
  7. Mukherjee, A.; Patel, J. Seaweed extract: Biostimulator of plant defense and plant productivity. Int. J. Environ. Sci. Technol. 2020, 17, 553–558. [Google Scholar] [CrossRef]
  8. Ashour, M.; Hassan, S.M.; Elshobary, M.E.; Ammar, G.A.; Gaber, A.; Alsanie, W.F.; Mansour, A.T.; El-Shenody, R. Impact of commercial seaweed liquid extract (TAM®) biostimulant and its bioactive molecules on growth and antioxidant activities of hot pepper (Capsicum annuum). Plants 2021, 10, 1045. [Google Scholar] [CrossRef]
  9. Kholssi, R.; Marks, E.A.; Miñón, J.; Montero, O.; Debdoubi, A.; Rad, C. Biofertilizing effect of Chlorella sorokiniana suspensions on wheat growth. J. Plant Growth Regul. 2019, 38, 644–649. [Google Scholar] [CrossRef]
  10. Ru, I.T.K.; Sung, Y.Y.; Jusoh, M.; Wahid, M.E.A.; Nagappan, T. Chlorella vulgaris: A perspective on its potential for combining high biomass with high value bioproducts. Appl. Phycol. 2020, 1, 2–11. [Google Scholar] [CrossRef]
  11. Ronga, D.; Biazzi, E.; Parati, K.; Carminati, D.; Carminati, E.; Tava, A. Microalgal biostimulants and biofertilisers in crop productions. Agronomy 2019, 9, 192. [Google Scholar] [CrossRef] [Green Version]
  12. Du Jardin, P. Plant biostimulants: Definition, concept, main categories and regulation. Sci. Hortic. 2015, 196, 3–14. [Google Scholar] [CrossRef]
  13. Alvarez, A.L.; Weyers, S.L.; Goemann, H.M.; Peyton, B.M.; Gardner, R.D. Microalgae, soil and plants: A critical review of microalgae as renewable resources for agriculture. Algal Res. 2021, 54, 102200. [Google Scholar] [CrossRef]
  14. Richmond, A.; Hu, Q. Handbook of Microalgal Culture: Applied Phycology and Biotechnology; John Wiley & Sons: Oxford, UK, 2013; pp. 134–145. [Google Scholar]
  15. Levine, I.; Fleurence, J. Microalgae in Health and Disease Prevention; Academic Press: London, UK, 2018; pp. 23–72. [Google Scholar]
  16. de Morais, M.G.; Vaz, B.D.S.; de Morais, E.G.; Costa, J.A.V. Biologically active metabolites synthesized by microalgae. Biomed Res. Int. 2015, 2015, 835761. [Google Scholar] [CrossRef] [PubMed]
  17. Shaaban, M.M. Green microalgae water extract as foliar feeding to wheat plants. Pak. J. Biol. Sci. 2001, 4, 628–632. [Google Scholar]
  18. Lee, S.M.; Kim, S.K.; Lee, N.; Ahn, C.Y.; Ryu, C.M. D-Lactic acid secreted by Chlorella fusca primes pattern-triggered immunity against Pseudomonas syringae in Arabidopsis. Plant J. 2020, 102, 761–778. [Google Scholar] [CrossRef]
  19. Tabernero, A.; del Valle, E.M.M.; Galán, M.A. Evaluating the industrial potential of biodiesel from a microalgae heterotrophic culture: Scale-up and economics. Biochem. Eng. J. 2012, 63, 104–115. [Google Scholar] [CrossRef]
  20. Lee, S.-M.; Lee, B.; Shim, C.-K.; Chang, Y.-K.; Ryu, C.-M. Plant anti-aging: Delayed flower and leaf senescence in Erinus alpinus treated with cell-free Chlorella cultivation medium. Plant Signal. Behav. 2020, 15, 1763005. [Google Scholar] [CrossRef]
  21. Singleton, V.L.; Rossi, J.A. Colorimetry of total phenolics with phosphomolybdic-phosphotungstic acid reagents. Am. J. Enol. Vitic. 1965, 16, 144–158. [Google Scholar]
  22. Chang, C.-C.; Yang, M.-H.; Wen, H.-M.; Chern, J.-C. Estimation of total flavonoid content in propolis by two complementary colorimetric methods. J. Food Drug Anal. 2002, 10, 178–182. [Google Scholar]
  23. Lichtenthaler, H.K.; Buschmann, C. Chlorophylls and carotenoids: Measurement and characterization by UV-VIS spectroscopy. Curr. Protoc. Food Anal. Chem. 2001, 1, F4.3.1–F4.3.8. [Google Scholar] [CrossRef]
  24. Maina, S.; Ryu, D.H.; Cho, J.Y.; Jung, D.S.; Park, J.-E.; Nho, C.W.; Bakari, G.; Misinzo, G.; Jung, J.H.; Yang, S.-H. Exposure to salinity and light spectra regulates glucosinolates, phenolics, and antioxidant capacity of Brassica carinata L. microgreens. Antioxidants 2021, 10, 1183. [Google Scholar] [CrossRef] [PubMed]
  25. Mizgier, P.; Kucharska, A.Z.; Sokół-Łętowska, A.; Kolniak-Ostek, J.; Kidoń, M.; Fecka, I. Characterization of phenolic compounds and antioxidant and anti-inflammatory properties of red cabbage and purple carrot extracts. J. Funct. Foods 2016, 21, 133–146. [Google Scholar] [CrossRef]
  26. Martini, F.; Beghini, G.; Zanin, L.; Varanini, Z.; Zamboni, A.; Ballottari, M. The potential use of Chlamydomonas reinhardtii and Chlorella sorokiniana as biostimulants on maize plants. Algal Res. 2021, 60, 102515. [Google Scholar] [CrossRef] [PubMed]
  27. Chiaiese, P.; Corrado, G.; Colla, G.; Kyriacou, M.C.; Rouphael, Y. Renewable sources of plant biostimulation: Microalgae as a sustainable means to improve crop performance. Front. Plant Sci. 2018, 9, 1782. [Google Scholar] [CrossRef] [PubMed]
  28. Colla, G.; Rouphael, Y. Microalgae: New source of plant biostimulants. Agronomy 2020, 10, 1240. [Google Scholar] [CrossRef]
  29. Grzesik, M.; Romanowska-Duda, Z.; Kalaji, H. Effectiveness of cyanobacteria and green algae in enhancing the photosynthetic performance and growth of willow (Salix viminalis L.) plants under limited synthetic fertilizers application. Photosynthetica 2017, 55, 510–521. [Google Scholar] [CrossRef]
  30. Faheed, F.A.; Fattah, Z.A. Effect of Chlorella vulgaris as bio-fertilizer on growth parameters and metabolic aspects of lettuce plant. J. Agri. Soc. Sci. 2008, 4, 165–169. [Google Scholar]
  31. Yun, J.-H.; Cho, D.-H.; Heo, J.; Lee, Y.J.; Lee, B.; Chang, Y.K.; Kim, H.-S. Evaluation of the potential of Chlorella sp. HS2, an algal isolate from a tidal rock pool, as an industrial algal crop under a wide range of abiotic conditions. J. Appl. Phycol. 2019, 31, 2245–2258. [Google Scholar] [CrossRef]
  32. Puglisi, I.; La Bella, E.; Rovetto, E.I.; Lo Piero, A.R.; Baglieri, A. Biostimulant effect and biochemical response in lettuce seedlings treated with a Scenedesmus quadricauda extract. Plants 2020, 9, 123. [Google Scholar] [CrossRef] [PubMed]
  33. Rachidi, F.; Benhima, R.; Sbabou, L.; El Arroussi, H. Microalgae polysaccharides bio-stimulating effect on tomato plants: Growth and metabolic distribution. Biotechnol. Rep. 2020, 25, e00426. [Google Scholar] [CrossRef] [PubMed]
  34. Klopsch, R.; Witzel, K.; Artemyeva, A.; Ruppel, S.; Hanschen, F.S. Genotypic variation of glucosinolates and their breakdown products in leaves of Brassica rapa. J. Agric. Food Chem. 2018, 66, 5481–5490. [Google Scholar] [CrossRef] [PubMed]
  35. Agerbirk, N.; Olsen, C.E. Glucosinolate structures in evolution. Phytochemistry 2012, 77, 16–45. [Google Scholar] [CrossRef] [PubMed]
  36. Chiu, Y.-C.; Juvik, J.A.; Ku, K.-M. Targeted metabolomic and transcriptomic analyses of “red russian” kale (Brassicae napus var. pabularia) following methyl jasmonate treatment and larval infestation by the cabbage looper (Trichoplusia ni hübner). Int. J. Mol. Sci. 2018, 19, 1058. [Google Scholar] [CrossRef] [PubMed]
  37. Liu, H.; Kang, Y.; Zhao, X.; Liu, Y.; Zhang, X.; Zhang, S. Effects of elicitation on bioactive compounds and biological activities of sprouts. J. Funct. Foods 2019, 53, 136–145. [Google Scholar] [CrossRef]
  38. Mithen, R.F.; Dekker, M.; Verkerk, R.; Rabot, S.; Johnson, I.T. The nutritional significance, biosynthesis and bioavailability of glucosinolates in human foods. J. Sci. Food Agric. 2000, 80, 967–984. [Google Scholar] [CrossRef]
  39. Sayed Ahmed, H.I.; Elsherif, D.E.; El-Shanshory, A.R.; Haider, A.S.; Gaafar, R.M. Silver nanoparticles and Chlorella treatments induced glucosinolates and kaempferol key biosynthetic genes in Eruca sativa. Beni-Suef Univ. J. Basic Appl. Sci. 2021, 10, 52. [Google Scholar] [CrossRef]
  40. Baenas, N.; García-Viguera, C.; Moreno, D.A. Biotic elicitors effectively increase the glucosinolates content in Brassicaceae sprouts. J. Agric. Food Chem. 2014, 62, 1881–1889. [Google Scholar] [CrossRef]
  41. Zhang, N.; Jing, P. Anthocyanins in Brassicaceae: Composition, stability, bioavailability, and potential health benefits. Crit. Rev. Food Sci. Nutr. 2022, 62, 2205–2220. [Google Scholar] [CrossRef]
  42. Mannino, G.; Gentile, C.; Ertani, A.; Serio, G.; Bertea, C.M. Anthocyanins: Biosynthesis, distribution, ecological role, and use of biostimulants to increase their content in plant foods—A review. Agriculture 2021, 11, 212. [Google Scholar] [CrossRef]
  43. Jeon, J.; Kim, J.K.; Kim, H.; Kim, Y.J.; Park, Y.J.; Kim, S.J.; Kim, C.; Park, S.U. Transcriptome analysis and metabolic profiling of green and red kale (Brassica oleracea var. acephala) seedlings. Food Chem. 2018, 241, 7–13. [Google Scholar] [CrossRef] [PubMed]
  44. Zhu, P.; Tian, Z.; Pan, Z.; Feng, X. Identification and quantification of anthocyanins in different coloured cultivars of ornamental kale (Brassica oleracea L. var. acephala DC). J. Hortic. Sci. Biotechnol. 2018, 93, 466–473. [Google Scholar] [CrossRef]
  45. Farid, R.; Mutale-Joan, C.; Redouane, B.; Mernissi Najib, E.; Abderahime, A.; Laila, S.; EL Hicham, A. Effect of microalgae polysaccharides on biochemical and metabolomics pathways related to plant defense in Solanum lycopersicum. Appl. Biochem. Biotechnol. 2019, 188, 225–240. [Google Scholar] [CrossRef] [PubMed]
  46. Fesel, P.H.; Zuccaro, A. β-glucan: Crucial component of the fungal cell wall and elusive MAMP in plants. Fungal Genet. Biol. 2016, 90, 53–60. [Google Scholar] [CrossRef] [PubMed]
  47. Kusvuran, S. Microalgae (Chlorella vulgaris Beijerinck) alleviates drought stress of broccoli plants by improving nutrient uptake, secondary metabolites, and antioxidative defense system. Hortic. Plant J. 2021, 7, 221–231. [Google Scholar] [CrossRef]
  48. Jan, R.; Asaf, S.; Numan, M.; Kim, K.-M. Plant secondary metabolite biosynthesis and transcriptional regulation in response to biotic and abiotic stress conditions. Agronomy 2021, 11, 968. [Google Scholar] [CrossRef]
  49. Safi, C.; Zebib, B.; Merah, O.; Pontalier, P.-Y.; Vaca-Garcia, C. Morphology, composition, production, processing and applications of Chlorella vulgaris: A review. Renew. Sust. Energ. Rev. 2014, 35, 265–278. [Google Scholar] [CrossRef] [Green Version]
Figure 1. The growth curve of C. vulgaris in BG−11 medium. The concentration of C. vulgaris used in the study was approximately 1 × 10⁷ cells·mL−1 at day 7.
Agronomy 12 02138 g001
Figure 2. Morphological changes in “Red Russian” kale after 100× Chlorella treatments. The scale bar indicates 25 cm. CON, distilled water; CS, Chlorella suspension; CB, Chlorella biomass; CFS, Chlorella−free supernatant.
Agronomy 12 02138 g002
Figure 3. Growth indicators including (A) fresh weight, (B) dried weight, and (C) number of leaves of kale treated different Chlorella treatments and concentrations. Kale grown in the greenhouse under Chlorella treatments with 50 and 100-fold dilutions. Bars represent the mean ± SD of three replicates. Different letters indicate significant differences at p < 0.05 based on Duncan’s multiple range tests. Con, distilled water; CS, Chlorella suspension; CB, Chlorella biomass; and CFS, Chlorella−free supernatant.
Agronomy 12 02138 g003
Figure 4. Phytochemical profiles of kale exposed to different Chlorella treatments. Bars represent the mean ± SD of three replicates. Different letters indicate significant differences at p < 0.05 based on Duncan’s multiple range tests. Con, distilled water; CS, Chlorella suspension; CB, Chlorella biomass; CFS, Chlorella−free supernatant; and DW, dry weight.
Agronomy 12 02138 g004
Figure 5. Representative HPLC chromatogram of 100× CB-treated kale monitored at 229 nm. Peak 1, progoitrin; 2, gluconapin; 3, hydroxyglucobrassicin; 4, glucotropaeolin (internal standard); 5, glucobrassicin; 6, methylglucobrassicin; 7, gluconasturtiin; and 8, neoglucobrassicin.
Agronomy 12 02138 g005
Figure 6. Individual glucosinolate contents (μmol·g−1 DW) in “Red Russian” kale after Chlorella treatments. In total, seven glucosinolates were determined, including (A) indole (hydroxyglucobrassicin, glucobrassicin, methylglucobrassicin, and neoglucobrassicin), (B) aliphatic (progoitrin and gluconapin), and (C) aromatic glucosinolates (gluconasturtiin). Bars represent the mean ± SD of three replicates. Different letters indicate significant differences at p < 0.05 based on Duncan’s multiple range tests. Con, distilled water; CS, Chlorella suspension; CB, Chlorella biomass; CFS, Chlorella−free supernatant; and DW, dry weight.
Agronomy 12 02138 g006
Figure 7. Representative HPLC chromatogram from 50× CFS-treated kale monitored at 520 nm. Peak 1, cyanidin 3-(feruloyl)-diglucoside-5-glucoside; 2, cyanidin 3-(sinapoly)(p-coumaroyl)-diglucoside-5-glucoside; 3, cyanidin 3-(sinapolyl)(sinapoyl)-diglucoside-5-glucoside; and 4, cyanidin 3-(sinapoyl)-triglucoside-5-glucoside.
Agronomy 12 02138 g007
Figure 8. Individual anthocyanin contents (μg·g−1 DW) in “Red Russian” kale after Chlorella treatments. Bars represent the mean ± standard deviation of three replicates. Different letters indicate significant differences at p < 0.05 based on Duncan’s multiple range tests. Con, distilled water; CS, Chlorella suspension; CB, Chlorella biomass; CFS, Chlorella−free supernatant; and DW, dry weight.
Agronomy 12 02138 g008
Table 1. Chlorella treatments used in this study.
TreatmentsDescription
ControlDistilled water
CSChlorella suspension
CBChlorella biomass
CFSChlorella-free supernatant
Table 2. Mineral contents and physicochemical characteristics of Chlorella solution.
CSCBCFSCon
Macroelement
(μg·mL−1, 1×)
NH4n.d 24.93 ± 0.10n.d
NO372.34 ± 9.47n.dn.d
HCO361.06 ± 2.8114.56 ± 1.6459.88 ± 1.81
K14.22 ± 3.397.57 ± 5.384.34 ± 0.24
Ca2.28 ± 0.350.47 ± 0.091.67 ± 0.02
Mg1.17 ± 0.110.27 ± 0.040.94 ± 0.01
S0.81 ± 0.160.34 ± 0.020.41 ± 0.07
P0.47 ± 0.070.34 ± 0.08n.d
Microelement
(μg·mL−1, 1×)
Na58.39 ± 0.916.35 ± 0.1159.32 ± 1.13
Si3.25 ± 0.090.01 ± 0.022.57 ± 0.03
Cl26.89 ± 14.6215.84 ± 8.0470.91 ± 0.00
Fe0.03 ± 0.00n.d0.01 ± 0.00
Mn0.01 ± 0.00 0.00 ± 0.01n.d
Zn0.01 ± 0.000.00 ± 0.01n.d
B0.40 ± 0.010.03 ± 0.010.33 ± 0.01
Cu0.04 ± 0.000.01 ± 0.000.04 ± 0.00
Mo0.02 ± 0.00n.d0.02 ± 0.00
EC level
(μS·cm−1)
332.63 ± 2.1685.50 ± 0.63353.90 ± 0.2141.70 ± 0.21
50× 121.36 ± 0.1611.39 ± 0.0321.33 ± 0.12
100× 115.89 ± 0.0110.07 ± 0.0125.90 ± 0.00
pH9.58 ± 0.027.19 ± 0.029.35 ± 0.037.04 ± 0.01
50× 17.27 ± 0.037.09 ± 0.017.22 ± 0.01
100× 17.17 ± 0.026.99 ± 0.066.96 ± 0.01
All data represent means ± SDs (n = 3). Con, distilled water; CS, Chlorella suspension; CB, Chlorella biomass; CFS, Chlorella-free supernatant. 1 It represents dilution factors from 1×, and 2 not detected.
Table 3. Glucosinolates identified in “Red Russian” kale.
NoRT 1Trivial NamesSemisystematic Names
of R-Groups
Compound
Group
M 2M−80
=MDS 3
[MDS + H 4]
(m/z)
RRF 5
17.18Progoitrin(2R)-2-Hydroxy-3-butenyAliphatic3893093101.13
210.09Gluconapin3-ButenylAliphatic3732932941.21
310.81Hydroxyglucobrassicin4-Hydroxy-3-indolylmethylIndole4643843850.29
412.48Glucotropaeolin 6BenzylAromatic4093293301.00
513.37Glucobrassicin3-IndolymethylIndole4483683691.21
614.30Methylglucobrassicin4-Methoxy-3-indolylmethylIndole4783983990.26
714.73Gluconasturtiin2-PhenylethylAromatic4233433441.00
816.53NeoglucobrassicinN-Methoxy-3-indolylmethylIndole4783983990.21
1 Retention time (min), 2 Molecular weight of intact glucosinolate, 3 Molecular weight of desulfo-glucosinolate, 4 Value of the sum of MDS and molecular weight of hydrogen, 5 Relative response factor, and 6 Glucotropaeolin was used as internal standard in this study.
Table 4. Anthocyanins identified in “Red Russian” kale.
NoRT 1Compound NameExact Mass[M + H] 2 (m/z)
13.23Cyanidin 3-(feruloyl)-diglucoside-5-glucoside948.2538949.2607
211.68Cyanidin 3-(sinapoyl)(p-coumaroyl)-diglucoside-5-glucoside1124.32071125.3179
312.09Cyanidin 3-(sinapoyl)(sinapoyl)-diglucoside-5-glucoside1154.31121155.3163
412.58Cyanidin 3-(sinapoyl)-triglucoside-5-glucoside1184.31281185.3218
1 Retention time (min), 2 Value of the sum of exact mass and molecular weight of hydrogen.
Publisher’s Note: MDPI stays neutral with regard to jurisdictional claims in published maps and institutional affiliations.

