
Relationships between the Water Uptake and Nutrient Status of Rubber Trees in a Monoculture Rubber Plantation

 and
and 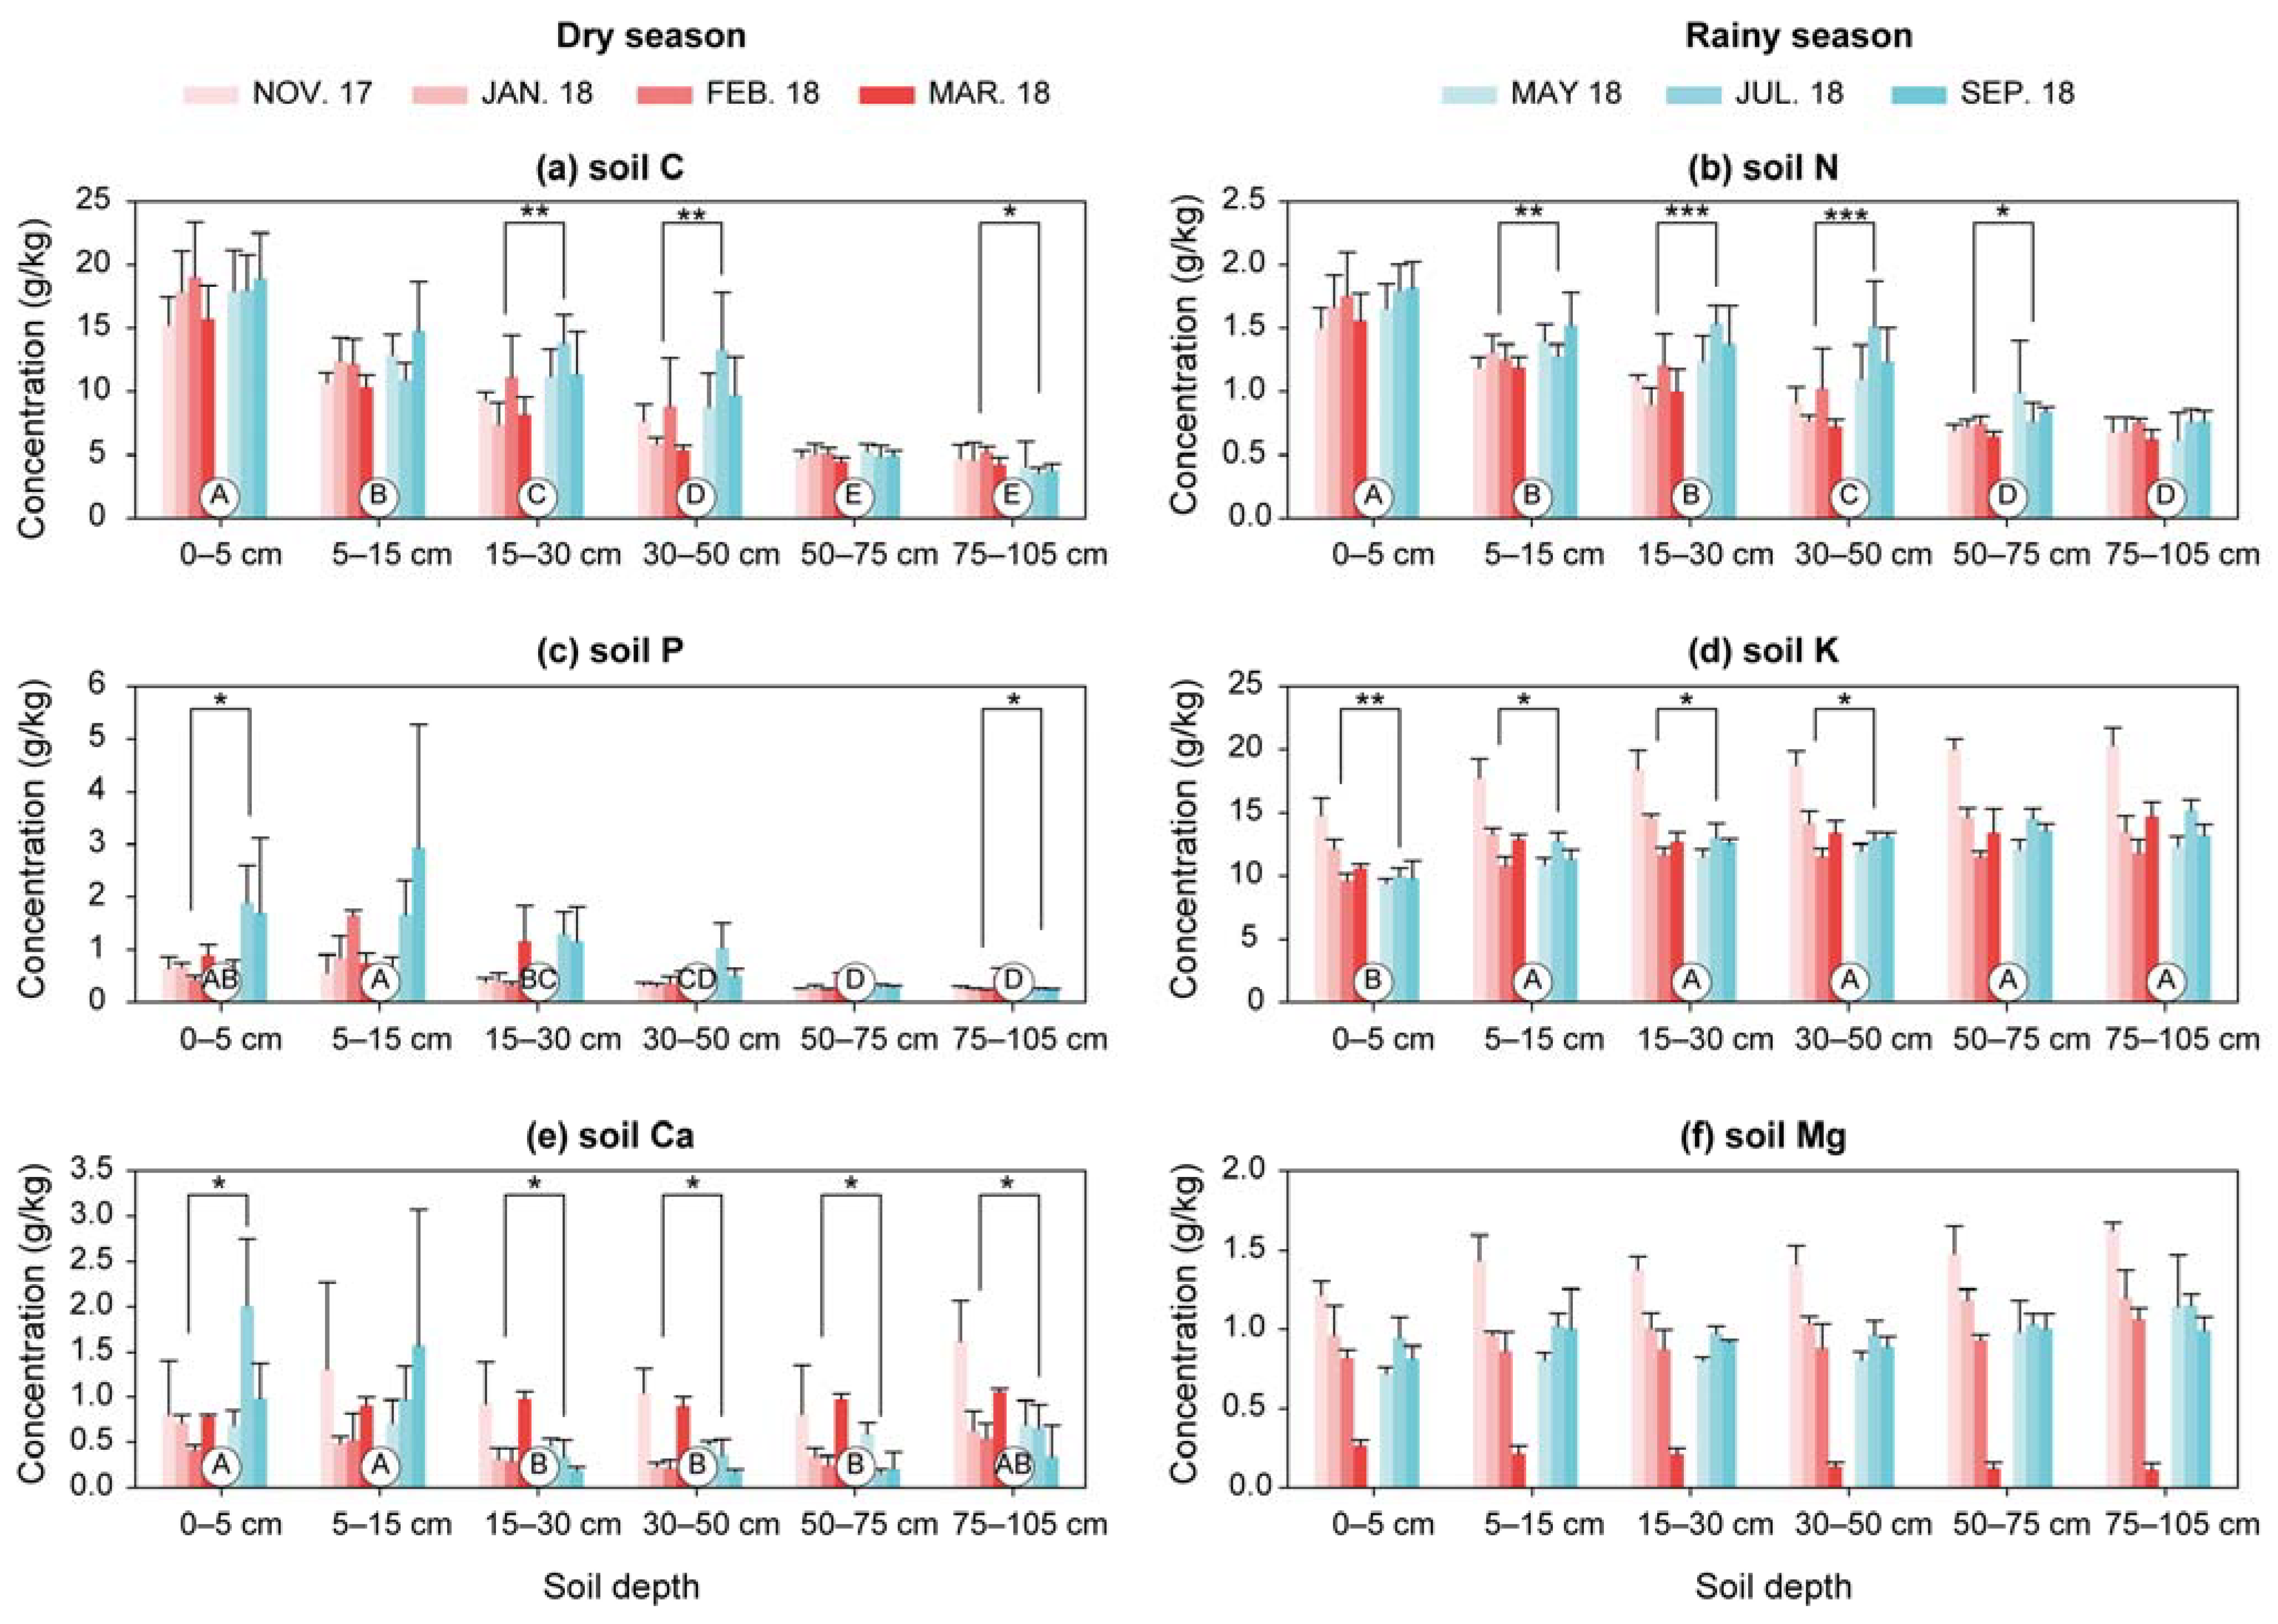
Abstract
:1. Introduction
2. Materials and Methods
2.1. Study Sites
2.2. Sampling
2.3. Pre-Treatment and Measuring Methods
2.4. Water-Related Calculation
2.5. Statistical Analyses
3. Results
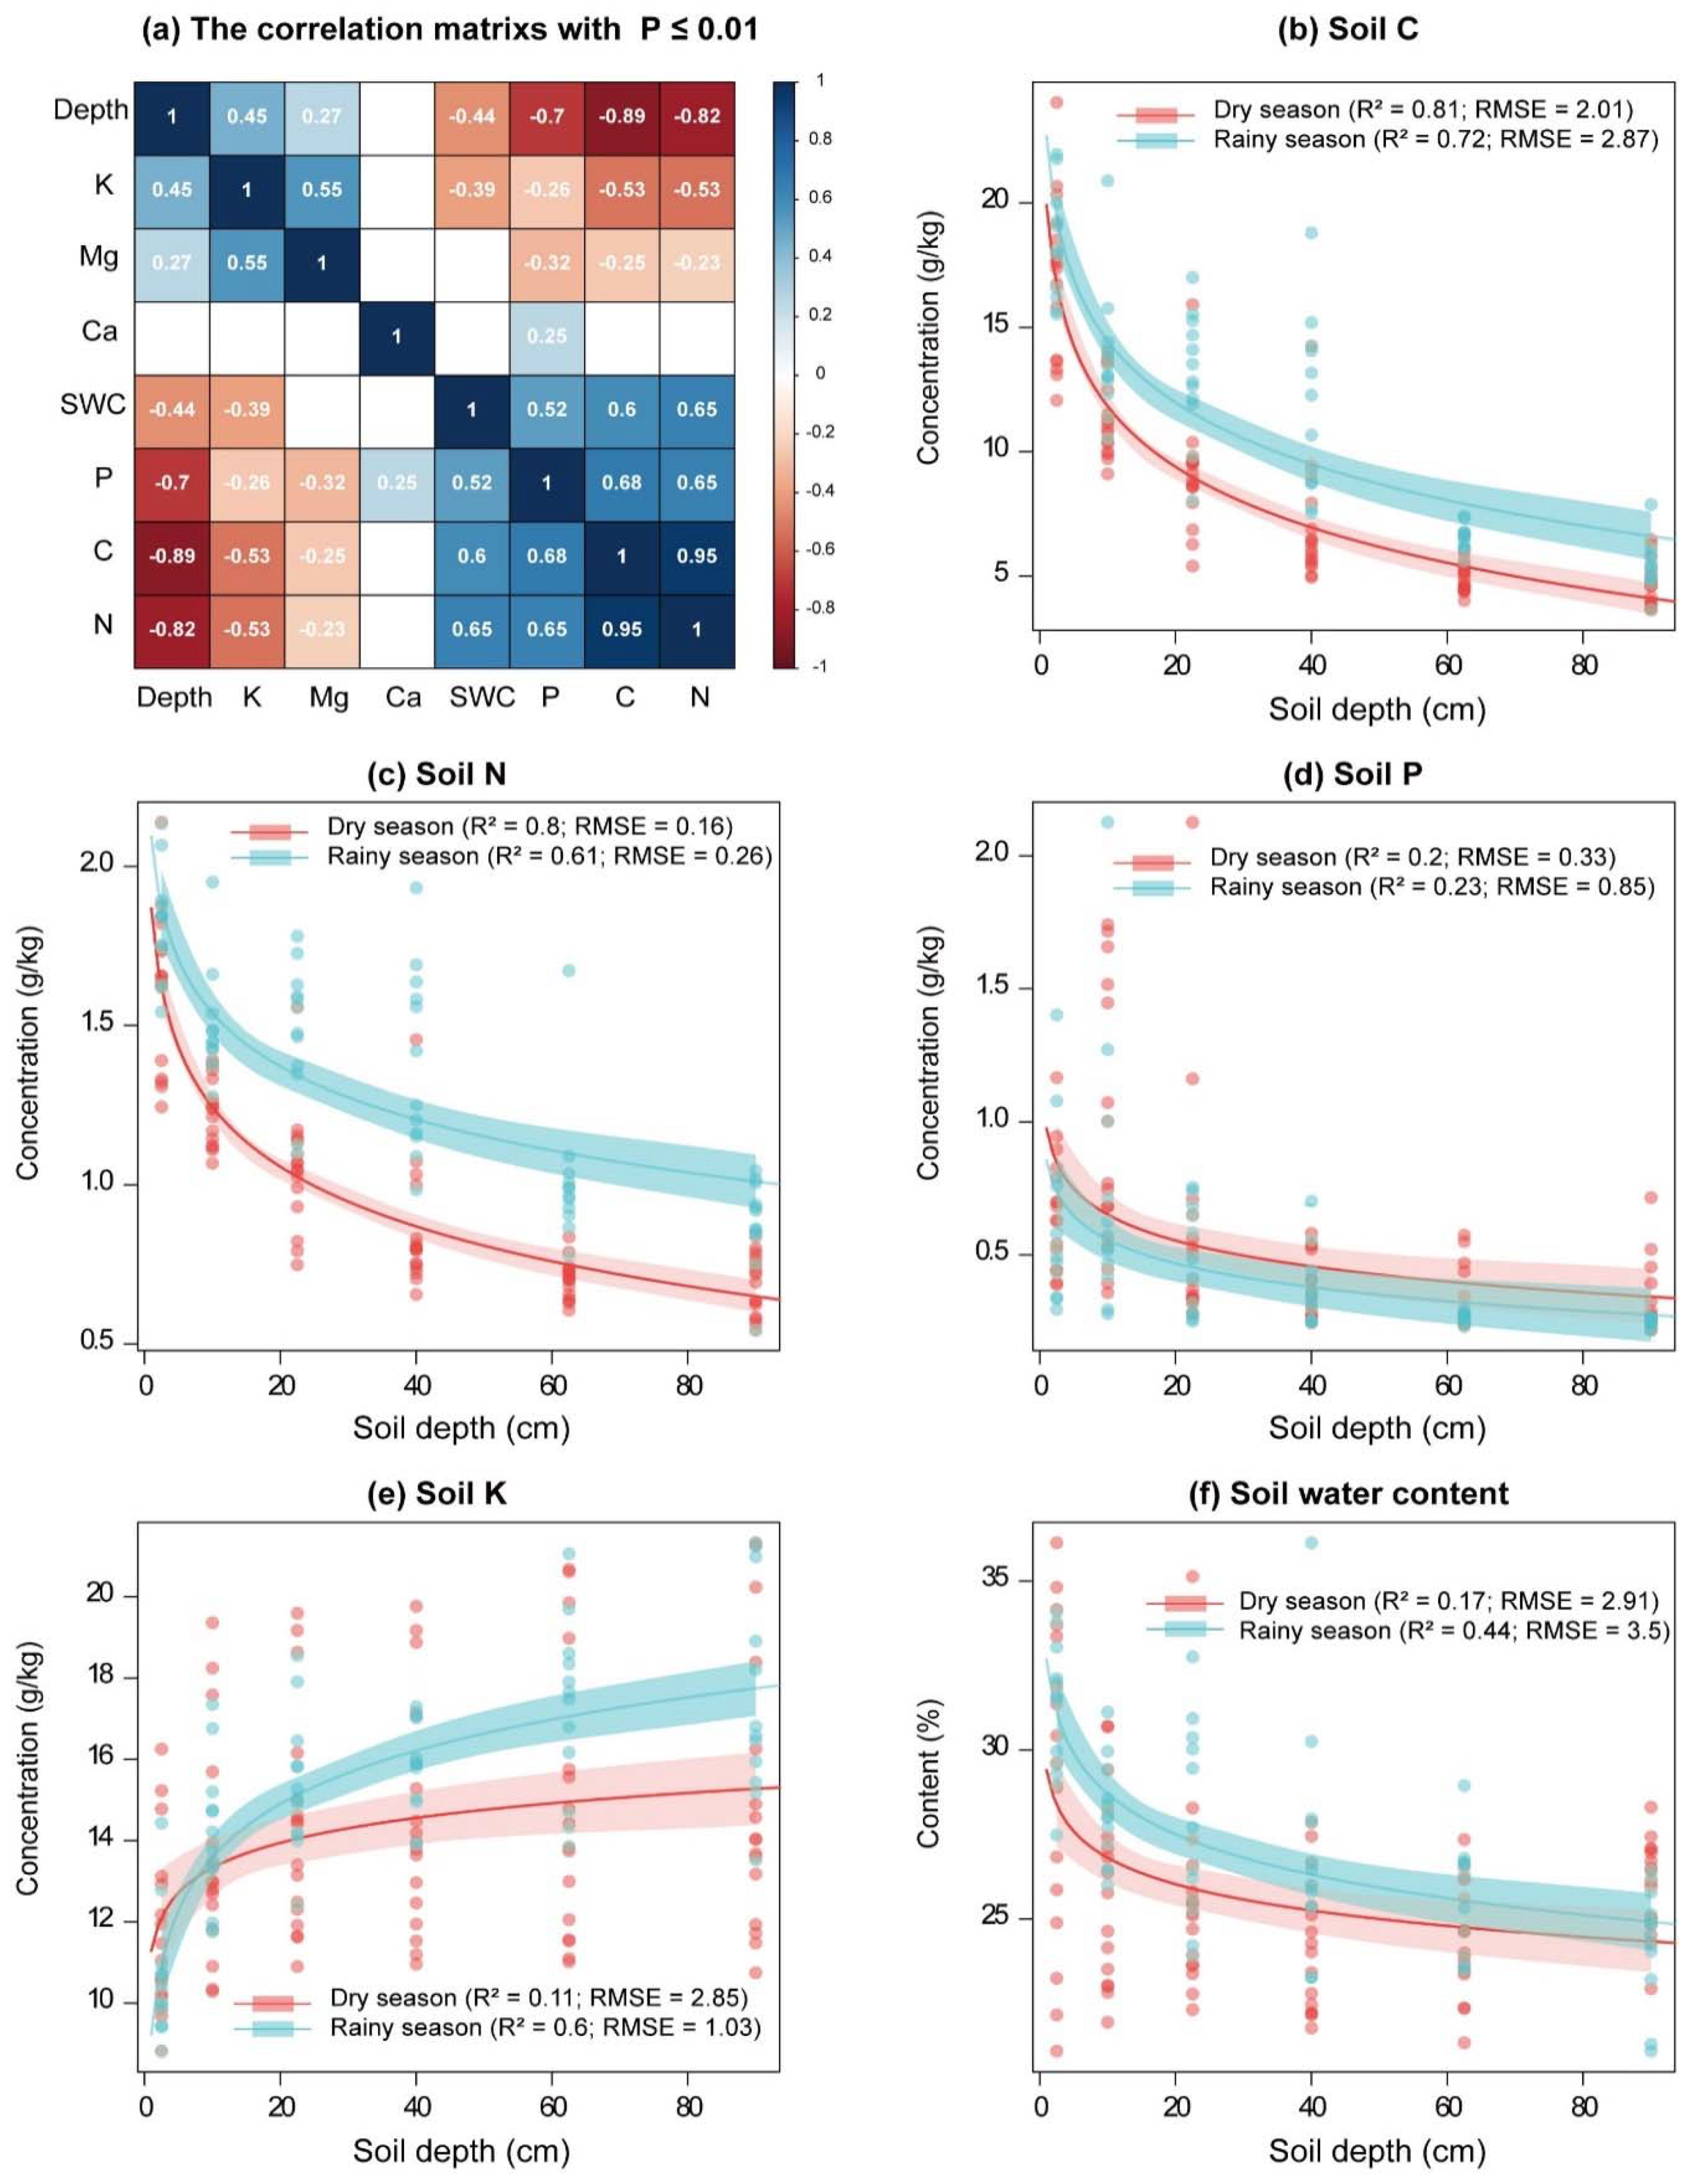
3.1. Soil Nutrients
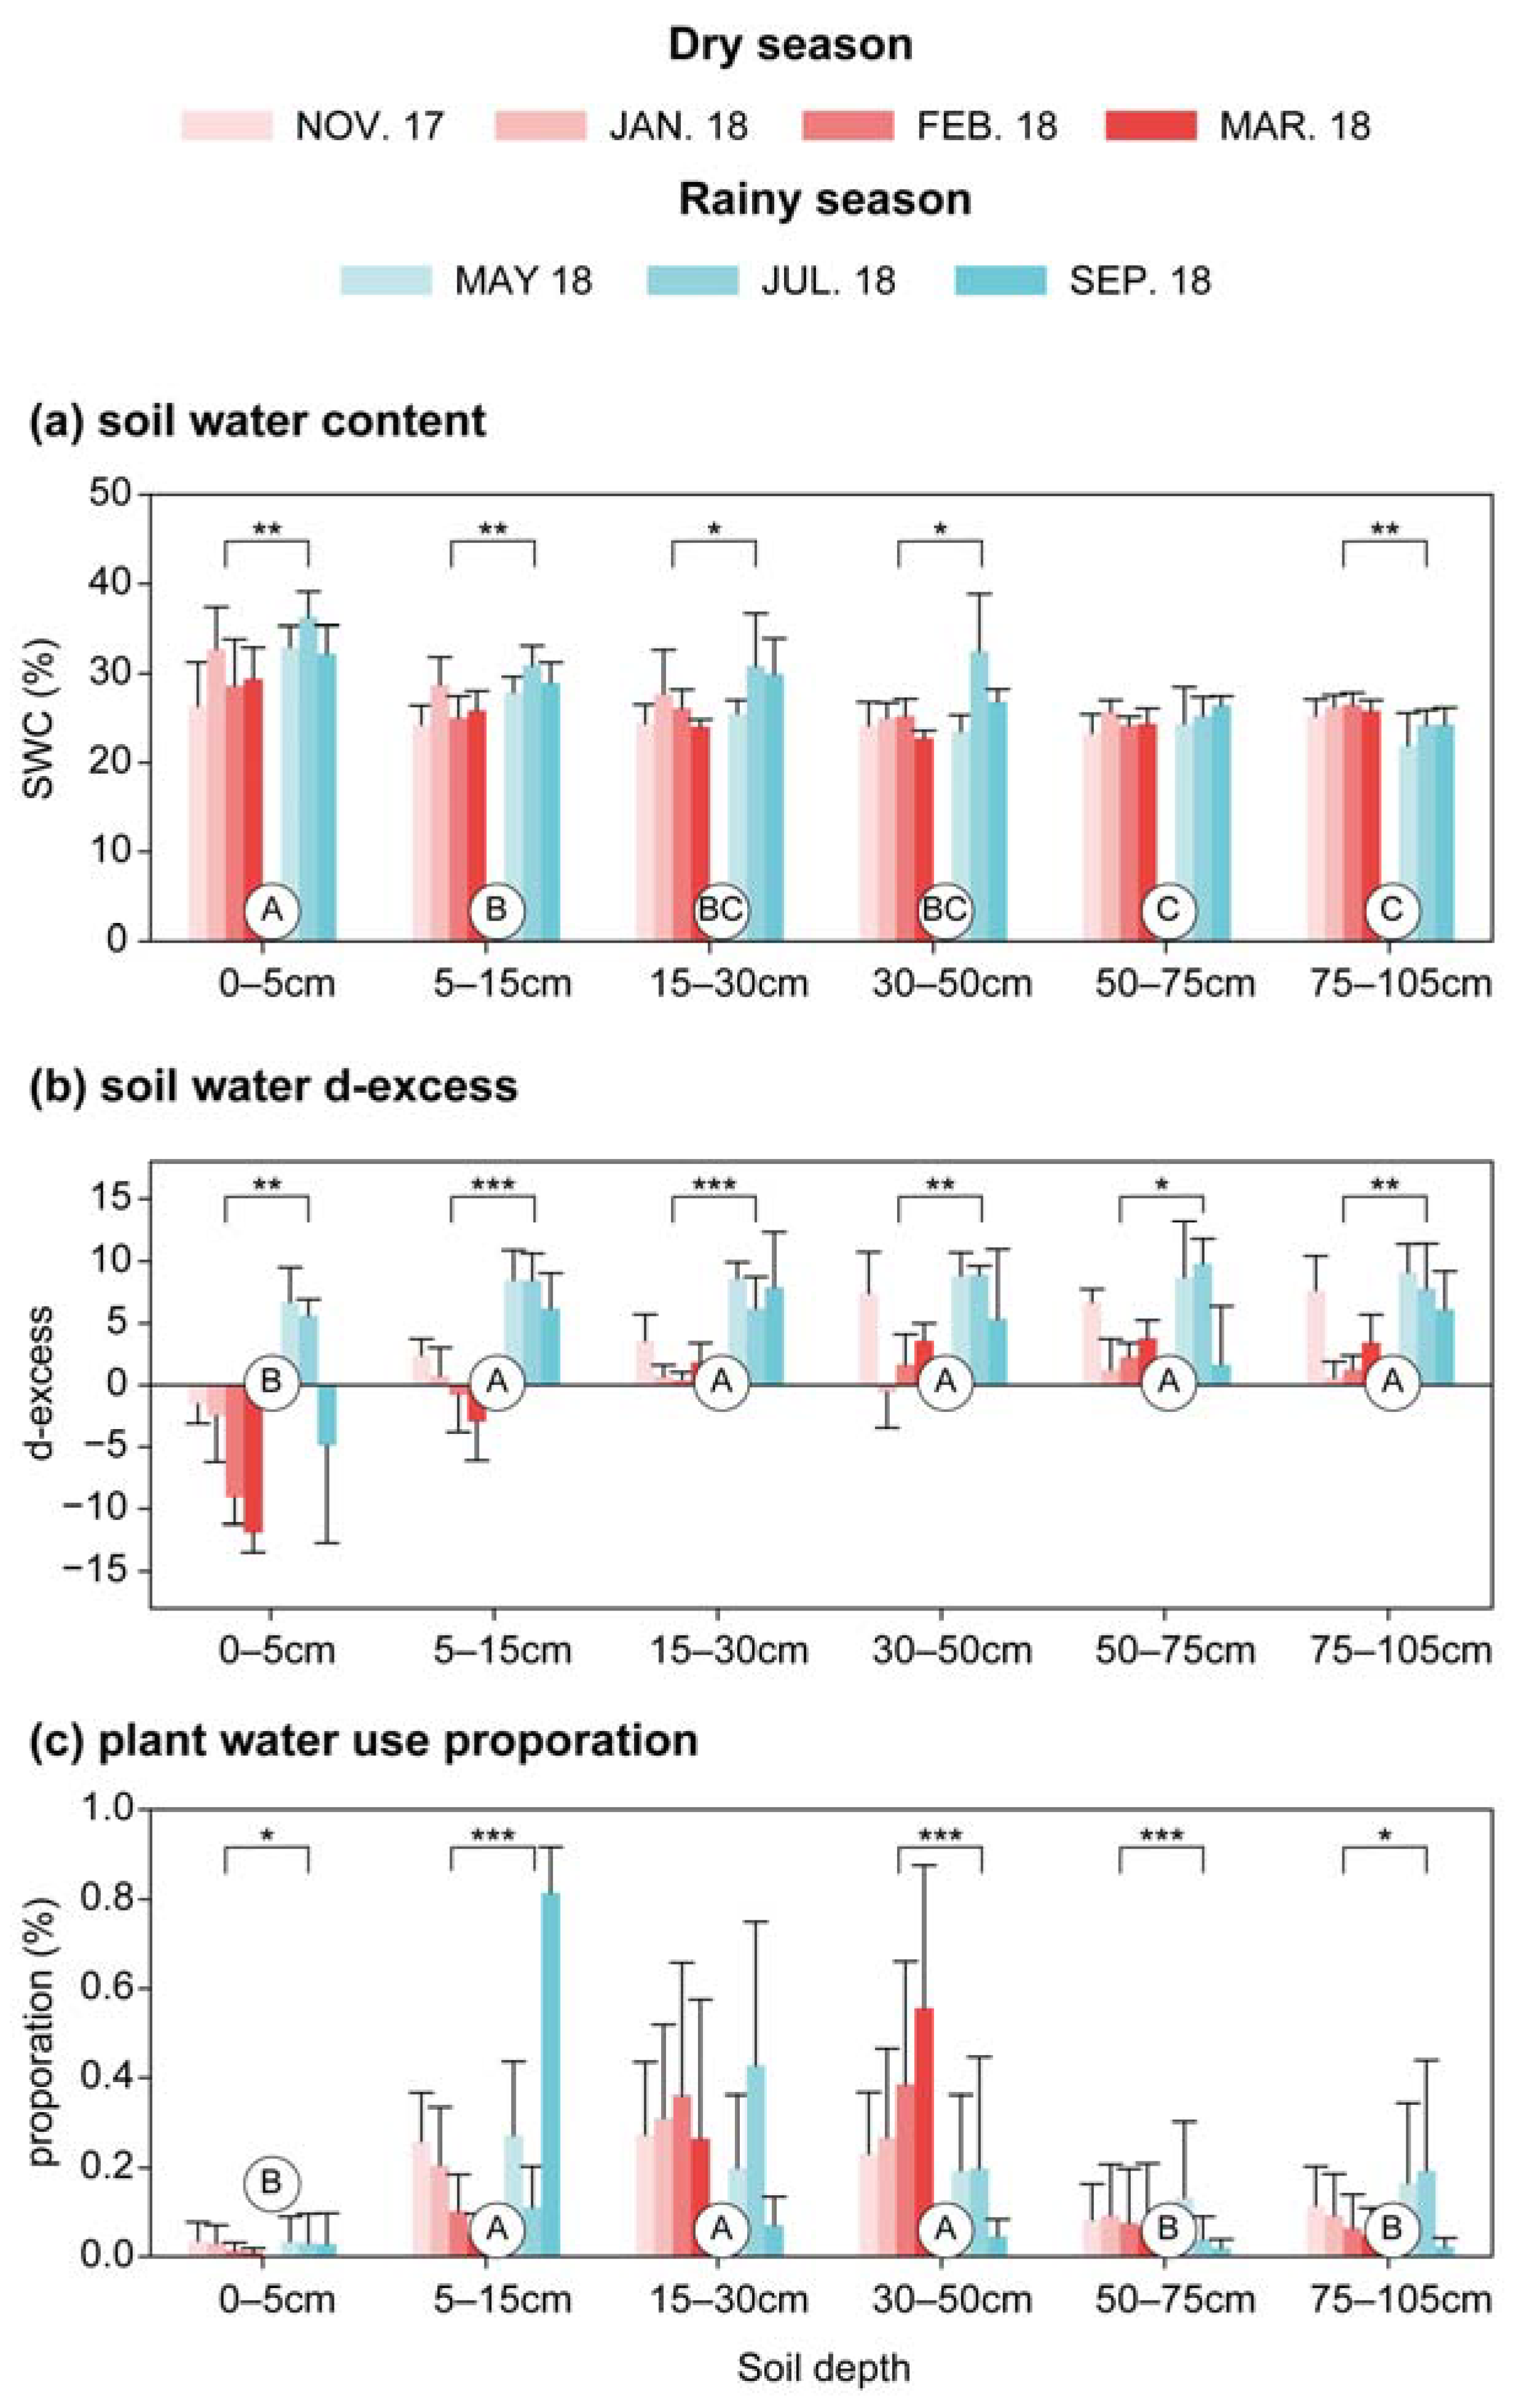
3.2. Soil Water and Plant Water Use Proportions
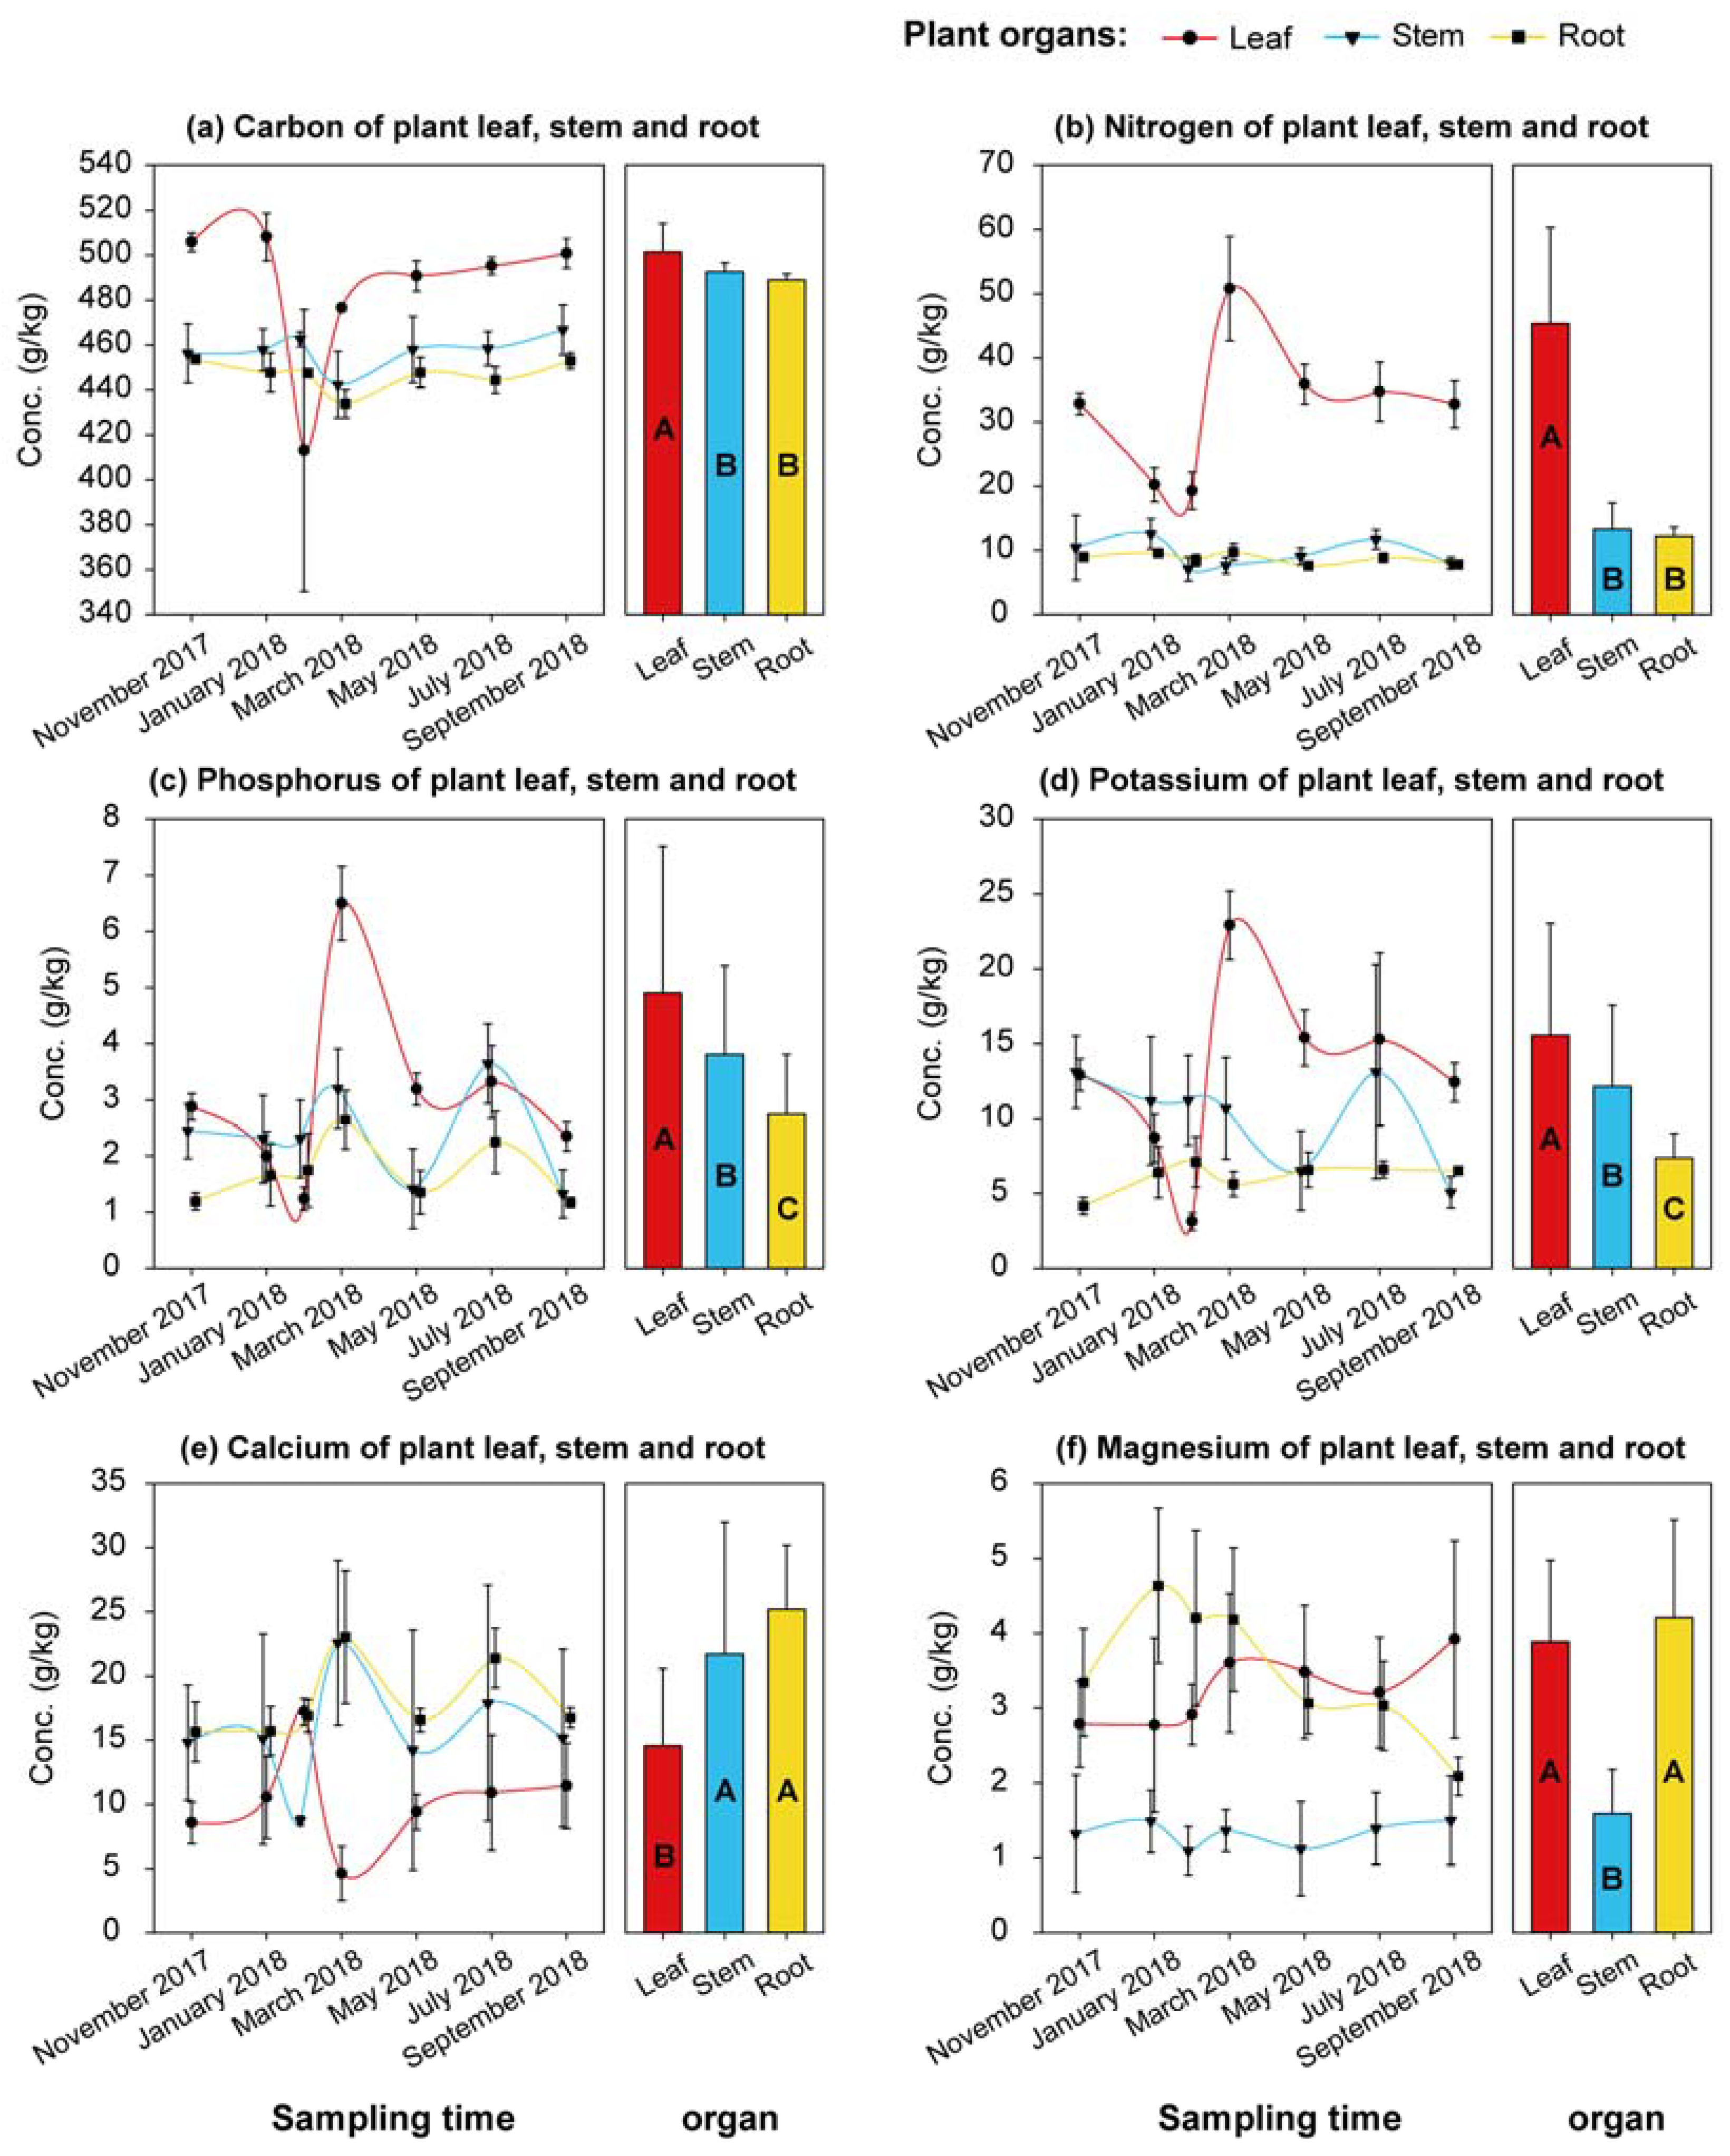
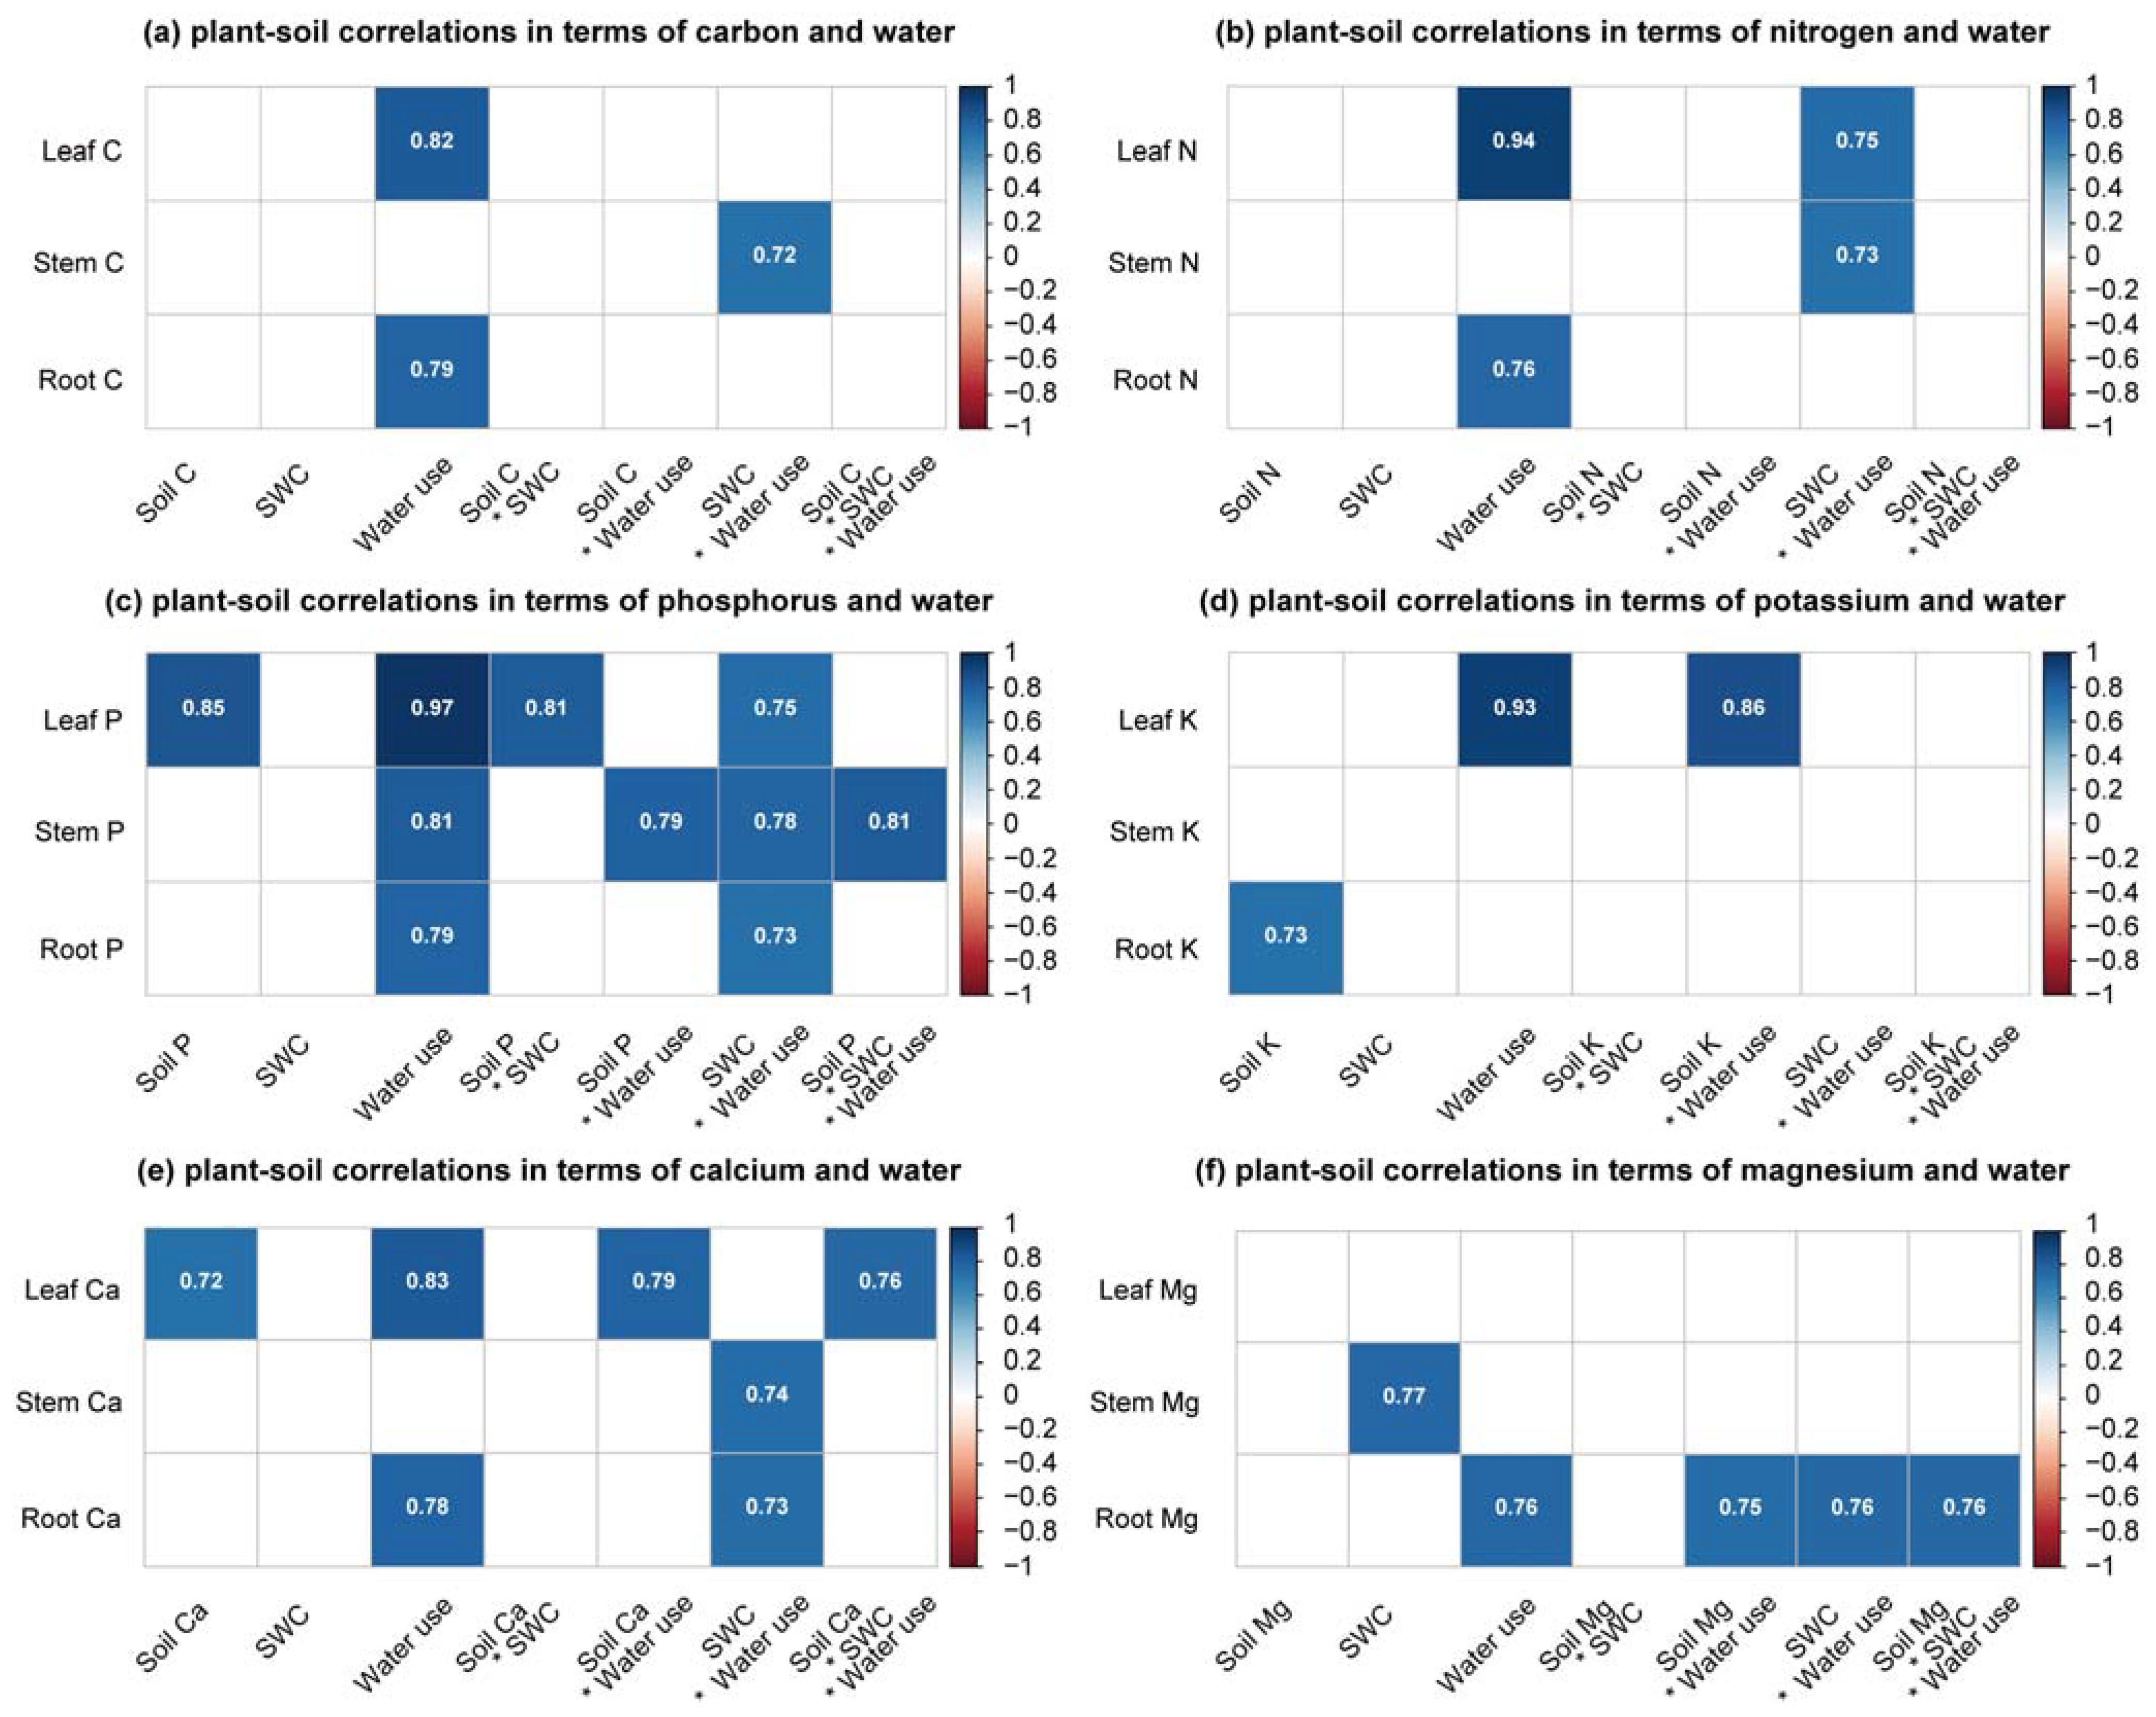
3.3. Nutrients in Rubber Tree Tissues and Their Relationship with Soil Nutrients and Water and Plant Water Use
4. Discussion
4.1. Variations in Soil Nutrients
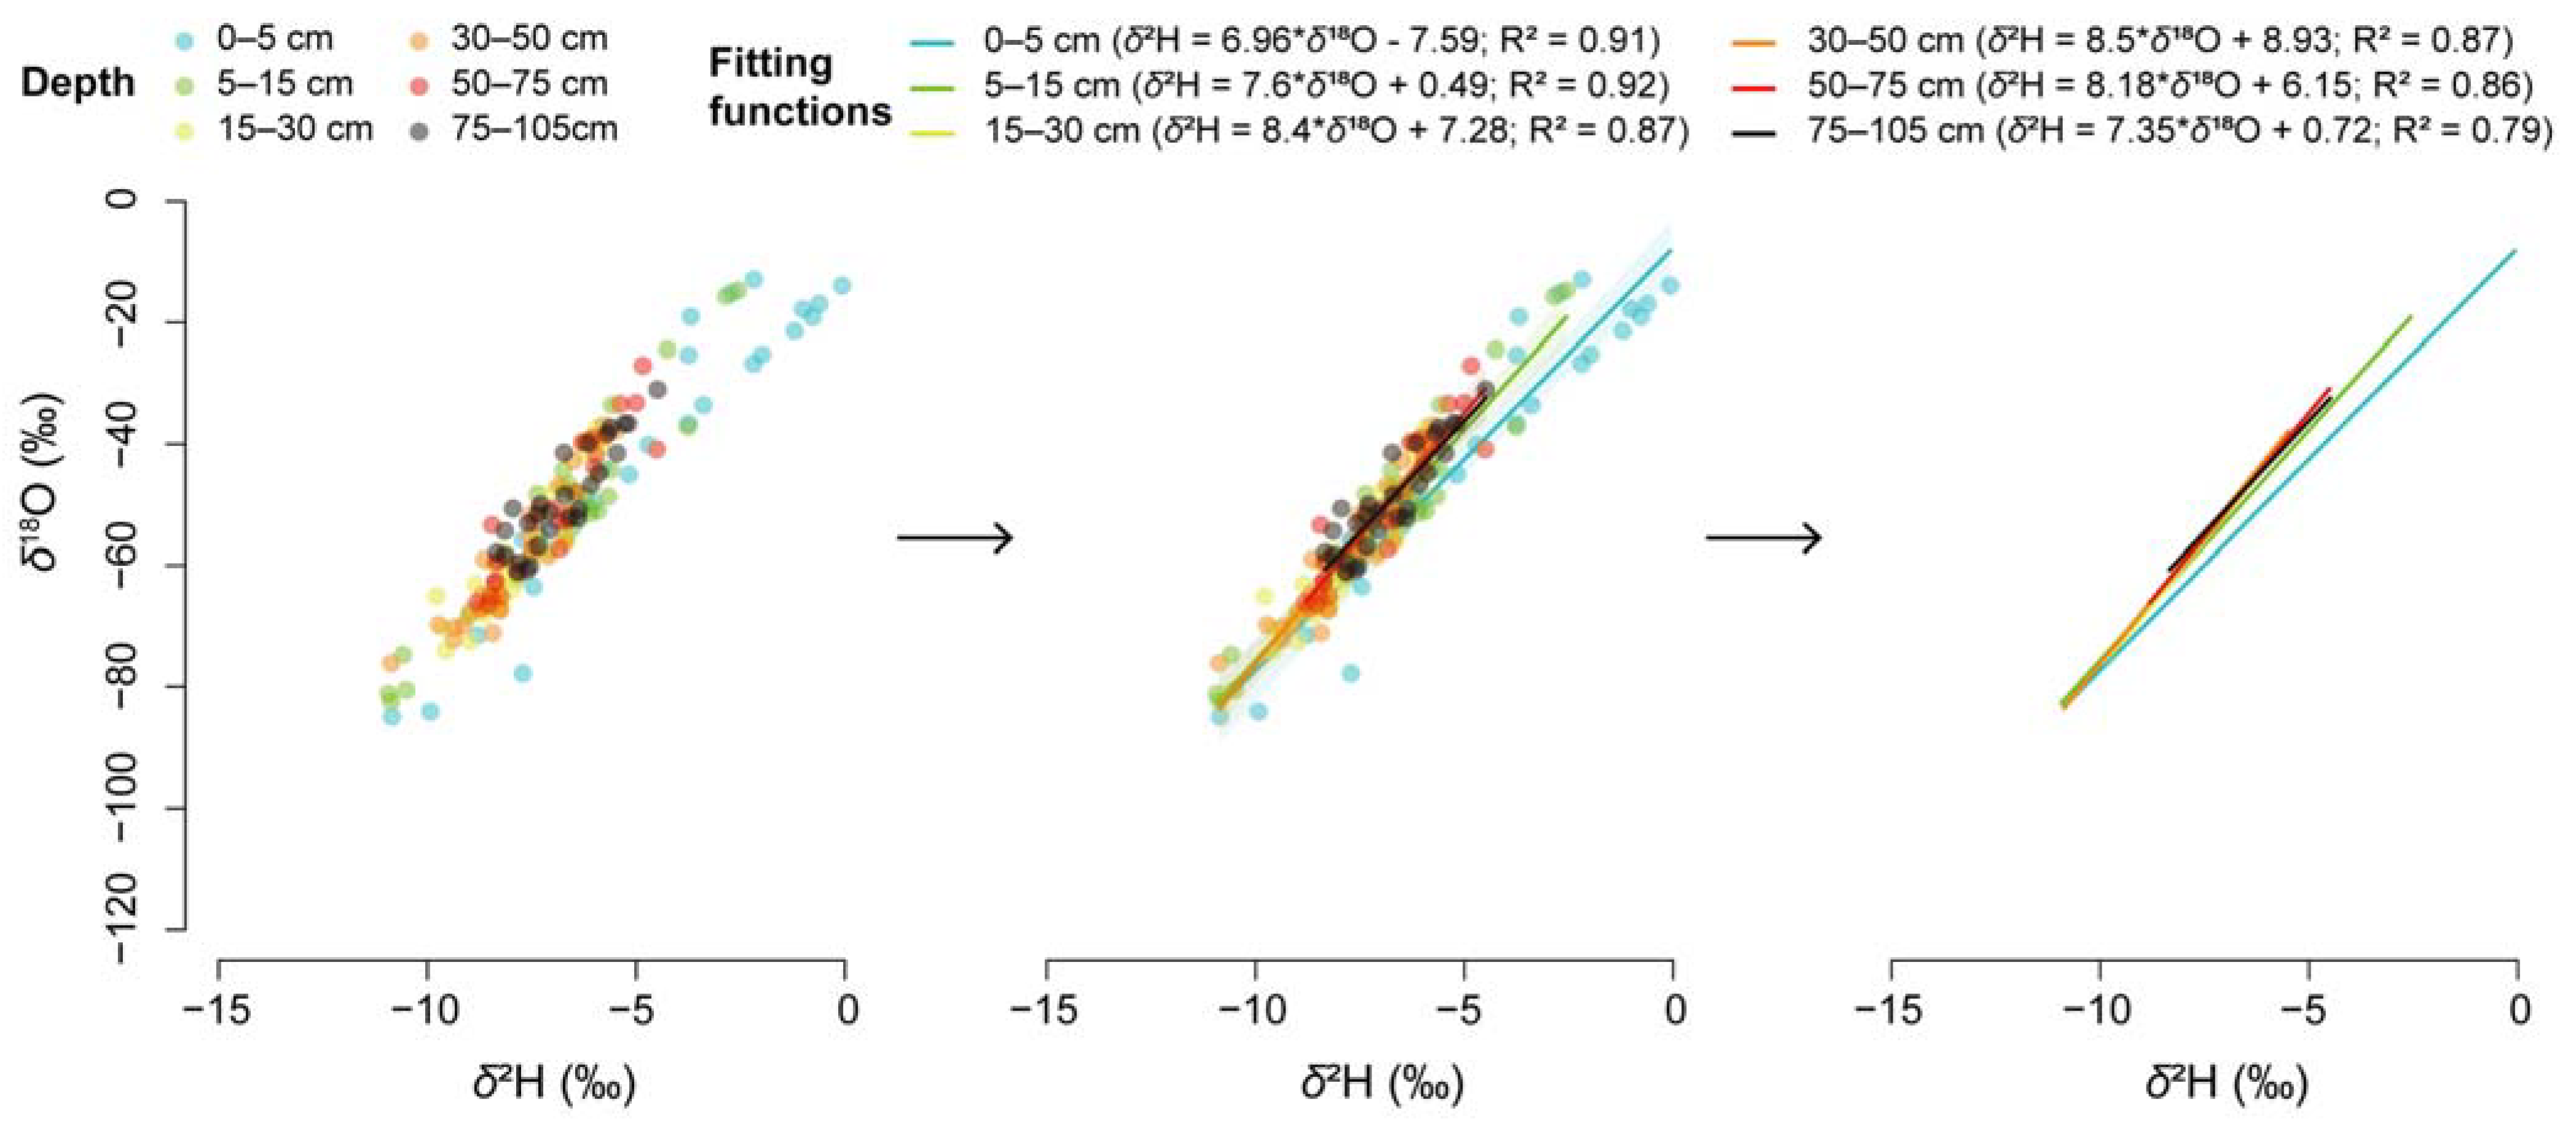
4.2. Variations in Soil Water Content and Isotopic Compositions
4.3. Variations in Plant Nutrient Status
4.4. Relationship among Environmental Resources, Plant Root Uptake, and Nutrient Status
5. Conclusions
Author Contributions
Funding
Acknowledgments
Conflicts of Interest
References
- Xu, J. China’s new forests aren’t as green as they seem. Nature 2011, 477, 371. [Google Scholar] [CrossRef] [PubMed] [Green Version]
- Li, Z.; Fox, J.M. Mapping rubber tree growth in mainland Southeast Asia using time-series MODIS 250 m NDVI, and statistical data. Appl. Geogr. 2012, 32, 420–432. [Google Scholar] [CrossRef]
- Ziegler, A.D.; Fox, J.M.; Xu, J.C. The Rubber Juggernaut. Science 2009, 324, 1024–1025. [Google Scholar] [CrossRef] [PubMed]
- Fox, J.; Castella, J.C.; Ziegler, A.D.; Westley, S.B. Rubber Plantations Expand in Mountainous Southeast Asia: What Are the Consequences for the Environment? 2014. Available online: https://www.eastwestcenter.org/system/tdf/private/api114.pdf?file=1&type=node&id=34563 (accessed on 12 June 2022).
- Hassan, N.; Hamzah, H.H.M.; Zain, S.M.M. A goal programming approach for rubber production in Malaysia. Am.-Eurasian J. Sustain. Agric. 2013, 7, 50–53. [Google Scholar]
- Ke, Y.P.; Guo, J.C.; Liu, Y. Research on Safety and Early Warning System of Natural Rubber Industry in China; Economic Science Press: Beijing, China, 2012. (In Chinese) [Google Scholar]
- Wu, J.E.; Zeng, H.H.; Chen, C.F.; Liu, W.J. Can intercropping with the Chinese medicinal herbs change the water use of the aged rubber trees? Agric. Water Manag. 2019, 226, 105803. [Google Scholar] [CrossRef]
- Vijayakumar, K.R.; Dey, S.K.; Chandrasekhar, T.R.; Devakumar, A.S.; Mohankrishna, T.; Sanjeeva, R.P.; Sethuraj, M.R. Irrigation requirement of rubber trees (Hevea brasiliensis) in the subhumid tropics. Agric. Water Manag. 1998, 35, 245–259. [Google Scholar] [CrossRef]
- Wu, J.E.; Liu, W.J.; Chen, C.F. Below-ground interspecific competition for water in a rubber agroforestry system may enhance water utilization in plants. Sci. Rep. 2016, 6, 19502. [Google Scholar] [CrossRef]
- Zou, X.; Zhu, X.A.; Zhu, P.; Singh, A.K.; Zakari, S.; Yang, B.; Chen, C.F.; Liu, W.J. Soil quality assessment of different Hevea brasiliensis plantations in tropical China. J. Environ. Manag. 2021, 285, 112147. [Google Scholar] [CrossRef]
- Lin, Y.X.; Zhang, Y.P.; Zhao, W.; Dong, Y.X.; Fei, X.H.; Song, Q.G.; Sha, L.Q.; Wang, S.S.; Grace, J. Pattern and driving factor of intense defoliation of rubber plantations in SW China. Ecol. Indic. 2018, 94, 104–116. [Google Scholar] [CrossRef]
- Cao, X.; Yang, P.; Engel, B.A.; Li, P. The effects of rainfall and irrigation on cherry root water uptake under drip irrigation. Agric. Water Manag. 2018, 197, 9–18. [Google Scholar] [CrossRef]
- Mengel, K.; Kirkby, E.A.; Kosegarten, H.; Appel, T. Principles of Plant Nutrition; Springer: Dordrecht, The Netherlands, 2001. [Google Scholar]
- Wu, J.E.; Zeng, H.H.; Chen, C.F.; Liu, W.J.; Jiang, X.J. Intercropping the Sharp-Leaf Galangal with the Rubber Tree Exhibits Weak Belowground Competition. Forests 2019, 10, 924. [Google Scholar] [CrossRef] [Green Version]
- Chapin III, F.S.; Matson, P.A.; Vitousek, P. Principles of Terrestrial Ecosystem Ecology, 2nd ed.; Springer: New York, NY, USA, 2011. [Google Scholar]
- Vitousek, P.M.; Porder, S.; Houlton, B.Z.; Chadwick, O.A. Terrestrial phosphorus limitation: Mechanisms, implications, and nitrogen-phosphorus interactions. Ecol. Appl. 2010, 20, 5–15. [Google Scholar] [CrossRef] [Green Version]
- Niklas, K.J. Plant allometry, leaf nitrogen and phosphorus stoichiometry, and interspecific trends in annual growth rates. Ann. Bot. 2005, 97, 155–163. [Google Scholar] [CrossRef] [Green Version]
- Sardans, J.; Rivas-Ubach, A.; Peñuelas, J. The elemental stoichiometry of aquatic and terrestrial ecosystems and its relationships with organismic lifestyle and ecosystem structure and function: A review and perspectives. Biogeochemistry 2012, 111, 1–39. [Google Scholar] [CrossRef]
- Zechmeister-Boltenstern, S.; Keiblinger, K.M.; Mooshammer, M.; Penuelas, J.; Richter, A.; Sardans, J.; Wanek, W. The application of ecological stoichiometry to plant-microbial-soil organic matter transformations. Ecol. Monogr. 2015, 85, 133–155. [Google Scholar] [CrossRef] [Green Version]
- Vrignon-Brenas, S.; Gay, F.; Ricard, S.; Snoeck, D.; Perron, T.; Mareschal, L.; Laclau, J.P.; Gohet, E.; Malagoli, P. Nutrient management of immature rubber plantations. A review. Agron. Sustain. Dev. 2019, 39, 11. [Google Scholar] [CrossRef] [Green Version]
- Chotiphan, R.; Vaysse, L.; Lacote, R.; Gohet, E.; Thaler, P.; Sajjaphan, K.; Bottier, C.; Char, C.; Liengprayoon, S.; Gay, F. Can fertilization be a driver of rubber plantation intensification? Ind. Crops Prod. 2019, 141, 111813. [Google Scholar] [CrossRef]
- Ministry of Agriculture, China. Technical Regulations for Cultivation of Rubber Tree; NY/T 221-2006; Ministry of Agriculture, China: Beijing, China, 2006. (In Chinese)
- Everard, K.; Seabloom, E.W.; Harpole, W.S.; de Mazancourt, C. Plant Water Use Affects Competition for Nitrogen: Why Drought Favors Invasive Species in California. Am. Nat. 2010, 175, 85–97. [Google Scholar] [CrossRef] [Green Version]
- FAO. State of the World’s Forests 2016. 2016. Available online: https://www.fao.org/3/i5850e/i5850e.pdf (accessed on 12 June 2022).
- Guardiola-Claramonte, M.; Troch, P.A.; Ziegler, A.D.; Giambelluca, T.W.; Durcik, M.; Vogler, J.B.; Nullet, M.A. Hydrologic effects of the expansion of rubber (Hevea brasiliensis) in a tropical catchment. Ecohydrology 2010, 3, 306–314. [Google Scholar] [CrossRef]
- Wu, J.E.; Zeng, H.H.; Zhao, F.; Chen, C.F.; Singh, A.K.; Jiang, X.J.; Yang, B.; Liu, W.J. Plant hydrological niches become narrow but stable as the complexity of interspecific competition increases. Agric. For. Meteorol. 2022, 320, 108953. [Google Scholar] [CrossRef]
- Balasubramanian, D.; Zhang, Y.P.; Grace, J.; Sha, L.Q.; Jin, Y.Q.; Zhou, L.G.; Lin, Y.X.; Zhou, R.W.; Gao, J.B.; Song, H.Q.; et al. Soil organic matter as affected by the conversion of natural tropical rainforest to monoculture rubber plantations under acric ferralsols. Catena 2020, 195, 104753. [Google Scholar] [CrossRef]
- Zhu, X.A.; Liu, W.J.; Yuan, X.; Chen, C.F.; Zhu, K.; Zhang, W.J.; Yang, B. Aggregate stability and size distribution regulate rainsplash erosion: Evidence from a humid tropical soil under different land-use regimes. Geoderma 2022, 420, 115880. [Google Scholar] [CrossRef]
- Fry, B. Stable Isotope Ecology; Springer: New York, NY, USA, 2006. [Google Scholar]
- Phillips, D.L.; Newsome, S.D.; Gregg, J.W. Combining sources in stable isotope mixing models: Alternative methods. Oecologia 2005, 144, 520–527. [Google Scholar] [CrossRef]
- Phillips, D.L.; Gregg, J.W. Source partitioning using stable isotopes: Coping with too many sources. Oecologia 2003, 136, 261–269. [Google Scholar] [CrossRef]
- Parnell, A.C.; Phillips, D.L.; Bearhop, S.; Semmens, B.X.; Ward, E.J.; Moore, J.W.; Jackson, A.L.; Grey, J.; Kelly, D.J.; Inger, R. Bayesian stable isotope mixing models. Environmetrics 2013, 24, 387–399. [Google Scholar] [CrossRef] [Green Version]
- Phillips, D.L.; Inger, R.; Bearhop, S.; Jackson, A.L.; Moore, J.W.; Parnell, A.C.; Semmens, B.X.; Ward, E.J. Best practices for use of stable isotope mixing models in food-web studies. Can. J. Zool. 2014, 92, 823–835. [Google Scholar] [CrossRef] [Green Version]
- R Core Team. A Language and Environment for Statistical Computing; R Foundation for R Foundation for Statistical Computing: Vienna, Austria, 2014. [Google Scholar]
- Schulten, H.R.; Schnitzer, M. The chemistry of soil organic nitrogen: A review. Biol. Fertil. Soils. 1997, 26, 1–15. [Google Scholar] [CrossRef]
- Jobbágy, E.G.; Jackson, R.B. The vertical distribution of soil organic carbon and its relation to climate and vegetation. Ecol. Appl. 2000, 10, 423–436. [Google Scholar] [CrossRef]
- Bhattacharya, A. Soil Water Deficit and Physiological Issues in Plants, 1st ed.; Springer: Singapore, 2021. [Google Scholar]
- Huang, D.Y.; Xu, Y.G.; Zhou, B.; Zhang, H.H.; Lan, J.B. Wet deposition of nitrogen and sulfur in Guangzhou, a subtropical area in South China. Environ. Monit. Assess. 2010, 171, 429–439. [Google Scholar] [CrossRef]
- Wu, J.E.; Zeng, H.H.; Zhao, F.; Chen, C.F.; Liu, W.J.; Yang, B.; Zhang, W.J. Recognizing the role of plant species composition in the modification of soil nutrients and water in rubber agroforestry systems. Sci. Total Environ. 2020, 723, 138042. [Google Scholar] [CrossRef]
- Kramer, C.; Gleixner, G. Soil organic matter in soil depth profiles: Distinct carbon preferences of microbial groups during carbon transformation. Soil Biol. Biochem. 2008, 40, 425–433. [Google Scholar] [CrossRef]
- Pries, C.E.H.; Sulman, B.N.; West, C.; O’Neill, C.; Poppleton, E.; Porras, R.C.; Castanha, C.; Zhu, B.; Wiedemeier, D.B.; Torn, M.S. Root litter decomposition slows with soil depth. Soil Biol. Biochem. 2018, 125, 103–114. [Google Scholar] [CrossRef] [Green Version]
- Craine, J.M.; Gelderman, T.M. Soil moisture controls on temperature sensitivity of soil organic carbon decomposition for a mesic grassland. Soil Biol. Biochem. 2011, 43, 455–457. [Google Scholar] [CrossRef]
- Plaza, C.; Giannetta, B.; Fernández, J.M.; López-de-Sá, E.G.; Polo, A.; Gascó, G.; Méndez, A.; Zaccone, C. Response of different soil organic matter pools to biochar and organic fertilizers. Agric. Ecosyst. Environ. 2016, 225, 150–159. [Google Scholar] [CrossRef]
- Swarowsky, A.; Dahlgren, R.A.; Tate, K.W.; Hopmans, J.W.; O’Geen, A.T. Catchment-Scale Soil Water Dynamics in a Mediterranean-Type Oak Woodland. Vadose Zone J. 2011, 10, 800–815. [Google Scholar] [CrossRef] [Green Version]
- Dawson, T.E.; Mambelli, S.; Plamboeck, A.H.; Templer, P.H.; Tu, K.P. Stable Isotopes in Plant Ecology. Annu. Rev. Ecol. Syst. 2002, 33, 507–559. [Google Scholar] [CrossRef]
- Gat, J.R. Oxygen and hydrogen isotopes in the hydrologic cycle. Annu. Rev. Earth Planet. Sci. 1996, 24, 225–262. [Google Scholar] [CrossRef] [Green Version]
- Benettin, P.; Volkmann, T.H.M.; von Freyberg, J.; Frentress, J.; Penna, D.; Dawson, T.E.; Kirchner, J. Effects of climatic seasonality on the isotopic composition of evaporating soil waters. Hydrol. Earth Syst. Sci. 2018, 22, 2881–2890. [Google Scholar] [CrossRef] [Green Version]
- Cui, J.; Tian, L.; Biggs, T.W.; Wen, R. Deuterium-excess determination of evaporation to inflow ratios of an alpine lake: Implications for water balance and modeling. Hydrol. Processes 2016, 31, 1034–1046. [Google Scholar] [CrossRef]
- Franzluebbers, A.J. Water infiltration and soil structure related to organic matter and its stratification with depth. Soil Tillage Res. 2002, 66, 197–205. [Google Scholar] [CrossRef]
- Pierret, A.; Maeght, J.L.; Clément, C.; Montoroi, J.P.; Hartmann, C.; Gonkhamdee, S. Understanding deep roots and their functions in ecosystems: An advocacy for more unconventional research. Ann. Bot. 2016, 118, 621–635. [Google Scholar] [CrossRef] [Green Version]
- Zhai, D.L.; Yu, H.Y.; Chen, S.C.; Ranjitkar, S.; Xu, J.C. Responses of rubber leaf phenology to climatic variations in Southwest China. Int. J. Biometeorol. 2019, 63, 607–616. [Google Scholar] [CrossRef]
- Roux, X.L.; Bariac, T. Seasonal variations in soil, grass and shrub water status in a West African humid savanna. Oecologia 1998, 113, 456–466. [Google Scholar] [CrossRef]
- Marschner, H. Marschner’s Mineral Nutrition of Higher Plants, 3rd ed.; Academic Press: Waltham, MA, USA, 2011. [Google Scholar]
- Tinker, P.B.; Nye, P.H. Solute Movement in the Rhizosphere; Oxford University Press: Oxford, UK, 2000. [Google Scholar]
- Cramer, M.D.; Hawkins, H.J.; Verboom, G.A. The importance of nutritional regulation of plant water flux. Oecologia 2009, 1, 15–24. [Google Scholar] [CrossRef]
- Kupper, P.; Rohula, G.; Saksing, L.; Sellin, A.; Lohmus, K.; Ostonen, I.; Helmisaari, H.S.; Sober, A. Does soil nutrient availability influence night-time water flux of aspen saplings? Environ. Exp. Bot. 2012, 82, 37–42. [Google Scholar] [CrossRef]
- Scholz, F.G.; Bucci, S.J.; Goldstein, G.; Meinzer, F.C.; Franco, A.C.; Miralles-Wilhelm, F. Removal of nutrient limitations by long-term fertilization decreases nocturnal water loss in savanna trees. Tree Physiol. 2007, 27, 551–559. [Google Scholar] [CrossRef] [Green Version]


Publisher’s Note: MDPI stays neutral with regard to jurisdictional claims in published maps and institutional affiliations. |
© 2022 by the authors. Licensee MDPI, Basel, Switzerland. This article is an open access article distributed under the terms and conditions of the Creative Commons Attribution (CC BY) license (https://creativecommons.org/licenses/by/4.0/).
Share and Cite
Song, H.; Miao, Z.; Jiang, G.; Zhang, Y.; Lu, F.; Deng, F.; Xie, E.; Wu, J.; Zhao, F. Relationships between the Water Uptake and Nutrient Status of Rubber Trees in a Monoculture Rubber Plantation. Agronomy 2022, 12, 1999. https://doi.org/10.3390/agronomy12091999
Song H, Miao Z, Jiang G, Zhang Y, Lu F, Deng F, Xie E, Wu J, Zhao F. Relationships between the Water Uptake and Nutrient Status of Rubber Trees in a Monoculture Rubber Plantation. Agronomy. 2022; 12(9):1999. https://doi.org/10.3390/agronomy12091999
Chicago/Turabian StyleSong, Huixian, Zhuojun Miao, Guomei Jiang, Yulong Zhang, Fupeng Lu, Fujia Deng, Enhong Xie, Junen Wu, and Fan Zhao. 2022. "Relationships between the Water Uptake and Nutrient Status of Rubber Trees in a Monoculture Rubber Plantation" Agronomy 12, no. 9: 1999. https://doi.org/10.3390/agronomy12091999