Article

Seed Soaking with Sodium Selenate as a Biofortification Approach in Bread Wheat: Effects on Germination, Seedling Emergence, Biomass and Responses to Water Deficit

1
Centre for the Research and Technology of Agro-Environmental and Biological Sciences (CITAB), University of Trás-os-Montes and Alto Douro (UTAD), Quinta de Prados, 5000-801 Vila Real, Portugal
2
Association BLC3—Technology and Innovation Campus, Centre Bio R&D Unit, Rua Comendador Emílio Augusto Pires 14, Edifício SIDE UP, 5340-257 Macedo de Cavaleiros, Portugal
3
Chemistry Department, University of Trás-os-Montes and Alto Douro (UTAD), Quinta de Prados, 5000-801 Vila Real, Portugal
4
Departamento de Producción Vegetal, Universitat Politècnica de València, Camíno de Vera s/n, 46022 Valencia, Spain
5
Plant Cytogenomics Laboratory, Department of Genetics and Biotechnology, University of Trás-os-Montes and Alto Douro (UTAD), Quinta de Prados, 5000-801 Vila Real, Portugal
*
Author to whom correspondence should be addressed.
Agronomy 2022, 12(8), 1975; https://doi.org/10.3390/agronomy12081975
Submission received: 14 July 2022 / Revised: 11 August 2022 / Accepted: 14 August 2022 / Published: 21 August 2022
(This article belongs to the Special Issue Effective Methods for Improving Seed Germination and Seed Quality)

Abstract

:
Selenium (Se) biofortification by seed treatments has been poorly explored in wheat due to the difficulties in establishing seed treatments without compromising plant productive traits. We investigated the effects of Se seed soaking as a pre-sowing treatment in bread wheat. Five soaking periods and six Se concentrations were assessed on germination and seedling traits and compared to unsoaked seeds. Twelve hours of soaking was found beneficial for most tested Se concentrations. Then, we evaluated the effects of untreated, 0, 2.5 and 25 mM Se in 12 h seed soaking treatments along the wheat crop cycle under water-deficit (WD) and well-watered (WW) conditions in a pot experiment. Our results evidenced that 12 h of 2.5 mM Se soaking did not affect the germination percentage, and speed-up seedling emergence resulted in a considerable Se seed uptake. These plants also displayed enhanced antioxidant capacity and vegetative biomass accumulation, especially under WD. The treatment with 25 mM of Se negatively affected aerial biomass, suggesting potential toxicity. Physiological responses of Se-treated plants remained unchanged, as well as grain traits. Altogether, we propose that 12 h soaking with 2.5 mM Se is a promissory pre-sowing approach to enrich bread wheat grain and straw, particularly under water-limited environments.

1. Introduction

Selenium (Se) is a beneficial nutrient for plants. The Se concentration on plants is usually suboptimal due to the low Se concentration in many agricultural soils [1]. Se contents soils are low since it exists mainly in insoluble forms, as in high-Fe, low-pH and certain leached soils, resulting in reduced availability to plants [2]. To overcome sub-optimal levels found in plants, soil supplementation with this nutrient via fertilizers is often used.
Presently, the relevance of Se is boosted because it is also an essential trace element for human and animal health [3]. It is expected that 15–20% of the world’s population has Se deficiency [4,5]. Many disorders such as higher viral infection vulnerability, thyroid dysfunction, cancer and cardiovascular diseases are associated with Se deficiency [1]. To face the Se deficiency in human food is necessary to complement the meals by ingesting supplements or foodstuffs resulting from agronomic biofortification [3,6]. Although dietary supplements are easy to take in the correct dose, they represent an added cost for consumers and require specialised knowledge or recommendation for their intake. Agri-foods resulting from fortification programmes are duly framed in the population’s general needs to which they are destined. Their consumption is safe without representing an extra expense for the consumers. Several strategies to fortify edible crops also improve plant growth and development, making selection and breeding an important role [7]. Despite the efforts, the complexity of the basic tolerance mechanisms involved, a lack of optimal selection criteria, and variations in plant response at different growth stages have limited commercial success [7].
Strategies such as soil and foliar fertilisation have been used to supply plants with numerous nutrients, including Se. However, the choice of each approach depends on the target crop and the farmer’s agronomic capacity. The application of Se during the vegetative crop growth stage depends on the availability of the mechanised tools, the land slope, the crop area and the time to perform the task with a considerable amount of cost associated. Another alternative strategy is the application of Se to seeds before sowing [8]. This procedure is easy to implement by farmers and is considered low-cost, avoiding additional costs through mechanisation or workforce necessary to perform later field applications [7]. Pre-sowing treatment such as priming or soaking has been widely used to improve seed germination and seedling emergence by inducing pre-germination metabolic activity, even under adverse conditions [9,10,11,12].
Bread wheat (Triticum aestivum L.) is one of the most cultivated crops globally, with a production area estimated at approximately 215 million hectares in the last four years [13]. The consumption of this staple food accounts for 19% of the calories in the global human diet since the grain is rich in carbohydrates and has a higher protein content than other cereals such as rice, maize and rye [14,15]. Presently, the existing knowledge on the capability of the wheat crop to uptake and incorporate Se in their tissues or organs, the availability and consumption of Se by the plant, and the impact of Se on plant development and growth is scarce. Indeed, this is conditioning the development of biofortification approaches based on seed treatments such as seed soaking. To ensure suitable and efficient Se application is necessary to understand the boundaries [16]. Many studies tested the Se crop supplementation during plant development by foliar spray and soil fertilisation. Concentrations tested were below 100 g Se ha−1, and generally, a positive effect on plant growth and development was noticed [3,17]. Most of the studies focused more on the yield and Se seed content at the mature stage and less on germination, plant development and morphologic or physiologic responses [18,19,20,21]. Previous studies have evidenced that seed soaking with Se is an effective technique to enrich Se contents in seeds, including bread wheat [22]. This work also pointed out the need to conduct a careful optimisation of the procedures, including the test of a range of concentrations and soaking times. This work did not consider the implications of these different soaking parameters in plant development and physiological and morphological traits, which is relevant when soaked seeds are expected to be sown and still present a considerable yield. The Se effects on plant growth, from germination to mature plants, need to be evaluated to select the concentrations that do not impair germination, biomass accumulation and yield [3,23,24,25].
Drought stress during developmental stages in wheat has been considered one of the major factors that affect the grain yield and quality [26]. This is particularly true if stress occurs during the early growth stages, compromising stand establishment and the final crop yield and productivity [27]. In addition to increasing seed germination performance, pre-sowing seed treatments such as soaking with beneficial substances or nutrients were described as a promissory approach to cope with environmental constraints [12]. Such a dual beneficial response was already described for Se seed treatments [27].
Herein, we explore the hypothesis that Se pre-sowing application by seed soaking, expected to enhance Se content in seeds, will enhance plant performance and productive traits under water deficit conditions. This work aims to investigate the effects of Se seed soaking as a pre-sowing treatment in bread wheat in germination and productive traits. Five soaking periods and six Se concentrations were assessed on germination and seedling traits and compared to unsoaked seeds. Then, on selected Se concentrations and soaking time, a pot trial was conducted to assess the effects of Se treatments in morphological, physiological, biochemical and yield level traits under well-watered and water deficit conditions. At the end, we expect to provide an effective Se seed treatment without compromising yield that would constitute a cost-effective, faster and simple method for farmers to supplement Se for crop production with potential application in biofortification.

2. Materials and Methods

2.1. Plant Material

The seeds of Triticum aestivum L. cultivar “Jordão” used in this study were provided by the Plant Breeding Station of Instituto Nacional de Investigação Agrária e Veterinária (Elvas, Portugal). This cultivar is one of the most representative varieties of bread wheat in the country [18] and has belonged to the Portuguese Catalogue of Varieties since 1996 [28]. It was selected due to its suitability for laboratory and field trials but also for presenting some characteristics such as good adaptation to Mediterranean conditions, semi-precocious vegetative cycle, great tillering capacity, high productive performance, high baking potential and high resistance against several wheat diseases [28,29]. Seeds used in this study were harvested in the summer of 2016 and then stored in standard seed bank conditions (−20 °C, Relative humidity below 25% and dark conditions) until used (December 2016).

2.2. Germination Experiment

Wheat seeds were disinfected using a solution of sodium hypochlorite 1% for 3 min and then washed with distilled water. In order to access good germination of wheat seeds, two different treatments were performed: selenium (Se) concentration and soaking time. Seeds were soaked in six aqueous solutions of sodium selenate (Na2SeO4, Applichem GmbH, Darmstadt, Germany) solution 0, 0.25, 1, 2.5, 5 and 25 mM. Sodium selenate solutions were freshly prepared with distilled water before use, and the 0 mM Se concentration refers to seeds just soaked in water (control). An additional control treatment was made, in which seeds were not soaked (untreated control). Selenate was chosen, instead of selenite, as a preferred source of Se due to better translocation capacity from root to shoot [16,17]. The ratio of seed weight per solution volume was 1:10 g mL−1. Four soaking periods (SP) were tested: 4, 9, 12 and 24 h for each Se concentration at room temperature (20 °C). Occasionally, the Se solution plus seeds were stirred. Seeds were removed from the solution, washed three times in distilled water, and dried between two layers of filter paper, then let dry 2 h inside a dry oven at 22 ± 1 °C. Then, seeds were used in germination tests.
Se treated seeds, control water soaked and control untreated seeds were placed inside glass Petri dishes onto wet filter paper and were kept for 48 h in the absence of light at room temperature (~20 °C) for germination. For each experimental condition, triplicates were made, each with 15 seeds per Petri dish. Two days after sowing (DAS), seedlings were examined to confirm roots and radicle protrusion, and the seed germination percentage was calculated. Only seeds with visible radicle (at least 1 mm in length) and roots were considered germinated. So as to investigate putative differences caused by Se treatments in root length, the three primary roots per seed were measured using a millimetric ruler. Cumulative root length was obtained by the sum of all root lengths, considering that secondary roots emerge.

2.2.1. Electrolyte Leakage

Electrolyte leakage (EL) was used to access membrane permeability and was analysed using Mettler Toledo Electro conductivity equipment. Seeds soaked 4, 9, 12 and 24 h in 0, 0.25, 1, 2.5, 5 and 25 mM and untreated seeds were used. After treatments, 15 seeds per experimental condition were considered for analysis. These represent 5 biological replicates, each with 3 pooled seeds. The EL (%) was determined as described by Tounekti et al. [30]. Briefly, seeds were placed in tubes containing 5 mL of double-distilled water and then incubated at 25 °C for 24 h in a rotary shaker. The initial electrical conductivity of the medium (EC1) was measured using a conductivity meter. Samples were autoclaved at 121 °C for 15 min to release all electrolytes and then cooled to 25 °C before the final electrical conductivity (EC2) measure. The EL (%) was calculated as follow: EL (%) = (EC1/EC2) × 100.

2.2.2. Selenium Determination

The Se contents present in the seeds after 12 h soaking treatment with 0, 0.25, 0.5, 2.5, 5 and 25 mM Se were assayed fluorometrically after a modified nitric acid/hydrogen peroxide digestion [31] and a reaction with 2,3-diaminonaphthalene (DAN) described by Costa-Silva et al. [32]. Briefly, dried grain samples were ground in the Retsch Ultra Centrifugal Mill ZM 200 using a 1.0 mm screen. Two hundred milligrams of the sample were weighed and transferred to a 160 mm × 16 mm acid-washed glass culture tube for digestion with the nitric acid procedure as described by Boldrin et al. [33]. Then, 2 mL of concentrated nitric acid and 1 mL of concentrated hydrogen peroxide were added, and the mixture was mixed by vortexing. The samples were left overnight at room temperature. Subsequently, samples were heated for 1 h at each temperature, 50, 80, 100, 120 and finally left overnight at 155 °C. Then, samples were left to cool down to room temperature.
After digestion, 0.5 mL of 5 M HCl were added, tubes were closed with Teflon-faced screw caps, and the mixture was heated at 100 °C for 30 min. After room temperature cooling, 10 mL of 10 mM EDTA solution and 2 mL of DAN were added, vortex-mixed, and heated at 60 °C for 30 min, then cooled down at room temperature. Five millilitres of cyclohexane were added, vigorously mixed and allowed to separate into phases. Three millilitres from the organic phase were assayed fluorometrically (FP-777 spectrofluorometer, Jasco, Maryland, USA) with an excitation wavelength of 375 nm and an emission wavelength of 525 nm. The amount of Se was expressed in µg kg−1 of DW after interpolation with a dilution calibration curve constructed with working Se standard solutions [32].

2.3. Pot Trial Description

A pot experiment was conducted to evaluate the effect of a beneficial and detrimental Se soaking treatment on physiological, biochemical, morphological and productive parameters under well-watered (WW) and water deficit conditions (WD). The pot experiment was conducted at the experimental greenhouse in the University of Trás-os-Montes and Alto Douro in Vila Real, Northeast Portugal (41°17′07.0″ N, 7°44′23.5″ W, 465 m a.s.l.). For each experimental condition studied, 20 pots were used, each with 6 L of capacity (20 cm diameter × 20 cm height) filled with Vila Real soil/peat [3:1 (v/v)]. The soil has 5.2 pH in water; 14 g kg−1 of organic matter; 48 mg kg−1 of available P and 130 mg kg−1 of available K. Four seeds per pot were sown manually in the first week of December at 2–3 cm deep. During the first 4 months, plants were kept outside the greenhouse under open-field conditions. Periodic manual weeding was carried out to avoid the competition of invasive plants. Precipitation, radiation, wind and air temperature (minimum and maximum) were recorded from a meteorological station near the experimental area. The emergence of seedlings was scored at 12, 18 and 24 days after sowing (DAS) before stress imposition. After 50% of emergence (middle of December), the length of the seedlings, number of visible and unfolded leaves, number of visible tillers, size of the tillers and number of leaves in each tiller were recorded weekly during the first eight weeks after sowing (Figure 1). The length was determined from the ground to the tip of the longest leaf in millimetres (mm).
Pots were transferred to the inside of the greenhouse at 138 DAS (previously to flag leaf emergence), left in acclimatisation for 1 week, and then were split into two groups (10 pots each) to obtain well-watered plants (WW) and water-deficit plants (WD). WW plants were kept at field capacity, corresponding to 20% soil humidity measured with Time Domain Reflectometry (TDR) equipment. Water deficit was imposed by suppressing soil irrigation until it reached 25% of the soil field capacity, corresponding to 5% TDR. These TDR values were used to monitor soil water contents throughout the experiment (30 days), allowing the adjustment of the water supply to ensure WW and WD conditions.

2.4. Physiological Assay

Leaf gas exchange and chlorophyll fluorescence measurements were performed 25 days after water regimes irrigation was implemented. Measurements were carried out in fully developed and sun-exposed leaves, without visible blemish, and during morning periods from 10 h to 12 h.

2.4.1. Gas Exchange Parameters

Leaf gas exchange measurements were performed using a portable Infra-Red Gas Analyzer system (IRGA, LCpro+ ADC BioScientific Ltd., Hoddesdon, UK), operating in the open mode (1020 μmol m−2 s−1 PAR, 400 ppm CO2, 25 ± 2 °C, and 50–60% Relative Humidity). Net photosynthetic rate (A, μmol CO2 m−2 s−1), transpiration rate (E, μmol m−2 s−1), stomatal conductance for water vapour (gs, mmol H2O m−2 s−1) and intracellular CO2 concentration/ambient CO2 ratio (Ci/Ca) were estimated using the equations developed by von Caemmerer and Farquhar [34]. Intrinsic water-use efficiency (WUEi = A/gs) was calculated.

2.4.2. Chlorophyll a Fluorescence

Chlorophyll a fluorescence variable was measured in vivo on the same leaves and environmental conditions used for gas exchange measurements with a pulse-amplitude-modulated fluorometer (FMS 2, Hansatech Instruments, Norfolk, UK). Before the measures, a small part of the leaves was dark-adapted using leaf clips for 30 min. After the dark-adaptation period, the minimal fluorescence (Fo) was measured when all photosystem II (PSII) reaction centres were open, using a low-intensity pulsed measuring light source.
The maximal fluorescence (Fm) was measured when all PSII reaction centres were closed during a pulse saturating light (0.7 s pulse of 15,000 μmol photons m−2 s−1 of white light). Variable fluorescence (Fv) was calculated by the difference between Fm and Fo (Fm − Fo). The maximum quantum efficiency of PSII was calculated as Fv/Fm = (Fm − Fo)/Fm [35]. Following Fv/Fm estimation, after a 20 s exposure to actinic light (1500 μmol m−2 s−1), light-adapted steady-state fluorescence yield (Fs) was averaged over 2.5 s, followed by exposure to saturating light (15,000 μmol m−2 s−1) for 0.7 s to establish F′m. The sample was shaded for 5 s with a far-red light source to determine F′0. Several fluorescence attributes were calculated [36,37]: photochemical quenching (qP = (F′m − Fs)/(F′m − F′0)), non-photochemical quenching (NPQ = (Fm − F′m)/F′m) and efficiency of electron transport as a measure of the quantum effective efficiency of PSII (ɸPSII = ΔF/F′m = (F′m − Fs)/F′m). The apparent electron transport rate was estimated as ETR (μmol e m−2 s−1) = (ΔF/F′m) × PPFD × 0.5 × 0.84, where PPFD was the photosynthetic photon flux density incident on the leaf, 0.5 was the factor that assumed equal distribution of energy between the two photosystems. The leaf absorbance used was 0.84, a common value for C3 plants [36].

2.5. Biochemical Assay

2.5.1. Photosynthetic Pigments Quantification

The collected fresh leaves were immediately frozen in liquid nitrogen, grounded and stored at −80 °C until use. Chlorophyll a (Chl a), chlorophyll b (Chl b) and carotenoids (Car) were extracted from frozen material by homogenisation with 80% (v/v) acetone following previously published methodologies [38,39,40]. Absorbance values of each extract were immediately recorded in a UV-Vis Spectrophotometer (Varian Cary 100 bio) at 470, 645 and 663 wavelengths against blank (pure solvent (80% acetone)). The pigment concentration in each extract was calculated using the following formulas [39]:
Chl a (μg mL − 1) = Chl a = (12.25 × Abs663.2) − (2.79 × Abs646.8)
Chl b (μg mL − 1) = Chl b = (21.50 × Abs646.8) − (5.10 × Abs663.2)
Chl a + Chl b (μg mL−1) = (7.15 × Abs663.2) + (18.71 × Abs646.8)
Car (μg mL−1) = (1000 × Abs470 − (1.82 × Chl a) − (85.02 × Chl b))∕198
Pigments were expressed as milligram of pigment per gram of dry weight (mg g−1 DW).

2.5.2. Total Soluble Sugars and Proteins

Total soluble proteins (TSP) were quantified spectrophotometrically using the method of Bradford [41]. Bovine serum albumin was in the standard curve dilution.
Total soluble sugars (TSS) were extracted according to Irigoyen et al. [42] by heating the samples in 80% ethanol for 1 h, at 80 °C. Then, the soluble fraction was separated from the solid fraction, and the TSS concentration was determined spectrophotometrically by the anthrone method using glucose as a standard dilution curve [42].

2.5.3. Phenolic Composition Extration

The extraction method was adapted [43] with some modifications. Thirty milligrams of frozen fresh leaves in triplicate were used for extraction with 1.5 mL of 70% aqueous methanol. The mixture was vortexed for 30 s and agitated for 1 h in the dark, then centrifuged (Centrifuge 5804 R, Eppendorf, Hamburg, Germany) at 12,000 rpm for 15 min. Then the supernatant was recovered to a new tube, and the pellet was used for two subsequent extractions with 1.5 mL of aqueous methanol 70%. The volume supernatants recovered was adjusted to 5 mL and centrifuged at 3000 rpm for 10 min to clear from residues and moved to a new tube, which was stored at −20 °C until performing the antioxidant analysis described below. All quantifications were done in quadruplicate using a microplate reader (Multiskan™ GO Microplate Spectrophotometer, Thermo Scientific, Vantaa, Finland). An aliquot of each grounded sample (30 mg) was weighed in triplicate, oven-dried for 24 h, and reweighed. Since the results were expressed by dry weight, this value was used to normalise data.

2.5.4. Total Phenolic Content

The content of total phenolic compounds (TPC) was determined using a classical colourimetry method, following the Folin–Ciocalteu procedure [44]. Twenty microlitres of the extract were added to the microplate well, followed by 100 μL of Folin–Ciocalteu phenol reagent (1:10 in double-distilled water) and 80 μL of 7.5% Na2CO3. The microplates were then incubated at 50 °C for 30 min in the dark. The absorbance was recorded at 750 nm with a microplate reader against blank (70% aqueous methanol). The results were then expressed as mg of gallic acid equivalent per g−1 of DW (mg GAE g−1 DW), using a calibration curve of gallic acid at different concentrations (from 0.0 to 2.5 μg mL−1).

2.5.5. Total Flavonoids Content

The Total Flavonoids (TFC) of extracts were determined by the classic colourimetry procedure [45]. Twenty-five microlitres of the extract were added to each microplate well, followed by 100 μL of ultra-pure water and 10 μL of 5% NaNO2. Then, the microplates were incubated at room temperature for 5 min under dark conditions. After this period, 15 μL of 10% AlCl3 were added to each well, and microplates were again incubated at room temperature under dark conditions for 6 min. Then, 50 μL of 1 M NaOH and 50 μL of ultra-pure water were added to each well and mixed thoroughly. The absorbance values were then recorded at 510 nm in a microplate reader against blank (ultrapure water instead of extract). The results were expressed as mg of catechin equivalent per g−1 of DW (mg CE g−1 DW) using a calibration curve with a dilution standard curve of (+)-catechin [46] at different concentrations (from 0.0 to 1.0 mg mL−1).

2.5.6. Ortho-Diphenols Content

The ortho-diphenols (OD) were determined using a classical colourimetry method, following the sodium molybdate reagent [44,47]. In each microplate well were added 40 μL of sodium molybdate (5% (w/v) in 50% MeOH (v/v)), and 160 μL of extract. Then, microplates were incubated at room temperature for 15 min in the dark. The absorbance values were recorded at 375 nm with a microplate reader against blank (70% aqueous methanol). The results were then expressed as mg of gallic acid equivalent per g−1 of DW (mg GAE g−1 DW), using a calibration curve of gallic acid at different concentrations (starting from 0.0 to 2.5 μg mL−1).

2.5.7. Antioxidant Activity—ABTS+

The radical-scavenging activity was determined by the 2,2-azino-bis (3-ethylbenzothiazoline)-6 sulfonic acid (ABTS+) radical cation decolourisation assay. For this assay, ABTS+ radical was prepared by mixing an ABTS+ stock solution with 2.45 mM potassium persulfate. The ABTS+ solution was diluted with 20 mM sodium acetate buffer (pH 4.5) to an absorbance of 0.70 ± 0.01 at 734 nm. The reaction was started by adding 25, 50, 100, 150 and 200 μL of the methanolic extract to 2 mL of the diluted ABTS+ solution. ABTS+ bleaching was monitored at 734 nm at 25 °C for at least 30 min, and the percentage of discolouration after 15 min was used to measure antioxidant activity. The total antioxidant capacity of the extract was calculated as Trolox Equivalent Antioxidant Capacity (TEAC) and was expressed as µmol of Trolox equivalents per g−1 of DW sample (µM TE g−1 DW). A standard curve of the percentage of ABTS+ inhibition in the function of Trolox concentration (from 0.004 to 0.5 mM) was used for the calculations [48].

2.6. Morphology and Yield Assessment

After 210 days of sowing, 20 plants per experimental condition, randomly selected, were characterised for above-ground parameters. Plant height, first and second node size, spike size, number of spikelets, number of tillers, grain number and weight were scored. Grains and straw dry masses were calculated after drying the samples at 65 °C for 5 days.
Harvest index (HI) was calculated as follows:
HI (%) = [grain weight]/[plant biomass] × 100

2.7. Statistical Analysis

Data analysis was performed using the software programme JMP for Windows (v14.0). After testing for ANOVA assumptions (homogeneity of variances and normality), statistical differences were evaluated by two-way analysis of variance (ANOVA), followed by the post-hoc Tukey’s test (p < 0.05).
For the germination trial, analysis was done by testing the effect of the imbibition time (SP), Se concentration (S) and the interaction of both factors (SP × S) on the evaluation of germination percentage root length and membrane stability. For emergence and initial plant grown trial, analysis was done by testing the effect of the Se concentration (S), time (DAS) and the interaction of both factors (DAS × S) on the evaluation of seedlings length, the number of leaves, number and size of tillers. For the pot trial, analysis was done by testing the effect of the water availability (W), Se treatment (S) and the interaction of both factors (W × S) on the evaluation of morphological, physiological and biochemical parameters.

3. Results

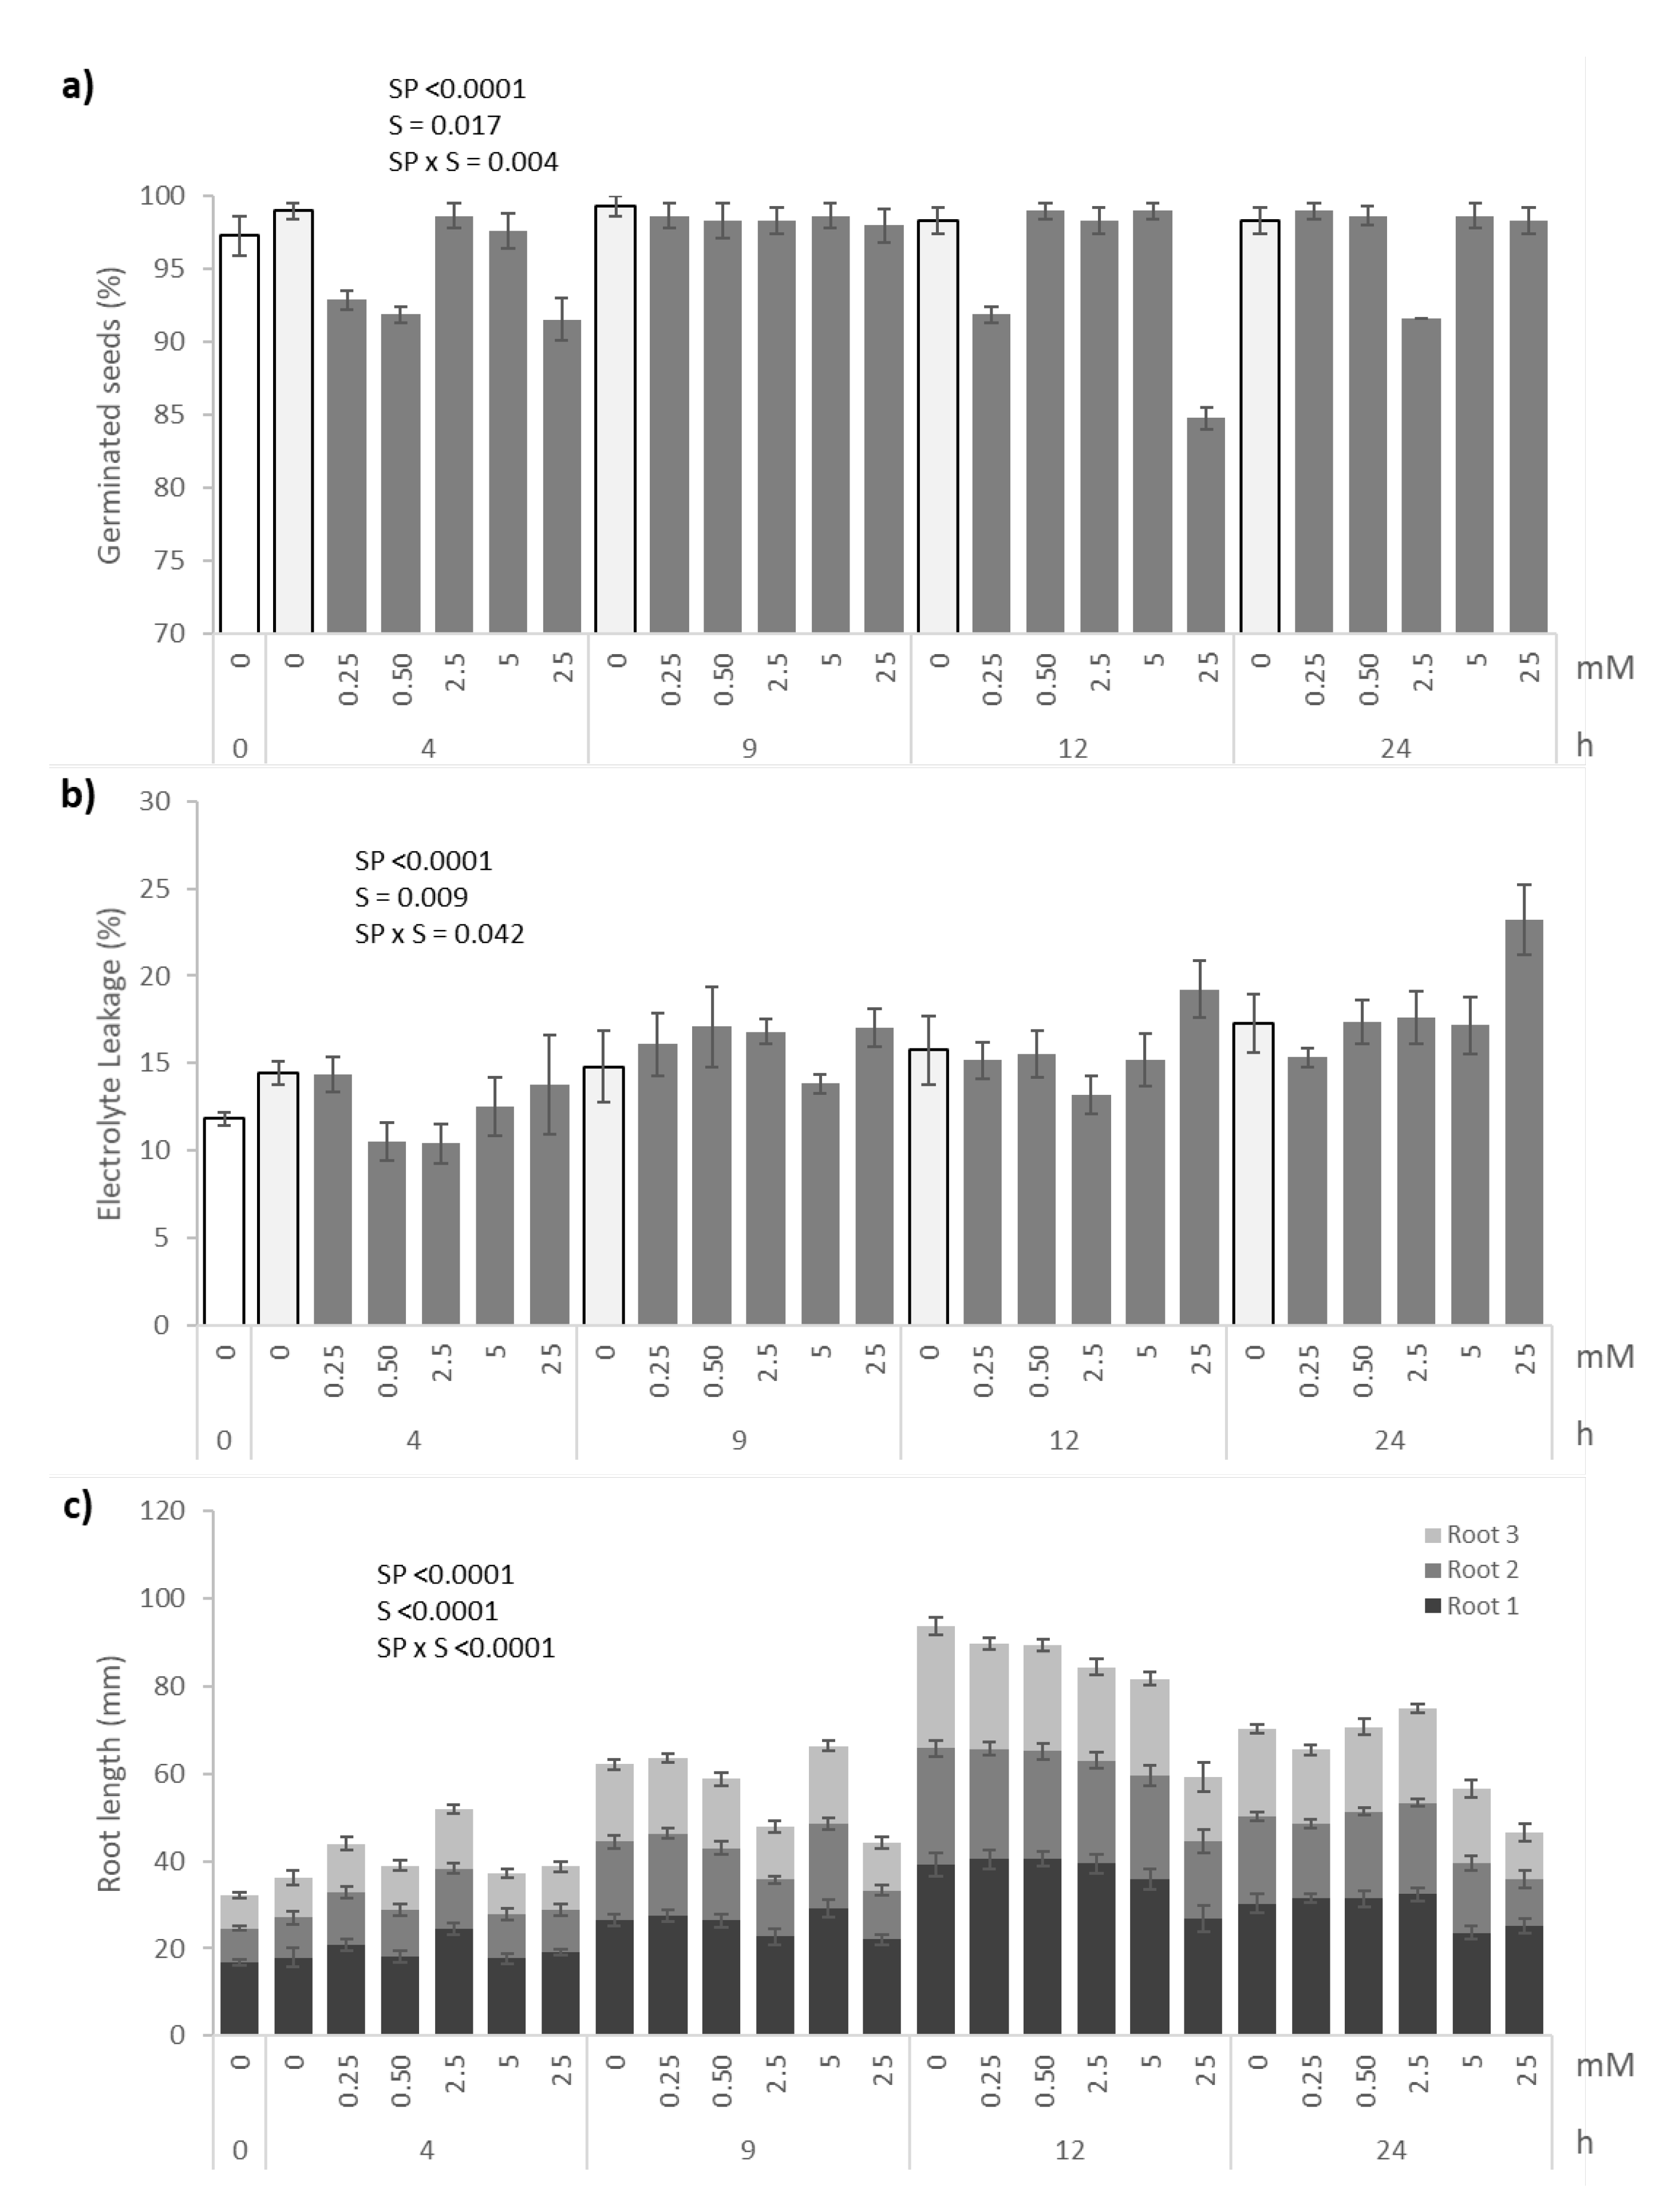
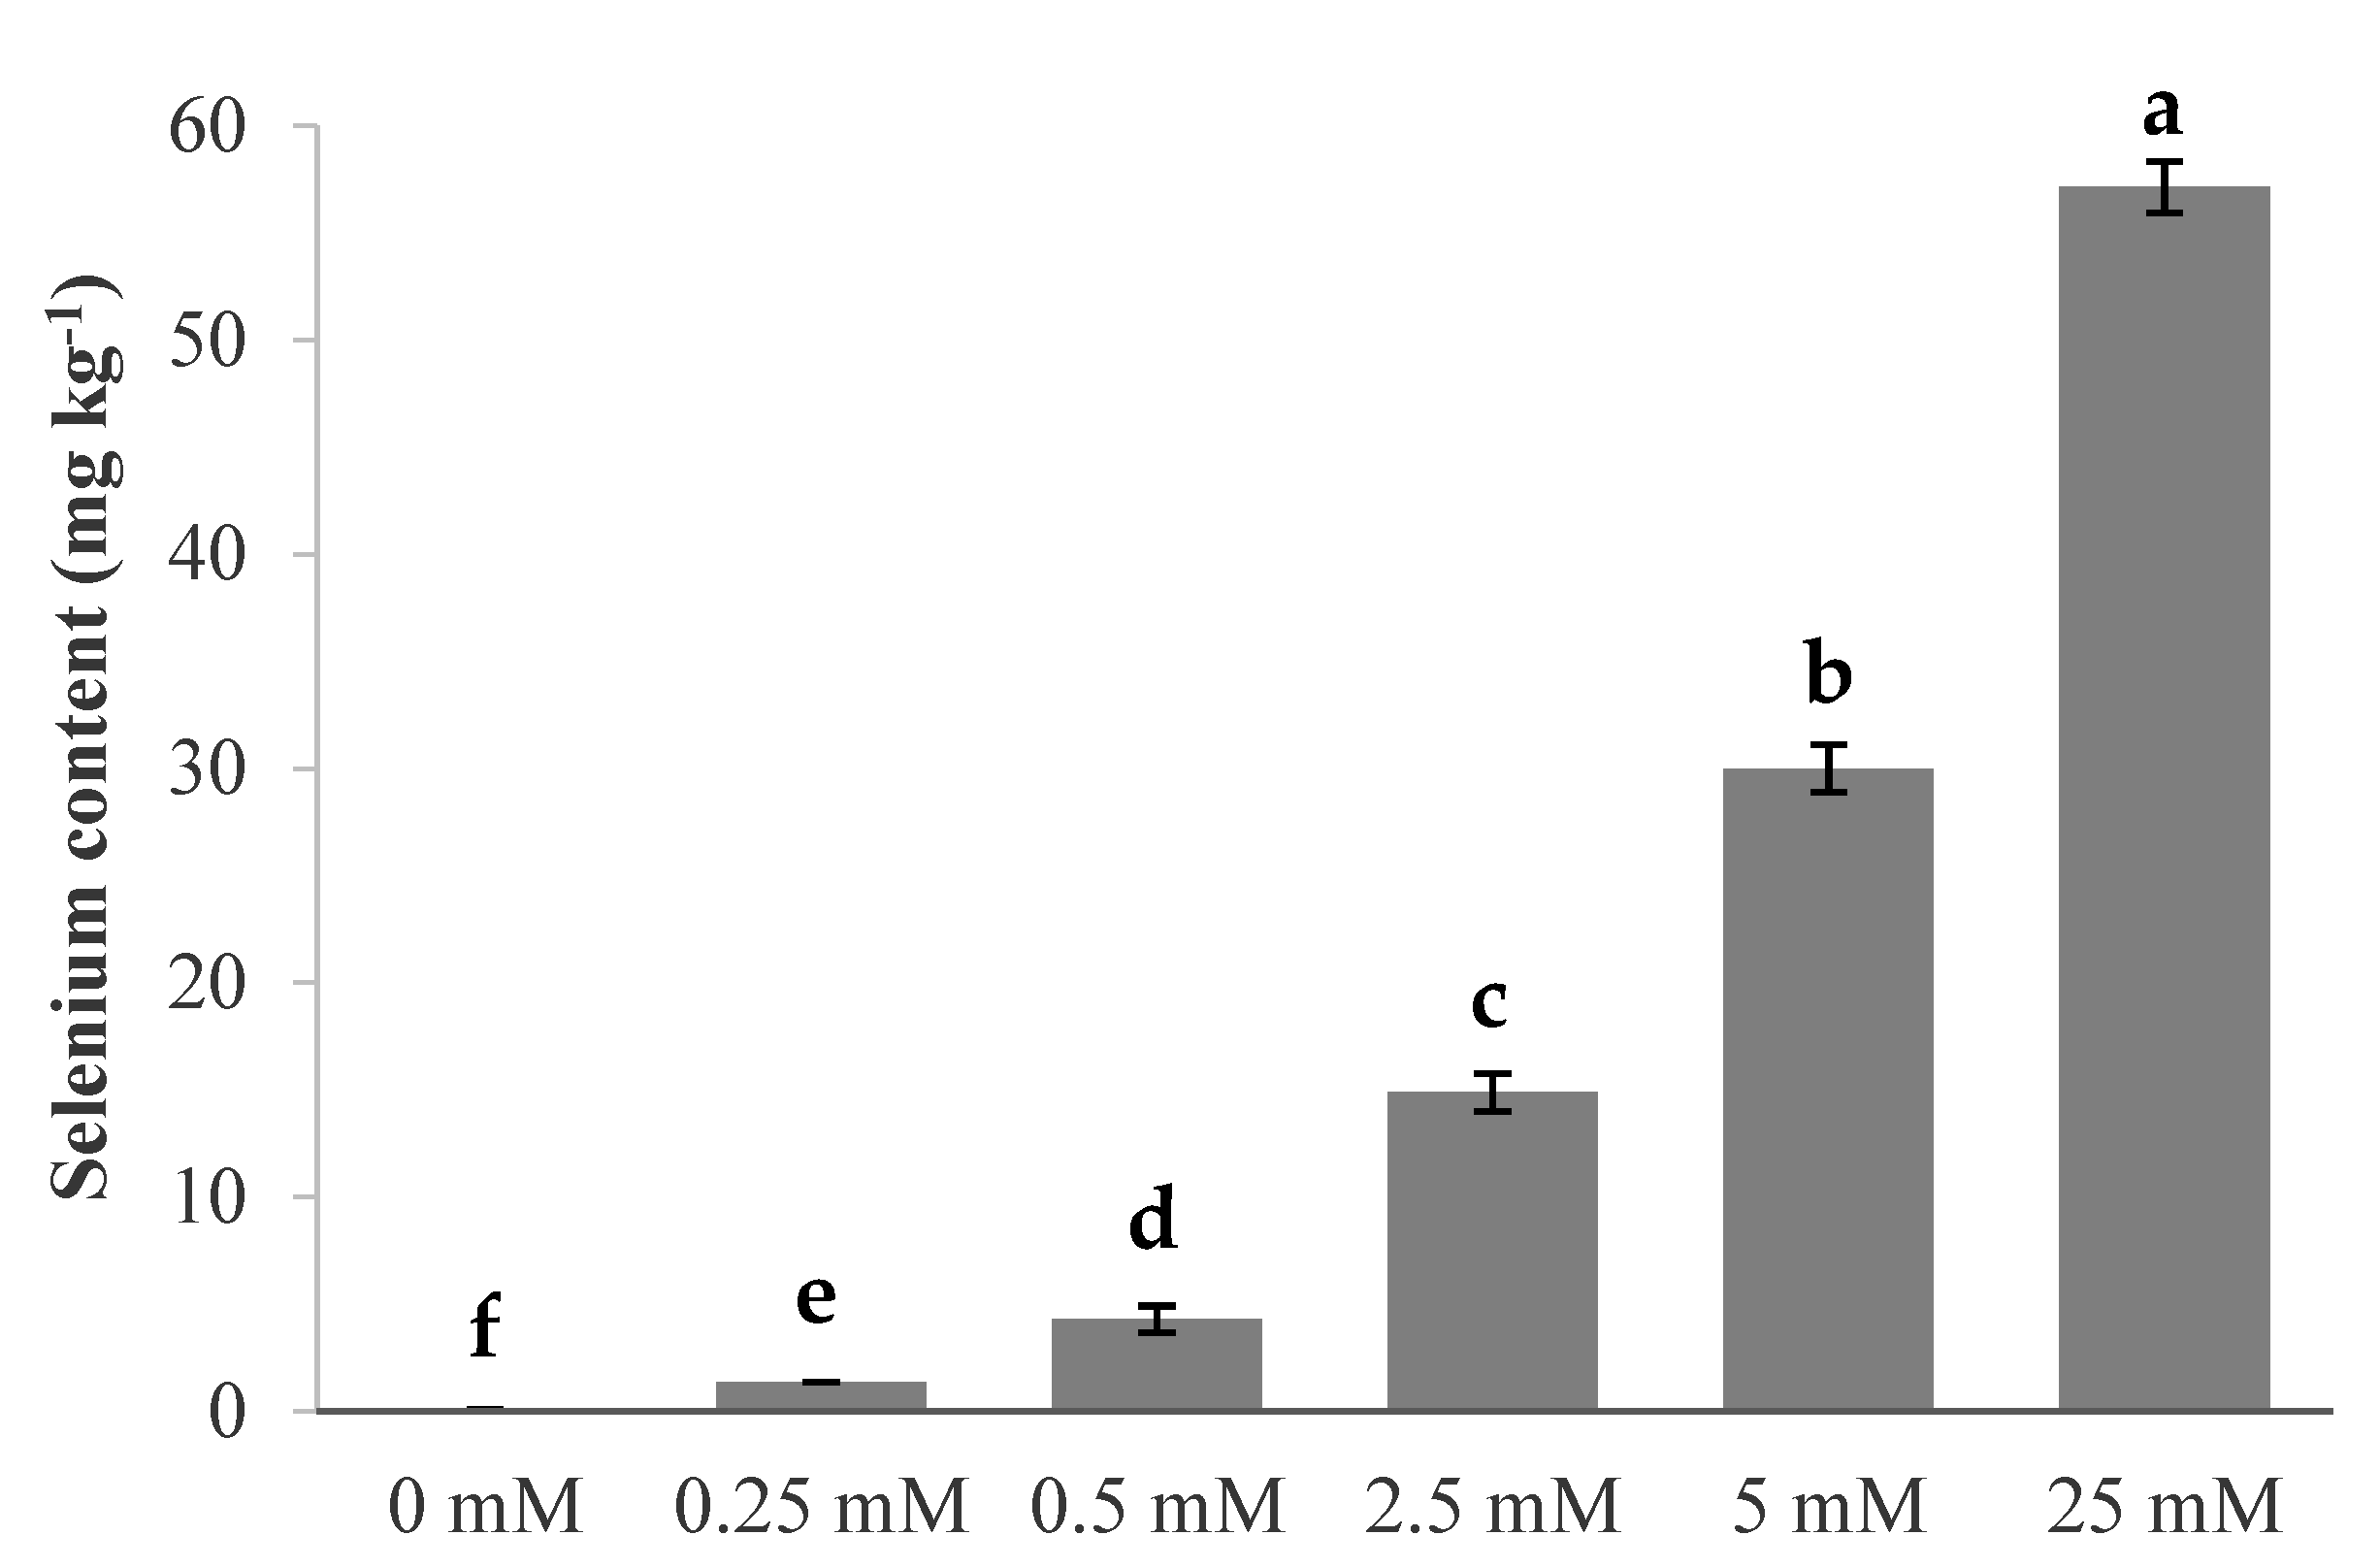
3.1. Germination, Electrolyte Leakage, Root Growth and Selenium Content

Results from the germination percentage, electrolyte leakage (EL) and root growth are shown in Figure 2a–c and Table S1. Statistical differences were observed in germination percentage between the Soaking Periods (SP) (p < 0.001). Overall, lower germination was observed at 4 h (95.3%), whereas a higher percentage was observed at 9 h for all tested Se concentrations (98.6%). For other SP, the germination percentage varied between 95 and 97%. Considering the selenium concentrations (S), only 25 mM showed a significantly lower germination percentage compared to other treatments (p = 0.017). Despite the significant interaction SP × S (p = 0.004), the analysis of the results evidenced that no significant differences were found between soaked and unsoaked samples for germination percentages.
The EL percentage was evaluated in soaked and unsoaked seed to assess the disruption of cellular stability in seed membranes caused by soaking treatments. A significant increase of EL (p < 0.001) was observed with increasing SP (Table S1), with the highest value noticed for 24 h soaking (18.0 ± 0.72%). No significant differences were observed for tested Se concentrations or untreated seeds, except for 25 mM (16.9 ± 1.12%; p = 0.009). The interaction SP × S showed few significant differences (p = 0.042) in the EL percentage among treatments (Figure 2b and Table S1).
Root length was significantly affected by soaking period (p < 0.001), Se concentration (p < 0.001) and strong interaction (p < 0.001) between these factors was also observed. A significant increase in the root length was observed until 12 h of SP (p < 0.001), but after 24 h of SP, the value significantly decreased (Table S1). The highest values of root length were found for seeds Se treated with 0.25, 0.50 and 2.50 mM when compared to untreated seeds or treated with 25 mM of Se (Figure 2c, Table S1). Indeed, 12 h of soaking with 0.25, 0.50 and 2.50 mM Se represent the best Se treatments for enhancing seedling growth of bread wheat cv “Jordão”. Nevertheless, the effects triggered by Se soaking treatments are not significantly different from the ones resulting from water soaking.
The contents of Se presented in 12 h soaked seeds were quantified, and the results evidenced that Se contents increase with concentration applied, but not proportionally (Figure 3). Higher content of Se, 57.01 mg kg−1, was observed in the seeds treated with 25 mM of Se, but as evidenced previously, this Se concentration impaired root development.
The 12 h of soaking with 2.5 mM and 5 mM Se were considered candidate concentrations for studying the Se-mediated responses in pot trials since they induced similar germination and electrolyte leakage percentages, root growth (Figure 2a) and resulted in a considerable Se uptake by the seed (Figure 3). Since high concentrations of Se were found to induce toxicity both in animals and plants [49] and given the similarity of responses found with 2.5 and 5 mM Se, we decided to proceed with pot trials with the lowest concentration considering the future goal of using it for a cost-effective biofortification purpose.

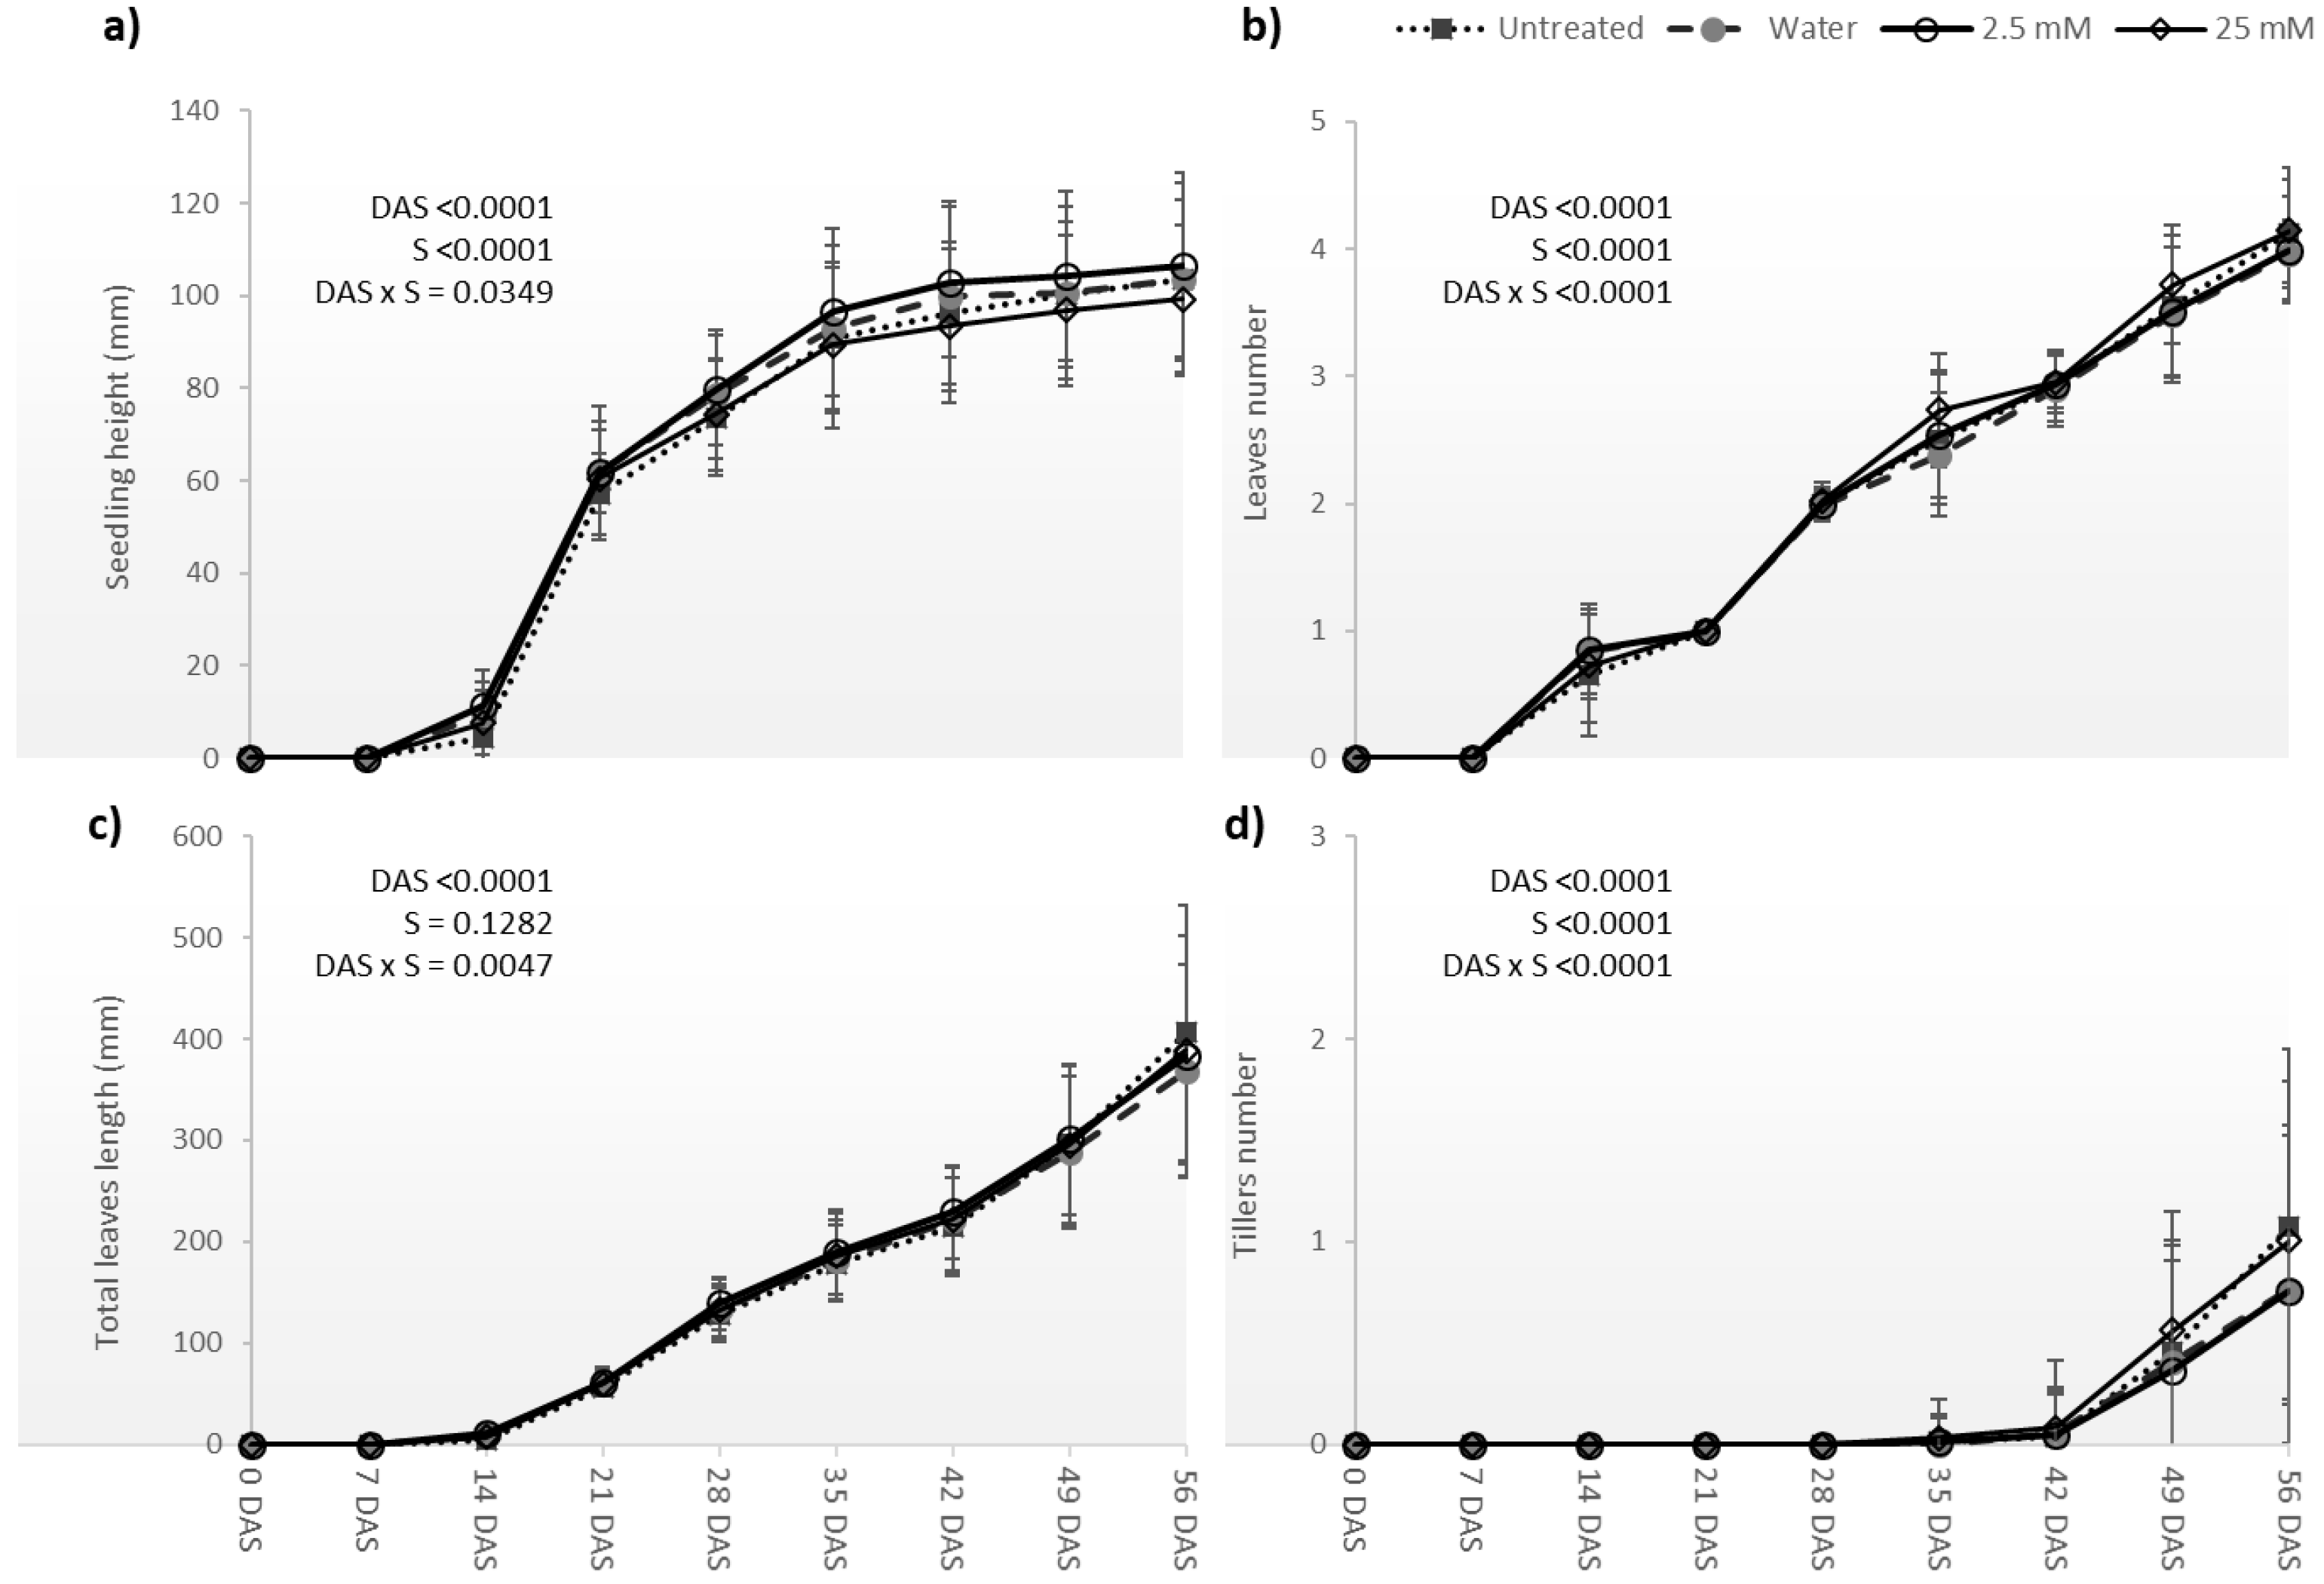
3.2. Germination, Emergence and Plant Development of Pot Trial

Pot trials were conducted to assess the effects of 2.5 mM on wheat plant performance in WW and WS conditions. As negative controls, untreated and 0 mM Se-soaked seeds were used. The higher Se concentration (25 mM) tested on germination, with clear evidence of toxicity, was also tested. New soaking treatments (12 h) were performed, and seeds were manually sown in pots. Before applying the water deficit treatment, seedling traits were measured.
The coleoptile emergence (Figure 4) was observed 12, 18 and 24 days after sowing (DAS). The results evidence that the effect of the applied treatments was more evidenced at 12 DAS, in which untreated and 25 mM Se treated seed had the lowest coleoptile emergence percentages. Generally, the seedling emergence percentage was significantly higher in the soaked seeds (0, 2.5 and 25 mM of Se). No differences were found between 0 mM and 2.5 mM Se soaked seeds. Indeed, this trend was maintained along the remaining studied days (18 and 24 DAS), in which the initial emergence impairment triggered by 25 mM Se soaking vanished.
Seedlings showed the fastest growth until 35 DAS (Figure 5a, Table S2). At 28 DAS emerged the second’s leaves (Figure 5b), and at 35 DAS, the tillers (Figure 5d). These morphological traits increase weekly with significant differences (p < 0.0001). The treatment with 2.5 mM Se showed significant higher seedling height compared to 25 mM and untreated seeds, but no differences were found when compared to water-soaked ones (p < 0.001) (Table S2). In contrast, the number of leaves was higher when 25 mM Se was applied (p < 0.001), irrespective of the day when they were assessed. For most of the measured traits, no differences were found between soaking conditions, which highlighted the high interaction found between the two tested factors.

3.3. Leaf Gas Exchange and Chlorophyll a Fluorescence

Physiologic traits, such as leaf gas exchange and chlorophyll a fluorescence, were measured 25 days after stress imposition (Figure 1) in plants kept under well-watered (WW) and water-deficit (WD) conditions (Table S3). When considering the water treatment, WD triggered a statistically significant (p < 0.0001) reduction of A, E and gs. Regarding the effects of the Se treatment applied, a positive effect on most gas-exchange traits was observed for seeds soaked either in water or 2.5 mM Se. The higher Se concentration (25 mM) showed values for A, E, gs and A/gs, similar to untreated plants. An interesting feature observed was that under WW, the 2.5 mM treated plants showed higher gs than 25 mM or untreated plants but were not significantly different from water-soaked ones. The analysis of the chlorophyll a fluorescence data (Table S4) showed that WD significantly decreased the Fv/Fm (p = 0.0010) and F’v/F’m (p = 0.0189), while it significantly increased the values of NPQ (p = 0.0062) and ɸNPQ (p = 0.0091) when compared to WW treated plants. No differences in results from the seed treatments applied were noticed.

3.4. Biochemical Analysis of Leaf

Figure 6 and Table S5 present the photosynthetic pigments quantification in leaves 25 days after WD imposition. Pigments contents were significantly influenced by water treatment (p < 0.001), Se concentration (p < 0.001) in all the analysed parameters. Moreover, a strong interaction (p < 0.001) between these factors was also observed, except for the ratio Chl a/Chl b and Chl/Car. A significant reduction (around 24–29%) of the photosynthetic pigments (Chl a and Chl b, Car) was observed in WD by comparison with WW treatment. Regarding the Se concentration effect (p < 0.0001), an overall reduction in pigments contents was found in Se-treated plants, the decrease more accentuated in seeds treated with 2.5 mM Se than the ones treated with 25 mM Se.
Total phenols (TPC), total flavonoids (TFC), ortho-diphenols (OD), ABTS+, total soluble sugars (TSS) and total soluble proteins (TSP) were quantified. Results are shown in Figure 7 and Table S6. Only TPC, OD, ABTS+ and TSP were significantly affected by water treatment (p < 0.001). Generally, significant decreases in the TPC (−7%), ABTS+ (−7%) and TSP (−18%) were found, while for the OD, an increase was registered (+4%) when compared to WW. A significant effect of Se treatments (at least p < 0.04) was found for all the measured parameters. Regardless of the water regime, the soaking treatments with 2.5 mM Se significantly increase the antioxidant capacity (+9% TPC, +41% TFC, +3% OD, +8% TSS and also the ABTS+ antioxidant capacity by +5%) when compared to water-soaked seeds. The 25 mM treatment presented a lower antioxidant capacity than 2.5 mM and a similar content compared to untreated plants.
While slight differences were found for TPC in WW, a significant increase (p = 0.0003) in the TPC in 2.5 mM and 25 mM treatments (23.3 and 22.3 mg g−1 DW, respectively) when compared to untreated or water treated (20.5 and 20.4 mg g−1 DW, respectively). No significant statistical differences were found for TFC and ABTS+ in the interaction between soaking treatments and water treatments. The highest OD contents were found in WD plants treated with 2.5 and 25 mM Se; still, they were not statistically different from the ones measured in water soaked as well as from 2.5 mM Se treated plants kept under WW conditions. The highest TSS content was measured at 2.5 mM Se treated plants grown under WW, while the highest TSP content was measured in water-soaked plants also grown under the same water treatment. Under WD, TSP decreased 17–22% when seeds were soaked with 0 and 2.5 mM Se (155 and 146 mg g−1 DW, respectively). Under WD, treatment with 25 mM induced a similar response compared to the untreated plants (174 and 187 mg g−1 DW, respectively).

3.5. Straw and Grain Biomass Production

The parameters related to grain and straw production are shown in Table 1. All grain and productive parameters, with the exception of spike length and weight of thousand grains, were significantly influenced by water treatments applied (p < 0.001). While the number of tillers and grains were not influenced by the Se treatment, the other productive traits were significantly influenced (at least p < 0.04). Interaction between these factors was also observed for most studied parameters with the exception of stem length, grain number, thousand grains weight and grain yield per plant.
Generally, WD treatment significantly reduced stem length, number of tillers, number of grains, grain and straw biomass compared to the plants in the WW treatment. Indeed, the reduction in grain biomass per plant caused by WD reached approximately 46%. Soaking with 2.5 mM of Se resulted in the highest stem and spike length; however, it was not statistically significant compared to the one observed in water-soaked seeds. However, the same Se concentration (2.5 mM) was found to significantly (p < 0.001) increase straw and above-ground biomass irrespective of the treatment applied but significantly (p < 0.001) decreased harvest index % when compared to water-soaked ones. For most of the cases, 25 mM Se induced a response quite similar to the one observed in untreated seeds. Very interesting results came from the analysis of the Se and water treatments interaction. While no relevant responses were observed in WW-treated plants, the effects of the Se treatments stood out in plants submitted to WD. WD plants resulting from 2.5 mM Se treatment presented a higher straw biomass accumulation (4100 ± 133 mg plant−1), which corresponded to a statistically significant (p < 0.001) increase of 54% when compared to water-soaked plants (0 mM Se) under the same treatment or even higher than the one observed in WW for the same Se concentration. As expected, this trend was also observed in above-ground biomass for the same Se concentration under WD. No relevant differences were found between water soaked and 2.5 mM for grain-related parameters; however, the 2.5 mM Se was found to significantly (p < 0.0344) decrease harvest index percentage.

4. Discussion

In this work, we explored the hypothesis that Se pre-sowing application by seed soaking was a suitable approach to enhance bread wheat cv “Jordão” performance and productive traits under water deficit conditions. To the best of our knowledge, this is the first time that Se seed soaking approaches have been applied to this Portuguese cultivar and may support its further integration into agricultural systems, particularly in the current scenario of climate change. Previous studies have shown that the proposed approach can be an effective method for improving seed germination performance and crop tolerance to abiotic stresses [27,30,50]. Compared to techniques such as fertigation and foliar spray, seed soaking for crop enhancement has several advantages, being considered a simple, fast and low-cost method for farmers with the need for cutting-edge equipment or facilities [51]. Our results evidenced that 12 h seed soaking with 2.5 mM Se is a promissory approach to enhance straw biomass in wheat plants subjected to water deficit. In the following section, the main outcomes of the studies conducted will be discussed.

4.1. Germination, Electrolyte Leakage, Root Growth, and Se Content

One of the major challenges underlying the biofortification mediated by seed treatments is to avoid impairments in germination, emergence, seedling establishment, plant development and crop production [51]. Like seed priming, seed soaking is a controlled hydration process that triggers the pre-germinative metabolism and must, ideally, prevent the end of the germination process, avoiding radicle protrusion, endosperm break and the emergence of the embryonic axis [27,52,53]. In the context of pre-sowing seed treatments, the choice of the best concentration and treatment time often requires laborious optimisation steps limited to the genotype or seed lot studied [12]. The effects of five soaking periods (0, 4, 9, 12 and 24 h) and six Se concentrations (0, 0.25, 0.5, 2.5, 5.0 and 25 mM Se), applied in the form of selenate, were first investigated in germination, electrolyte leakage percentage and seedling traits, namely root traits. The choice of soaking times has taken into account that generally, seeds of the cv “Jordão” germinate within 48 h after imbibition (data not shown). On the other side, the choice of Se concentration applied was based on previous results in published works. Du et al. [54] observed that low sodium selenate concentrations (0.015–0.08 mM) promoted increases in seed germination and root growth of rice seedlings, but higher Se concentrations (0.1 mM) had the opposite effect. On the other side, 48 h of soaking was the optimum period for bread wheat grain Se enrichment when applied at 0.1 mM of Se concentration [18].
In a preliminary experiment made by us, no significant differences in seed germination or seedlings growth compared to the controls using sodium selenate concentrations from 0.01 to 0.2 mM (data not shown). This reinforces the species or genotype-specific response underlying the optimisation of soaking conditions (time and solute concentration).
Among other effects, Se has been reported to enhance germination, radicle elongation and stimulate growth [27]. Our results evidenced that, with few exceptions, germination percentages were relatively high irrespective of the soaking period or Se concentration applied. However, it was found that 25 mM Se significantly reduced germination percentages suggesting a potential toxicity effect in this developmental process (Figure 2, Table S1). Indeed, the results obtained for the high electrolyte leakage percentage, a proxy of impaired cell membrane integrity and seed vigour [53,54], as well as lower root growth, supported this assumption.
While germination percentage and electrolyte leakage percentage seem to be relatively constant across the different tested experimental conditions, total root growth was modulated by the treatments applied, particularly soaking time. Our results evidenced that 12 h of soaking with water (0 mM Se) or Se concentrations below 25 mM represented the suitable treatment for enhancing seedling growth bread wheat cv “Jordão”, herein expressed by the sum of root length. In addition to the 25 mM Se, which was found to impair root growth, all tested soaking conditions were found to enhance root growth by comparison with other soaking periods, particularly untreated seed. Overall, this enhanced root length suggests that 12 h soaking does not significantly affect the final germination percentage but might anticipate the radicle protrusion since longer roots were found 48 h after sowing.
Since no relevant differences were found between water-soaked and Se-soaked seeds in germination and seedling traits, we investigated the Se contents after the 12 h soaking treatments (Figure 3). The results evidenced residual Se contents in water-soaked seeds (0.07 mg kg−1), below the 0.1 mg kg−1, adequate for human consumption [17], which was not surprising since wheat was considered a non-Se accumulator [21], and the Se concentration observed in plants were low [17]. Seed Se contents were found to increase with concentration applied. Higher content of Se, 57.01 mg Se kg−1, was observed in the seeds treated with 25 mM of Se, but as evidenced previously [55], this Se concentration was found to induce toxicity symptoms. The 12 h of soaking with 2.5 mM and 5 mM Se were considered candidate concentrations for studying the Se-mediated responses in pot trials. They induced similar germination and electrolyte leakage percentages, root growth (Figure 2a) and resulted in a considerable Se uptake by the seed (Figure 3), relevant for biofortification purposes. Given the similarity of responses found with 2.5 and 5 mM Se, we decided to proceed with pot trials with the lowest concentration, considered beneficial, thus avoiding potential Se toxicity effects in animals and plants [49].

4.2. Coleoptile Emergence and Plant Growth before Stress Imposition

The effect of 12 h soaking with 2.5 mM Se and 25 mM Se soaking treatments on coleoptile emergence and plant growth responses of bread wheat was studied in pot experiments. The results were compared to untreated and 0 mM Se-soaked seeds. Our results at 12 DAS evidenced the positive effect of soaking with water or 2.5 mM Se in anticipating coleoptile emergence, when compared to untreated seeds or seeds soaked with 25 mM Se (Figure 4). The same behaviour has been described in the previous section regarding Petri dishes germination tests. For this trait, no clear beneficial effect of the 2.5 mM soaking was observed. An interesting aspect was that the initial emergence impairment triggered by 25 mM Se soaking vanished during the trial period. As one example, the coleoptile emergence at 24 DAS is very similar between the three soaking treatments. Along the subsequent days of the pot trial, no relevant responses in seedling height, number of leaves, the total length of leaves, number of tillers and tiller length were noticed between tested conditions, which also reflected the strong interaction found between soaking treatment and the day at which measurements were made.

4.3. Physiological, Biochemical and Productivity Responses upon Water Deficit

Although Se has been broadly reported to enhance germination and seedling traits, other reports suggest that this nutrient plays an important role in the plant–water adjustment, especially in water deficit conditions [27]. The effects of untreated, 0, 2.5 and 25 mM Se in 12 h seed soaking treatments were evaluated under water-deficit (WD) and well-watered (WW) conditions. Physiological, biochemical and biomass traits were measured in mature bread-wheat plants (170 or 210 DAS). The results are discussed in the following sections.

4.3.1. Leaf Gas Exchange, Chlorophyll a Fluorescence Traits

Photosynthesis, together with cell growth, is among the primary processes to be affected by drought [56]. Typically, one of the first responses to water shortage is stomatal closure reflected on the reduction of gs, which limits CO2 influx, thus decreasing the carbon assimilation by the photosynthetic apparatus. In our study, the most relevant effect observed is an A, E and gs decrease in bread wheat plants under the WD regime, suggesting that the imposed experimental conditions induced a stress. When considering the Se effect, the results are puzzling. Irrespective of the water treatment analysed, the application of Se 2.5 mM seems to improve the photosynthetic performance, while the 25 mM impairs the values measured; still, in most cases, 2.5 mM effects are not significantly different from the ones measured in plants from water-soaked seeds. Considering the average values, in plants kept well-watered, soaking with water and 2.5 mM appear to enhance photosynthetic performance, evidenced in the high value observed for A, E and gs, while 25 mM seems to cause a decrease in these. This is in agreement with the work of Luo et al. [57], who described an increase in photosynthetic rate and gs in rice with the Se application. The same authors also reported a decrease of A and gs when applying 50 μmol L−1 of Se, considered supra-optimal for the conducted study. On the other hand, when looking at the plants under WD, no clear effects of the Se treatments is imposed.
The tested experimental conditions also did not impact the photochemical parameters resulting from the analysis of the Chl a fluorescence. A slight significant decrease was observed in Fv/Fm and F’v/F’m and an increase in NPQ in response to WD. A decline of Fv/Fm often reflects a photoinhibition situation that may result from a decrease in the rate constant of PSII photochemistry caused by damage to the PSII reaction centres [58]. No differential responses were observed regarding the effects of Se concentrations studied.

4.3.2. Biochemical Analysis of Leaf

Alterations in Fv/Fm, thus photochemical capacity, are often corroborated by changes in the concentrations of particular photosynthetic pigments [51]. Indeed, our results evidenced a lower content in photosynthetic pigments (Chl a, Chl b and Car) as a result of WD imposed (Figure 6 and Table S5), which agreed with previous report [51]. Overall, Se treatments led to a decrease in pigments contents when compared to water-soaked seeds, which was more relevant when plants were under WD. This is particularly evident for the 2.5 mM Se in WW plants. WW plants resulting from the 25 mM Se soaking present values much closer to the ones for water-soaked plants. Numerous works described that photosynthetic pigments are decreased at high level of Se [59,60,61]. Indeed, Padmaja et al. [62] reported that Se induces chlorosis, possibly through an adverse effect on the production of porphobilinogen synthetase, an enzyme required for chlorophyll biosynthesis. These results agree with our findings. However, the information available in the literature is often contradictory. As one example, soil application of sodium selenite induced an evident increase in Chl a, Chl b, total Chl (a + b) and Car content of bread wheat cv Shijiazhuang NO. 8 seedlings compared with the control ones [63]. In maize, foliar applications of Se (as sodium selenate) were found to enhance the content photosynthetic pigments in both WW and WD conditions [64]. Based on these reports, we cannot discard that the Se form provided and concentrations, as well as the type of application made, could influence the responses observed.
A Chl/Car ratio reduction was verified in 25 mM Se under WD, indicating possible photooxidative damage in these plants. The Chl/Car ratio is a sensitive indicator of photooxidative damage since chlorophylls are highly susceptible to environmental stresses [65]. In these situations, an increase in phenolic compounds and flavonoids such as TPC, TFC and OD is expected to protect plants from reactive oxygen species (ROS) by deactivating the free radicals, quenching the ROS, and the decomposing peroxides that are ultimately generated during stress [51]. Although not statistically significant, our results evidenced an increased antioxidant capacity, particularly the 2.5 mM Se under WD. Our results evidenced that higher TPC and OD contents were significantly observed in wheat plants soaking with 2.5 mM or 25 mM of Se, particularly under WD. Ultimately, such compounds are expected to improve cellular homeostasis during drought stress [51].
Sugars play a vital role in plant osmotic regulation, including cell turgor maintenance, absorption and water transportation under stress [51]. Wheat plants treated with 2.5 mM Se under WW conditions showed a significant increase in TSS compared to other treatments. This increase might be attributed to the enhanced amylase activity and the hydrolysing of starch into sugars promoted by Se [66].

4.4. Straw and Grain Biomass Parameters

Plant productivity is very susceptible to environmental conditions and depends on the severity and duration of stresses through plant growth. Our results evidenced that WD treatment significantly reduced lower stem length, number of tillers, number of grains, grain and straw biomass compared to the plants in the WW treatment. Indeed, the reduction in grain biomass per plant caused by WD reached approximately 46%. This is not surprising since drought stress during developmental stages in wheat has been considered one of the major factors that affect the grain yield and quality [26]. Grain filling in cereals is a process of starch biosynthesis from simple carbohydrates made by enzymes such as sucrose synthase, adenosine diphosphate-glucose-pyro phosphorylase, starch synthase and starch branching enzyme [67]. The reduced activity of starch biosynthesis enzymes can trigger a decline or cessation in grain growth rate in the water-stressed wheat, diminished grain set and kernel growth in wheat, and reduced grain filling [68].
Our results evidenced that Se treatments did not result in significant impairment in grain traits (number, weight of thousand grains) when looking at these parameters at WW or WD conditions. This is a very important aspect when considering the implementation of a Se biofortification approach targeting, among other traits, the modulation of the grain yield. When looking at the Se effect on stem length, spike length and straw biomass, a decrease was observed at 25 mM when compared to 2.5 mM treated plants. In spinach, selenium stimulated the growth at lower concentrations, while at high doses, it acted as a pro-oxidant, reducing yields and inducing metabolic disturbances [69]. One of the most relevant results of this study is that plants resulting from seeds soaked with 2.5 mM presented an increase in straw biomass production by more than 54% when compared to water-soaked ones under the same treatment. Indeed, this straw biomass value is higher than the one observed for the same Se soaking treatment but in WW plants. For most of the traits analysed, 25 mM Se induced a response quite similar to the one observed in untreated seeds. It is tempting to speculate about the molecular and physiological mechanisms behind the improved response observed with 2.5 mM Se. Based on our results, we cannot discard that enhanced antioxidant capacity triggered by this treatment may play a role in this. Indeed, Rios et al. [70] observed that growth or yield stimulation might be due to selenate-induced antioxidant compounds production of increase in enzymes that detoxify H2O2, especially ascorbate peroxidase and glutathione (GSH) peroxidase. Nevertheless, more studies are needed to corroborate this hypothesis.

5. Conclusions

Selenium seed treatments, such as soaking, constitute a promissory approach to improve Se contents in wheat, constituting a simple, fast and low-cost method for farmers towards crop enhancement. We investigated the effects of Se seed soaking as a pre-sowing treatment in bread wheat aerial traits under well-watered and water deficit conditions. Among others, our results evidenced that 12 h of 2.5 mM Se soaking did not affect the germination percentage, and speed-up seedling emergence resulted in a considerable Se seed uptake. Moreover, plants resulting from this treatment displayed enhanced antioxidant capacity and vegetative biomass accumulation, especially under water deficit. The treatment with 25 mM of Se showed no significant differences to untreated plants and a decrease, compared to 2.5 mM, in traits such as aerial biomass, suggesting a potential toxicity effect. In both cases, the physiological responses of Se-treated plants remained unchanged, as well as grain traits. Altogether, the results suggest that 12 h soaking with 2.5 mM Se is a promissory pre-sowing approach to enrich bread wheat grain and straw, particularly under water-limited environments.
Given the relevance of bread wheat as a staple food or source of feed, further studies are needed to support that the developed Se soaking protocol also promotes Se accumulation in both vegetative and grain biomass as a means of biofortification.

Supplementary Materials

The following supporting information can be downloaded at: https://www.mdpi.com/article/10.3390/agronomy12081975/s1, Table S1: Germination percentage, electrolyte leakage of seed membrane, and root length sum of wheat seeds after 48h of germination; Table S2: Seedling height (mm), number of leaves, length of total leaves (mm) number of visible tillers and tillers length (mm), of wheat seedlings developed from fourteen (emergence) to fifty-six days after sowing (DAS); Table S3: Net photosynthetic rate (A, μmol CO2 m−2 s−1), respiration rate (E, g H2O m−2 h−1), stomatal conductance (gs, mmol H2O m−2 s−1), intrinsic water use efficiency (A/gs, μmol mol-1), and ratio of intercellular to atmospheric CO2 concentration (Ci/Ca) among wheat plants (means ± SE, n = 12) under two water regimes (W) and four soaking treatments (S); Table S4: Maximum (Fv/Fm) and actual quantum efficiency of photosystem II (ΦPSII), maximum efficiency of PSII at open reaction centers (F’v/F’m), photochemical quenching (qP), non-photochemical quenching (NPQ), apparent electron transport rate (ETR, μmol e m−2 s−1), quantum yield of non-regulated energy dissipation in PSII (ΦNO), quantum yield of regulated energy dissipation in PSII (ΦNPQ) among wheat plants in two water regimes (W) and four soaking treatments (S); Table S5: Chlorophyll a (Chl a, mg g-1 DW), b (Chl b, mg g−1 DW), a + b (Chl (a + b), mg g−1 DW), ratio (Chl a/Chl b), carotenoids (car, mg g−1 DW), and chlorophyll/carotenoids ratio (Chl/Car) of wheat plants; Table S6: Total Phenols (TPC, mg GAE g−1 DW), total flavonoids (TFC, mg CE g−1 DW), ortho-diphenols (OD, mg GAE g−1 DW), ABTS+, (µM TE g−1 DW), total soluble sugars (TSS, mg g−1 DW), and total soluble proteins (TSP, mg g−1 DW) among two water regimes and four soaking treatments (untreated, 0, 2.5, and 25 mM).

Author Contributions

Conceptualisation, L.R., J.M.-P. and J.L.-B.; Data curation, L.R., E.S., I.P. and H.F.; Formal analysis, L.R.; Investigation, L.R., E.S. and C.M.; Methodology, L.R., J.M.-P. and J.L.-B.; Resources, J.M.-P. and J.L.-B.; Supervision, J.M.-P. and J.L.-B.; Validation, J.M.-P. and J.L.-B.; Writing—original draft, L.R.; Writing—review & editing, L.R., J.M.O., J.M.-P. and J.L.-B. All authors have read and agreed to the published version of the manuscript.

Funding

Luis Rocha acknowledges the financial support provided by national funds through FCT—Portuguese Foundation for Science and Technology (PD/BD/113612/2015), under the Doctoral Programme “Agricultural Production Chains—from fork to farm” (PD/00122/2012) and from the European Social Funds and the Regional Operational Programme Norte 2020. The authors thank the Foundation for Science and Technology (FCT, Portugal) and FEDER under Programme PT2020 for financial support to CITAB (UIDB/04033/2020). Luis Rocha also acknowledges the present financial support throughout project NORTE-06-3559-FSE-000103 funded by the Fundo Social Europeu (FSE) and FCT research unit Centre BIO R&D Unit (UIDB/05083/2020).

Institutional Review Board Statement

Not applicable.

Informed Consent Statement

Not applicable.

Data Availability Statement

The data presented in this study are available on request from the corresponding author.

Acknowledgments

We thank José Coutinho from INIA—Plant Breeding Station (Elvas, Portugal) for kindly providing the bread wheat seeds of the cultivar “Jordão”.

Conflicts of Interest

The authors declare no conflict of interest.

References

  1. Fernandes, K.F.M.; Berton, R.; Coscione, A. Selenium biofortification of rice and radish: Effect of soil texture and efficiency of two extractants. Plant Soil Environ. 2014, 60, 105–110. [Google Scholar] [CrossRef] [Green Version]
  2. Lyons, G.; Stangoulis, J.; Graham, R. High-selenium wheat: Biofortification for better health. Nutr. Res. Rev. 2003, 16, 45–60. [Google Scholar] [CrossRef] [Green Version]
  3. Puccinelli, M.; Pezzarossa, B.; Rosellini, I.; Malorgio, F. Selenium enrichment enhances the quality and shelf life of Basil leaves. Plants 2020, 9, 801. [Google Scholar] [CrossRef]
  4. Rayman, M.P. The importance of selenium to human health. Lancet 2000, 356, 233–241. [Google Scholar] [CrossRef] [Green Version]
  5. Roman Viñas, B.; Ribas Barba, L.; Ngo, J.; Gurinovic, M.; Novakovic, R.; Cavelaars, A.; de Groot, L.; van’t Veer, P.; Matthys, C.; Serra Majem, L. Projected prevalence of inadequate nutrient intakes in Europe. Ann. Nutr. Metab. 2011, 59, 84–95. [Google Scholar] [CrossRef]
  6. Jiang, Y.; Zeng, Z.H.; Bu, Y.; Ren, C.Z.; Li, J.Z.; Han, J.J.; Tao, C.; Zhang, K.; Wang, X.X.; Lu, G.X.; et al. Effects of selenium fertilizer on grain yield, Se uptake and distribution in common buckwheat (Fagopyrum esculentum Moench). Plant Soil Environ. 2016, 61, 371–377. [Google Scholar] [CrossRef] [Green Version]
  7. Feghhenabi, F.; Hadi, H.; Khodaverdiloo, H.; van Genuchten, M.T. Seed priming alleviated salinity stress during germination and emergence of wheat (Triticum aestivum L.). Agric. Water Manag. 2020, 231, 106002. [Google Scholar] [CrossRef]
  8. Ali, Q.; Daud, M.K.; Haider, M.Z.; Ali, S.; Rizwan, M.; Aslam, N.; Noman, A.; Iqbal, N.; Shahzad, F.; Deeba, F.; et al. Seed priming by sodium nitroprusside improves salt tolerance in wheat (Triticum aestivum L.) by enhancing physiological and biochemical parameters. Plant Physiol. Biochem. 2017, 119, 50–58. [Google Scholar] [CrossRef]
  9. Farooq, M.; Usman, M.; Nadeem, F.; Rehman, H.u.; Wahid, A.; Basra, S.M.A.; Siddique, K.H.M. Seed priming in field crops: Potential benefits, adoption and challenges. Crop Pasture Sci. 2019, 70, 731–771. [Google Scholar] [CrossRef]
  10. Jiménez-Arias, D.; Pérez, J.A.; Luis, J.C.; Martín-Rodríguez, V.; Valdés-González, F.; Borges, A.A. Treating seeds in menadione sodium bisulphite primes salt tolerance in Arabidopsis by inducing an earlier plant adaptation. Environ. Exp. Bot. 2015, 109, 23–30. [Google Scholar] [CrossRef]
  11. Migahid, M.M.; Elghobashy, R.M.; Bidak, L.M.; Amin, A.W. Priming of Silybum marianum (L.) Gaertn seeds with H2O2 and magnetic field ameliorates seawater stress. Heliyon 2019, 5, e01886. [Google Scholar] [CrossRef] [PubMed] [Green Version]
  12. Paparella, S.; Araújo, S.S.; Rossi, G.; Wijayasinghe, M.; Carbonera, D.; Balestrazzi, A. Seed priming: State of the art and new perspectives. Plant Cell Rep. 2015, 34, 1281–1293. [Google Scholar] [CrossRef] [PubMed]
  13. FAOSTAT, Food and Agriculture Organization of the United Nations, Statistical Database. Available online: https://www.fao.org/worldfoodsituation/csdb/en/ (accessed on 22 June 2022).
  14. Liu, J.; Feng, H.; He, J.; Chen, H.; Ding, D. The effects of nitrogen and water stresses on the nitrogen-to-protein conversion factor of winter wheat. Agric. Water Manag. 2018, 210, 217–223. [Google Scholar] [CrossRef]
  15. Zörb, C.; Ludewig, U.; Hawkesford, M.J. Perspective on wheat yield and quality with reduced nitrogen supply. Trends Plant Sci. 2018, 23, 1029–1037. [Google Scholar] [CrossRef] [Green Version]
  16. Ducsay, L.; Ložek, O.; Marček, M.; Varényiová, M.; Hozlár, P.; Lošák, T. Possibility of selenium biofortification of winter wheat grain. Plant Soil Environ. 2016, 62, 379–383. [Google Scholar] [CrossRef] [Green Version]
  17. Ramkissoon, C.; Degryse, F.; da Silva, R.; Baird, R.; Young, S.; Bailey, E.; McLaughlin, M. Improving the efficacy of selenium fertilizers for wheat biofortification. Sci. Rep. 2019, 9, 19520. [Google Scholar] [CrossRef]
  18. Galinha, C.; Freitas, M.C.; Pacheco, A.M.G.; Coutinho, J.; Maçãs, B.; Almeida, A.S. Determination of selenium in bread-wheat samples grown under a Se-supplementation regime in actual field conditions. J. Radioanal. Nucl. Chem. 2012, 291, 231–235. [Google Scholar] [CrossRef]
  19. Galinha, C.; Pacheco, A.M.G.; Freitas, M.D.; Costa, A.R.P.; Pinheiro, N.M.B.; Maçãs, B.; Almeida, A.S.; Wolterbeek, H.T. Selenium characterisation of the Portuguese bread-wheat archival collection. Crop Pasture Sci. 2015, 66, 1111–1117. [Google Scholar] [CrossRef]
  20. Manojlović, M.S.; Lončarić, Z.; Cabilovski, R.R.; Popović, B.; Karalić, K.; Ivezić, V.; Ademi, A.; Singh, B.R. Biofortification of wheat cultivars with selenium. Acta Agric. Scand. B Soil Plant Sci. 2019, 69, 715–724. [Google Scholar] [CrossRef]
  21. Min, W.; Ali, F.; Wang, M.; Dinh, T.; Fei, Z.; Banuelos, G.; Liang, D. Understanding boosting selenium accumulation in wheat (Triticum aestivum L.) following foliar selenium application at different stages, forms, and doses. Environ. Sci. Pollut. Res. Int. 2019, 27, 717–728. [Google Scholar] [CrossRef]
  22. Galinha, C.; Freitas, M.C.; Pacheco, A.M.G.; Kamenik, J.; Kucera, J.; Anawar, H.M.; Coutinho, J.; Macas, B.; Almeida, A.S. Selenium determination in cereal plants and cultivation soils by radiochemical neutron activation analysis. J. Radioanal. Nucl. Chem. 2012, 294, 349–354. [Google Scholar] [CrossRef]
  23. de Oliveira, V.C.; Faquin, V.; Andrade, F.R.; Carneiro, J.P.; da Silva Júnior, E.C.; de Souza, K.R.D.; Pereira, J.; Guilherme, L.R.G. Physiological and physicochemical responses of potato to selenium biofortification in tropical soil. Potato Res. 2019, 62, 315–331. [Google Scholar] [CrossRef]
  24. Khaliq, A.; Aslam, F.; Matloob, A.; Hussain, S.; Geng, M.; Wahid, A.; ur Rehman, H. Seed priming with selenium: Consequences for emergence, seedling growth, and biochemical attributes of rice. Biol. Trace Elem. Res. 2015, 166, 236–244. [Google Scholar] [CrossRef]
  25. da Silva, D.F.; Cipriano, P.E.; de Souza, R.R.; Siueia Júnior, M.; da Silva, R.F.; Faquin, V.; de Souza Silva, M.L.; Guimarães Guilherme, L.R. Anatomical and physiological characteristics of Raphanus sativus L. submitted to different selenium sources and forms application. Sci. Hortic. 2020, 260, 108839. [Google Scholar] [CrossRef]
  26. Ahmed, M.; Fayyaz-ul, H. Response of spring wheat (Triticum aestivum L.) quality traits and yield to sowing date. PLoS ONE 2015, 10, e0126097. [Google Scholar] [CrossRef]
  27. Nawaz, F.; Ashraf, M.Y.; Ahmad, R.; Waraich, E.A. Selenium (Se) seed priming induced growth and biochemical changes in wheat under water deficit conditions. Biol. Trace Elem. Res. 2013, 151, 284–293. [Google Scholar] [CrossRef]
  28. Catálogo nacional de variedades e espécies agrícolas e hortícolas 2020. Available online: https://www.dgav.pt/wp-content/uploads/2021/02/CATALOGO-NACIONAL-DE-VARIEDADES_2020.pdf (accessed on 22 June 2022).
  29. Almeida, A.; Maçãs, B.; Rodrigues, V.; Torrão, M. Wheat breeding: Country perspectives. In The History of Wheat Breeding in Portugal; Bonjean, A.P., Angus, W.J., Van Ginkel, M., Eds.; Lavoisier S.A.S.: Paris, France, 2016; pp. 93–125. [Google Scholar]
  30. Tounekti, T.; Mahdhi, M.; Al-Faifi, Z.; Khemira, H. Priming improves germination and seed reserve utilization, growth, antioxidant responses and membrane stability at early seedling stage of Saudi sorghum varieties under drought stress. Not. Bot. Horti Agrobot. Cluj Napoca 2020, 48, 938–953. [Google Scholar] [CrossRef]
  31. von Caemmerer, S.; Farquhar, G.D. Some relationships between the biochemistry of photosynthesis and the gas exchange of leaves. Planta 1981, 153, 376–387. [Google Scholar] [CrossRef]
  32. Hendrickson, L.; Furbank, R.; Chow, W. A Simple alternative approach to assessing the fate of absorbed light energy using chlorophyll fluorescence. Photosynth. Res. 2004, 82, 73–81. [Google Scholar] [CrossRef]
  33. Schreiber, U.; Schliwa, U.; Bilger, W. Continuous recording of photochemical and non-photochemical chlorophyll fluorescence quenching with a new type of modulation fluorometer. Photosynth. Res. 1986, 10, 51–62. [Google Scholar] [CrossRef]
  34. Genty, B.; Briantais, J.-M.; Baker, N.R. The relationship between the quantum yield of photosynthetic electron transport and quenching of chlorophyll fluorescence. Biochim. Biophys. Acta—Gen. Subj. 1989, 990, 87–92. [Google Scholar] [CrossRef]
  35. Arnon, D.I. Copper enzymes in isolated chloroplasts. Polyphenoloxidase in Beta vulgaris. Plant Physiol. 1949, 24, 1–15. [Google Scholar] [CrossRef] [Green Version]
  36. Lichtenthaler, H. K Chlorophylls and carotenoids: Pigments of photosynthetic biomembranes. Meth. Enzymol. 1987, 148, 350–382. [Google Scholar] [CrossRef]
  37. Šesták, J.; Berggren, G. Study of the kinetics of the mechanism of solid-state reactions at increasing temperatures. Thermochim. Acta 1971, 3, 1–12. [Google Scholar] [CrossRef]
  38. Bradford, M.M. A rapid and sensitive method for the quantitation of microgram quantities of protein utilizing the principle of protein-dye binding. Anal. Biochem. 1976, 72, 248–254. [Google Scholar] [CrossRef]
  39. Irigoyen, J.J.; Einerich, D.W.; Sánchez-Díaz, M. Water stress induced changes in concentrations of proline and total soluble sugars in nodulated alfalfa (Medicago sativa) plants. Physiol. Plant. 1992, 84, 55–60. [Google Scholar] [CrossRef]
  40. Dinis, L.T.; Oliveira, M.M.; Almeida, J.; Costa, R.; Gomes-Laranjo, J.; Peixoto, F. Antioxidant activities of chestnut nut of Castanea sativa Mill. (cultivar ‘Judia’) as function of origin ecosystem. Food Chem. 2012, 132, 1–8. [Google Scholar] [CrossRef]
  41. Ayuso-Mateos, J.L.; Vázquez-Barquero, J.L.; Dowrick, C.; Lehtinen, V.; Dalgard, O.S.; Casey, P.; Wilkinson, C.; Lasa, L.; Page, H.; Dunn, G.; et al. Depressive disorders in Europe: Prevalence figures from the ODIN study. Br. J. Psychiatry 2001, 179, 308–316. [Google Scholar] [CrossRef] [PubMed]
  42. Dewanto, V.; Wu, X.; Adom, K.K.; Liu, R.H. Thermal processing enhances the nutritional value of tomatoes by increasing total antioxidant activity. J. Agric. Food Chem. 2002, 50, 3010–3014. [Google Scholar] [CrossRef] [PubMed]
  43. Zhishen, J.; Mengcheng, T.; Jianming, W. The determination of flavonoid contents in mulberry and their scavenging effects on superoxide radicals. Food Chem. 1999, 64, 555–559. [Google Scholar] [CrossRef]
  44. Singleton, V.L.; Rossi, J.A. Colorimetry of total phenolics with phosphomolybdic-phosphotungstic acid reagents. Am. J. Enol. Vitic. 1965, 16, 144–158. [Google Scholar]
  45. Barros, L.; Cabrita, L.; Boas, M.V.; Carvalho, A.M.; Ferreira, I.C.F.R. Chemical, biochemical and electrochemical assays to evaluate phytochemicals and antioxidante activity of wild plants. Food Chem. 2011, 127, 1600–1608. [Google Scholar] [CrossRef]
  46. Swanson, C.A.; Reamer, D.C.; Veillon, C.; King, J.C.; Levander, O.A. Quantitative and qualitative aspects of selenium utilization in pregnant and nonpregnant women: An application of stable isotope methodology. Am. J. Clin. Nutr. 1983, 38, 169–180. [Google Scholar] [CrossRef] [Green Version]
  47. Costa-Silva, F.; Maia, M.; Matos, C.C.; Calçada, E.; Barros, A.I.R.N.A.; Nunes, F.M. Selenium content of Portuguese unifloral honeys. J. Food Compos. Anal. 2011, 24, 351–355. [Google Scholar] [CrossRef]
  48. Boldrin, P.F.; Faquin, V.; Ramos, S.J.; Guilherme, L.R.G.; Bastos, C.E.A.; Carvalho, G.S.; Costa, E.T.D.S. Selenato e selenito na produção e biofortificação agronômica com selênio em arroz. Pesqui. Agropecu. Bras. 2012, 47, 831–837. [Google Scholar] [CrossRef] [Green Version]
  49. Ali, W.; Zhang, H.; Junaid, M.; Mao, K.; Xu, N.; Chang, C.; Rasool, A.; Wajahat Aslam, M.; Ali, J.; Yang, Z. Insights into the mechanisms of arsenic-selenium interactions and the associated toxicity in plants, animals, and humans: A critical review. Crit. Rev. Environ. Sci. Technol. 2021, 51, 704–750. [Google Scholar] [CrossRef]
  50. Choudhary, S.K.; Kumar, V.; Singhal, R.K.; Bose, B.; Chauhan, J.; Alamri, S.; Siddiqui, M.H.; Javed, T.; Shabbir, R.; Rajendran, K.; et al. Seed priming with Mg(NO3)2 and ZnSO4 salts triggers the germination and growth attributes synergistically in wheat varieties. Agronomy 2021, 11, 2110. [Google Scholar] [CrossRef]
  51. Begum, N.; Hasanuzzaman, M.; Li, Y.; Akhtar, K.; Zhang, C.; Zhao, T. Seed germination behavior, growth, physiology and antioxidant metabolism of four contrasting cultivars under combined drought and salinity in soybean. Antioxidants 2022, 11, 498. [Google Scholar] [CrossRef]
  52. Nawaz, J.; Hussain, M.; Jabbar, A.; Nadeem, G.; Sajid, M.; Subtain, M.; Shabbir, I. Seed Priming A Technique. Int. J. Agric. Crop Sci. 2013, 6, 1373–1381. [Google Scholar]
  53. Wolny, E.; Betekhtin, A.; Rojek, M.; Braszewska-Zalewska, A.; Lusinska, J.; Hasterok, R. Germination and the early stages of seedling development in Brachypodium distachyon. Int. J. Mol. Sci. 2018, 19, 2916. [Google Scholar] [CrossRef] [Green Version]
  54. Komalasari, O.; Arief, R. Effect of soaking duration in hydropriming on seed vigor of sorghum (Sorghum bicolor L. moench). IOP Conf. Ser.: Earth Environ. Sci. 2020, 484, 012121. [Google Scholar] [CrossRef]
  55. Du, B.; Luo, H.; He, L.; Zhang, L.; Liu, Y.; Mo, Z.; Pan, S.; Tian, H.; Duan, M.; Tang, X. Rice seed priming with sodium selenate: Effects on germination, seedling growth, and biochemical attributes. Sci. Rep. 2019, 9, 4311. [Google Scholar] [CrossRef] [Green Version]
  56. Chaves, M.; Maroco, J.; Pereira, J. Understanding plant responses to drought—From genes to the whole plant. Funct. Plant Biol. 2003, 30, 239–264. [Google Scholar] [CrossRef]
  57. Luo, H.W.; He, L.X.; Du, B.; Wang, Z.M.; Zheng, A.X.; Lai, R.F.; Tang, X.R. Foliar application of selenium (Se) at heading stage induces regulation of photosynthesis, yield formation, and quality characteristics in fragrant rice. Photosynthetica 2019, 57, 1007–1014. [Google Scholar] [CrossRef] [Green Version]
  58. Guidi, L.; Lo Piccolo, E.; Landi, M. Chlorophyll Fluorescence, photoinhibition and abiotic stress: Does it make any difference the fact to be a C3 or C4 species? Front Plant Sci. 2019, 10, 174. [Google Scholar] [CrossRef]
  59. Haghighi, M.; Sheibanirad, A.; Pessarakli, M. Effects of selenium as a beneficial element on growth and photosynthetic attributes of greenhouse cucumber. J. Plant Nutr. 2016, 39, 1493–1498. [Google Scholar] [CrossRef] [Green Version]
  60. Mazzafera, P. Growth and biochemical alterations in coffee due to selenite toxicity. Plant Soil 1998, 201, 189–196. [Google Scholar] [CrossRef]
  61. Jain, M.; Gadre, R. Inhibition of chlorophyll synthesis and enzymes of nitrogen assimilation by selenite in excised maize leaf sefments during greening. Water Air Soil Pollut. 1998, 104, 161–166. [Google Scholar] [CrossRef]
  62. Padmaja, K.; Prasad, D.D.; Prasad, A.R. Selenium as a novel regulator of porphyrin biosynthesis in germinating seedlings of mung bean (Phaseolus vulgaris). Biochem. Int. 1990, 22, 441–446. [Google Scholar]
  63. Yao, X.; Chu, J.; Wang, G. Effects of Selenium on Wheat Seedlings Under Drought Stress. Biol. Trace Elem. Res. 2009, 130, 283–290. [Google Scholar] [CrossRef]
  64. Nawaz, F.; Naeem, M.; Ashraf, M.Y.; Tahir, M.N.; Zulficiar, B.; Salahuddin, M.; Shabbir, R.N.; Aslam, M. Selenium supplementation affects physiological and biochemical processes to improve fodder yield and quality of maize (Zea mays L.) under water deficit conditions. Front. Plant Sci. 2016, 7, 1438. [Google Scholar] [CrossRef] [PubMed] [Green Version]
  65. Brito, C.; Rodrigues, M.Â.; Pinto, L.; Gonçalves, A.; Silva, E.; Martins, S.; Rocha, L.; Pavia, I.; Arrobas, M.; Ribeiro, A.C.; et al. Grey and Black Anti-Hail Nets Ameliorated Apple (Malus × domestica Borkh. cv. Golden Delicious) Physiology under Mediterranean Climate. Plants 2021, 10, 2578. [Google Scholar] [CrossRef] [PubMed]
  66. Taha, R.S.; Seleiman, M.F.; Shami, A.; Alhammad, B.A.; Mahdi, A.H.A. Integrated Application of Selenium and Silicon Enhances Growth and Anatomical Structure, Antioxidant Defense System and Yield of Wheat Grown in Salt-Stressed Soil. Plants 2021, 10, 1040. [Google Scholar] [CrossRef] [PubMed]
  67. Farooq, M.; Wahid, A.; Kobayashi, N.; Fujita, D.; Basra, S.M.A. Plant drought stress: Effects, mechanisms and management. Agron. Sustain. Dev. 2009, 29, 185–212. [Google Scholar] [CrossRef] [Green Version]
  68. Ahmadi, A.; Baker, D.A. The effect of water stress on the activities of key regulatory enzymes of the sucrose to starch pathway in wheat. Plant Growth Regul. 2001, 35, 81–91. [Google Scholar] [CrossRef]
  69. Saffaryazdi, A.; Lahouti, M.; Ganjeali, A.; Bayat, H. Impact of selenium supplementation on growth and selenium accumulation on spinach (Spinacia oleracea L.) plants. Not. Sci. Biol. 2012, 4, 95–100. [Google Scholar] [CrossRef] [Green Version]
  70. Ríos, J.J.; Blasco, B.; Cervilla, L.M.; Rosales, M.A.; Sanchez-Rodriguez, E.; Romero, L.; Ruiz, J.M. Production and detoxification of H2O2 in lettuce plants exposed to selenium. Ann. Appl. Biol. 2009, 154, 107–116. [Google Scholar] [CrossRef]
Figure 1. Timeline of the field trial.
Agronomy 12 01975 g001
Figure 2. Germinated seeds (n = 45) (a), electrolyte leakage of seed membrane (n = 15) (b) and root length sum from the three major roots (n = 45) (c), forty-eight hours after sowing. Five soaking periods (SP = 0, 4, 9, 12 and 24 h) and six concentrations of sodium selenate (S = 0, 0.25, 0.5, 2.5, 5 and 25 mM) were studied. Values are mean ± standard error. Two-away ANOVA p-values for SP, S and interaction SP × S were shown for each parameter. Complementary information on statistical significance is available in Supplementary Table S1.
Agronomy 12 01975 g002
Figure 3. Selenium contents presented in seeds after 12 h of soaking with 0, 0.25, 0.5, 2.5, 5 and 25 mM of Na2SeO4. Values are means ± standard errors (n = 5). Different letters demonstrate significant differences (p < 0.05).
Agronomy 12 01975 g003
Figure 4. Percentage of seedlings with visible coleoptiles at 12, 18 and 24 days after sowing (DAS). Values are means ± standard errors (n = 80). Different letters demonstrate significant differences (p < 0.05).
Agronomy 12 01975 g004
Figure 5. Seedling height (a), leaves number (b), total leaves length (c) and tillers number (d) of wheat seedlings for the four Se soaking treatments (SP) during the first 56 days after sowing (DAS). Values are means ± standard errors (n = 80). Two-away ANOVA p-values for DAS, S and interaction DAS × S were shown for each parameter. Complementary information is shown in Supplementary Table S2.
Agronomy 12 01975 g005
Figure 6. Chlorophyll a (Chl a)—(a); chlorophyll b (Chl b)—(b); chlorophyll a + b (Chl a + b)—(c); chlorophyll ratio (Chl a/Chl b)—(d); carotenoids (car)—(e) and chlorophyll/carotenoids ratio (Chl/Car)—(f) from wheat plants expressed per unit of dry weight (DW). Two water treatments (W) and four soaking treatments (S) were studied. Values are means ± SE (n = 12). Different letters indicate statistically significant differences (p < 0.05).
Agronomy 12 01975 g006
Figure 7. Total phenols—TPC (a); total flavonoids—TFC (b); ortho-diphenols—OD (c); ABTS+ (d); total soluble sugars—TSS (e) and total soluble proteins—TSP (f); among two water regimes and four soaking treatments (untreated, 0, 2.5, and 25 mM). Values are means ± SE of DW (n = 12). Different letters indicate statistically significant differences (p < 0.05).
Agronomy 12 01975 g007
Table 1. Stem length (mm), spike length (mm), tillers number, grain number, thousand-grain weight (g), grain harvest index (%), grain biomass per plant (mg plant−1), straw biomass (mg plant−1), above-ground biomass (mg plant−1) parameters at the maturity stage of wheat plants under two water treatments and four Se treatments. Values are means ± SE (n = 20). Different letters indicate statistically significant differences (p < 0.05).
Stem Length (mm)Spike Length
(mm)
Tillers
Number
(nº)
Grain
Number
(nº)
Thousand Grain
(g)
Grain Biomass
(mg Plant−1)
Straw Biomass (mg Plant−1)Above-Ground
Biomass
(mg Plant−1)
Harvest Index
(%)
Watering Regime (W)
WW 583 ± 6.4 a83 ± 1.054.1 ± 0.2 a124 ± 4.3 a32 ± 0.433909 ± 125 a3273 ± 49 a7182 ± 146 a54 ± 0.82 a
WD 541 ± 6.5 b85 ± 1.203.3 ± 0.18 b66 ± 2.4 b32 ± 0.462108 ± 80 b3122 ± 80 b5231 ± 103 b40 ± 1.13 b
Soaking (S)
Untreated544 ± 10.6 b79 ± 1.80 b4.0 ± 0.2686 ± 5.133 ± 0.71 a2809 ± 174 b2834 ± 52 c5642 ± 196 c49 ± 1.62 a
Water559 ± 7.7 ab87 ± 1.17 a3.5 ± 0.24100 ± 7.533 ± 0.52 a3266 ± 231 a3032 ± 72 b6298 ± 287 b50 ± 1.39 a
2.5 mM Se589 ± 9.0 a90 ± 1.27 a3.9 ± 0.2796 ± 6.931 ± 0.59 ab2988 ± 211 ab3933 ± 72 a6921 ± 201 a41 ± 1.93 b
25 mM Se551 ± 9.9 b80 ± 1.43 b3.5 ± 0.3298 ± 7.531 ± 0.61 b2939 ± 207 b2923 ± 41 c5862 ± 213 c49 ± 1.83 a
W × S
WWUntreated560 ± 13.382 ± 2.02 cd3.7 ± 0.18 ab106 ± 4.733 ± 0.993488 ± 1742897 ± 83 c6385 ± 214 b55 ± 1.26 ab
Water580 ± 10.186 ± 1.91 bc4.2 ± 0.38 a134 ± 10.933 ± 0.724353 ± 3173457 ± 42 b7810 ± 334 a55 ± 1.87 ab
2.5 mM Se612 ± 11.587 ± 1.81 b4.3 ± 0.37 a131 ± 7.031 ± 0.804032 ± 2183765 ± 28 b7797 ± 220 a51 ± 1.40 b
25 mM Se576 ± 13.277 ± 2.03 de4.3 ± 0.54 a127 ± 10.130 ± 0.783788 ± 2572962 ± 41 c6750 ± 260 b57 ± 1.80 a
WDUntreated527 ± 16.176 ± 2.97 e4.4 ± 0.50 a63 ± 4.933 ± 1.072045 ± 1732762 ± 57 c4807 ± 181 c41 ± 1.95 c
Water541 ± 10.088 ± 1.40 ab3.0 ± 0.2671 ± 3.833 ± 0.762343 ± 1332670 ± 46 c5013 ± 138 c46 ± 1.55 c
2.5 mM Se567 ± 12.293 ± 1.61 a3.5 ± 0.38 ab61 ± 3.932 ± 0.891944 ± 1444100 ± 133 a6044 ± 189 b32 ± 1.92 d
25 mM Se526 ± 12.982 ± 1.93 cd2.8 ± 0.24 b68 ± 6.231 ± 0.952089 ± 1832885 ± 70 c4974 ± 190 c42 ± 2.19 c
Two-way ANOVA (p-values)
W<0.00010.22290.0073<0.00010.5636<0.00010.0013<0.0001<0.0001
S0.0018<0.00010.50260.08600.01820.0492<0.0001<0.0001<0.0001
W × S0.91900.02200.01960.29810.93170.3945<0.00010.02990.0344
Publisher’s Note: MDPI stays neutral with regard to jurisdictional claims in published maps and institutional affiliations.

