Article

In Vitro Regeneration of Stevia (Stevia rebaudiana Bertoni) and Evaluation of the Impacts of Growth Media Nutrients on the Biosynthesis of Steviol Glycosides (SGs)

by
Asish Kumar Ghose
1,2,
Siti Nor Akmar Abdullah
1,3,*,
Muhammad Asyraf Md Hatta
3 and
Puteri Edaroyati Megat Wahab
4
1
Laboratory of Agronomy and Sustainable Crop Protection, Institute of Plantation Studies, Universiti Putra Malaysia, Serdang 43400, Selangor, Malaysia
2
Biotechnology Division, Bangladesh Sugarcrop Research Institute, Ishurdi, Pabna 6620, Bangladesh
3
Department of Agriculture Technology, Faculty of Agriculture, Universiti Putra Malaysia, Serdang 43400, Selangor, Malaysia
4
Department of Crop Science, Faculty of Agriculture, Universiti Putra Malaysia, Serdang 43400, Selangor, Malaysia
*
Author to whom correspondence should be addressed.
Agronomy 2022, 12(8), 1957; https://doi.org/10.3390/agronomy12081957
Submission received: 8 July 2022 / Revised: 1 August 2022 / Accepted: 14 August 2022 / Published: 19 August 2022
(This article belongs to the Special Issue Medicinal Plants—Natural Sources of Bioactive Secondary Metabolites)

Abstract

:
A plant tissue culture protocol from stevia was optimized for the production of planting materials and the natural sweetener, rebaudioside A. The highest survivability (88.90% ± 5.55) of explants was achieved at 15 and 30 days after culture initiation (DACI) on Murashige and Skoog (MS) media by sterilization with 30% Clorox (5 min) and 10% Clorox (10 min), respectively. Supplementation of MS with 0.50 mg/L 2,4-Dichlorophenoxyacetic acid (2,4-D) and 0.10 mg/L zeatin produced 50% callus at 15 DACI while 1.50 mg/L 2,4-D and 0.10 mg/L zeatin at 30 DACI increased callus production to 76.67%. The highest shoot proliferation per callus was achieved with 10.00 mg/L 6-benzyl amino purine (BAP) in MS at 15 DACI (5.80) and 30 DACI (12.33). The longest shoots of 4.31 cm and 6.04 cm at 15 and 30 DACI, respectively, were produced using BAP (10.00 mg/L) and 1.00 mg/L naphthalene acetic acid (NAA). MS media (0.50 strength) induced 2.86 and 6.20 roots per shoot and produced 3.25 cm and 7.82 cm long roots at 15 and 30 DACI, respectively. Stevia grown on 0.25 MS accumulated the highest concentration of rebaudioside A (6.53%), which correlated with the expression level of its biosynthetic gene uridine-diphosphate-dependent (UDP)-glycosyltransferase (UGT76G1).

1. Introduction

Stevia (Stevia rebaudiana Bertoni) is a self-incompatible species of plant belonging to the Asteraceae family. It is a perennial herbaceous plant [1] originating from Paraguay in South America and is currently grown in several regions of the world, including Europe, North America, and Asia [2]. Stevia consists of 200 different species worldwide, but only Stevia rebaudiana has a sweet flavor [3]. Stevia plants are a dominant contributor of diterpenoid steviol glycosides (SGs) for economic use [4] and have been quickly gaining favor in the food and beverage industry as a natural sweetening agent. It is commercially cultivated in China, Paraguay, Korea, Brazil, Thailand, and Southeast Asia [5]. In dry stevia leaves, diterpenoid SGs accumulated up to 30% [6]. SGs are a complex collection of related molecules, with certain SGs species imparting a sweet flavor and others imparting a bitter or metallic flavor [7]. They are not only utilized as sugar substitutes but also employed for medicinal uses demonstrating anti-microbial, anti-inflammatory, and anti-oxidant [8], anti-carcinogenic [9], anti-hypertensive [10], anti-hyperglycemic [11], anti-diarrhoeal, immunomodulatory, anti-tumor and diuretic effects [12], anti-glycemic and anti-fibrotic effects on the heart [13], and anti-diabetic potentials [14,15]. Several pharmaceutical and nutraceutical products are being produced from stevia with a variety of applications [16].
SGs are around 300 times sweeter than sucrose and rebaudioside A has the sweetest flavor, which is 180 to 400 folds sweeter than sucrose [17]. The diterpene precursor steviol is composed mostly of eight ent-kaurene glycosides: stevioside, rebaudioside A-E, dulcoside A, and steviolbioside [18,19]. Stevioside makes up the majority of sweetening constituents(60–70%) with a significant therapeutic potential [20,21,22], and rebaudioside A is of specific importance because of its appealing flavor character, as well as the fact that it is non-cariogenic, non-mutagenic, and anti-diabetic [23]. It makes up 30 to 40% of the overall sweetening ingredients and has no long-lasting, licorise-like bitter taste after consumption [1].
Stevia uses cytoplasmic uridine-diphosphate-dependent (UDP)-glycosyltransferases (UGTs) to form SGs. A variety of SGs is produced by UGTs through methylerythriol-4-phosphate (MEP)-pathway [24,25]. Biochemical characterization showed UGT85C2, UGT74G1, and UGT76G1 as being critical for the manufacturing of SGs [26]. The UGT85C2 catalyzes the accumulation of steviolmonoside from steviol; UGT74G1 is responsible for the formation of stevioside from steviolbioside, and the UGT76G1 is involved in the conversion of stevioside to rebaudioside A at the final step of MEP-pathway [23], which enriches the steviol glycosides’ organoleptic characteristics [25,27].
Seeds and stem cuttings are the most common plant materials for propagating stevia [1]. However, the tiny size and poor viability of stevia seeds have hampered traditional breeding [28]. It is also hard to retrieve enough cuttings (vegetative components) for multiplication owing to the scarcity of high-quality planting materials [29]. In vitro regeneration of plants is really the only tool for rapid and efficient development of stevia needed to leverage the industrial application [1,30]. Furthermore, plant tissue culture techniques offer great potential in improving the abundance and uniformity of stevia plants, as well as the levels of bioactive compounds found in them. For developing disease-free genotypes and enhancing active compounds, advancements in plant tissue culture technologies such as the refinement of growing media for in vitro production of plants and establishment of cell and callus culture are widely utilized. Significantly higher amounts of SGs have been extracted from in vitro regenerated plant cells compared to field-grown stevia [28,31,32,33,34,35,36].
Under sterile, regulated growth conditions, callus and tissuecultures can be used to generate SGs on a long-term basis. The variety of explants used, the category and concentration of plant growth hormones, and the in vitro growth environmental impact the formation of callus culture in stevia [37]. Callus tissues can maintain cell division capacity for longer periods of time, making them ideal as resources for bioactive compound generation, germplasm survival, and genetic manipulation, including gene editing and genetic engineering [38,39,40]. Numerous investigations on the tissue culturing of stevia have been published, with a wide range of media ingredients and culture conditions documented [41,42]. The endogenous as well as exogenous plant growth regulators, particularly plant growth hormones, can regulate plant tissue culture processes [29,43]. Auxins, cytokinins, and auxin-cytokinin interactions are thought to be the most critical for controlling the growth and development of plants during tissue and organ culture [44]. For example, a combination of these two phytohormones is effective in triggering callus production from the different types of plant organs as they play a role in maintaining and regulating plant cell division and elongation in culture [45].
There is growing interest in using tissue-cultured plantlets for stevia cultivation. Currently, there is very limited information about the content of SGs in tissue-cultured materials to enable future exploration of extracting SGs from in vitro propagated plants [46]. Normally, the expression of the genes responsible for secondary metabolite production is enhanced by using different concentrations and combinations of plant growth hormones. However, the present study focuses on the investigation of the stevia explants sterilization procedure for successful plant tissue culture and the effects of different plant growth hormones used in in vitro culture for callus and shoot induction. The effects of different strengths of MS media without any plant growth hormones on rooting, the expression levels of SG biosynthetic genes (UGT76G1, UGT74G1, and UGT85C2), and the accumulation of desirable SGs (stevioside and rebaudioside A) are also investigated. This could be a valuable strategy for enhancing the production of secondary metabolites in stevia through tissue culture.

2. Materials and Methods

2.1. Plant Materials and Sterilization

Leaves were collected from soil-grown 30-day-old seedlings of stevia and used as explants for in vitro regeneration. Sterilization is an essential step in plant tissue culture to avoid microbial infection (bacterial, fungal, etc.). To avoid contamination, all necessary research items like Petri dish, forceps, scissors, scalpel, and conical flasks were sterilized by autoclaving at 121 °C for 20 min at 15 Ibs/sq inch pressure. All experimental work was performed under a laminar airflow cabinet after sterilization with 70% ethanol as a sterilizing agent.

2.2. Media Preparation

To prepare the MS basal semi-solid media, all stock solutions were mixed together along with 30 g/L sucrose, as per the prescription of Murashige and Skoog (1962) [47]. The MS basal media were supplemented with different concentrations of different plant growth hormones utilized for callus induction (Table 1) and shoot regeneration (Table 2). The different strengths of MS media were utilized for root initiation. The pH of each medium was adjusted to between 5.7 to 5.8 by using 1N HCl and 1N NaOH as per needed. To solidify the media, gelrite was added at the rate of 2.5 g/L. After adding gelrite, the media was autoclaved at 121 °C for 20 min and cooled down to room temperature, then poured into previously sterilized 50 mL conical flasks separately and kept at room temperature for further use.

2.3. Surface Sterilization of Explants, Culture Establishment and Maintenance

The explants were washed thoroughly with running tap water for 15 min. After washing, the entire explants were treated with Tween 20 (2 drops in 100 mL of double distilled water) for 5 min by gently shaking. Then all explants were washed three times with double distilled water to remove the residual Tween 20 from the explants properly. The explants were soaked in 70% ethanol for 30 s. The surface sterilization was performed by using different concentrations (0, 5, 10, 15, 20, and 30%) of Clorox (15% NaOCl) for different periods (5, 10, 15, and 20 min) of time under laminar airflow cabinet to maintain aseptic conditions. After surface sterilization, the explants were washed four times with double distilled water to eradicate the Clorox properly. The surface sterilized explants were cut into small pieces using a sterile sharp scalpel and plated aseptically on MS media without any plant growth hormones in conical flasks under a laminar airflow cabinet.
After the placement of explants on MS media, the conical flasks were kept in the culture room under controlled environmental conditions. The culture room prevailed at 25 ± 2 °C temperature, 16 h light and 8 h dark conditions, approximately 3000 lux light intensity, and around 60% humidity. The explants exhibiting responses to the growth media were regularly transferred to the new media every 30 days after culture initiation (DACI).
At 15 and 30 DACI of explants, the percentages of fungal contamination, bacterial contamination, decontamination, and survivability were evaluated. Decontamination of explants denoted the explants as free from any contamination either in living or dead forms, whereas the survivability recognized the explants as free from contaminants (fungal and bacteria) and remaining alive and green in the culture medium.

2.4. Callus Induction and Characterization

For callus induction, the excised parts of leaf blades were cultured as explants. All explants derived from the culture were conducted by surface sterilization with 10% Clorox for 10 min. In this study, the effect of different concentrations and combinations of auxin and cytokinin on callus induction and proliferation was investigated. To achieve this goal, leaf segments were plated on MS media augmented with different concentrations (0.00–2.00 mg/L) of 2.4-D and 0.10 mg/L of zeatin (Table 1).
The frequency of callus induction was determined at 15 DACI and 30 DACI. The frequency was expressed as a percentage and calculated by the following formula (No. of explants with callus/total no. of explants) × 100%. At 15 DACI and 30 DACI, the induced calli were categorized in two ways; compact callus and friable (fish-egg structure) callus. The explants which did not show any response for inducing callus were also evaluated.

2.5. Shoot Initiation

For shoot initiation, the induced calli were transferred to MS media supplemented with the combinations of different concentrations of BAP (0.00 to 10.00 mg/L) and NAA (0.00 to 1.00 mg/L) listed in Table 2. Data were collected at 15 and 30 DACI of callus, the length of shoots, number of shoots per callus, number of leaves per shoot, and the percentage of callus that were able to proliferate shoots were measured and quantified. This experiment was conducted with three replications; each replication had 10 flasks with 5 calli each.

2.6. Root Induction

The proliferated shoots were transferred into different strengths of MS (0.00, 0.25, 0.50, 0.75, and 1.00) media without any plant growth hormones to develop roots. At 15 and 30 DACI of shoot for initiation of roots, the number of roots, the number of roots per shoot, the length of roots, and the percentage of shoots able to initiate roots were measured and quantified. This experiment was replicated three times and each replication consisted of 10 conical flasks, with every flask containing 10 shoots.

2.7. Steviol Glycosides (SGs) Extraction

The leaves of the micropropagated plantlets grown on different strengths of MS (0.00, 0.25, 0.50, 0.75, and 1.00) media without any plant growth hormones were harvested at 30 days age and oven dried for 48 h at 60 °C. The dried leaves were ground by using a sterile pestle and mortar to prepare a fine powder. The powders of the dried leaves were weighed out perfectly as 20 mg. The SGs were extracted from the powder by mixing with 300 µLof deionized water and this was repeated three times. The mixed samples were boiled for 30 min at 100 °C by using a water block heater after each stage of mixing with deionized water. The samples were cooled down to room temperature and centrifuged at 2500× g for 10 min at 10 °C at every stage of mixing the samples with deionized water. The supernatants were transferred to 1 mL Eppendorf tubes and the volumes were adjusted to 1 mL by adding deionized water and kept at −20 °C until HPLC analysis. The extractions were conducted in triplicate.

2.8. HPLC Analysis

The improved approach developed by Bergs et al., (2012) [48] was used to isolate and quantify SGs (stevioside and rebaudioside A) using high-performance liquid chromatography (HPLC). A SYKAM HPLC system equipped with a UV detector was employed to detect stevioside and rebaudioside A. Samples were separated on a C18 column (4.6 mm ID × 250 mm, SP-120-5-5C18-AP) with a pre-column after passing through a syringe filter with a PVDF membrane (pore diameter 0.45 µm). At 30 °C of column temperature, the injection volume was 20 µL. For separation of stevioside and rebaudioside A from the sample, isocratic elution with an 80/20 mobile phase of acetonitrile and deionized water was utilized. Stevioside and rebaudioside A were identified at 210 nm wavelength. The retention duration and UV spectra were used to identify stevioside and rebaudioside A in the samples. Calibration was accomplished by graphing the peak area responses against concentration values ranging from 0.00 to 1.00 mg/mL, with linear dependency for both molecules. Each analysis was conducted three times, with the mean value utilized each time. Working in an isocratic mode, it took less than 10 min to isolate the components of interest without interfering with resolution.
The standard solution of stevioside and rebaudioside A were prepared in deionized water. The standard of stevioside (≥98%, CAS Number: 57817-89-7, (Sigma-Aldrich Chemie GmbH, Eschenstr. 5, 82024 Taufkirchen, Germany)) and rebaudioside A (≥96%, CAS Number: 58543-16-1, Sigma-Aldrich Chemie GmbH, Eschenstr. 5, 82024 Taufkirchen, Germany) were prepared in 0.00, 0.20, 0.40, 0.60, 0.80, and 1.00 mg/mL. All standards were injected in the three replications and the value was reported as the mean. The areas of the peak of each standard against the concentrations of standard time were used to construct a respective standard curve. Through HPLC analysis, the amount of stevioside and rebaudioside A were determined by using respective standards curves constructed based on their different areas of peak against different concentrations (0.00, 0.20, 0.40, 0.60, 0.80, and 1.00 mg/mL). The average retention time for detection of stevioside was 3.62 min, and for rebaudioside A was 3.90 min.

2.9. Extraction of Total RNA

For isolation of total RNA from stevia, 100 mg of fresh leaves were collected from each sample grown on 0.00 MS, 0.25 MS, 0.50 MS, 0.75 MS, and 1.00 MS rooting media. The leaf samples were placedinto two milliliters flat bottom Eppendorf tubes and flash frozen by keeping them in liquid nitrogen for 10 min. Total RNA was isolated using TRI Reagent® ((Sigma-Aldrich Chemie GmbH, Eschenstr. 5, 82024 Taufkirchen, Germany, Catalog Number: 9404) following the manufacturer’s procedures. Concentrations of the isolated RNAs were measured by a Thermo Scientific™ NanoDrop™ 1000 Light Spectrophotometer, and the quality was confirmed by gel electrophoresis on 1.2% (w/v) agarose gel containing 1% florosafe at 50 volts for 60 min in 1× TBE buffer.
The harvested 10 µg of total RNAs were treated with DNase I (1 U) RNase-free enzyme (Thermo SCIENTIFIC) as per the manufacturer’s recommendation to remove the DNA contamination from the isolated RNAs. The purity and concentrations of RNAs were measured by using a Thermo Scientific™ NanoDrop™ 1000 Light Spectrophotometer, and the qualities of the purified RNAs were confirmed by gel electrophoresis on 1.2% (w/v) agarose gel containing 1% florosafe at 50 volts for 60 min in 1× TBE buffer.

2.10. Quantitative Reverse Transcription PCR (RT q-PCR) Analysis for UGT76G1, UGT74G1, and UGT85C2

In order to quantify the expression level of UGT76G1, UGT74G1, and UGT85C2, RT q-PCR analysis was conducted using cDNA synthesized from RNA extracted from the leaves of stevia rooted in 0.00 MS, 0.25 MS, 0.50 MS, 0.75 MS, and 1.00 MS media. The total RNA (1.00 µg per 20 µL) was reverse transcribed with SensiFAST™ cDNA Synthesis Kit (Bioline Ltd., London, UK, Catalog number: BIO-65053) according to the manufacturer’s procedures. Gene-specific primers for the targeted gene: UGT76G1, UGT74G1, and UGT85C2 and reference genes: Actin (AF548026.1), Aquaporin (DQ269455.1), and Calmodulin (AF474074.1) were designed and synthesized as listed in Table 3. A Bio-Rad CFX96 real-time machine (C1000 Touch thermal cycler) was used to perform quantitative reverse transcription PCR with a SensiFast SYBR No-ROX Kit (Bioline Ltd., London, UK, Catalog Number: BIO-98005). The reaction mixture containing the final concentrations of 1× SensiFast SYBR No-ROX, template cDNA (5 ng of total RNA) and 200 nM of each forward and reverse primer was prepared in a final volume of 10 µL. No template control (NTC) was prepared to contain all the reaction mixtures without the template. NTC was set as a negative control wherein the absence of amplification denoted no cross-contamination mixtures.
The RT q-PCR analysis was performed with cycling parameters set up as in Table 4. The expression patterns of each targeted gene were normalized to three reference genes according to the Livak method [49] using the Bio-Rad CFX Manager™ software, version 3.1 (Bio-Rad, USA). The RT q-PCR was performed using samples of three pooled biological replications with three technical replications.

2.11. Statistical Analysis

The Statistical Analysis System (SAS) program (version 9.4) was used to perform statistical analyses. All values were shown as mean ± SE (Standard Error); (n = 3) representingmeans for three biological replications per treatment. Data were subjected to analysis of variance (ANOVA) for mean comparison, and significant differences were evaluated according to the Student’s t-test. The probability level for all statistical analyzes was 0.05.

3. Results

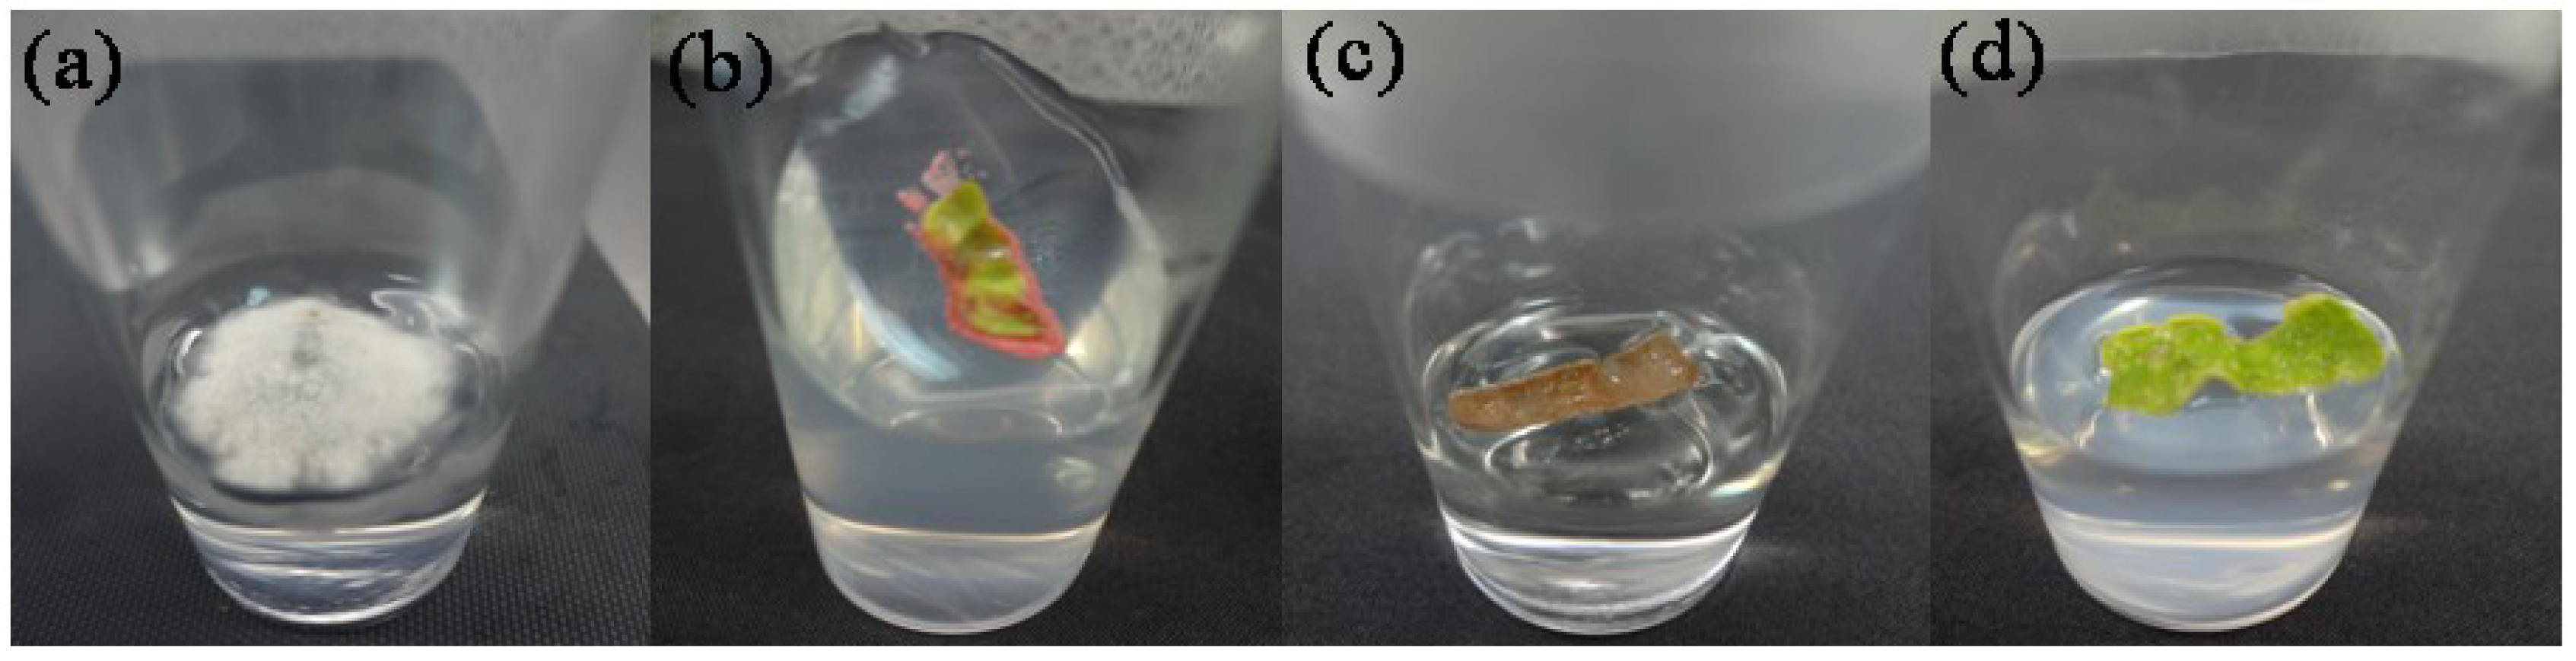
3.1. Surface Sterilization of Explants

The explants of stevia sterilized with different concentrations (0, 5, 10, 15, 20, and 30%) of Clorox for different periods (5, 10, 15, and 20 min) of time showed different frequencies of contamination and decontaminations (free from bacteria and fungi) as well as survivability on growth media. Figure 1 shows the fungal and bacterial contaminations, decontaminations, and survivability of stevia explants. Ethanol could not sterilize the explants of stevia properly at the concentration of 70% for different durations (5, 10, 15, and 20 min). The explants of stevia treated with different concentrations (0, 5, 10, 15, 20, and 30%) of Clorox for different (5, 10, 15, and 20 min) periods of time showed bacterial contamination at different frequencies. The highest bacterial contamination was found at 15 DACI treated with 20% of Clorox with a decontamination frequency of 22.23%, which increased to 38.89% at 30 DACI (Table 5). At 15 and 30 DACI, the explants treated with 5, 10, and 30% of Clorox for 10, 15, and 20 min, 15% of Clorox for 15 and 20 min, 20% of Clorox for 5, 15, and 20 min showed no bacterial contaminations on plated explants of stevia (Table 5).
Fungal contaminations were found on different explants of stevia at 15 and 30 DACI, treated with the same concentrations of Clorox for the same periods of time. The highest (66.68%) fungal contamination was found at 15 DACI by using 0 and 5% of Clorox for 20 and 5 min, respectively, whereas there were no fungal contaminations found on the explants treated with 20% of Clorox for 15 min and 30% of Clorox for 5, 15, and 20 min (Table 6). At 30 DACI, the control treatment (0% of Clorox) showed the highest frequencies of fungal contamination that was 66.67% for all time periods (5, 10, 15, and 20 min) and 5% of Clorox for 5 min of soaking also showed the highest (72.22%) fungal contamination. The 30% of Clorox for 15 and 20 min of sterilization of stevia explants showed no fungal contaminations (Table 6).
Non-contaminated stevia explants were produced by surface sterilization utilizing different concentrations of Clorox at different time periods. The highest (50.01%) decontaminations were found at 15 DACI using 10 and 20% of Clorox for 10 and 15 min, respectively whereas, 10% of Clorox for 5 min, 15% of Clorox for 15 and 20 min, and 30% of Clorox for 5 min showed the lowest (5.56%) frequency of decontaminations (Table 7). The highest frequencies of decontaminations at 30 DACI, were found as 61.11 and 72.23% by using 20% of Clorox for 5 min and 15 min, respectively while surface sterilisation using 30% of Clorox for 5 and 20 min resulted in 66.67% and 55.56% decontaminations. There were significant differences found among the concentrations of Clorox as well as among the time period for sterilization of explants of stevia based on the Student’s t-test at p = 0.05. The explants sterilized with 0, 10, and 30% of Clorox for 10 min and 5% of Clorox for 5 min showed no culture decontamination (Table 7).
The sterilizing agents and duration of exposure for sterilization of explants greatly affect the survivability of explants of stevia. At 15 DACI, the highest survivability was found using 5% of Clorox for 15 min (83.34%), 10% of Clorox for 15 min (77.79%) and 20 min (83.35%), 15% of Clorox for 15 min (77.79%), 20% of Clorox for 20 min (83.34%), and 30% of Clorox for 5 min (88.90%), 10 min (83.35%), 15 min (83.34%) and for 20 min (88.90%). Whereas the control (0%) concentration of Clorox showed the lowest (16.67%) rate of survivability of stevia explants sterilized for 5, 10,15, and 20 min at 15 DACI (Table 8). At 30 DACI, the highest (88.89%) survivability of stevia explants was found using 10% of Clorox for 10 min, whereas the lowest (16.67%) frequencies were found using 0% of Clorox for 5, 10, 15, and 20 min.
The lowest average survivability was also found using 5% of Clorox for 5 min (16.67%), 10% of Clorox for 5 min (22.22%), 20% of Clorox for 10 min (22.22%), 20% of Clorox for 15 min (16.67%), and 30% of Clorox for 5 min (22.22%) (Table 8).

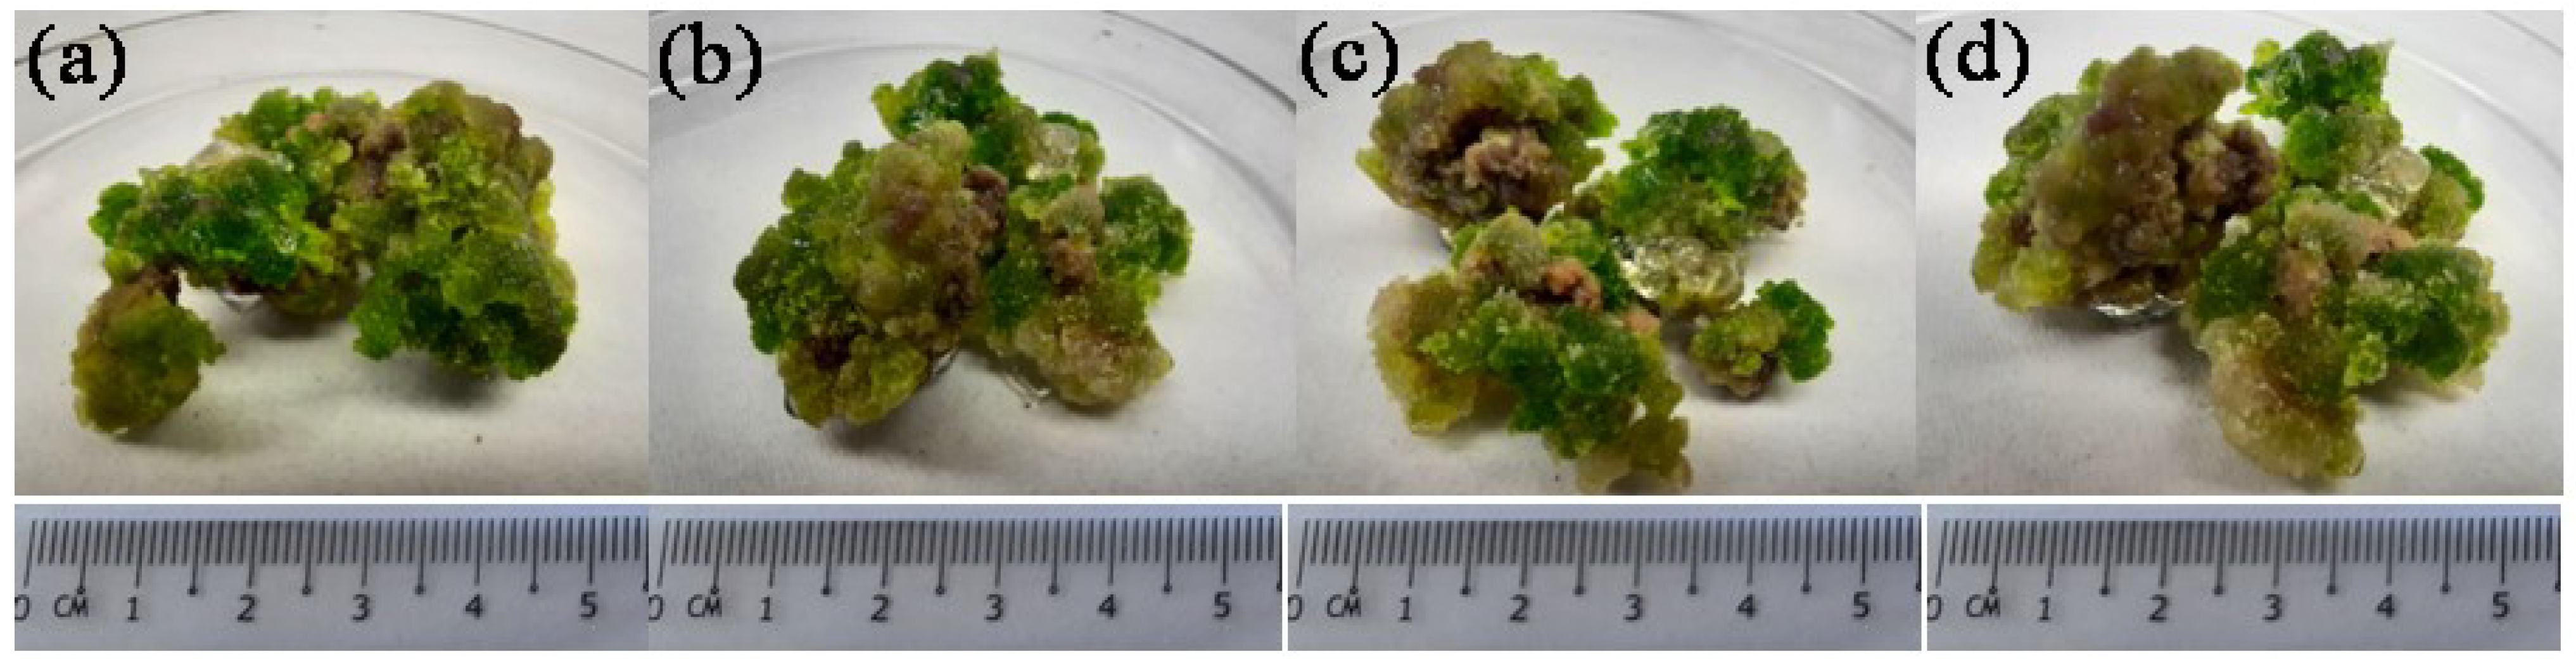
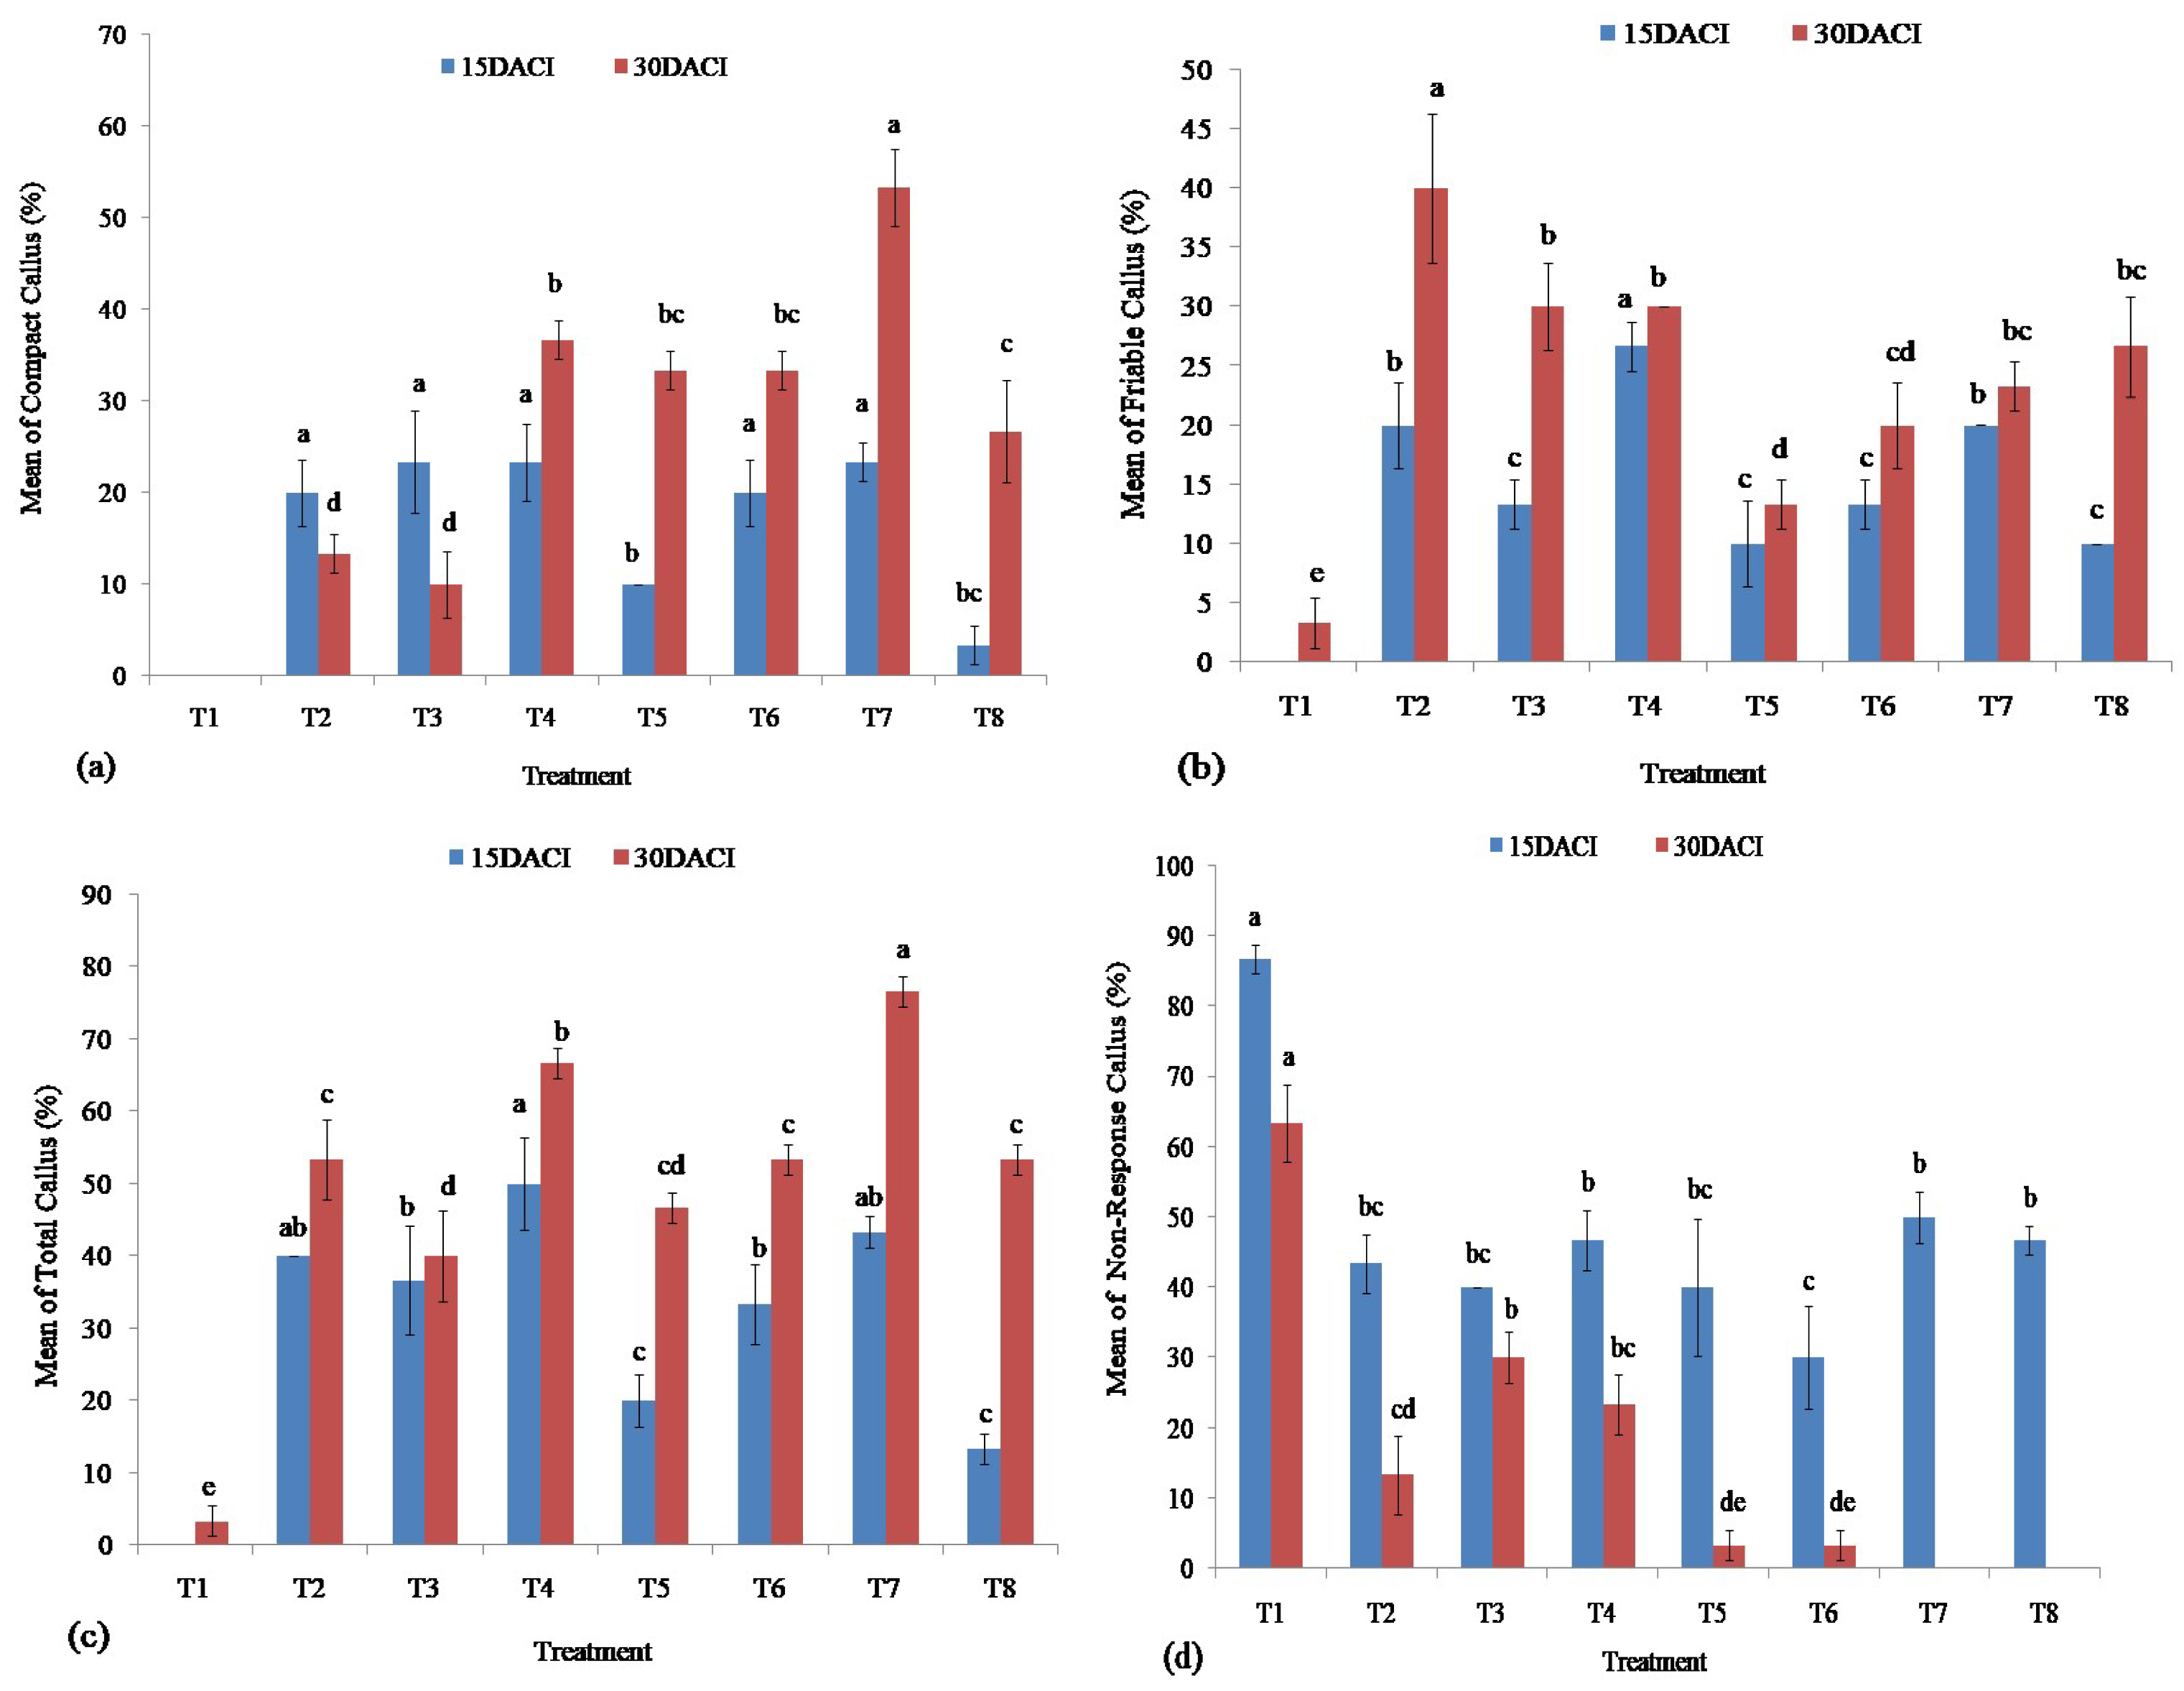
3.2. Callus Induction

The leaf segments of stevia were utilized as explants for the induction of callus on MS media supplemented with different concentrations of 2,4-D and 0.10 mg/L zeatin. The induced calli were characterized as compact and friable calli. Figure 2 illustrates the induced calli from stevia explants.
MS media supplemented with 0.10 mg/L zeatin and different concentrations of 2,4-D (0.10 mg/L, 0.25 mg/L, 0.50 mg/L, 1.00 mg/L, and 1.50 mg/L) induced higher percentage of compact calli of 20, 23.33, 23.33, 20, and 23.33, respectively at 15 DACI. The MS media in which PGRs were not included showed no compact calli induction from the plated explants of stevia. At 15 DACI, the media augmented with 0.10 mg/L zeatin and 2,4-D (0.75 mg/L, and 2.00 mg/L) induced 10% and 3.33% compact callus (Figure 3a). It was observed that there were significant differences found among the hormonal combinations on the induction of calli at 15 DACI. At 30 DACI, significantly the highest (53.33%) induction of compact calli was found from the MS media supplemented with 1.50 mg/L 2, 4-D and 0.10 mg/L zeatin. The MS media in which PGRs were not included showed no compact callus induction from the cultured explants of stevia at 30 DACI. The MS media supplemented with and 0.10 mg/L zeatin and different concentrations of 2,4-D (0.10 mg/L, 0.25 mg/L, 0.50 mg/L, 0.75 mg/L, 1.00 mg/L, and 2.00 mg/L) induced 13.33, 10, 36.67, 33.33, 33.33, and 26.67% of compact calli at 30 DACI, respectively (Figure 3a).
The MS media with different concentrations of 2,4-D and zeatin showed different levels of efficiencies in forming friable callus from cultured leaf segments of stevia at 15 and 30 DACI. The significantly highest (26.67%) percentage of friable calluses wasinduced on the MS media supplemented with 0.50 mg/L 2,4-D and 0.10 mg/L zeatin at 15 DACI, whereas at 30 DACI, the MS media with 0.10 mg/L 2,4-D and zeatin showed 40% induction of friable callus. The lowest frequencies (0.00 and 3.33%) of friable callus induction were found using MS media without any plant growth hormones at 15 DACI and 30 DACI, respectively (Figure 3b). At 15 DACI, the MS media with 0.10 mg/L zeatin and different concentrations of 2,4-D (0.10 mg/L, 0.25 mg/L, 0.75 mg/L, 1.00 mg/L, 1.50 mg/L, and 2.00 mg/L) produced 20, 13.33, 10, 13.33, 20, and 10% of friable callus whereas at 30 DACI, the MS media supplemented with 0.10 mg/L zeatin along with 0.25 mg/L, 0.50 mg/L, 0.75 mg/L, 1.00 mg/L, 1.50 mg/L, and 2.00 mg/L of 2,4-D induced 30, 30, 13.33, 20, 23.33 and 26.67% of friable callus, respectively.
The MS media utilized for the induction of calli showed different efficiencies in inducing calli from the explants of stevia at both 15 and 30 DACI. The highest (50%) percentage of callus formation was achieved from the explants cultured on the MS media augmented with 0.50 mg/L 2,4-D and 0.1 mg/L zeatin at 15 DACI, whereas the MS media having no plant growth hormones did not show any induction of callus. However, the media supplemented with 1.50 mg/L 2,4-D and 0.10 mg/L zeatin showed the highest (76.67%) efficiency in the induction of callus at 30 DACI and the media without any plant growth hormones also showed the lowest (3.33%) efficiency in the induction of callus at 30 DACI. At 15 DACI, the MS media with 0.10 mg/L zeatin and different concentrations of 2,4-D (0.10 mg/L, 0.25 mg/L, 0.75 mg/L, 1.00 mg/L, 1.50 mg/L, and 2.00 mg/L) produced 40, 36.67, 20, 33.33, 43.33, and 13.33% of total callus, respectively, whereas at 30 DACI, the MS media supplemented with 0.10 mg/L zeatin along with 0.10 mg/L, 0.25 mg/L, 0.50 mg/L, 0.75 mg/L, 1.00 mg/L, 1.50 mg/L, and 2.00 mg/L of 2,4-D induced 53.33, 40, 66.67, 46.67, 53.33, and 53.33% of total callus, respectively (Figure 3c).
The explants of stevia utilized to induce callus showed different degrees of callus induction in response to the MS media augmented with different plant growth hormones (2,4-D and zeatin) at different DACI. The highest percentage (86.67 and 63.33%) of explants did not show any response to the MS media having no PGRs for inducing calli at 15 and 30 DACI respectively. The lowest percentage of explants (30%) did not show a response to MS media containing 1.00 mg/L 2,4-D and 0.10 mg/L zeatin at 15 DACI. At 30 DACI, the 0.00% of explants did not show any response to MS media supplemented with 1.50 mg/L 2,4-D and 0.10 mg/L zeatin as well as 2.00 mg/L and 0.10 mg/L zeatin for inducing callus from the cultured explants of stevia. At 15 DACI, 43.33, 40, 46.67, 40, 50, and 46.67% of explants did not show any response to the MS media with 0.10 mg/L zeatin and 0.10 mg/L, 0.25 mg/L, 0.50 mg/L, 0.75 mg/L, 1.50 mg/L, and 2.00 mg/L of2,4-D respectively. The 13.33, 30, 23.33, 3.33 and 3.33% of explants did not show any prominent effect to form callus by the MS media with 0.10 mg/L zeatin and 0.10 mg/L, 0.25 mg/L, 0.50 mg/L, 0.75 mg/L, and 1.00 mg/L of 2,4-D respectively at 30 DACI (Figure 3d).

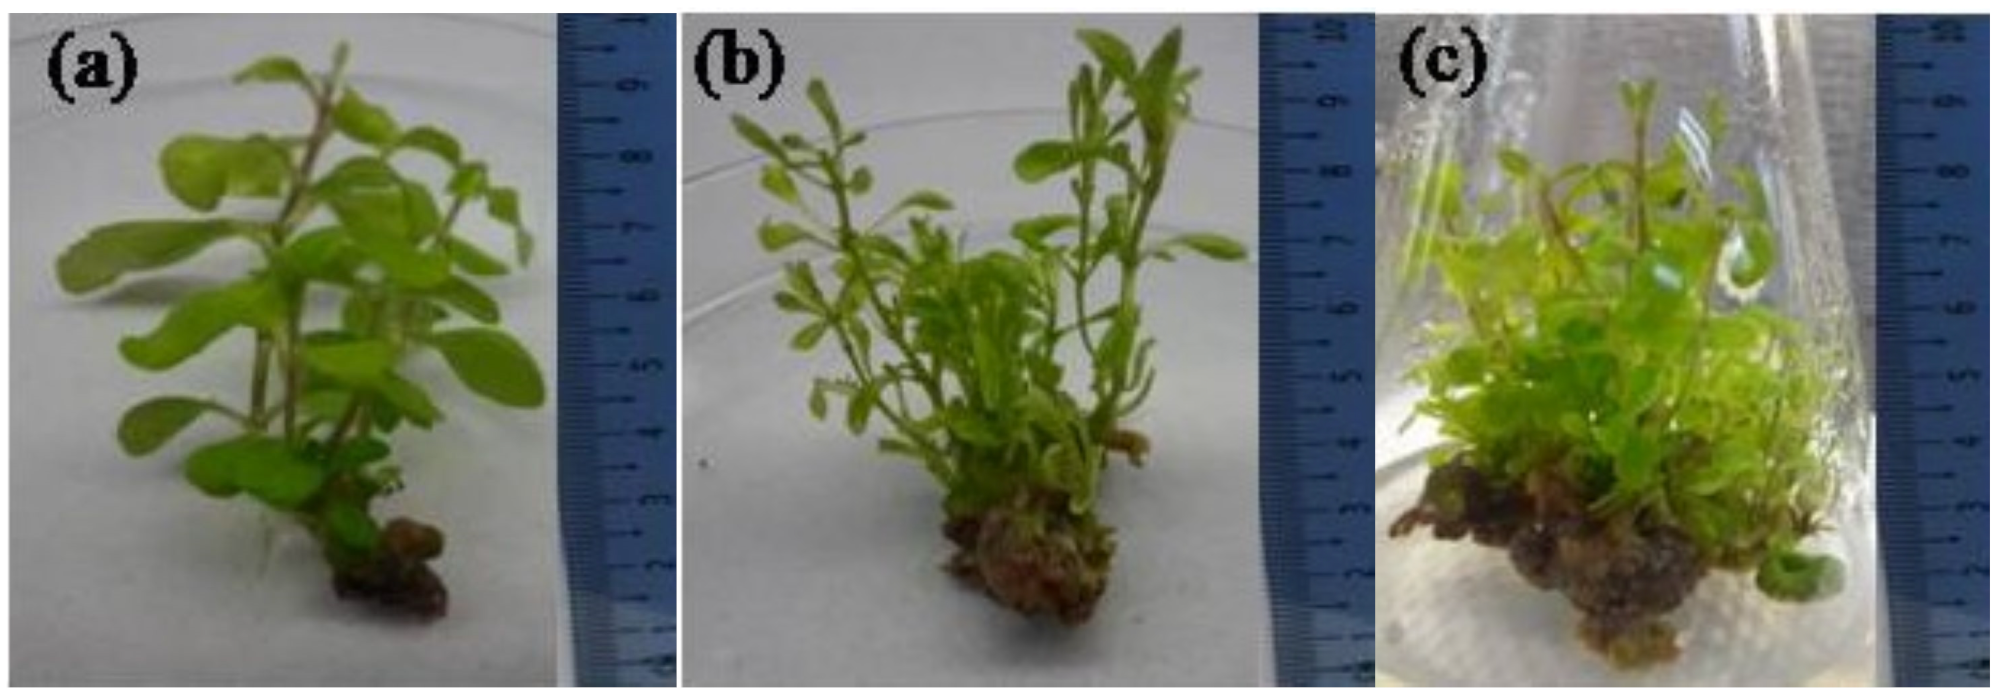
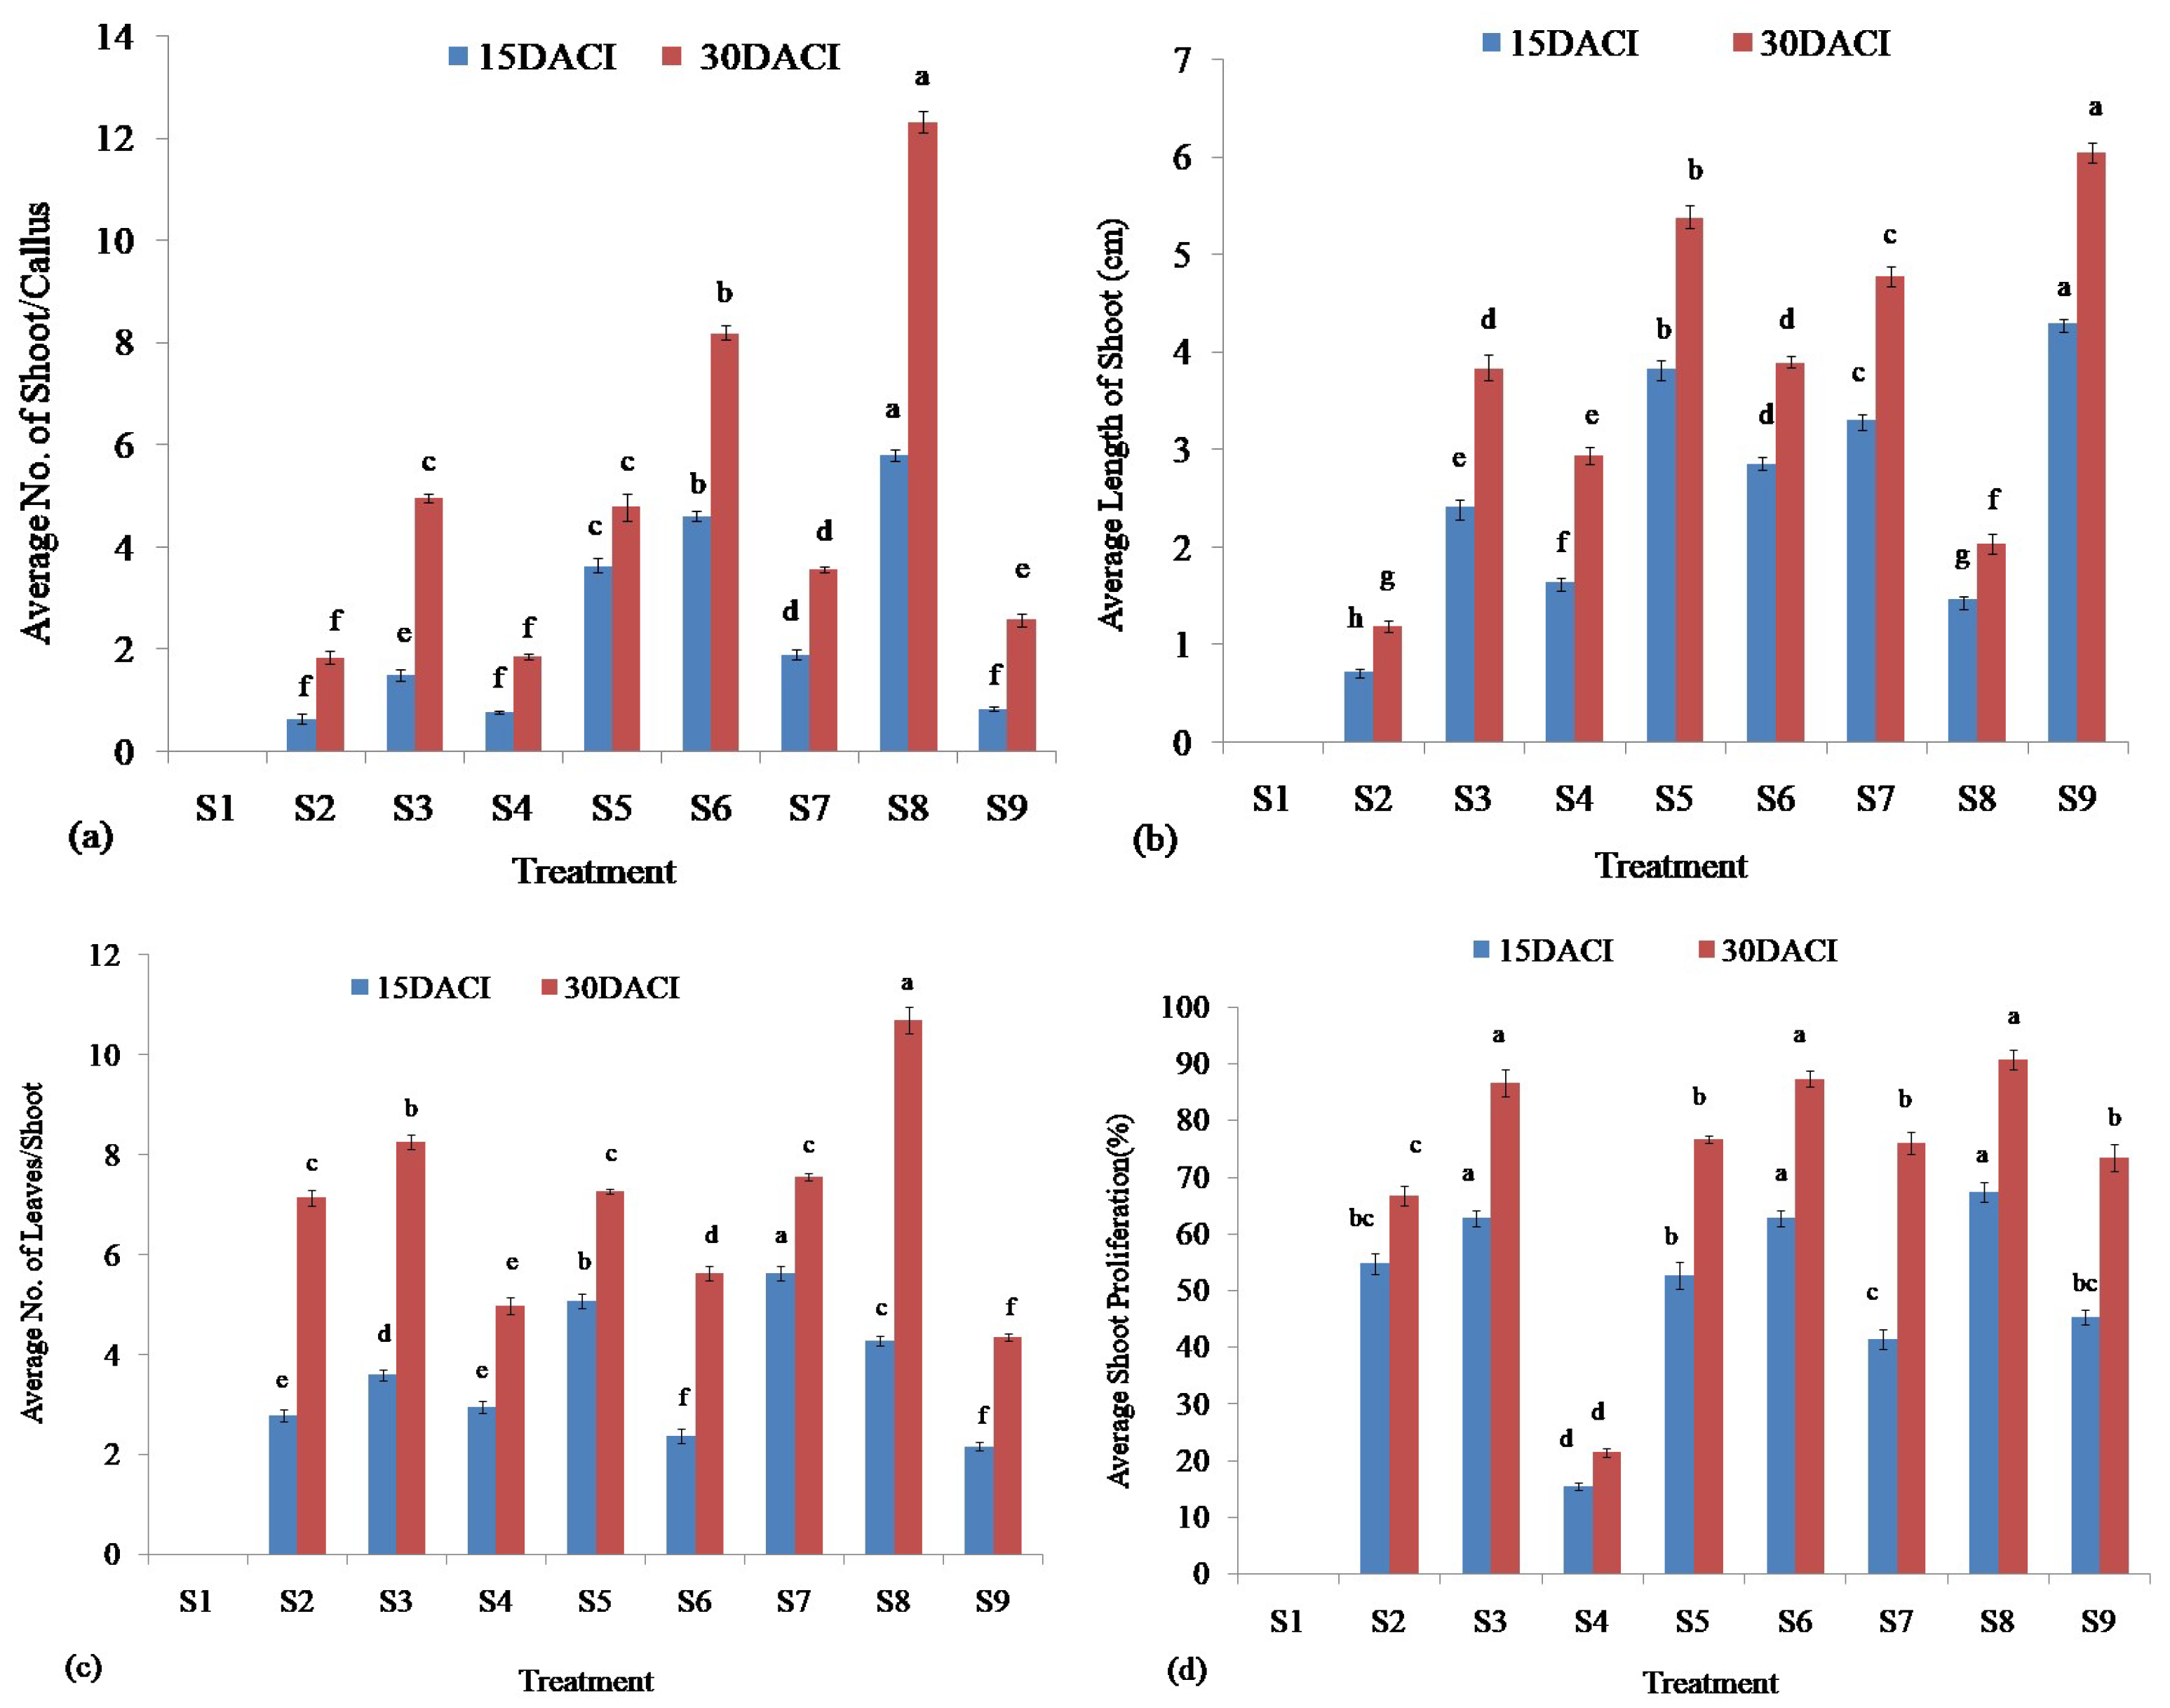
3.3. Shoot Regeneration
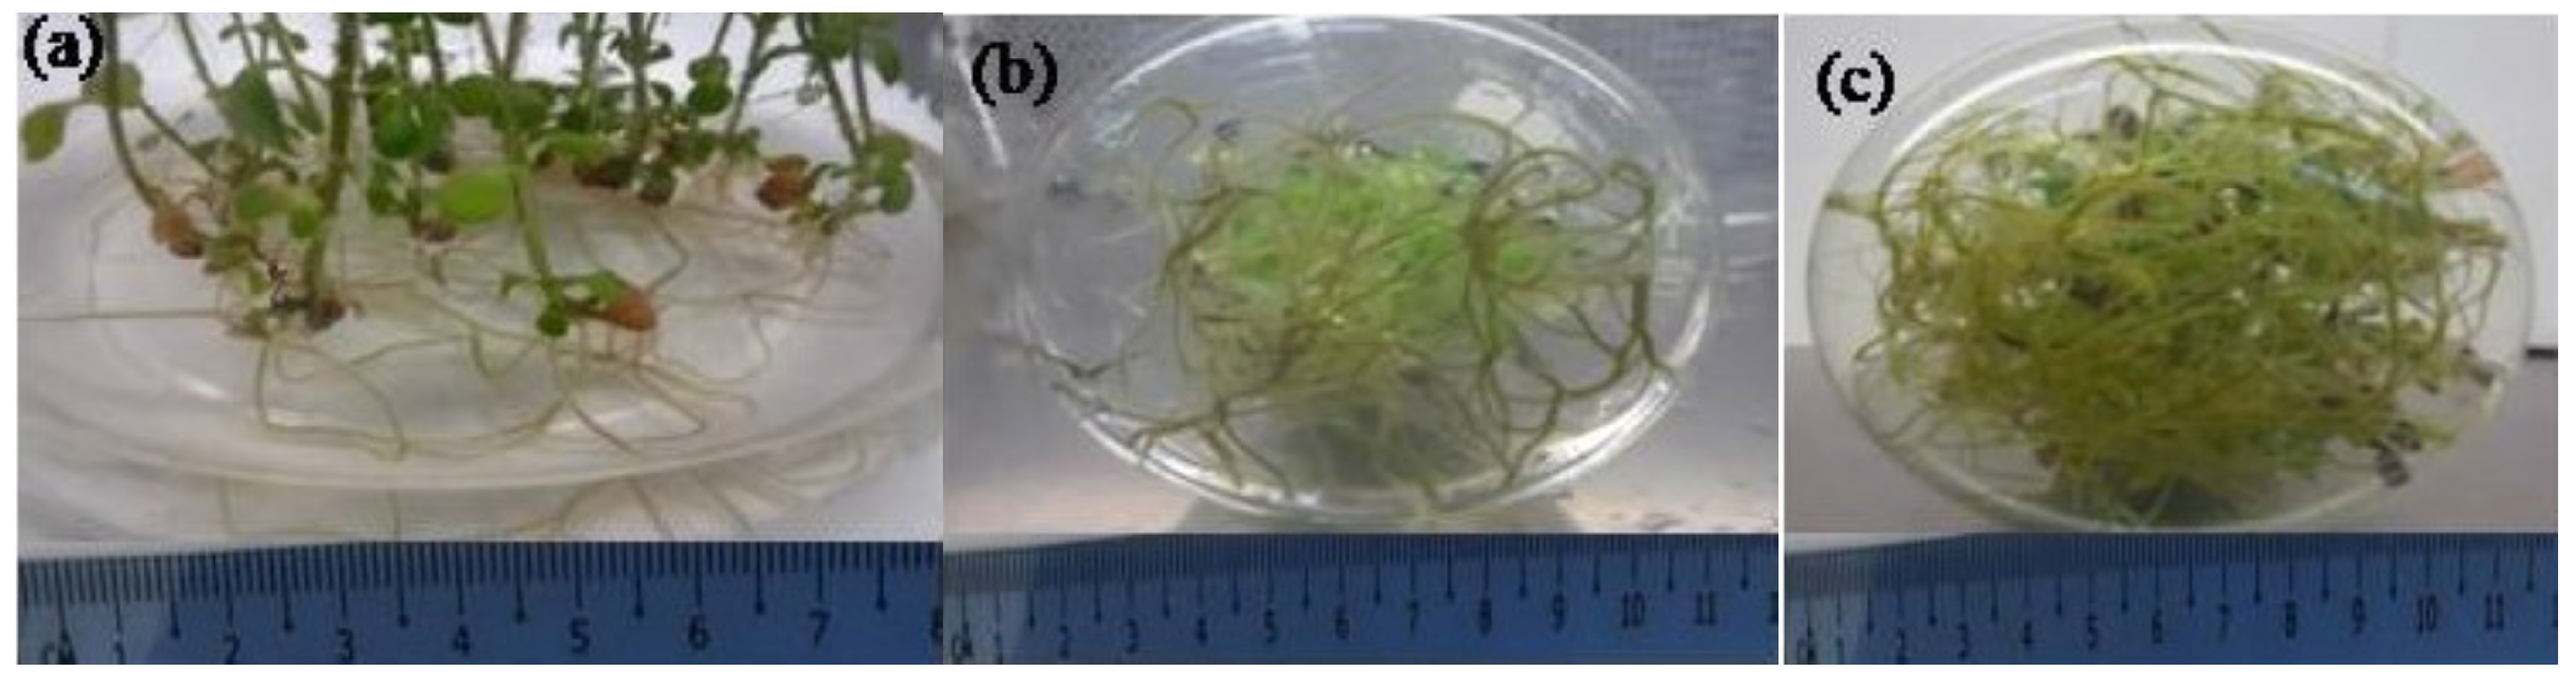
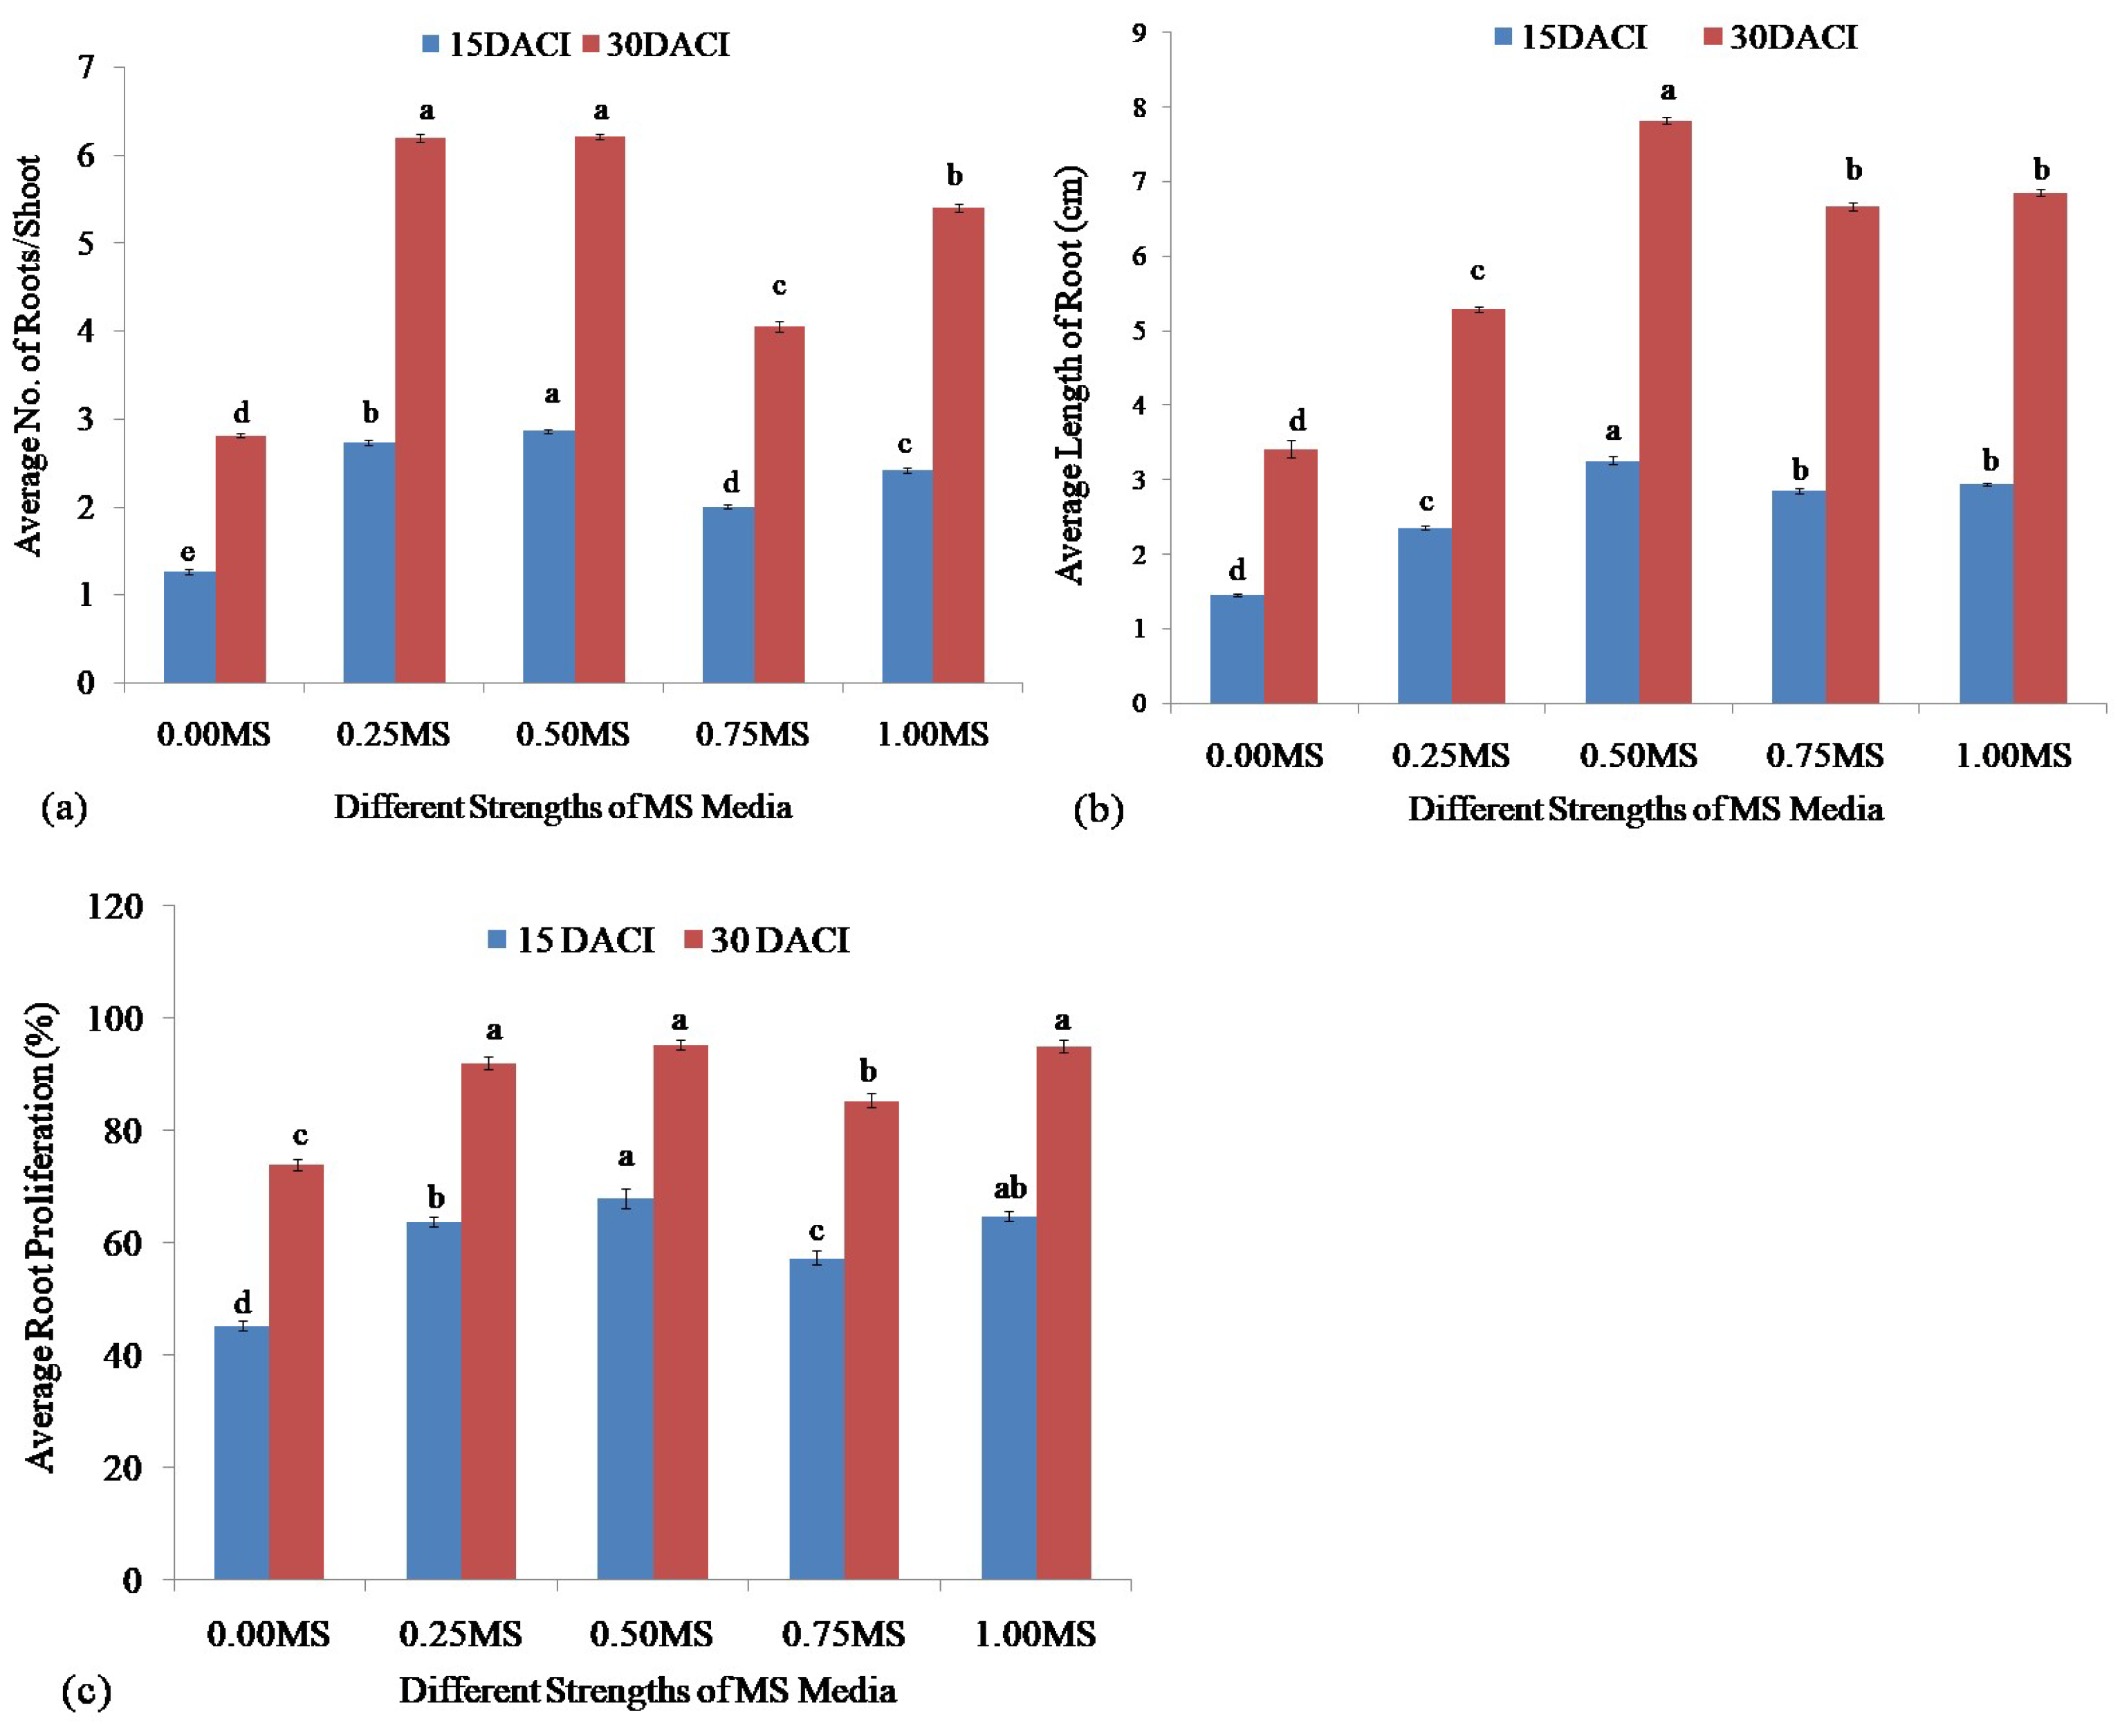
The induced calli of stevia were utilized for the regeneration of shoots on MS media with different concentrations of BAP and NAA listed in Table 2. The MS media augmented with different concentrations of BAP and NAA showed variable efficiencies in the regeneration of shoots of stevia (Figure 4). The highest number of shoot proliferation per callus (5.8) was found from MS media supplemented with 10.0 mg/L BAP without NAA at 15 DACI and also remains the highest (12.33) at 30 DACI. The MS media supplemented without any plant growth hormone did not show any shoot proliferation at both 15 and 30 DACI. Besides the MS media supplemented without any plant growth hormone, the lowest number of shoot proliferation (0.65) and (1.85) were found from the MS media supplemented with 1.00 mg/L BAP without NAA at 15 and 30 DACI, respectively. The MS media with 1.00 mg/L BAP and 1.00 mg/L NAA, 2.50 mg/L BAP, 2.50 mg/L BAP and 1.00 mg/L NAA, 5.00 mg/L BAP, 5.00 mg/L BAP and 1.00 mg/L NAA, and 10.00 BAP and 1.00 mg/L NAA regenerated the average number of 1.51, 0.78, 3.65, 4.62, 1.90, and 0.85 shoots per callus, respectively, at 15 DACI. At 30 DACI, the mean numbers 4.97, 1.86, 4.79, 8.20, 3.57, and 2.59 of shoots regenerated from the induced calli by utilizing MS media augmented with 1.00 mg/L BAP and 1.00 mg/L NAA, 2.50 mg/L BAP, 2.50 mg/L BAP and 1.00 mg/L NAA, 5.00 mg/L BAP, 5.00 mg/L BAP and 1.00 mg/L NAA, and 10.00 mg/L BAP and 1.00 mg/L NAA, respectively (Figure 5a).
The MS media augmented with different concentrations of BAP and NAA showed different levels of efficiency in generating shoots with different lengths. The MS media supplemented with BAP (10.0 mg/L) and NAA (1.00 mg/L) showed the highest efficiency in producing the average longest (4.31 cm) shoot at 15 DACI. The average longest shoot (6.05 cm) was also found from the same modified MS media at 30 DACI. The MS media containing no plant growth hormone did not show any induction of shoot from the cultured callus at both 15 and 30 DACI. At both 15 and 30 DACI, the MS media with only 1.00 mg/L BAP regenerated average lowest 0.73 and 1.19 cm long shoots, respectively. The MS media with 1.00 mg/L BAP and 1.00 mg/L NAA, 2.50 mg/L BAP, 2.50 mg/L BAP and 1.00 mg/L NAA, 5.00 mg/L BAP, 2.50 mg/L BAP and 1.00 mg/L NAA, and 10.00 mg/L BAP regenerated average 2.42, 1.65, 3.83, 2.86, 3.31, and 1.47 cm long shoots, respectively, at 15 DACI. At 30 DACI, the MS media with 1.00 mg/L BAP and 1.00 mg/L NAA, 2.50 mg/L BAP, 2.50 mg/L BAP and 1.00 mg/L NAA, 5.00 mg/L BAP, 2.50 mg/L BAP and 1.00 mg/L NAA, and 10.00 mg/L BAP regenerated average 3.84, 2.94, 5.38, 3.90, 4.78, and 2.04 cm long shoots, respectively (Figure 5b).
The numbers of leaves per shoot were counted from regenerated plantlets of stevia utilizing MS media containing different concentrations of BAP and NAA. The highest average number of leaves (5.63) per shoot was found in regenerated shoots from cultured calli on MS media supplemented with BAP (5.00 mg/L) and NAA (1.00 mg/L) at 15 DACI, but at 30 DACI, the highest average number of leaves (10.70) per shoot were found in regenerated shoots from cultured calli on MS media supplemented with BAP (10.00 mg/L) without NAA. The MS media without any plant growth hormone did not produce any leaves from the cultured calli at 15 and 30 DACI. At both 15 and 30 DACI, the MS media with 10.00 mg/L BAP and 1.00 mg/L NAA produced an average lowest 2.16 and 4.35 number of leaves per shoot, respectively. At 15 DACI, the MS media supplemented with 1.00 mg/L BAP, 1.00 mg/L BAP and 1.00 mg/L NAA, 2.50 mg/L BAP, 2.50 mg/L BAP and 1.00 NAA, 5.00 mg/L BAP, 10.00 mg/L BAP, and 10.00 mg/L BAP and 1.00 mg/L NAA produced average 2.78, 3.59, 2.95, 5.07, 2.37, and 4.28 number of leaves per shoot from induced calli, respectively. The MS media containing 1.00 mg/L BAP, 1.00 mg/L BAP and 1.00 mg/L NAA, 2.50 mg/L BAP, 2.50 mg/L BAP and 1.00 mg/L NAA, 5.00 mg/L BAP, and 5.00 mg/L BAP and 1.00 mg/L NAA produced average 7.14, 8.27, 4.98, 7.26, 5.64, and 7.56 number of leaves per shoot, respectively, from induced calli at 30 DACI (Figure 5c).
The MS media with different concentrations of BAP and NAA exhibited different shoot regeneration frequencies from calli. The media with BAP (10.0 mg/L) without NAA showed the highest average percentage of shoot proliferation (67.33%) at 15 DACI. At 30 DACI of shoot regeneration, the same media showed the highest average percentage of shoot proliferation (90.67%). The MS media without having any plant growth hormones did not show any frequencies of shoot regeneration from the calli. Besides the MS media without any plant growth hormones, 2.50 mg/L BAP containing MS media showed the lowest average percentages (15.33% and 21.33%) of shoot proliferation at 15 and 30 DACI. The MS media with 1.00 mg/L BAP, 1.00 mg/L BAP and 1.00 mg/L NAA, 2.50 mg/L BAP and 1.00 mg/L NAA, 5.00 mg/L BAP, 5.00 mg/L BAP and 1.00 mg/L NAA, and 10.00 mg/L BAP and 1.00 mg/L NAA proliferated average 44.67, 62.67, 52.67, 62.67, 41.33, and 45.33% shoots, respectively, at 15 DACI. At 30 DACI, the MS media supplemented with 1.00 mg/L BAP, 1.00 mg/L BAP and 1.00 mg/L NAA, 2.50 mg/L BAP and 1.00 mg/L NAA, 5.00 mg/L BAP, 5.00 mg/L BAP and 1.00 mg/L NAA, and 10.00 mg/L BAP and 1.00 mg/L NAA proliferated average 66.67 86.67, 76.67, 87.33, 76, and 73.33% shoots, respectively, from induced calli (Figure 5d).

3.4. Root Induction

The regenerated shoots were cultured for induction of the stevia roots. For root induction, different strengths of MS (0.00, 0.25, 0.50, 0.75, and 1.00) media without any plant growth hormone were utilized. Figure 6 illustrates the roots originated from shoots of stevia. The highest average number of roots (2.86) per shoot was recorded from 0.50 MS media at 15 DACI. At 30 DACI, the 0.25 and 0.50 MS media showed the highest number of roots initiation of 6.19 and 6.20, respectively. The 0.00 strengths of MS media exhibited the lowest average numbers of roots with 1.26 and 2.81 inductions at both 15 and 30 DACI, respectively. The 0.25 MS, 0.50 MS, and 0.75 MS induced an average of 2.73, 2.86, and 2.00 roots per shoot, respectively, at 15 DACI, whereas at 30 DACI, an induced average of 6.19, 4.05, 5.40 roots per shoot, respectively (Figure 7a). All values between 15 and 30 DACI were significantly different in inducing roots from shoots of stevia based on the Student’s t-test at the probability level of p = 0.05.
The different strengths of MS (0.00, 0.25 0.50, 0.75, and 1.00) media showed different efficiencies in the production of root on the cultured shoot of stevia, especially on root length. The 0.50 MS media showed a good performance in producing the average highest (3.25 cm) length of root using shoot at 15 DACI. Concerning the shoots ability to produce shoots at 30 DACI, the 0.50 MS media showed the same performance in producing the longest root (7.82 cm). The 0.00 MS media at both 15 and 30 DACI produced the average shortest roots of 1.45 and 3.41 cm, respectively. At 15 DACI, the 0.25 MS, 0.75 MS, and 1.00 MS induced average lengths of 2.36 cm, 2.86 cm, and 2.93 cm roots, respectively, from regenerated shoots of stevia, whereas the same strengths of MS media induced average lengths of 5.29 cm, 6.67 cm, and 6.85 cm roots, respectively, at 30 DACI (Figure 7b).
The different strengths (0.00, 0.25, 0.50, 075, and 1.00) of MS media showed different efficiencies in root regeneration from cultured shoots of stevia. The highest mean percentages (68.00%) of shoots were able to produce roots on 0.50 MS media at 15 DACI. At 30 DACI, the 0.50 MS media showed the highest average percentages (95.33%) of shoots in producing roots, and 95 and 92% of shoots were able to produce roots on 1.00 MS and 0.25 MS media, respectively. At 15 and 30 DACI of shoots for the regeneration of roots, the 0.00 MS media showed the lowest average percentages in producing roots of 45.33 and 74.00%, respectively. At 15 DACI, the 0.25 MS, 0.75 MS, and 1.00 MS were effective in producing roots from 63.67, 57.33, and 64.667% shoots, respectively, whereas at 30 DACI, the frequencies were 92, 85.33, and 95%, respectively (Figure 7c).

3.5. HPLC Analysis for Steviol Glycosides (SGs)

The accumulation of stevioside and rebaudioside A in the leaves of stevia grown on different strengths of MS (0.0, 0.25, 0.50, 0.75, and 1.00) media was investigated in this study.All validated efforts that employed HPLC analysis to identify stevioside and rebaudioside A fulfilled the standardized guidelines. The determination of stevioside and rebaudioside A content in the leaves of stevia grown on different strengths of MS (0.00, 0.25, 0.50, 0.75, and 1.00) media revealed that all of the treatments used for rooting of stevia resulted in different accumulation levels of stevioside and rebaudioside A. The highest (39.76%) accumulation of stevioside was found in the leaves of stevia grown on 0.75 MS media, followed by 39.17 and 38.16% from the leaves grown on 0.25 MS and 0.50 MS media, respectively. The lowest (23.67%) level of stevioside accumulation was found in the leaves of stevia grown on 0.00 MS media and was significantly different from the stevioside accumulation in the leaves of stevia grown on 0.25 MS, 0.50 MS, 0.75 MS, and 1.00 MS media. The leaves of stevia rooted on 1.00 MS media accumulated 30.56% stevioside (Figure 8).
The accumulation of rebaudioside A also varied in the leaves of stevia rooted on different strengths of MS (0.00, 0.25, 0.50, 0.75, and 1.00) media. The highest (6.53%) accumulation of rebaudioside A was found in the leaves of stevia grown on 0.25 MS media, whereas the lowest (5.28%) accumulation of stevia was found in the leaves of stevia grown on 0.00 MS media. There was a significant difference between the synthesis of rebaudioside A in the leaves of stevia grown on 0.25 MS and 0.00 MS media. At the same time, the 0.50 MS, 0.75 MS, and 1.00 MS media accumulated 5.90, 5.85, and 5.44% rebaudioside A, respectively, in stevia leaves, and there was a significant difference among them based on the Student’s t-test at p = 0.05 (Figure 8).

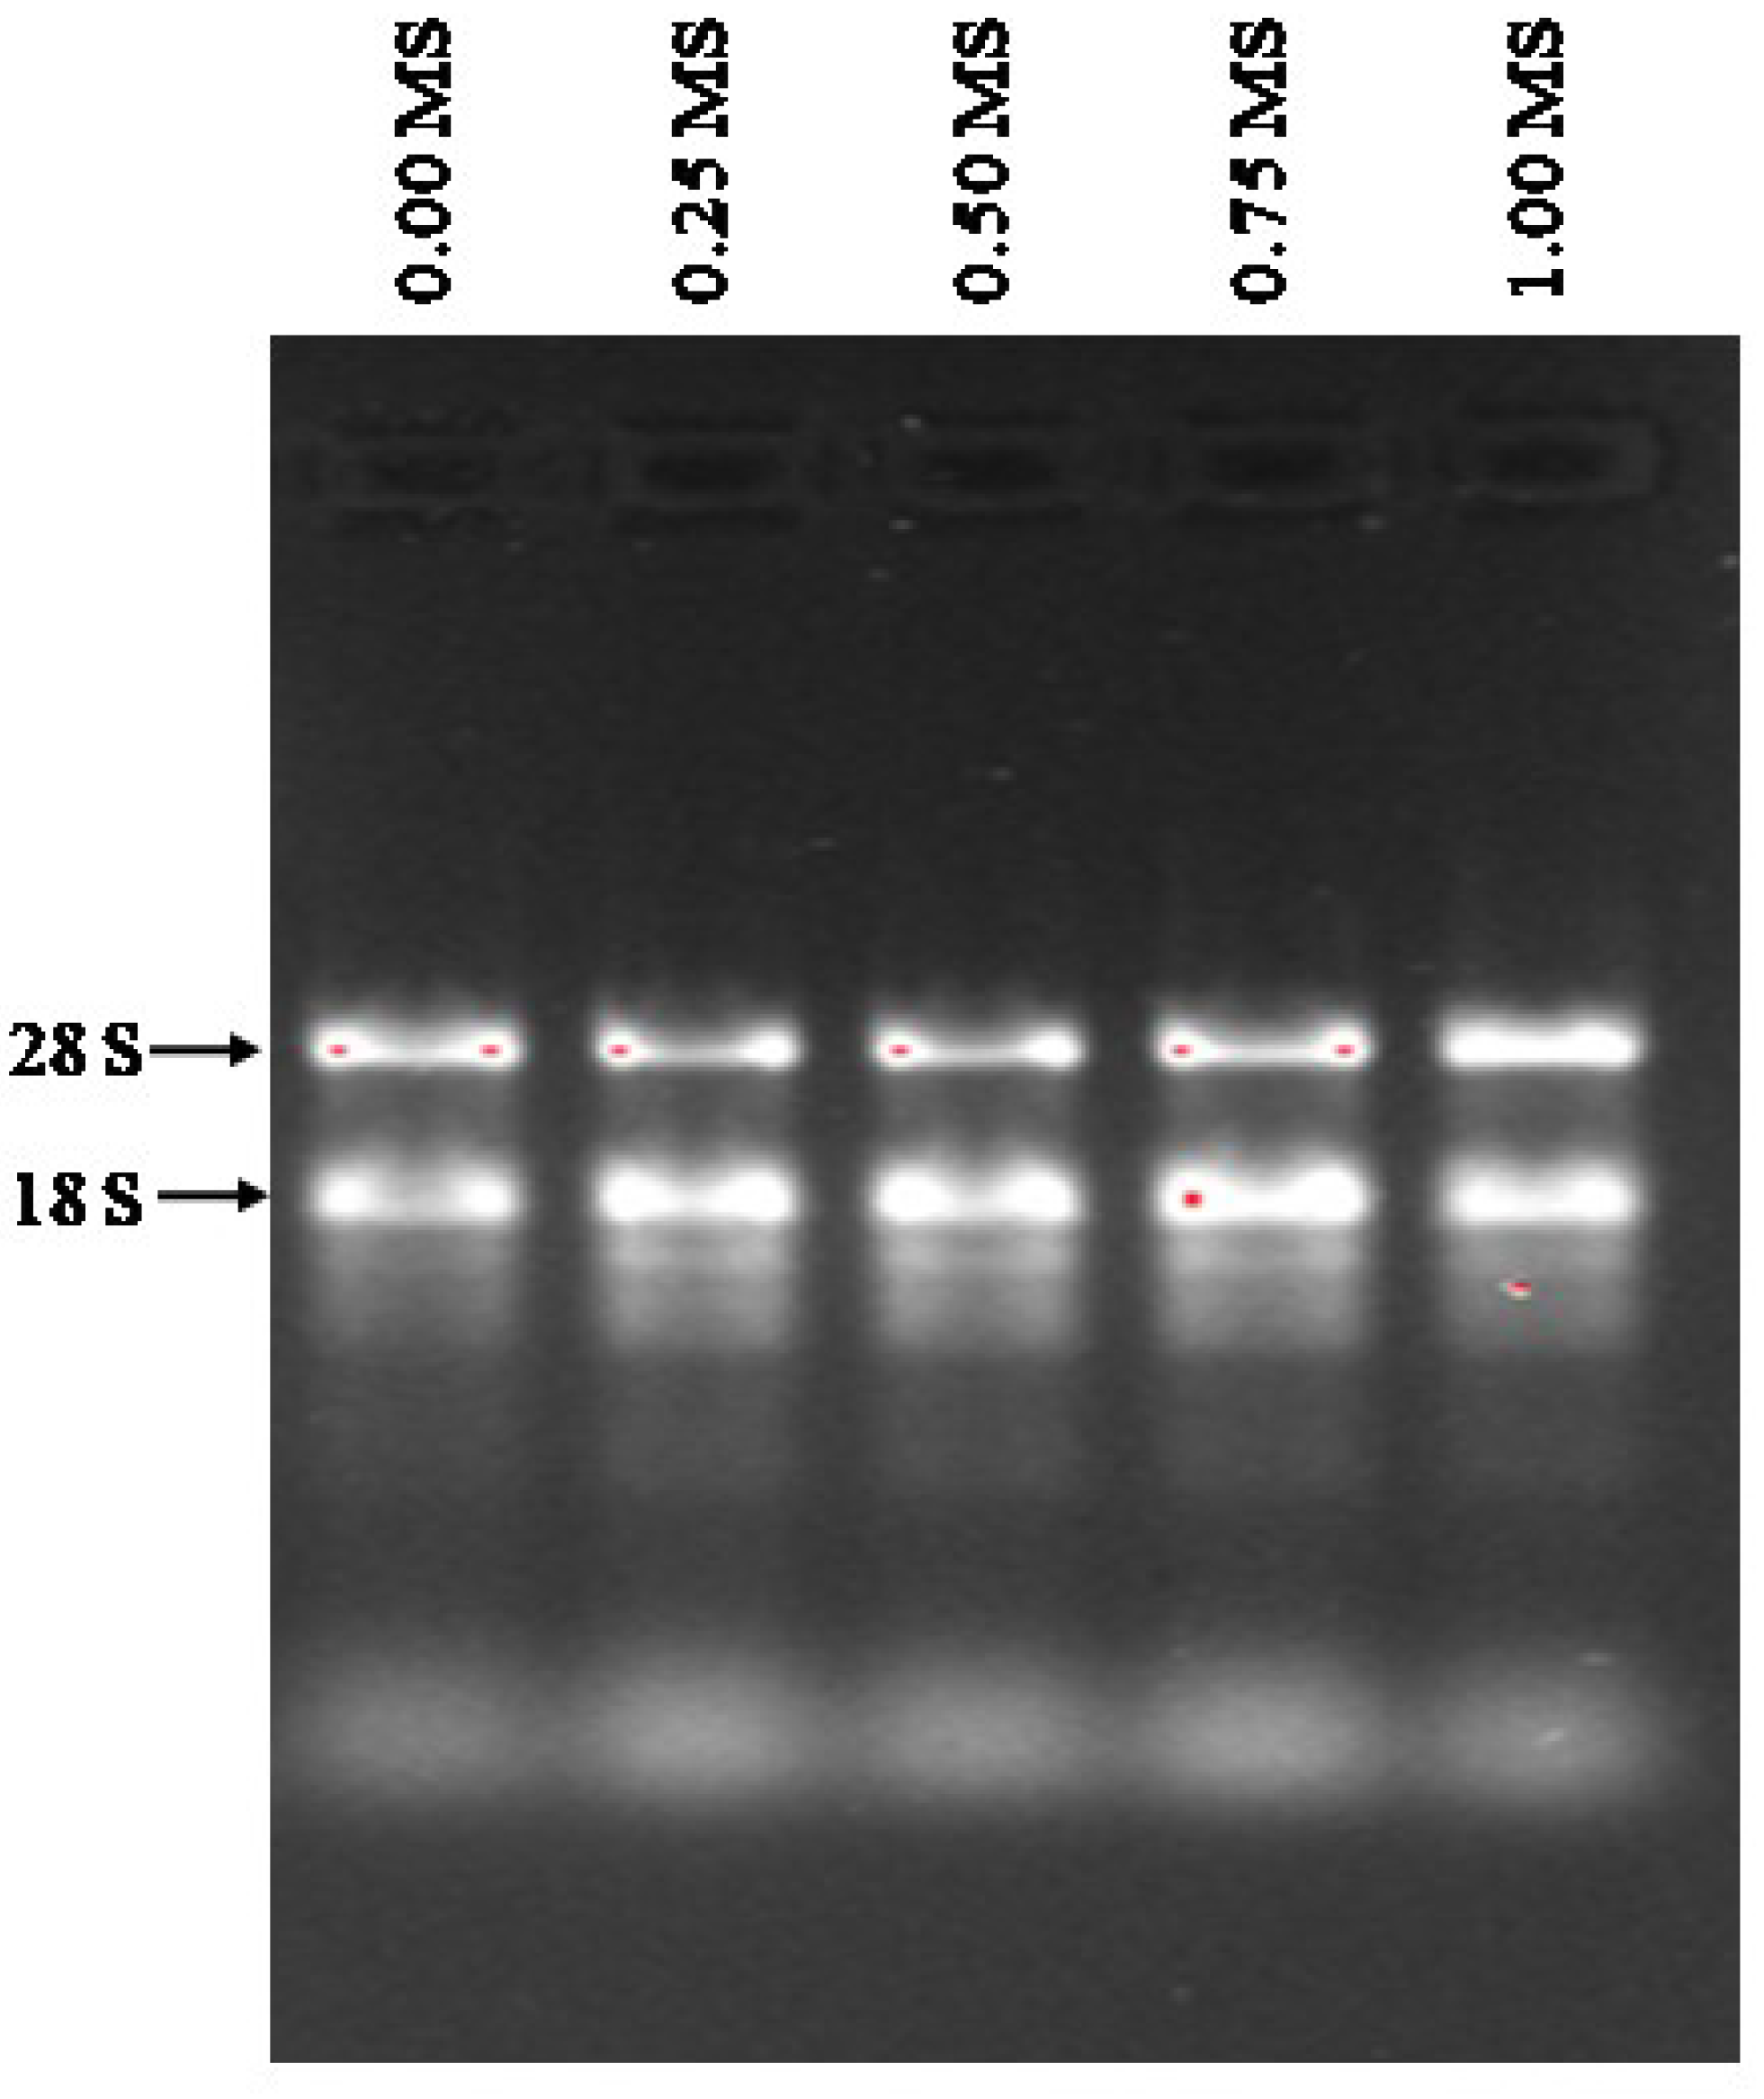
3.6. Quality and Concentrations of RNAs Isolated from Stevia Leaves

The purities of isolated RNAs ranged from 1.89 to 1.96 before DNase I treatment and increased to between 2.02 to 2.04 after the removal of the DNA. The final yield obtained ranged from 138.9 to 178.3 ng/µL (Table 9). The distinct bands corresponding to 28S and 18S RNAs were clearly visible, showing that the RNA was of good integrity without DNA contamination (Figure 9).

3.7. RT q-PCR Analysis for UGT76G1, UGT74G1 and UGT85C2

Based on the results, stevia rooted on 0.25 MS media showed the highest (1.16-folds) level of expression of UGT76G1 followed by the plants rooted on 0.50 MS media exhibiting 1.15-folds, 1.00 MS media (0.80-folds) and 0.75 MS media (0.76-folds). The lowest level of expression of UGT76G1 was found in the stevia grown on 0.00 MS media (0.73-folds) (Figure 10).
The normalized gene expression of UGT74G1 relative to zero showed significant variation among the stevia plantlets rooted on different strengths (0.00, 0.25, 0.50, 0.75, and 1.00) of MS media and showed the highest value of gene expression (1.34-fold) in the stevia grown on 0.50 MS media whereas the lowest (0.87-fold) value for normalized gene expression was found in the stevia grown on 0.00 MS media. The UGT74G1 was moderately expressed in stevia rooted on 0.75 MS, 1.00 MS, and 0.25 MS, where the values were 1.12, 1.10, and 0.97-fold, respectively (Figure 10).
The stevia grown on different strengths of MS media also showed significant variations in the expression levels of UGT85C2. The stevia grown on 0.75 MS media showed the average highest (1.10 folds) level of expression of UGT85C2 relative to zero, while the stevia achieved from 0.00 MS media exhibited the averagelowest (0.79-fold) level of expression. The normalized gene expression value for UGT85C2 was also detected as 1.01, 0.89, and 0.81-fold in the stevia rooted on 0.50, 0.25, and 1.00 MS media, respectively (Figure 10).

4. Discussion

Maintaining an aseptic environment is essential for optimal in vitro plant regeneration and proliferation. Reducing contamination that often involves time-consuming and lengthy procedures is the major difficulty faced when field-grown plants are selected as the source of explants for the production of “clean”in vitro plantlets [50]. In the present study, a 50.01% and 72.23% decontamination of stevia explants was achieved using 20% of Clorox for 15 min at 15 and 30 DACI, respectively. Even when we increased the concentration of Clorox to 30% (4.5% of calcium hypochlorite) for 30 min, we still observed a very high percentage of survivability of explants (88.90%). The highest survivability (43%) that has been reported for stevia explants sterilized using calcium hypochlorite was at 3% for 10 min by Halim et al., (2017) [51], and 76.67% of survivability was achieved utilizing 5% calcium hypochlorite for 10 min by Urbi et al., (2015) [52]. Our results and the other studies suggest that the explants used in in vitro culture can tolerate the increasing concentration of calcium hypochlorite up to 4.5%. However, with a duration above 10 min using this high concentration of calcium hypochlorite, the decontamination improves but reduces the survivability of explants. The improvement in the survivability rate could be due to enhanced protection from the damaging effects of microbial contaminants. Similar to the observations by Hammond et al., (2014) [53], ethanol alone did not overcome contamination of stevia explants, but instead had negative effects on the explants, causing the cultures to deteriorate.
The stevia culture was mainly contaminated with fungal species consistent with the reports by Mng’omba et al., (2012) [54] and Hammond et al., (2014) [53], which showed fungi to be the most visible and well-known contaminants in tissue-cultured plants. The highest concentration (30%) of Clorox for higher exposure time (15 and 20 min) was able to eradicate all fungal contaminations from the explants of stevia and a similar observation was revealed by Sen et al., (2013) [55]. The different concentrations of Clorox also successfully overcame bacterial contaminations on the stevia explants. Surface sterilization of plant explants from various sources using Clorox has been well documented [56,57]. According to Zand et al., (2012) [58], the efficacy of Clorox increased with increased exposure duration. Hypochlorite salts [NaOCl, Ca(OCl)2, LiOCl, and KOCl] dissolving in water produce HClO, whose concentration is adversely linked with bactericidal action, perhaps owing to lethal to DNA [55].
The induction of callus from appropriate explants is the initial stage in indirect regeneration. According to Guruchandran and Sasikumar (2013) [59], the maximum callus induction was found using leaf explants amongthe three explants (leaf, nodal segment, and shoot tip) of stevia studied. Singh et al., (2017) [60] also emphasized the use of stevia leaf for callus induction and in vitro regeneration. The best callogenic response was observed on flower explants of stevia incubated on MS medium supplemented with synthetic auxin and cytokinins (2.00 mg/L 2,4-D and 2.00 mg/L BA) after 30-days of culture [61]. Another study by Abdelmaksood et al., (2017) [62] also showed that a combination of synthetic auxin and cytokinin (1.00 mg/L BAP and 0.50 mg/L NAA) was a better treatment for the high frequency of callus induction in stevia. This may suggest that the combination of different types of synthetic auxin and cytokinin are effective in inducing callus formation of stevia. However, the concentration of the specific type of auxin and cytokinin needs to be optimized for maximum frequency of callus induction. In this study, the leaf explants sterilized with 10% Clorox for 10 min utilized for callus induction revealed higher survivability at 30 DACI. Good-quality friable callus was initially observed when the MS-medium was augmented with 0.50 mg/L 2,4-D and 0.10 mg/L zeatin but with a longer period of culture, a higher frequency of callus formation was found with increasing concentration of 2,4-D. There are limited reports on the use of natural cytokinin in the form of zeatin in combination with auxin for callus induction in stevia. Wada et al., (1981) [63] used much higher concentration of zeatin (10.00 mg/L) for callus induction from stevia in combination with IAA (1.00 mg/L), a natural auxin.
In the present study, we optimized the regeneration of stevia through adventitious organogenesis. The combination of BAP and NAA (1.00 mg/L) demonstrated 86.67% regeneration potential after 30 DACI. Wan et al., (2011) [64] and Huii et al., (2012) [65] obtained similar results from Brassica napus and Salvia splendens, respectively. However, the maximum percentage of calli was induced on MS media supplemented with 10.00 mg/L BAP without NAA at 30 days, achieving 90.67% success. Ahmad et al., (2010) [66] found a similar result demonstrating that BAP alone can enhance the shooting response in stevia. Zuraida et al., (2011) [67] also found that MS medium augmented with 5.00 mg/L BAP having no NAA generated the highest percentage of shoot regeneration (86%). The uses of BAP at very low concentrations is less expensive [68].
In the current investigation, the average highest (5.8 and 12.33) number of shoots per callus was observed at 15 and 30 DACI, respectively, when the 10.00 mg/L BAP alone was added. Thiyagarajan and Venkatachalam (2012) [69] found a total of 123 shoots per stevia explant. The discrepancy in the results is attributable to the manner of regeneration. The current study employed an indirect regeneration approach to create numerous shoots from callus culture, whereas they [69] used direct regeneration from nodal segments [69]. Our findings corroborate with Ahmad et al., (2010 and 2011) [61,66] observation, who reported that the addition of BA induced the maximum number of shoots per explant in stevia. In the present study, it was observed that higher concentrations of BAP in MS media significantly increased the length of shoots. A higher concentration of BAP (10.00 mg/L) in the presence of NAA (1.00 mg/L) showed a maximum shoot length of 4.30 and 6.04 cm at both 15 and 30 DACI, respectively. However, the same concentration of BAP (10.00 mg/L) without NAA produced a significantly shorter shoot length of 1.47 and 2.04 cm, respectively, at both 15 and 30 DACI. The freshly added auxin in the growth media consequently carried to the bases of the lamina, petiole, and hypocotyl, where it promotes cell elongation in the petiole and hypocotyl [70,71,72,73].
Under in vitro conditions, shoot elongation in stevia is a major problem because elongated shoots begin to curl after transferring to the soil environment. Addition of a higher concentration of BAP without NAA in the MS media results in a shorter shoot length which is preferable. Dey et al., (2013) [74] reduced the length of shoots of stevia by the addition of the Indole-3-butyric acid (IBA), an auxin, and chlorcholine chloride [gibberellin (GA) biosynthesis inhibitor] into the MS-medium. The number of leaves regenerated per explant under the impact of various PGRs was also studied in this experiment. At 15 DACI, the MS media supplemented with 5.00 mg/L BAP and 1.00 mg/L NAA produced the significantly highest number (5.63) of leaves, and at 30 DACI, the MS media containing 10.00 mg/L BAP produced 10.70 leaves per shoot. Fakhrul et al., (2014) [75] obtained similar results on the number of leaves regenerated per explants of stevia.
For root initiation, vigorous shoots of appropriate length were transplanted to five (0.00, 0.25, 0.50, 0.75, and 1.00) strengths of MS media without any plant growth hormones. The 0.50 MS media was able to produce roots from 68.00 and 95.33% shoots at 15 and 30 DACI, respectively. The highest (2.86 and 6.20) number of roots per shoot also confirmed 0.50 MS media at both 15 and 30 DACI, respectively. The 0.50 MS media was significantly effective in the regeneration of the highest (3.25 and 7.82 cm) length of roots at 15 and 30 DACI, respectively. In contrast, some authors have added auxin to the MS medium to increase the percentage of rooting of stevia shoots [76]. This study confirmed the findings of Ramírez-Mosqueda and Iglesias-Andreu (2016) [77], who mentioned that low concentrations of MS salts without PGRs contribute to in vitro rooting of stevia. The present investigation employed hormone-free MS media during the rooting stage to lower the cost of plant regeneration. Therefore, the method we have developed for stevia tissue culture is both efficient and cost-effective.
The only method to preserve the genetic homogeneity of a particular cultigen in a self-incompatible, obligatory out-crossing plant like stevia is by vegetative clonal replication, which has sparked a lot of tissue culture research. Given the considerable variation in SGs profiles reported across various stevia germplasm, ensuring genetic homogeneity is especially critical when the aim entails alteration of the SGs content [78,79]. According to Yadav et al., (2011) [2], the most useful extracts from stevia plants are those with higher rebaudioside A. Rebaudioside A is the most highly desirable SGs due to its pleasant taste as well as its organoleptic, physicochemical, and higher water solubility properties. These characteristics are attributable to the presence of more polar groups in rebaudioside A than in stevioside [79]. Rebaudioside A outperforms stevioside in terms of sweetness and flavor quality especially because stevioside is commonly associated with a bitter aftertaste [80]. The present study evaluates the potential of producing stevia with greater quantities of rebaudioside A in tissue culture as the source of a natural sweetener.
Our data show that the highest rebaudioside A content in the leaves of tissue-cultured plantlets was 6.53% (w/w) which is greater than the highest (3.80%) in the leaves of field-grown plants reported by Goyal et al., (2010) [81]. Richman et al., (2005) [26] showed that among the 12 UGT genes found in Stevia rebaudiana Bertoni, three of them, UGT85C2, UGT74G1, and UGT76G1 encode enzymes that play specialized roles in the production of rebaudioside A. We employed RT q-PCR for quantitative analysis of the expression levels of these three genes in five different nutrient levels of MS (0 to 1.00 MS) growth medium for comparison. The present investigation found that the stevia grown on 0.75 MS expressed the highest level of UGT85C2 (1.09-fold), and the expression level directly correlated with the stevioside content of stevia. The UGT74G1 was highly expressed (1.34-folds) on 0.50 MS, which also correlated with the stevioside content of stevia; finally the expression level of UGT76G1 was revealed as 1.16-folds in stevia grown on 0.25 MS and the expression level directly correlated with the rebaudioside A content of stevia leaves. Our findings areconsistent with the findings of Behroozi et al., (2017) [41] and Zhang et al., (2019) [6], which revealed the level of the biosynthetic pathway’s final product, rebaudioside A, increased as the transcript levels of the UGT76G1 increased. Previous research indicated that UGT85C2, and UGT76G1 transcriptional level is directly correlated with SGs content [24,82,83]. UGT85C2 acted as a rate-limiting enzyme aiding in providing more intermediate precursor, stevioside, for UGT76G1 to produce rebaudioside A at the final step of the biosynthesis of SGs [25]. To the best of our knowledge, this is the first report which analyzes the expression of all three key genes (UGT85C2, UGT74G1, and UGT76G1) involved in stevioside and rebaudioside A biosynthesis in stevia and associating with the specific metabolites (stevioside and rebaudioside A) being produced in plantlets derived from tissue culture.
Previously, Kahrizi and co-workers [46] investigated the expression of UGT74G1 and UGT76G1, and SGs accumulation in the leaves of stevia plantlets produced through direct in vitro propagation on different strengths of MS media. Their study revealed that lower strength of MS media was responsible for the reduced accumulation of SGs (stevioside and rebaudioside A), which is correlated with lower expression of UGT74G1 and UGT76G1. In contrast to their findings, our study observed a higher accumulation of stevioside along with higher expression of UGT74G1 at lower MS strength (0.50 MS), while the accumulation of rebaudioside A increased up to 6.53%, with a corresponding increase in UGT76G1 expression at a much lower strength of MS (0.25 MS). However, both studies consistently showed that enhanced production of stevioside and rebaudioside A in the stevia leaves of tissue-cultured plantlets directly correlated with the increased expression of the biosynthetic genes. Akbari et al., (2018) [84] revealed that different doses of nitrogen in growth media influence the growth and expression of UGT85C2, UGT74G1, and UGT76G1 genes in stevia in in vitro conditions. Therefore, evidence from our study and the other recent studies [46,85] suggests that the expression of SGs biosynthetic genes can be manipulated in in vitro conditions. Thus, the development of the commercial production of the high-value rebaudioside A can be achieved through growth media manipulation in tissue cultures in order to meet the increasing demands for natural sweeteners.

5. Conclusions

Selection of varieties with high rebaudioside A content for breeding programs of stevia has been a major focus in stevia cultivation and production. This study optimized the sterilization procedure for explants essential for successful plant tissue culture and hormonal combinations for callus, shoots as well as roots induction to increase the production of quality planting materials of stevia. It was shown that variation in the strength of the MS medium which is routinely used in plant tissue culture, has an effect on the accumulation of SGs (stevioside and rebaudioside A). The media strength affects the expression level of UGT76G1 responsible for the conversion of stevioside to the final product rebaudioside A and UGT85C2 encoding a rate-limiting enzyme for providing the precursor (steviol) for the synthesis of SGs in stevia. An increase in the expression of these UGTs resulted in a significant rise in their respective glycosides. The results obtained using in vitro regenerated plants confirmed that the expression of UGT76G1 can be a universal biomarker for monitoring the biosynthesis of rebaudioside A, the most desirable SGs in efforts to improve its production through growth media manipulation.

Author Contributions

A.K.G. and S.N.A.A. jointly developed the conceptual structure of the manuscript. A.K.G. was involved in the compilation of relevant literature, carrying out the research as a PhD project, and drafting the manuscript. S.N.A.A. as the main supervisor, provided critical feedback and edited the final manuscript. M.A.M.H. and P.E.M.W. served as co-supervisors and have read and agreed on the published version of the manuscript. All authors have read and agreed to the published version of the manuscript.

Funding

The National Agricultural Technology Program-Phase II Project, implemented by the Bangladesh Agricultural Research Council, Dhaka, Bangladesh (Grant no. 6282517) funded to conduct this research.

Institutional Review Board Statement

Not applicable.

Informed Consent Statement

Not applicable.

Data Availability Statement

Not applicable.

Acknowledgments

We thank the National Agricultural Technology Program-Phase II Project implemented by the Bangladesh Agricultural Research Council and Bangladesh Sugarcrop Research Institute (BSRI) for providing the fellowship to conduct research and we express gratitude to all faculty members and staff at the Institute of Plantation Studies and Department of Agriculture Technology, Faculty of Agriculture, Universiti Putra, Malaysia. We also express our gratitude to all of our lab mates for their kind motivation to conduct this research.

Conflicts of Interest

The authors declare no conflict of interest.

References

  1. Yadav, A.K.; Singh, S.; Dhyani, D.; Ahuja, P.S. A Review on the Improvement of Stevia [Stevia rebaudiana (Bertoni)]. Can. J. Plant Sci. 2011, 91, 1–27. [Google Scholar] [CrossRef]
  2. Lemus-Mondaca, R.; Vega-Gálvez, A.; Zura-Bravo, L.; Kong, A.H. Stevia rebaudiana Bertoni, Source of a High-Potency Natural Sweetener: A Comprehensive Review on the Biochemical, Nutritional and Functional Aspects. Food Chem. 2012, 132, 1121–1132. [Google Scholar] [CrossRef] [PubMed]
  3. Shivanna, N.; Naika, M.; Khanum, F.; Kaul, V.K. Antioxidant, Anti-Diabetic and Renal Protective Properties of Stevia rebaudiana. J. Diabetes Complicat. 2013, 27, 103–113. [Google Scholar] [CrossRef] [PubMed]
  4. Singh, G.; Singh, G.; Singh, P.; Parmar, R.; Paul, N.; Vashist, R.; Swarnkar, M.K.; Kumar, A.; Singh, S.; Singh, A.K.; et al. Molecular Dissection of Transcriptional Reprogramming of Steviol Glycosides Synthesis in Leaf Tissue during Developmental Phase Transitions in Stevia rebaudiana Bert. Sci. Rep. 2017, 7, 11835. [Google Scholar] [CrossRef]
  5. Noranida, W.; Mohd, W.; Ibrahim, N. The Growth and Yield of Stevia (Stevia rebaudiana Bertoni) Grown on Organically Amended Sandy Medium. Int. J. Sci. Adv. Technol. 2015, 5, 14–16. [Google Scholar]
  6. Zhang, S.-S.; Chen, H.; Xiao, J.-Y.; Liu, Q.; Xiao, R.-F.; Wu, W. Mutations in the Uridine Diphosphate Glucosyltransferase 76G1 Gene Result in Different Contents of the Major Steviol Glycosides in Stevia rebaudiana. Phytochemistry 2019, 162, 141–147. [Google Scholar] [CrossRef]
  7. Ceunen, S.; Geuns, J.M.C. Steviol Glycosides: Chemical Diversity, Metabolism, and Function. J. Nat. Prod. 2013, 76, 1201–1228. [Google Scholar] [CrossRef]
  8. Lemus-Mondaca, R.; Vega-Gálvez, A.; Rojas, P.; Stucken, K.; Delporte, C.; Valenzuela-Barra, G.; Jagus, R.J.; Agüero, M.V.; Pasten, A. Antioxidant, Antimicrobial and Anti-Inflammatory Potential of Stevia rebaudiana Leaves: Effect of Different Drying Methods. J. Appl. Res. Med. Aromat. Plants 2018, 11, 37–46. [Google Scholar] [CrossRef]
  9. Panagiotou, C.; Mihailidou, C.; Brauhli, G.; Katsarou, O.; Moutsatsou, P. Effect of Steviol, Steviol Glycosides and Stevia Extract on Glucocorticoid Receptor Signaling in Normal and Cancer Blood Cells. Mol. Cell. Endocrinol. 2018, 460, 189–199. [Google Scholar] [CrossRef]
  10. Hsu, Y.H.; Liu, J.C.; Kao, P.F.; Lee, C.N.; Chen, Y.J.; Hsieh, M.H.; Chan, P. Antihypertensive Effect of Stevioside in Different Strains of Hypertensive Rats. Chin. Med. J. 2002, 65, 1–6. [Google Scholar]
  11. Brijesh, K.; Kamath, M. Experimental Evaluation of Anti-Hyperglycemic and Hypolipidemic Effects of Stevia rebaudiana, Anacardium Occidentale on Wistar Rats. Int. J. Basic Clin. Pharmacol. 2016, 5, 2463–2467. [Google Scholar] [CrossRef]
  12. Chatsudthipong, V.; Muanprasat, C. Stevioside and Related Compounds: Therapeutic Benefits beyond Sweetness. Pharmacol. Ther. 2009, 121, 41–54. [Google Scholar] [CrossRef]
  13. Casas-Grajales, S.; Ramos-Tovar, E.; Chávez-Estrada, E.; Alvarez-Suarez, D.; Hernández-Aquino, E.; Reyes-Gordillo, K.; Cerda-García-Rojas, C.M.; Camacho, J.; Tsutsumi, V.; Lakshman, M.R.; et al. Antioxidant and Immunomodulatory Activity Induced by Stevioside in Liver Damage: In Vivo, in vitro and in Silico Assays. Life Sci. 2019, 224, 187–196. [Google Scholar] [CrossRef]
  14. Zaidan, U.H.; Mohamad Zen, N.I.; Amran, N.A.; Shamsi, S.; Gani, S.S.A. Biochemical Evaluation of Phenolic Compounds and Steviol Glycoside from Stevia rebaudiana Extracts Associated with in vitro Antidiabetic Potential. Biocatal. Agric. Biotechnol. 2019, 18, 101049. [Google Scholar] [CrossRef]
  15. Kurek, J.M.; Krejpcio, Z. The Functional and Health-Promoting Properties of Stevia rebaudiana Bertoni and Its Glycosides with Special Focus on the Antidiabetic Potential—A Review. J. Funct. Foods 2019, 61, 103465. [Google Scholar] [CrossRef]
  16. Alavala, S.; Sangaraju, R.; Nalban, N.; Sahu, B.D.; Jerald, M.K.; Kilari, E.K.; Sistla, R. Stevioside, a Diterpenoid Glycoside, Shows Anti-Inflammatory Property against Dextran Sulphate Sodium-Induced Ulcerative Colitis in Mice. Eur. J. Pharmacol. 2019, 855, 192–201. [Google Scholar] [CrossRef]
  17. Ahmad, J.; Khan, I.; Johnson, S.K.; Alam, I.; Din, Z.U. Effect of Incorporating Stevia and Moringa in Cookies on Postprandial Glycemia, Appetite, Palatability, and Gastrointestinal Well-Being. J. Am. Coll. Nutr. 2018, 37, 133–139. [Google Scholar] [CrossRef]
  18. Kazmi, A.; Khan, M.A.; Mohammad, S.; Ali, A.; Kamil, A.; Arif, M.; Ali, H. Elicitation Directed Growth and Production of Steviol Glycosides in the Adventitious Roots of Stevia rebaudiana Bertoni. Ind. Crops Prod. 2019, 139, 111530. [Google Scholar] [CrossRef]
  19. Samsulrizal, N.H.; Zainuddin, Z.; Noh, A.L.; Sundram, T.C. A Review of Approaches in Steviol Glycosides Synthesis. Int. J. Life Sci. Biotechnol. 2019, 2, 145–157. [Google Scholar] [CrossRef]
  20. Gregersen, S.; Jeppesen, P.B.; Holst, J.J.; Hermansen, K. Antihyperglycemic Effects of Stevioside in Type 2 Diabetic Subjects. Metabolism 2004, 53, 73–76. [Google Scholar] [CrossRef]
  21. Chen, J.; Jeppesen, P.B.; Abudula, R.; Dyrskog, S.E.U.; Colombo, M.; Hermansen, K. Stevioside Does Not Cause Increased Basal Insulin Secretion or β-Cell Desensitization as Does the Sulphonylurea, Glibenclamide: Studies In Vitro. Life Sci. 2006, 78, 1748–1753. [Google Scholar] [CrossRef]
  22. Jang, M.H.; Piao, X.L.; Kim, J.M.; Kwon, S.W.; Park, J.H. Inhibition of Cholinesterase and Amyloid-&bgr; Aggregation by Resveratrol Oligomers from Vitis amurensis. Phyther. Res. 2008, 22, 544–549. [Google Scholar] [CrossRef]
  23. Yadav, S.K.; Guleria, P. Steviol Glycosides from Stevia: Biosynthesis Pathway Review and Their Application in Foods and Medicine. Crit. Rev. Food Sci. Nutr. 2012, 52, 988–998. [Google Scholar] [CrossRef] [PubMed]
  24. Humphrey, T.V.; Richman, A.S.; Menassa, R.; Brandle, J.E. Spatial Organisation of Four Enzymes from Stevia rebaudiana That are Involved in Steviol Glycoside Synthesis. Plant Mol. Biol. 2006, 61, 47–62. [Google Scholar] [CrossRef]
  25. Brandle, J.E.; Telmer, P.G. Steviol Glycoside Biosynthesis. Phytochemistry 2007, 68, 1855–1863. [Google Scholar] [CrossRef]
  26. Richman, A.; Swanson, A.; Humphrey, T.; Chapman, R.; McGarvey, B.; Pocs, R.; Brandle, J. Functional Genomics Uncovers Three Glucosyltransferases Involved in the Synthesis of the Major Sweet Glucosides of Stevia rebaudiana. Plant J. 2005, 41, 56–67. [Google Scholar] [CrossRef]
  27. Yang, Y.-H.; Huang, S.-Z.; Han, Y.-L.; Yuan, H.-Y.; Gu, C.-S.; Zhao, Y.-H. Base Substitution Mutations in Uridinediphosphate-Dependent Glycosyltransferase 76G1 Gene of Stevia rebaudiana Causes the Low Levels of Rebaudioside A: Mutations in UGT76G1, A Key Gene of Steviol Glycosides Synthesis. Plant Physiol. Biochem. 2014, 80, 220–225. [Google Scholar] [CrossRef]
  28. Kazmi, A.; Khan, M.A.; Ali, H. Biotechnological Approaches for Production of Bioactive Secondary Metabolites in Nigella Sativa: An up-to-Date Review. Int. J. Second. Metab. 2019, 6, 172–195. [Google Scholar] [CrossRef]
  29. Khalil, S.A.; Zamir, R.; Ahmad, N. Selection of Suitable Propagation Method for Consistent Plantlets Production in Stevia rebaudiana (Bertoni). Saudi J. Biol. Sci. 2014, 21, 566–573. [Google Scholar] [CrossRef]
  30. Pande, S.S.; Gupta, P. Plant Tissue Culture of Stevia rebaudiana (Bertoni): A Review. J. Pharmacogn. Phytother. 2013, 5, 26–33. [Google Scholar] [CrossRef]
  31. Pratibha, G.; Satyawati, S.; Sanjay, S. Micropropagation of Stevia rebaudiana (Natural Sweetener) Using Kinetin for Steviol Glycoside Production. Res. J. Biotechnol. 2010, 5, 63–67. [Google Scholar]
  32. Golkar, P.; Moradi, M.; Garousi, G.A. Elicitation of Stevia Glycosides Using Salicylic Acid and Silver Nanoparticles Under Callus Culture. Sugar Tech 2019, 21, 569–577. [Google Scholar] [CrossRef]
  33. Idrees, M.; Sania, B.; Hafsa, B.; Kumari, S.; Khan, H.; Fazal, H.; Ahmad, I.; Akbar, F.; Ahmad, N.; Ali, S.; et al. Spectral Lights Trigger Biomass Accumulation and Production of Antioxidant Secondary Metabolites in Adventitious Root Cultures of Stevia rebaudiana (Bert.). Comptes Rendus Biol. 2018, 341, 334–342. [Google Scholar] [CrossRef]
  34. Lucho, S.R.; do Amaral, M.N.; Benitez, L.C.; Milech, C.; Kleinowski, A.M.; Bianchi, V.J.; Braga, E.J.B. Validation of Reference Genes for RT-qPCR Studies in Stevia rebaudiana in Response to Elicitor Agents. Physiol. Mol. Biol. Plant 2018, 24, 767–779. [Google Scholar] [CrossRef]
  35. Gupta, P.; Sharma, S.; Saxena, S. Effect of Salts (NaCl and Na2CO3) on Callus and Suspension Culture of Stevia rebaudiana for Steviol Glycoside Production. Appl. Biochem. Biotechnol. 2014, 172, 2894–2906. [Google Scholar] [CrossRef]
  36. Gupta, P.; Sharma, S.; Saxena, S. Biomass Yield and Steviol Glycoside Production in Callus and Suspension Culture of Stevia rebaudiana Treated with Proline and Polyethylene Glycol. Appl. Biochem. Biotechnol. 2015, 176, 863–874. [Google Scholar] [CrossRef]
  37. Kazmi, A.; Khan, M.A.; Mohammad, S.; Ali, A.; Ali, H. Biotechnological Production of Natural Calorie Free Steviol Glycosides in Stevia rebaudiana: An Update on Current Scenario. Curr. Biotechnol. 2019, 8, 70–84. [Google Scholar] [CrossRef]
  38. Khan, T.; Abbasi, B.H.; Khan, M.A.; Azeem, M. Production of Biomass and Useful Compounds through Elicitation in Adventitious Root Cultures of Fagonia indica. Ind. Crops Prod. 2017, 108, 451–457. [Google Scholar] [CrossRef]
  39. Ali, A.; Mohammad, S.; Khan, M.A.; Raja, N.I.; Arif, M.; Kamil, A.; Mashwani, Z.u.R. Silver Nanoparticles Elicited In Vitro Callus Cultures for Accumulation of Biomass and Secondary Metabolites in Caralluma tuberculata. Artif. Cells Nanomed. Biotechnol. 2019, 47, 715–724. [Google Scholar] [CrossRef]
  40. Ho, T.-T.; Lee, J.-D.; Jeong, C.-S.; Paek, K.-Y.; Park, S.-Y. Improvement of Biosynthesis and Accumulation of Bioactive Compounds by Elicitation in Adventitious Root Cultures of Polygonum multiflorum. Appl. Microbiol. Biotechnol. 2018, 102, 199–209. [Google Scholar] [CrossRef]
  41. Behroozi, P.; Baghizadeh, A.; Saei, A.; Kharazmi, S. Quantitative Analysis of Uridine Diphosphate Glycosyltransferase UGT85C2, UGT74G1 and UGT76G1 Genes Expression in Stevia rebaudiana under Different Irrigations. Russ. J. Plant Physiol. 2017, 64, 67–72. [Google Scholar] [CrossRef]
  42. Kahrizi, D.; Ghari, S.M.; Ghaheri, M.; Fallah, F.; Ghorbani, T.; Beheshti Ale Agha, A.; Kazemi, E.; Ansarypour, Z. Effect of KH2PO4 on Gene Expression, Morphological and Biochemical Characteristics of Stevia rebaudiana Bertoni under In Vitro Conditions. Cell. Mol. Biol. 2017, 63, 107–111. [Google Scholar] [CrossRef]
  43. Blinstrubien, A.; Burbulis, N.; Juškeviciute, N.; Vaitkeviciene, N.; Žukiene, R. Effect of Growth Regulators on Stevia rebaudiana Bertoni Callus Genesis and Influence of Auxin and Proline to Steviol Glycosides, Phenols, Flavonoids Accumulation, and Antioxidant Activity In Vitro. Molecules 2020, 25, 2759. [Google Scholar] [CrossRef]
  44. Depuydt, S.; Hardtke, C.S. Hormone Signalling Crosstalk in Plant Growth Regulation. Curr. Biol. 2011, 21, R365–R373. [Google Scholar] [CrossRef]
  45. Nakano, T.; Tanaka, S.; Ohtani, M.; Yamagami, A.; Takeno, S.; Hara, N.; Mori, A.; Nakano, A.; Hirose, S.; Himuro, Y.; et al. FPX Is a Novel Chemical Inducer That Promotes Callus Formation and Shoot Regeneration in Plants. Plant Cell Physiol. 2018, 59, 1555–1567. [Google Scholar] [CrossRef]
  46. Kahrizi, D.; Ghaheri, M.; Yari, Z.; Yari, K.; Bahraminejad, S. Investigation of different concentrations of MS media effects on gene expression and steviol glycosides accumulation in Stevia rebaudiana Bertoni. Cell. Mol. Biol. 2018, 51, 23–27. [Google Scholar] [CrossRef]
  47. Murashige, T.; Skoog, F. A Revised Medium for Rapid Growth and Bio Assays with Tobacco Tissue Cultures. Physiol. Plant 1962, 15, 474–497. [Google Scholar] [CrossRef]
  48. Bergs, D.; Burghoff, B.; Joehnck, M.; Martin, G.; Schembecker, G. Fast and Isocratic HPLC-Method for Steviol Glycosides Analysis from Stevia rebaudiana Leaves. J. Verbrauch. Leb. 2012, 7, 147–154. [Google Scholar] [CrossRef]
  49. Livak, K.J.; Schmittgen, T.D. Analysis of Relative Gene Expression Data Using Real-Time Quantitative PCR and the 2−ΔΔCT Method. Methods 2001, 25, 402–408. [Google Scholar] [CrossRef]
  50. Singh, V.; Tyagi, A.; Chauhan, P.K.; Kumari, P.; Kaushal, S. Identification and Prevention of Bacterial Contimination on Explant Used in Plant Tissue Culture Labs. Int. J. Pharm. Pharm. Sci. 2011, 3, 160–163. [Google Scholar]
  51. Halim, M.A.; Alam, M.F.; Rahman, M.H.; Hossain, M.B.; Uddin, M.B. Sterilization Process For In Vitro Regeneration Of Stevia (Stevia Rebundiana Bertoni). Int. J. Bus. Soc. Sci. Res. 2017, 4, 320–323. [Google Scholar]
  52. Urbi, Z.; Zainuddin, Z. Standardization of Surface Sterilization Protocol of Field Grown Stevia rebaudiana Prior to In Vitro Clonal Propagation. J. Teknol. 2015, 77, 141–146. [Google Scholar] [CrossRef]
  53. Hammond, R.; Buah, J.N.; Asare, P.A.; Acheampong, S. Optimizing Sterilization Condition for the Initiation of Sweet Potato (Ipomoea batatas) Culture In Vitro. Asian J. Biotechnol. 2014, 6, 25–37. [Google Scholar] [CrossRef]
  54. Mng’omba, S.A.; Sileshi, G.; Toit, E.S.d.; Akinnifesi, F.K. Efficacy and Utilization of Fungicides and Other Antibiotics for Aseptic Plant Cultures. Fungic. Plant Anim. Dis. 2012, 5, 245–254. [Google Scholar] [CrossRef]
  55. Sen, M.K.; Hena, M.A.; Jamal, M.; Nasrin, S. Sterilization Factors Affect Seed Germination and Proliferation of Achyranthes Aspera Cultured In Vitro. Environ. Exp. Biol. 2013, 2013, 119–123. [Google Scholar]
  56. Çölgeçen, H.; Koca, U.; Toker, G. Influence of Different Sterilization Methods on Callus Initiation and Production of Pigmented Callus in Arnebia Densif Ora Ledeb. Turk. J. Biol. 2011, 35, 513–520. [Google Scholar] [CrossRef]
  57. Khatun, M.M.; Tanny, T.; Razzak, A.M.; Alam, M.F.; Uddin, M.E.; Amin, R.; Yesmin, S. Standardization of In Vitro Sterilization Procedures for Micropropagation of Ginger (Zingiber Officinale Rosc.). Int. J. Appl. Biol. Pharm. Technol. 2016, 7, 131–138. [Google Scholar]
  58. Zand, V.; Salem-Milani, A.; Shahi, S.; Akhi, M.T.; Vazifekhah, S. Efficacy of Different Concentrations of Sodium Hypochlorite and Chlorhexidine in Disinfection of Contaminated Resilon Cones. Med. Oral Patol. Oral Cir. Bucal 2012, 17, 352–355. [Google Scholar] [CrossRef]
  59. Guruchandran, V.; Sasikumar, C. Organogenic Plant Regeneration via Callus Induction in Stevia rebaudiana Bert. Int. J. Curr. Microbiol. Appl. Sci. 2013, 2, 56–61. [Google Scholar]
  60. Singh, M.; Saharan, V.; Dayma, J.; Rajpurohit, D.; Sen, Y.; Sharma, A. In Vitro Propagation of Stevia rebaudiana (Bertoni): An Overview. Int. J. Curr. Microbiol. Appl. Sci. 2017, 6, 1010–1022. [Google Scholar] [CrossRef]
  61. Ahmad, N.; Fazal, H.; Zamir, R.; Khalil, S.A.; Abbasi, B.H. Callogenesis and Shoot Organogenesis from Flowers of Stevia rebaudiana (Bert.). Sugar Tech 2011, 13, 174–177. [Google Scholar] [CrossRef]
  62. Abdelmaksood, A.W.M.; Zavdetovna, K.L.; Arnoldovna, T.O. Effect of Different Plant Growth Regulators on the In Vitro Induction and Maintenance of Callus from Different Explants of Hyoscyamus muticus L. J. Appl. Environ. Biol. Sci. 2017, 7, 27–35. [Google Scholar]
  63. Wada, Y.; Tamura, T.; Kodama, T.; Yamaki, T.; Uchida, Y. Callus Cultures and Morphogenesis of Stevia rebaudiana Bertoni. J. Jpn. Oil Chem. Soc. 1981, 30, 215–219. [Google Scholar] [CrossRef]
  64. Wan, G.L.; Naeem, M.S.; Geng, X.X.; Xu, L.; Li, B.; Jilani, G.; Zhou, W.J. Optimization of Microspore Embryogenesis and Plant Regeneration Protocols for Brassica napus. Int. J. Agric. Biol. 2011, 13, 83–88. [Google Scholar]
  65. Huii, L.; Guoping, Z.; Guozheng, S.; Songlin, R.; Qiaojuan, F. Callus Induction and Plant Regeneration from Mature Seeds of Salvia splendens. Int. J. Agric. Biol. 2012, 14, 445–449. [Google Scholar]
  66. Ahmad, N.; Fazal, H.; Abbasi, B.H.; Rashid, M.; Mahmood, T.; Fatima, N. Efficient Regeneration and Antioxidant Potential in Regenerated Tissues of Piper nigrum L. Plant Cell. Tissue Organ. Cult. 2010, 102, 129–134. [Google Scholar] [CrossRef]
  67. Zuraida, A.R.; Nurl Shahnadz, A.H.; Harteeni, A.; Roowi, S.; Che Radziah, C.M.Z.; Sreeramanan, S. A Novel Approach for Rapid Micropropagation of Maspine Pineapple (Ananas comosus L.) Shoots Using Liquid Shake Culture System. Afr. J. Biotechnol. 2011, 10, 3859–3866. [Google Scholar] [CrossRef]
  68. Hamad, A.M.; Taha, R.M. Effect of Benzylaminopurine (BAP) on In Vitro Proliferation and Growth of Pineapple (Ananas Comosus L. Merr.) Cv. Smooth Cayenne. J. Appl. Sci. 2008, 8, 4180–4185. [Google Scholar] [CrossRef]
  69. Thiyagarajan, M.; Venkatachalam, P. Large Scale In Vitro Propagation of Stevia rebaudiana (Bert) for Commercial Application: Pharmaceutically Important and Antidiabetic Medicinal Herb. Ind. Crops Prod. 2012, 37, 111–117. [Google Scholar] [CrossRef]
  70. Casal, J.J. Photoreceptor Signaling Networks in Plant Responses to Shade. Annu. Rev. Plant Biol. 2013, 64, 403–427. [Google Scholar] [CrossRef]
  71. Kohnen, M.V.; Schmid-Siegert, E.; Trevisan, M.; Petrolati, L.A.; Sénéchal, F.; Müller-Moulé, P.; Maloof, J.; Xenarios, I.; Fankhauser, C. Neighbor Detection Induces Organ-Specific Transcriptomes, Revealing Patterns Underlying Hypocotyl-Specific Growth. Plant Cell 2016, 28, 2889–2904. [Google Scholar] [CrossRef]
  72. Michaud, O.; Fiorucci, A.S.; Xenarios, I.; Fankhauser, C. Local Auxin Production Underlies a Spatially Restricted Neighbor-Detection Response in Arabidopsis. Proc. Natl. Acad. Sci. USA 2017, 114, 7444–7449. [Google Scholar] [CrossRef]
  73. Iglesias, M.J.; Sellaro, R.; Zurbriggen, M.D.; Casal, J.J. Multiple Links between Shade Avoidance and Auxin Networks. J. Exp. Bot. 2018, 69, 213–228. [Google Scholar] [CrossRef]
  74. Dey, A.; Kundu, S.; Bandyopadhyay, A.; Bhattacharjee, A. Efficient Micropropagation and Chlorocholine Chloride Induced Stevioside Production of Stevia rebaudiana Bertoni. Comptes Rendus Biol. 2013, 336, 17–28. [Google Scholar] [CrossRef]
  75. Fakhrul, R.H.; Norrizah, J.S.; Jaapar, S.S.; Noor Anilizawatima, S. The Effect of Potassium Concentrations on the Growth and Development of Stevia rebaudiana (Bertoni) and Production of Stevioside and Rebaudioside A. Am. J. Sustain. Agric. 2014, 8, 42–51. [Google Scholar]
  76. Nower, A.A. In Vitro Propagation and Synthetic Seeds Production: An Efficient Methods for Stevia rebaudiana Bertoni. Sugar Tech 2014, 16, 100–108. [Google Scholar] [CrossRef]
  77. Ramírez-Mosqueda, M.A.; Iglesias-Andreu, L.G. Direct Organogenesis of Stevia rebaudiana Bertoni Using Thin Cell Layer (TCL) Method. Sugar Tech 2016, 18, 424–428. [Google Scholar] [CrossRef]
  78. Petit, E.; Jacques, A.; Daydé, J.; Vallejo, V.; Berger, M. UGT76G1 Polymorphism in Stevia rebaudiana: New Variants for Steviol Glycosides Conjugation. Plant Physiol. Biochem. 2019, 135, 563–569. [Google Scholar] [CrossRef]
  79. Šic Žlabur, J.; Voća, S.; Dobričević, N.; Ježek, D.; Bosiljkov, T.; Brnčić, M. Stevia rebaudiana Bertoni-A Review of Nutritional and Biochemical Properties of Natural Sweetener. Agric. Conspec. Sci. 2013, 78, 25–30. [Google Scholar]
  80. Chranioti, C.; Chanioti, S.; Tzia, C. Comparison of Spray, Freeze and Oven Drying as a Means of Reducing Bitter Aftertaste of Steviol Glycosides (Derived from Stevia rebaudiana Bertoni Plant)-Evaluation of the Final Products. Food Chem. 2016, 190, 1151–1158. [Google Scholar] [CrossRef]
  81. Goyal, S.K.; Samsher; Goyal, R.K. Stevia (Stevia rebaudiana) a Bio-Sweetener: A Review. Int. J. Food Sci. Nutr. 2010, 61, 1–10. [Google Scholar] [CrossRef] [PubMed]
  82. Mohamed, A.A.; Ceunen, S.; Geuns, J.M.; Ende, W.V.D.; De Ley, M. UDP-Dependent Glycosyltransferases Involved in the Biosynthesis of Steviol Glycosides. J. Plant Physiol. 2011, 168, 1136–1141. [Google Scholar] [CrossRef] [PubMed]
  83. Kumar, H.; Kaul, K.; Bajpai-Gupta, S.; Kaul, V.K.; Kumar, S. A Comprehensive Analysis of Fifteen Genes of Steviol Glycosides Biosynthesis Pathway in Stevia rebaudiana (Bertoni). Gene 2012, 492, 276–284. [Google Scholar] [CrossRef] [PubMed]
  84. Akbari, F.; Arminian, A.; Kahrizi, D.; Fazeli, A.; Ghaheri, M. Effect of Nitrogen Sources on Gene Expression of Stevia rebaudiana (Bertoni) under In VitroConditions. Cell. Mol. Biol. 2018, 64, 11–16. [Google Scholar] [CrossRef]
  85. Akbari, F.; Arminian, A.; Kahrizi, D.; Fazeli, A. Effect of Nitrogen Sources on Some Morphological Characteristics of In Vitro Stevia rebaudiana Bertoni. Cell. Mol. Biol. 2017, 63, 107–111. [Google Scholar] [CrossRef]
Figure 1. Effect of surface sterilization on explants of stevia by different concentrations of Clorox (0, 5, 10, 15, 20, and 30%) for different periods of time (5, 10, 15, and 20 min): (a) explant with fungal contamination; (b) explant with bacterial contamination; (c) non-contaminated explant; and (d) survived explant.
Agronomy 12 01957 g001
Figure 2. Induced calli from the explants of stevia at 30 DACI; (a) induced callus on MS media with 0.10 mg/L 2, 4-D and 0.10 mg/L zeatin; (b) induced callus on MS media with 0.50 mg/L 2, 4-D and 0.10 mg/L zeatin; (c) induced callus on MS media with 1.00 mg/L 2, 4-D and 0.10 mg/L zeatin; and (d) induced callus on MS media with 1.50 mg/L 2, 4-D and 0.10 mg/L zeatin.
Agronomy 12 01957 g002
Figure 3. Frequencies of callus induction during in vitro culture of stevia on MS media supplemented with different concentrations of 2,4-D and zeatin: (a) compact callus; (b) friable callus; (c) total callus; and (d) non-response of stevia explants. Bars denote the mean of three replications per treatment ± SE (standard error). Mean values with the same letters are not significantly different based on the Student’s t-test at p = 0.05.
Agronomy 12 01957 g003
Figure 4. Regenerated shoots of stevia from induced calli on MS media supplemented with different concentrations of BAP and NAA at 30 DACI: (a) regenerated shoots on MS media with 1.00 mg/L BAP and 1.00 mg/L NAA; (b) regenerated shoots on MS media with 5.00 mg/L BAP and 0.00 mg/L NAA; and (c) regenerated shoots on MS media with 10.00 mg/L BAP.
Agronomy 12 01957 g004
Figure 5. Shoot proliferation of stevia on MS media supplemented with different concentrations of BAP and NAA at 15 and 30 days after inoculation (DACI): (a) No. of shoots induced per callus; (b) Length of induced shoots; (c) No. of leaves per shoot; and (d) Percentage of shoot proliferation. Bars denote the mean of three replications per treatment ± SE (standard error). Mean values with the same letters are not significantly different based on the Student’s t-test at p = 0.05.
Agronomy 12 01957 g005
Figure 6. Regenerated roots from stevia shoot on different strengths of MS media at 30 DACI: (a) initiated roots on 0.25 MS media; (b) initiated roots on 0.50 MS media; and (c) initiated roots on 1.00 MS media.
Agronomy 12 01957 g006
Figure 7. Root initiation of stevia from shoot grown on different strengths of MS media at 15 and 30 days after inoculation (DACI): (a) No. of roots initiated per shoot; (b) length of induced roots; and (c) percentage of root production. Bars denote the mean of three replications per treatment ± SE (Standard Error). Mean values with the same letters are not significantly different based on the Student’s t-test at p = 0.05.
Agronomy 12 01957 g007
Figure 8. Stevioside and rebaudioside A content in the leaves of stevia rooted on different strengths (0.00, 0.25, 0.50, 0.75, and 1.00) of MS media. Bars denote the mean of three replications per treatment ± SE (standard error). Mean values with the same letters are not significantly different based on the Student’s t-test at p = 0.05.
Agronomy 12 01957 g008
Figure 9. Purified total RNAs isolated from stevia rooted on different strengths of MS (0.00, 0.25, 0.50, 0.75, and 1.00) media. The total RNAs analyzed by electrophoresis on 1.2% (w/v) agarose gel.
Agronomy 12 01957 g009
Figure 10. Expression levels of UGT76G1, UGT74G1, and UGT85C2 in stevia grown on 0.00, 0.25, 0.50, 0.75 and 1.00 strengths of MS media. The expression was normalized with three reference genes Actin (AF548026.1), Aquaporin (DQ269455.1), and Calmodulin (AF474074.1). Bars denote the mean of three biological replications per treatment ± SE (standard error). Mean values with the same letters are not significantly different based on the Student’s t-test at p = 0.05.
Agronomy 12 01957 g010
Table 1. Plant growth hormones added in MS media used for callus induction in stevia.
Treatment2,4-D (mg/L)Zeatin (mg/L)
T10.000.00
T20.100.10
T30.250.10
T40.500.10
T50.750.10
T61.000.10
T71.500.10
T82.000.10
Table 2. Plant growth hormones added in MS media used for shoot regeneration of stevia through in vitro culture.
TreatmentBAP (mg/L)NAA (mg/L)
S10.000.00
S21.000.00
S31.001.00
S42.500.00
S52.501.00
S65.000.00
S75.001.00
S810.000.00
S910.001.00
Table 3. Details of the designed primers used to detect the expression level of targeted and reference genes in RT q-PCR.
Name
(Accession No.)
Forward (F)/
Reverse (R)
Sequence (5′–3′)Amplicon Size (bp)Annealing Temperature (°C)
Actin (AF548026.1)FCTGAGAACTGAGGGCTAGGG18770.5
RAACCCAGCCTTGACCATTCC
Aquaporin (DQ269455.1)FGGAGCCGCCGTAATCTACAA8680
RGCAATCGCCGCACCAATAAA
Calmodulin (AF474074.1)FATCCGCTCACCGACGATCA14265
RTGCAGTTCAGCTTCTGTTGG
UGT76G1
(KM206772.1)
FCTGCCAATGCCACCGTTATT9452
RTCATAAACCGTCTGACGCAGG
UGT74G1
(AY345982.1)
FTTCCAGTGCTTCAACGGTGG12461
RGTGAAGACCCAACGTGCTTG
UGT85C2
(AY345978.1)
FCGTTCGATGAGTTGGAGCCT18161
RAGCCACTGGAAACACTCTGG
Table 4. Cycling parameters for RT q-PCR.
StepTemperatureDurationCycle (s)
Initial activation95 °C2 min.1
Denaturation95 °C05 s40
Annealing* 52–80 °C10 s
Extention72 °C15 s
Melt curve65–95 °C5 s for every increment of 0.5 °C
* the optimized annealing temperature for each targeted and reference gene was set accordingly.
Table 5. Effect of different concentrations of Clorox used as a surface sterilizing agent for different periods of time on bacterial contamination on stevia explants (%).
15 Days after Culture Initiation (DACI)30 Days after Culture Initiation (DACI)
Period of Time (Minute)Period of Time (Minute)
51015205101520
Concentration of Clorox (%)011.11 ± 5.56 abc16.67 ± 0.00 ab5.56 ± 5.56 bc5.56 ± 5.56 bc11.11 ± 5.56 bc16.67 ± 0.00 b5.56 ± 5.56 bc11.11 ± 5.56 bc
511.11 ± 5.56 abc0.00 ± 0.00 c0.00 ± 0.00 c0.00 ± 0.00 c11.11 ± 5.56 bc0.00 ± 0.00 c0.00 ± 0.00 c0.00 ± 0.00 c
1016.67 ± 9.62 ab0.00 ± 0.00 c0.00 ± 0.00 c0.00 ± 0.00 c16.67 ± 9.62 b0.00 ± 0.00 c0.00 ± 0.00 c0.00 ± 0.00 c
1516.67 ± 9.62 ab5.56 ± 5.56 bc0.00 ± 0.00 c0.00 ± 0.00 c16.67 ± 9.62 b5.56 ± 5.56 bc0.00 ± 0.00 c0.00 ± 0.00 c
200.00 ± 0.00 c22.23 ± 5.56 a0.00 ± 0.00 c0.00 ± 0.00 c0.00 ± 0.00 c38.89 ± 5.56 a0.00 ± 0.00 c0.00 ± 0.00 c
305.56 ± 5.56 bc0.00 ± 0.00 c0.00 ± 0.00 c0.00 ± 0.00 c5.56 ± 5.56 bc0.00 ± 0.00 c0.00 ± 0.00 c0.00 ± 0.00 c
Values denote the mean of three replications per treatment ± SE (standard error). Mean values with the same letters are not significantly different based on the Student’s t-test at p = 0.05.
Table 6. Effect of different concentrations of Clorox used as a surface sterilizing agent for different periods of time on fungal contamination on explants (%) of stevia.
15 Days after Culture Initiation (DACI)30 Days after Culture Initiation (DACI)
Period of Time (Minute)Period of Time (Minute)
51015205101520
Concentration of Clorox (%)055.56 ± 5.56 ab38.89 ± 5.55 bc55.57 ± 20.03 ab66.68 ± 9.63 a66.67 ± 9.62 a66.67 ± 0.00 a66.67 ± 9.62 a66.67 ± 9.62 a
566.68± 0.00 a16.67 ± 9.62 de5.56 ± 5.56 e27.78 ± 5.56 dc72.22 ± 5.55 a38.89 ± 14.70 b55.56 ± 5.56 de27.78 ± 5.55 bc
1038.89 ± 5.55 bc11.11 ± 5.56 de16.67 ± 9.62 de11.11 ± 5.56 de38.89 ± 5.56 b11.11 ± 5.56 cde22.22 ± 5.55 bcd11.11 ± 5.56 cde
1516.67 ± 9.62 de5.56 ± 5.56 e11.11 ± 5.56 de38.89 ± 11.11 bc22.22 ± 11.11 bcd5.56 ± 5.56 de22.22 ± 5.55 bcd38.89 ± 11.11 b
205.56 ± 5.56 e27.78 ± 5.56 dc0.00 ± 0.00 e5.56 ± 5.56 e11.11 ± 5.56 cde27.78 ± 5.55 bc11.11 ± 5.56 cde11.11 ± 5.56 cde
300.00 ± 0.00 e5.56 ± 5.56 e0.00 ± 0.00 e0.00 ± 0.00 e5.56 ± 5.56 de16.67 ± 9.62 cde0.00 ± 0.00 e0.00 ± 0.00 e
Values denote the mean of three replications per treatment ± SE (standard error). Mean values with the same letters are not significantly different based on the Student’s t-test at p = 0.05.
Table 7. Effect of different concentrations of Clorox used as a surface sterilizing agent for different periods of time on decontamination of stevia explants (%).
15 Days after Inoculation (DACI)30 Days after Inoculation (DACI)
Period of Time (Minute)Period of Time (Minute)
51015205101520
Concentration of Clorox (%)016.67 ± 0.00 cd27.78 ± 5.56 bc22.23 ± 5.56 bcd11.11 ± 5.56 cd5.56 ± 5.56 de0.00 ± 0.00 e11.11 ± 5.56 cde5.56 ± 5.56 de
55.56 ± 5.56 d50.01 ± 16.67 a11.11 ± 11.11 cd22.22 ± 14.70 bcd0.00 ± 0.00 e27.78 ± 5.55 bc22.22 ± 11.11 bcd16.67 ± 9.62 bcde
1016.67 ± 9.62 cd38.89 ± 5.55 ab5.56 ± 5.56 d5.56 ± 5.56 d22.22 ± 5.55 bcd0.00 ± 0.00 e16.67 ± 0.00 bcde5.56 ± 5.56 de
1516.67 ± 0.00 cd22.23 ± 5.56 bcd11.11 ± 5.56 cd16.67 ± 0.00 cd33.33 ± 9.62 b27.78 ± 5.55 bc11.11 ± 5.56 cde27.78 ± 5.55 bc
2027.78 ± 5.56 bc16.67 ± 0.00 cd50.01 ± 9.62 a11.11 ± 5.56 cd61.11 ± 5.56 a11.11 ± 5.56 cde72.23 ± 5.56 a27.78 ± 5.55 bc
305.56 ± 5.56 d11.11 ± 5.56 cd16.67 ± 9.62 cd11.11 ± 5.56 cd66.67 ± 9.62 a0.00 ± 0.00 e16.67 ± 9.62 bcde55.56 ± 5.56 a
Values denote the mean of three replications per treatment ± SE (standard error). Mean values with the same letters are not significantly different based on the Student’s t-test at p = 0.05.
Table 8. Effect of different concentrations of Clorox used as a surface sterilizing agent for different periods of time on the survivability of stevia explants (%).
15 Days after Inoculation (DACI)30 Days after Inoculation (DACI)
Period of Time (Minute)Period of Time (Minute)
51015205101520
Concentration of Clorox (%)016.67 ± 0.00 d16.67 ± 0.00 d16.67 ± 9.62 d16.67 ± 9.62 d16.67 ± 0.00 f16.67 ± 0.00 f16.67 ± 9.62 f16.67 ± 9.62 f
516.67 ± 9.62 d33.34 ± 9.62 cd83.34 ± 9.62 a50.01 ± 9.62 bc16.67 ± 9.62 f33.33 ± 9.62 ef72.22 ± 5.55 abc55.56 ± 5.56 cd
1027.78 ± 5.56 cd50.01 ± 9.62 bc77.79 ± 11.11 a83.35 ± 0.00 a22.23 ± 5.56 f88.89 ± 5.56 a61.11 ± 5.56 cd83.33 ± 0.00 ab
1550.00 ± 0.00 bc66.68 ± 9.63 ab77.79 ± 5.56 a44.45 ± 11.11 bc27.78 ± 5.55 ef61.11 ± 5.56 cd66.67 ± 9.62 bc27.78 ± 5.55 ef
2066.68 ± 9.63 ab33.34 ± 9.62 cd50.01 ± 9.62 bc83.34 ± 9.62 a27.78 ± 5.55 ef22.22 ± 5.55 f16.67 ± 0.00 f61.11 ± 5.56 cd
3088.90 ± 5.55 a83.35 ± 5.56 a83.34 ± 9.62 a88.90 ± 5.55 a22.22 ± 5.55 f83.33 ± 9.62 ab83.33 ± 9.62 ab44.44 ± 5.56 de
Values denote the mean of three replications per treatment ± SE (standard error). Mean values with the same letters are not significantly different based on the Student’s t-test at p = 0.05.
Table 9. Yield and purity of RNAs extracted from leaves of stevia.
RNABefore DNAse I TreatmentAfter DNAse I Treatment
Yield (ng/µL)Purity(A260/A280)Yield (ng/µL)Purity(A260/A280)
0.00 MS390.81.90139.52.03
0.25 MS395.31.91138.92.02
0.50 MS418.41.94159.02.03
0.75 MS311.51.89151.32.03
1.00 MS357.51.96178.32.04
Publisher’s Note: MDPI stays neutral with regard to jurisdictional claims in published maps and institutional affiliations.

