Article

Comparative Approach on the Effects of Soil Amendments and Controlled-Release Fertilizer Application on the Growth, Nutrient Uptake, Physiological Performance and Fruit Quality of Pepper (Capsicum annuum L.) Plants

by
Theocharis Chatzistathis
1,*,
Georgios Tsaniklidis
2,*,
Athanasios Papaioannou
3,
Anastasia Giannakoula
4 and
Athanasios Koukounaras
5
1
Hellenic Agricultural Organization (ELGO) DIMITRA, Institute of Soil and Water Resources, 57001 Thessaloniki, Greece
2
Hellenic Agricultural Organization (ELGO) DIMITRA, Institute of Olive Tree, Subtropical Plants and Viticulture, 71003 Heraklion, Greece
3
Department of Forestry and Natural Environment, Aristotle University of Thessaloniki, 54124 Thessaloniki, Greece
4
Department of Agriculture, International University of Greece, 54700 Thessaloniki, Greece
5
Department of Horticulture, Aristotle University, 57001 Thessaloniki, Greece
*
Authors to whom correspondence should be addressed.
Agronomy 2022, 12(8), 1935; https://doi.org/10.3390/agronomy12081935
Submission received: 15 July 2022 / Revised: 11 August 2022 / Accepted: 12 August 2022 / Published: 17 August 2022

Abstract

:
Under the economic pressure from the increase of fertilizers’ prices due to the recent energy crisis, more efforts are needed to search for alternative and cheaper sources of nutrients for crops. The purpose of our study was to compare the effects of manure and inorganic amendments’ application to those derived from the application of a controlled-release fertilizer (CRF) on the growth, nutrition, physiology and fruit quality of pepper plants. For that reason, zeolite (ZEO) and vermiculite (VER) were applied either independently, or in combination between them, or with manure (MAN), in a pot experiment. Insignificant differences for plant growth among the treatments were recorded, while higher foliar N, Mg and Mn concentrations were determined in CRF. In contrast, a significantly higher K uptake was recorded in the ZEO and VER + ZEO treatments; the highest leaf P levels (0.47 and 0.44% D.W.) were recorded in the MAN + VER and ZEO treatments, respectively. The optimum photosynthetic II (PSII) performance was observed in the VER and in the MAN + ZEO (based on the performance index—PI) treatments. The highest stomata opening was found in the CRF treatment, while the photosynthetic rate of pepper plants showed its maximum values both in the CRF and VER treatments. Finally, fruit quality (as indicated by total soluble solids, total phenols and antioxidant activity—FRAP) was significantly influenced by treatment. In conclusion, significant differences in the growth, nutrition and physiological performance of pepper plants between soil amendments’ application (inorganic, such as zeolite and vermiculite, and organic, such as manures) and CRF application were recorded; thus, these amendments should be more thoroughly studied in future projects to investigate if they could partially decrease high inorganic fertilization rates in Capsicum annuum L.

1. Introduction

Capsicum annuum L. is an economic important horticultural crop [1]. Pepper fruit is an excellent source of antioxidants, vitamins, proteins, carbohydrates, fats and phenolic compounds [2]. However, despite its economic importance, only limited published information exists in the literature for Capsicum annuum L. Gisbert-Mullor et al. (2020) [3] investigated the influence of grafting onto an appropriate rootstock on the control of deficit irrigation, while in the study of Karakurt et al. (2009) [4] the influence of foliar and soil application of humic acids on pepper yields was studied, with promising results. The foliar application of Ca was concluded to be a good agronomic practice, in order to mitigate the negative effects of saline water supply in sweet pepper plants [5].
Especially with regard to the fertilization needs of pepper crop, few data have been published on the effect of alternative sources of nutrients’ application on the nutrient uptake, physiological performance and fruit quality of pepper plants. Aminifard et al. (2012) [6] studied the effect of N fertilization on pepper plants under field conditions and found that a fertilization rate of 50 g N ha−1 led to the optimum yield and fruit quality at ripening. In a similar research work, the effect of different N forms and concentrations on sweet pepper flowering and fruit yield was studied [7]. According to the same authors, nutrient uptake influenced flower abortion and fruit set in sweet pepper plants [8], while in a third study of the same authors, they investigated the interaction between ammonium and K in sweet pepper plants [9]. In another study by Nabi et al. (2006) [10], the B nutrition of four sweet pepper cultivars grown in a B-deficient soil was investigated, while the effects of foliar spray of different Fe sources on pepper plants were also studied [11]. Regarding the impact of organic fertilization on Capsicum annuum L. crop, the influence of different compost rates (0, 5, 10 and 15 ton ha−1) in sweet pepper plants was investigated, and it was found that compost had a strong impact on fruit quality and antioxidant components under field conditions [12]. The study of Diaz-Perez et al. (2021) [13] focused on the compost (made from a mix of chicken litter, yard trimmings, cull vegetables, peanut hay, cotton gin trash, clay and cured compost) effects at the transplant stage on the growth, nutrition and yields of bell pepper plants; they concluded that compost application at 10 t per ha before planting resulted in an increase in soil organic matter, as well as in foliar nutrient concentrations [13]. Singh and Rathore (2021) [14] studied the effects of fertilization with textile effluent on the germination, growth and some metabolites of Capsicum annuum L. cultivars, and they concluded that it increased plant biomass, while it could also function as nutrient additive for chilli cultivars.
As it is clear from all the above-mentioned studies, no published comparative data exist between inorganic (conventional) fertilization and other sources of nutrient application (e.g., organic and/or inorganic soil amendments, such as manures, zeolite, etc.) in pepper crop; in addition, whether such kind of soil amendments could partially substitute chemical fertilizers’ application for decreasing high fertilization rates has not been investigated. The unique exception was the study of Assimakopoulou et al. (2020) [15], who investigated the effects of combined olive mill wastewaters (three levels: 0, 2.5 and 5%) and natural zeolite (three levels: 0, 2.5 and 5%) application on the biomass, yields and nutrition of pepper plants; however, their study was not comparative (as our study was) between inorganic (conventional) fertilization and nutrient supply of alternative origin. Our research was based on the premise that alternative (nonconventional) sources of nutrient application (amendments, such as goat manure, zeolite, vermiculite, etc.) could sufficiently satisfy pepper nutritional needs (this was realized via a foliar analysis of nutrients) and could improve K uptake for plants and soil organic C. Furthermore, it was hypothesized that the soil application of suitable inorganic and organic amendments could significantly influence nutrient uptake, physiology and fruit quality.
Thus, the aims of our study were: (a) to compare the influence of inorganic (zeolite, vermiculite) and organic amendments (goat manure) with that of CRF application on the soil fertility, growth, nutrition, physiological performance and fruit quality of Capsicum annuum L. plants and (b) to evaluate the efficiency and suitability of alternative sources of nutrients (amendments) to satisfy the nutritional needs of pepper plants, via a comparative approach with a conventional inorganic CRF fertilizer. For the needs of the study, the cv. Bounty F1-Lenor was chosen, which is one of the most important and productive pepper hybrids, suitable either for field cultivation or for crop growth under greenhouse environment.

2. Materials and Methods

2.1. Plant Material, Soil Sampling and Treatments

Capsicum annuum L. plants of the cv. Bounty F1-Lenor, approximately 12–15 cm in height, were grown outdoors, in 5 L pots, for 140 days (from the 4th of May until the 21st of September), on a soil substrate from parent material gneiss. Pots were filled with soil collected from the region of Vasilika (40°28′48.0864″, 23°8′18.492″ N/E), close to the city of Thessaloniki, Macedonia, northern Greece. Most of this region is traditionally occupied with vegetable crops and the initial soil pH (6.52) was close to the optimum one for vegetable crops. However, organic matter, exchangeable K levels, as well NO3 and Olsen P concentrations were very low (0.8%, 65 mg kg−1, 2.16 mg kg−1 and 1.44 mg kg−1, respectively) compared to the optimum ones (they should be >2%, >100 mg kg−1, 20–40 mg kg−1 and 15–25 mg kg−1, respectively) for pepper plants’ growth; thus, the crucial matter for our study was to find out suitable soil amendments (i) firstly aiming to improve K and organic C levels, as well as (ii) to boost the low N and P concentrations in this vegetable growing zone. Samples were collected from the upper 30 cm of the soil profile, since most of the root system of vegetable crops grows in this layer. After soil samples were received (before filling the pots), they were carefully mixed, in order to achieve homogenization. The pepper plants were randomized (based on their initial height) and divided into 6 similar groups, corresponding to each one of the 6 treatments described below.
The treatments of the experiment were the following: (i) soil/ver (“Vermiterra medium” exfoliated vermiculite for horticultural uses, provided by the company NORDIA A.E., Greece) = 80:20; (ii) soil/zeo (“Zeoterra”, powder size 0.8–2.5 mm, provided by the company NORDIA A.E., Greece) = 80:20; (iii) soil: zeo/ver = 80:10:10; (iv) no mixture of soil with amendments, only the application of controlled release fertilizer (CRF); (v) soil/ man/ver = 80:5:15; (vi) soil/man/zeo = 80:5:15. The relations of mixtures between soil and amendments were expressed in % w/v. In the 4th treatment, a total quantity of 10 g of CRF per pot (during the whole experimental period) was applied, in two doses of 5 g each: the first was applied in June and the second in July.
The exact composition of the CRF was the following: 21% total N (11% NH4-N and 10% NO3-N), 5% P2O5, 10% K2O, 3% MgO, 6% total S, 0.02% total B, 0.3% total Fe and 0.02% total Zn. The nutritional composition of the goat manure was the following: N—2.80%; P—0.13%; K—2.54%; Ca—1.15%; Mg—1.10%; Na—0.10%; Fe—1927 mg kg−1; Mn—367 mg kg−1; Zn—81 mg kg−1; and Cu—15 mg kg−1. The fertilizer was solid, and it was slightly incorporated into soil. The choice of the ratios 80:20 or 80:10:10 between the soil substrate and the inorganic amendments was based on previously published data [16,17]. The chemical properties of zeolite (“Zeoterra”, powder size 0.8–2.5 mm) and vermiculite (“Vermiterra medium”), respectively, were the following: pH, 7.28 and 8.83; organic matter, 0.00 and 0.18%; NO3-N, 9.36 and 6.58 mg kg−1; P, 1.87 and 2.53%; K, 14,984 and 445 mg kg−1; Ca, 16,050 and 1727 mg kg−1; Mg, 922 and 146 mg kg−1; Fe, 0.57 and 14.44 mg kg−1; Mn, 1.12 and 1.92 mg kg−1; Zn, 0.24 and 0.33 mg kg−1; Cu, 0.05 and 0.47 mg kg−1.
In the present experiment, six replications were set up for each treatment, leading to a total number of 36 plants. During the experiment, all the plants were irrigated daily (with an automated spray irrigation system) with high-quality water, to achieve a soil moisture of approximately 70% of the water-holding capacity. In addition, during the whole experimental period, the plants were sprayed 5 times with Cu, in order to combat Alternaria solani and Alternaria alternata.

2.2. Chemical Analyses of Soil Samples and Mixtures

After representative soil samples were received from the field, they were mixed with the amendments (as described above, in the 6 treatments), and a quantity of approximately 1–1.5 kg from each mixture treatment (used as plant substrate) was transferred to the laboratory for chemical analyses, to determine the fertility of the soil mixtures. Before analyses, soil mixtures were dried at room temperature, their stones were removed, and afterwards, they were sieved to pass a 10-mesh screen. Chemical analyses included: pH, particle size analysis, organic matter, NO3-N, NH4-N, available P, exchangeable cations (K, Ca and Mg) and extractable micronutrients (Fe, Mn, Zn and Cu). These parameters were determined as follows: pH in a soil-distilled water paste (1:1) [18], the particle size analysis according to the Bouyoucos method [19] and organic matter with the potassium dichromate method [20]; the NO3-N concentration was determined according the VCl3/Griess method [21], while extractable NH4-N was measured after extracting 2.5 g of soil with 15 mL of 2 M KCl for 1 h [22]. The available P was determined according to the Olsen method [23], the exchangeable cations (Ca, Mg and K) after extraction with ammonium acetate [24], and finally the extractable micronutrients (Fe, Mn, Zn and Cu) were determined with the DTPA (pH 7.3) method [25]. The concentrations of K, Ca, Mg, Fe, Mn, Zn and Cu were measured by ICP (OPTIMA 2100 DV optical emission spectrometer, Perkin Elmer, Waltham, MA, USA) [26].

2.3. Plant and Fruit Growth

At the end of the experiment, the length of the plants’ main shoot was measured; in addition, the elongation rate (cm/day) of the main shoot of pepper plants during the experimentation period was also calculated. After all the plants had been harvested, the leaves were separated from the stem, and the root system from the other plant parts. Before being washed, the fresh weights (F.W.) of all the plant tissues were measured. By the addition of the F.W. of all the plant parts, the total plant fresh weight was calculated. After all the plant tissues had been carefully washed (once with tap and twice with distilled water), they were dried at 75 °C for 48 h. Then, the dry weights (D.W.) of the root, stem and leaves were determined. By the addition of the D.W. of all the plant tissues, total plant dry weight was calculated. Furthermore, the ratio (leaves + stem)/root was also determined. Finally, the mean fresh fruit weights among the treatments were determined at the end of the experiment.

2.4. Tissue Nutrient Analyses, Total Plant Nutrient Content and Nutrient Use Efficiency

At the end of the experiment, after the plants had been harvested and the tissues separated, washed and dried, they were ground to a fine powder to pass a 30-mesh screen. A portion of 0.5 g of fine powder of each sample was dry-ashed in a muffle furnace, at 515 °C, for 5 h. Then, the ash was dissolved with 3 mL of 6 N HCl and diluted with double-distilled water up to 50 mL. The concentrations of P, K, Ca, Mg, Fe, Mn, Zn and Cu were determined by ICP (OPTIMA 2100 DV optical emission spectrometer, Perkin Elmer, Waltham, MA, USA) [26]. Nitrogen was determined by the Kjeldahl method [27]. Macronutrient concentrations were expressed in % D.W., while those of micronutrients (Fe, Mn, Zn and Cu) in mg kg−1. Multiplying the concentration of each nutrient in each plant tissue by the corresponding D.W., the content (absolute quantity) of each nutrient in each plant part was determined at the end of the experiment. By adding the nutrient contents of the different plant parts, the total plant nutrient content (i.e., the total nutrient uptake) was calculated. With regard to the determination of the nutrient concentrations in fruits, they were first crushed and dried at 75 °C for 24 h, then they were dry-ashed at 515 °C for 5 h, and the concentrations were calculated according to the methodology described above. Finally, the nutrient use efficiency was calculated as the ratio of total plant biomass (D.W.)/mg of macronutrient (or μg of micronutrient), taken up by the plants, according to Chapin and Van Cleve (1991) [28].

2.5. Chlorophyll Fluorescence and Gas Exchange Measurements

At the end of the experiment, the following chlorophyll fluorescence parameters were determined: Fv/Fm, the maximum quantum yield of primary photochemistry; F0, the minimum fluorescence; Fm, the maximum fluorescence; Fv = Fm − F0, the variable fluorescence; and the performance index (PI), which reflects the functionality of both photosystems I and II and provides a quantitative information on the current state of plant performance under stress conditions [29]. All these parameters were determined on the youngest, fully expanded, mature leaves (from the upper part of the main shoot) of pepper plants, by the PAM-2000 fluorometer (Heinz Walz GmbH, Effeltrich, Germany), after leaf preconditioning under dark conditions, for 20 min [30].
For the gas exchange measurements (i.e., net photosynthetic rate, transpiration rate, stomatal conductance, intercellular CO2 concentration), the LC PRO portable gas exchange measuring system (ADC Bioscientific Ltd., Hoddesdon, UK) was used. The measurements were carried out on the youngest, mature, fully expanded leaves. Measurements were performed in the time period from 10:00 to 12:00 a.m., at natural full light intensity. Finally, the intrinsic water use efficiency (WUEi) was determined as the net photosynthetic rate per stomatal conductance, since it provided information on how efficiently water was used at the plant level.

2.6. Total Soluble Solids, Total Phenolics and FRAP

At harvest, the fruits of each replication were macerated in a blender for the compositional analysis. The soluble solids content (SSC) was measured in the juice of the blended material, using an Atago PR-1 refractometer (Atago Co., Ltd., Tokyo, Japan). The total soluble phenols were determined with the Folin–Ciocalteu reagent [31]. The total antioxidant activity was determined by a FRAP assay [32].

2.7. qPCR Expression Analysis

Total RNA was isolated from each sample using the RNeasy extraction kit (Qiagen, Hilden Germany). The quantity and quality of total RNA were assessed by spectrophotometric and electrophoretic analyses, measuring both the absorbance at 260 nm and the absorbance ratio of 260/280 nm in Nanodrop (Thermo, Wilmington, NC, USA), as well as, by 1.5% w/v agarose-gel electrophoresis. The elimination of total DNA and the cDNA synthesis were performed with RNAse free DNaseI (Takara, Otsu Shiga, Japan) and AffinityScript™ Multi Temperature Reverse Transcriptase (Stratagene, Santa Clara, CA, USA), respectively, according to the manufacturer’s instructions. The complete DNA removal was confirmed with primers designed against Ubiquitin (UBQ—NCBI accession number: AY486137.1), while Capsicum annuum genomic DNA was used as a positive control. UBQ was also used for the normalization of the first-strand cDNA. Gene specific primers for paper genes coding for sugar transporters, UGP-ase (UDP-glucose pyrophosphorylase) and SPS (Sucrose phosphate synthase), and UBQ genes were designed using Beacon designer v 7.01. Quantitative real-time PCR reactions were performed on a MX-3005P system (Stratagene, Santa Clara, CA, USA) using Kapa Fast Universal 2X qPCR Master Mix (Kapa, Woburn, MA, USA). The expression levels of Capsicum annuum UBQ were used for normalization. The relative quantification of gene expression was performed, as previously described by Pappi et al. (2021) [33]. For all samples, qPCR reactions were performed in triplicates. The UBQ gene was used as a reference gene, and the actin gene was used for the verification of the results.

2.8. Statistical Analysis

The experimental design consisted of a 6 × 1 completely randomized factorial, including 6 treatments and one pepper cultivar (Bounty F1-Lenor). Six replicates per treatment were included, leading to 36 experimental plants in total. The data were analyzed by the SPSS statistical program (ONE-WAY ANOVA); for the comparison of the means among the treatments, the Duncan’s multiple range test, for p ≤ 0.05, was used.
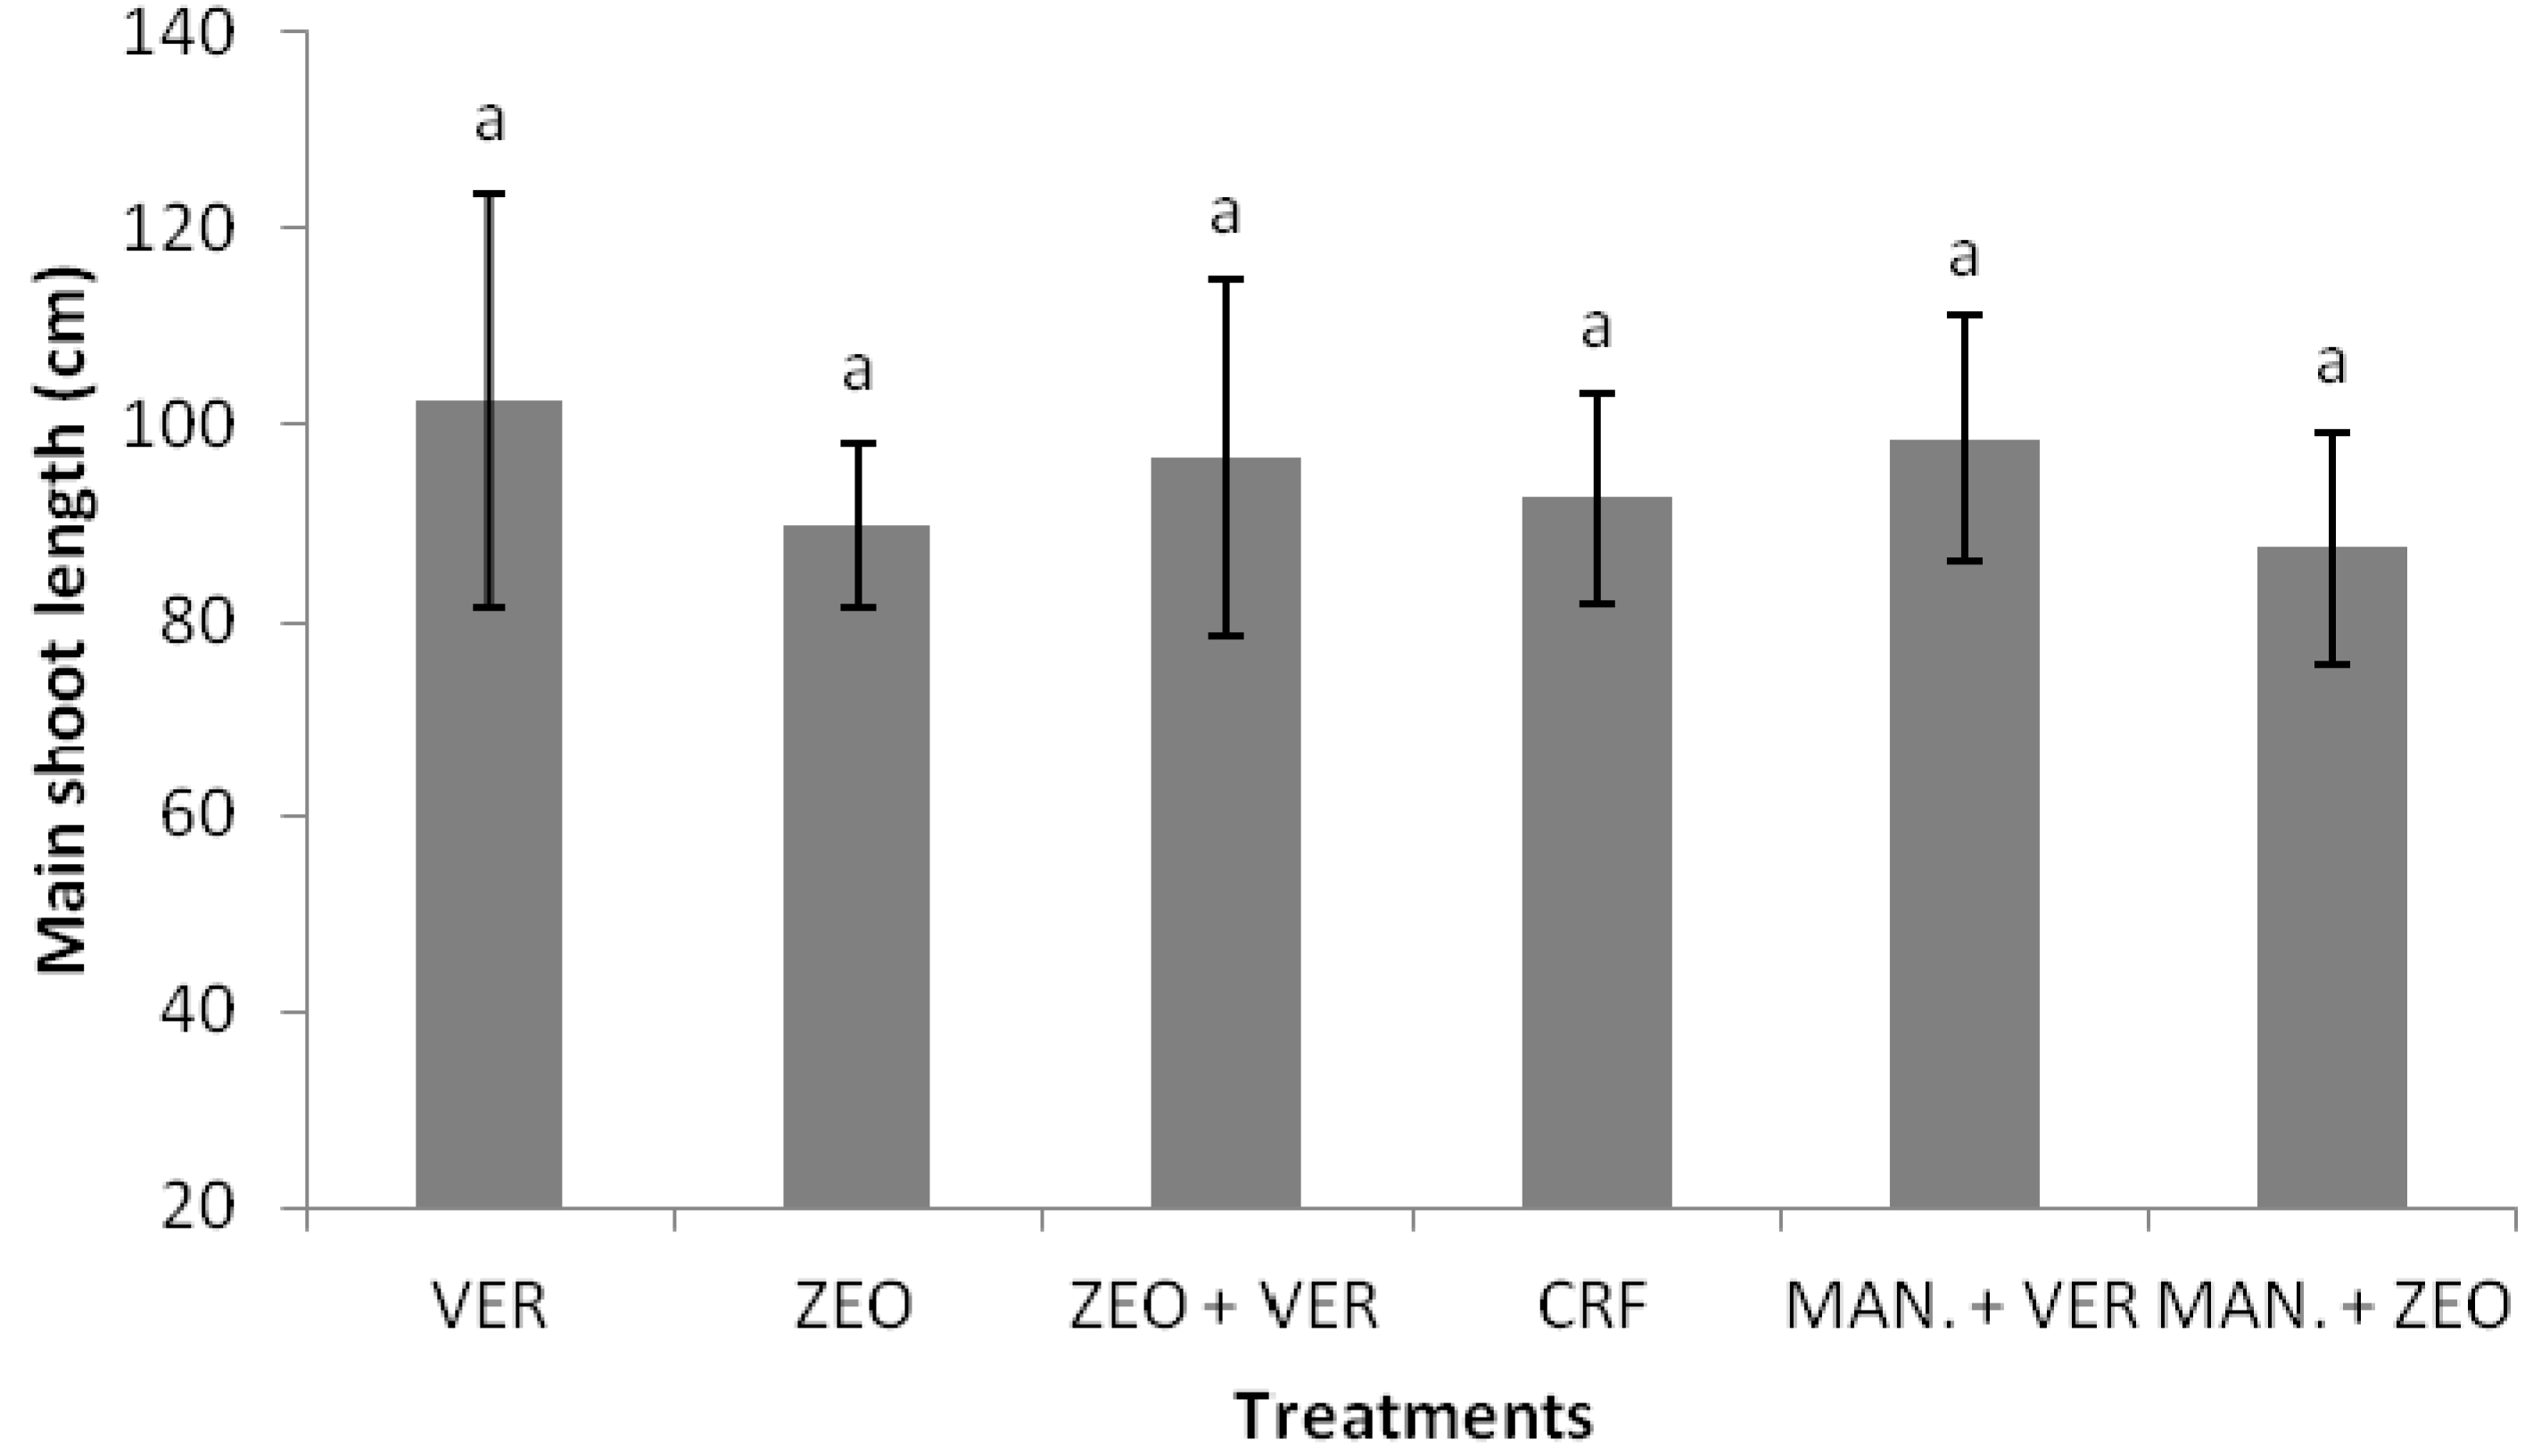
3. Results

3.1. Initial Soil Properties and Fertility of Soil Mixtures with Amendments

Before the application of the soil amendments, the initial (before the beginning of the experiment) soil fertility was determined; more specifically, the soil texture was sandy loam (SL), the pH was 6.52, the percentage of organic matter was 0.8% and the nutrient concentrations were: NO3-N, 2.16 mg kg−1; P (Olsen), 1.44 mg kg−1; K, 65 mg kg−1; Ca, 1711 mg kg−1; Mg, 392 mg kg−1; Fe, 27 mg kg−1; Zn, 0.26 mg kg−1; Mn, 36 mg kg−1; and Cu: 2.8 mg kg−1 (data not shown). After the application of inorganic amendments (zeolite, vermiculite) and goat manure, the pH and soil texture were not affected, while the organic matter, NO3-N, P and Zn concentrations were much higher in the MAN treatments (i.e., in MAN + VER and MAN + ZEO), compared to the other ones. Particularly, the NO3-N, Olsen P and Zn concentrations increased by approximately 28–48 times, 15–18 times, and 4–5.5 times, respectively, after manure application, i.e., in the MAN + VER and MAN + ZEO treatments. Organic matter was increased from 0.8 mg kg−1, in the initial (untreated) soil, to 2.73% and 1.91% in the MAN treatments (data not shown). Similarly for K, its highest concentration was found in the MAN + ZEO treatment (2433 mg kg−1), followed by that of the ZEO treatment (1613 mg kg−1) [16], an impressive boosting, compared to the initial concentration of 65 mg kg−1 in the untreated soil.

3.2. Plant Growth

Results showed that the total plant biomass varied from 45.80 to 65.73 g (Table 1), the main shoot length from approximately 90 cm to slightly more than 100 cm (Figure 1) and the mean fruit weight varied from approximately 25 g to slightly more than 30 g (Figure 2). For the above parameters, insignificant differences were found; however, the elongation rate of the main shoot (cm/day) showed significant differences among the treatments (Table 2).

3.3. Tissue Nutrient Concentrations, Total Plant Nutrient Content and Nutrient Use Efficiency

Foliar N was significantly higher in the CRF-treated plants (3.84% D.W.), while significant differences were also recorded among the VER treatment (2.73% D.W.) and the other four treatments (Table 3). The highest leaf P concentrations were found in the MAN + VER and ZEO treatments (0.47% D.W. and 0.44% D.W., respectively), which were also significantly higher than those determined in the VER, VER + ZEO and MAN + ZEO treatments. Similar and significantly higher K concentrations were recorded in the leaves of the ZEO and VER + ZEO pepper plants (4.51% D.W. and 5.10% D.W.), compared to the other treatments (Table 3). As for N, the highest foliar Mg concentration was determined in the CRF plants (1.12% D.W.), since it was approximately two times higher than the concentrations found in the ZEO-, (VER + ZEO)- and (MAN + ZEO)-treated plants (Table 3). Significantly higher foliar Fe concentrations were determined with the VER and CRF treatments, while approximately 2.5–3 times higher Mn concentrations were found in the CRF-treated plants (226 mg kg−1). Finally, a significantly higher leaf Zn concentration (62 mg kg−1) was recorded in the VER-treated plants, compared to those treated with MAN + VER (42 mg kg−1) (Table 3).
Significant differences among the treatments were also recorded in the stem and root nutrient concentrations (data not shown). The total plant N content was significantly higher in the CRF-treated plants (1034 mg), while the highest content for P was determined with the MAN + VER treatment (201 mg) (Table 4). A significantly higher total plant K content was recorded with the MAN + ZEO treatment (1443 mg), compared to the CRF (520 mg) and MAN + VER (922 mg) treatments, while a significantly lower Mg content was determined in the ZEO and VER + ZEO treatments, compared to all other treatments (Table 4). Finally, the highest contents for Fe and Mn were found in the (VER + ZEO)- and CRF-treated plants, respectively (39 mg and 4.55 mg, respectively) (Table 4). As in the leaves, the highest fruit N and K concentrations were determined in the CRF and ZEO treatments, respectively, while, in contrast to the foliar results, the maximum fruit P concentration was recorded in the CRF-treated plants (0.86% D.W.). Finally, a significantly higher fruit Fe concentration was found in the (VER + ZEO)-treated plants (62 mg kg−1), compared to that found with the VER, ZEO, MAN + VER and MAN + ZEO treatments (Table 5).
The lowest N use efficiency (NUE) was recorded in the CRF-treated plants, while for the lowest PUE value was determined in (MAN + VER)-treated plants; in contrast to NUE, a significantly higher KUE was found in CRF-treated plants (Table 6). The highest use efficiencies for Ca and Mg were recorded in ZEO-treated plants, while a significantly higher FeUE was found with the VER and MAN + ZEO treatments, compared to the ZEO, VER + ZEO and CRF treatments; finally, significantly higher values for MnUE were recorded in the VER- and (MAN + VER)-treated plants, compared to those treated with ZEO, VER + ZEO and CRF (Table 6).

3.4. Chlorophyll Fluorescence and Gas Exchange Measurements

Figure 3 shows the data for the maximum efficiency of PSII photochemistry (Fv/Fm), as well as for the efficiency of the water-splitting complex on the donor side of PSII (Fv/F0) and the performance index (PI), all describing the yield of photosystem II. The highest values for the ratios Fv/Fm and Fv/F0 were found in VER-treated plants (Figure 3A,B), while for PI, the highest values were recorded both in VER- and (MAN + ZEO)-treated plants (these values were statistically insignificant between the two treatments) (Figure 3C).
The photosynthetic rate of pepper plants was significantly higher in the VER- and CRF-treated plants (Figure 4A), while the highest stomatal conductance value was recorded in CRF-treated plants; between the CRF and VER treatments, a significant difference in stomata opening was found, as also happened between the CRF and ZEO and ZEO + VER and MAN + VER treatments (Figure 4B). As for the stomatal conductance, the transpiration rate was significantly higher in the CRF- and (MAN + ZEO)-treated plants (Figure 4C). With regard to the intercellular CO2 concentration, insignificant differences among the treatments were observed (Figure 4D), while the intrinsic water use efficiency (WUEi) was significantly higher in the VER- and (MAN + VER)-treated plants, compared to those treated with ZEO and CRF (Figure 4E).

3.5. Total Soluble Solids, Total Phenolics and FRAP

In Figure 5 are presented the total soluble solids, the total phenols and the antioxidant capacity (FRAP) of pepper fruits among the treatments. As it is clear from that figure, the highest levels of total soluble solids were recorded in the CRF and MAN + ZEO treatments, which were significantly higher than all the other ones (Figure 5A). In contrast, the total phenols’ contents were significantly higher in the (ZEO + VER)- and VER-treated plants (Figure 5B). Partially similar are the data for FRAP, which were significantly higher in the ZEO + VER, ZEO and CRF treatments, compared to the VER and MAN + ZEO treatments (Figure 5C).

3.6. Gene Expression

Gene transcript accumulation peaked for all genes at the third and fifth treatment (ZEO + VER and MAN + VER, respectively). Insignificant differences were found among the other treatments (Figure 6A–E).

4. Discussion

Plant growth (as indicated by total plant biomass and main shoot length) did not significantly differ among CRF and the other treatments (Table 1; Figure 1). This in contrast to the results of Chatzistathis et al. (2020) [
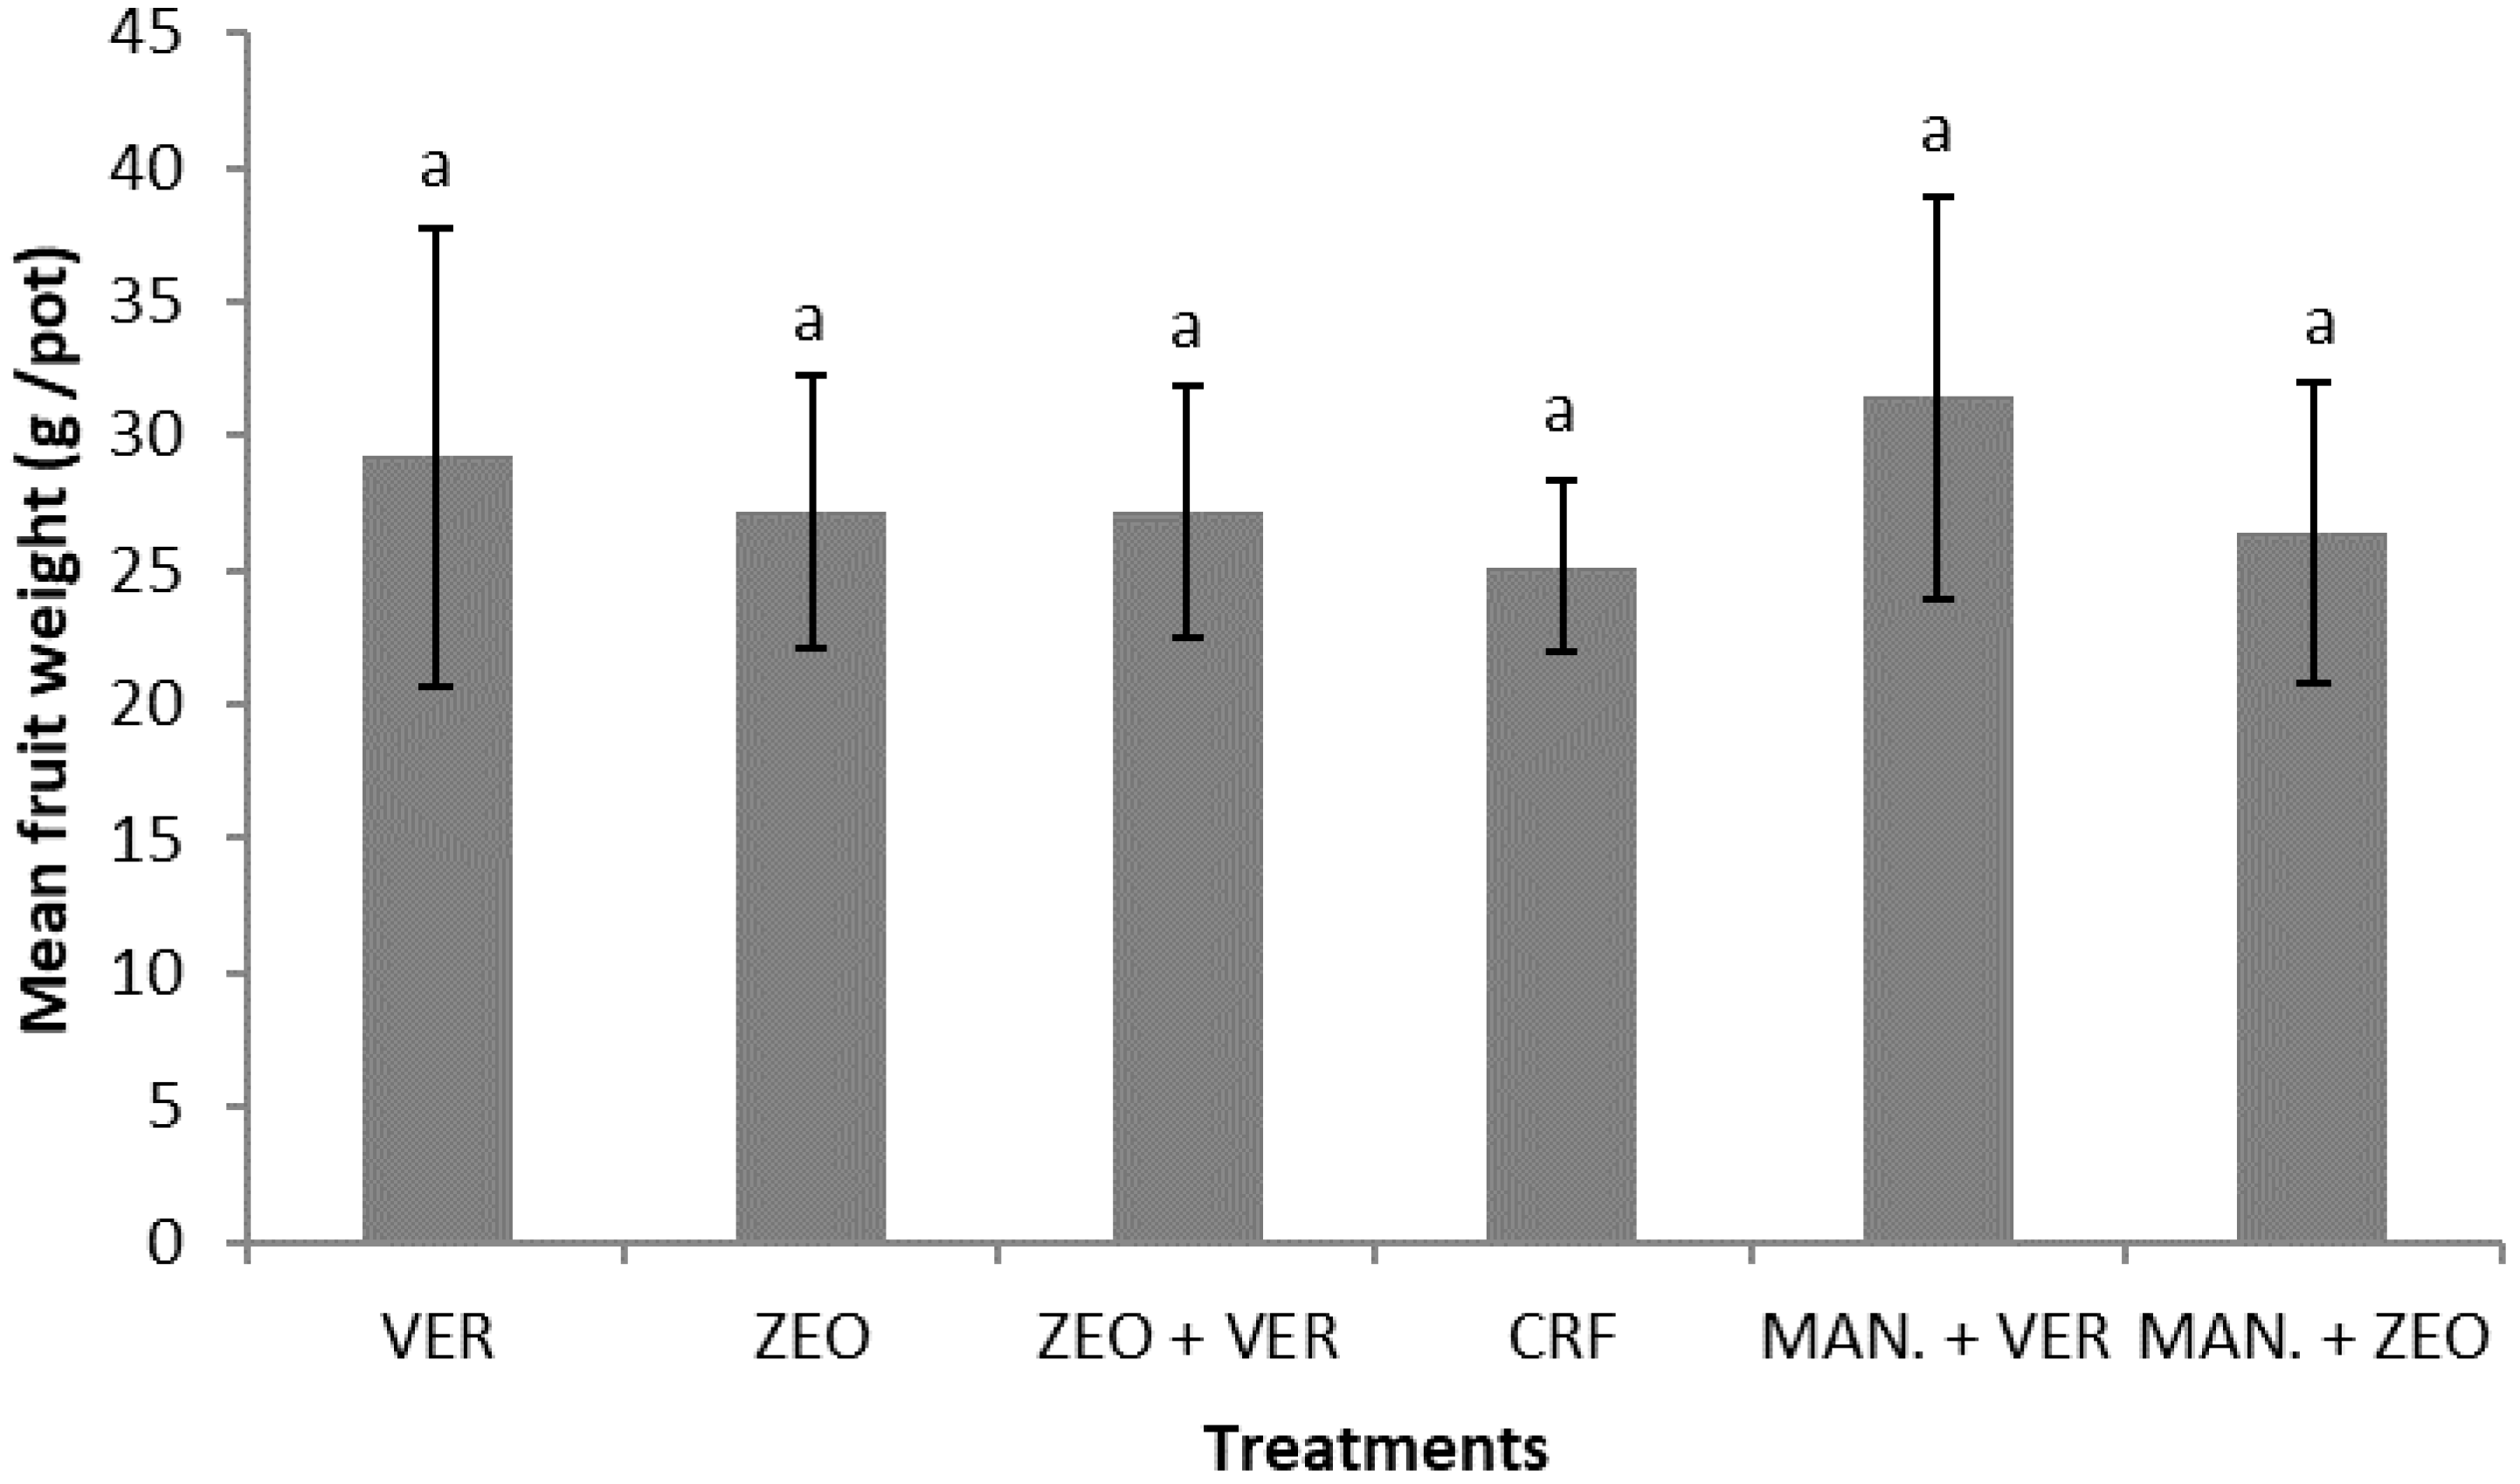
16] for tomato plants, who found that the highest total biomass was recorded in the inorganic fertilization (CRF) compared to the other treatments. The possible differences between the data of this study and those of Chatzistathis et al. (2020) should be mainly focused on the differential response between the two vegetable crop species to the fertilization treatments. With regard to the mean fruit weight, insignificant differences were also found among the treatments (Figure 2); our results are partially in disagreement with the data of Assimakopoulou et al. (2020) [15], who found a higher pepper fruit biomass under the treatment with 5% zeolite and 2.5% olive mill wastewater (OMW), compared to the plants that received 2.5% zeolite and 2.5% OMW. The differences in fruit biomass between our data and those of Assimakopoulou et al. (2020) [15] could be possibly ascribed to the differences in the organic amendment (goat manure vs. OMW) and the other materials used as nutrient suppliers (vermiculite, vermiculite + zeolite, etc.). In the study of Chatzistathis et al. (2020) [16] it was found that the mean weight of tomato fruits was significantly higher in the inorganic fertilization (CRF) treatment; the differences between the data of the present study and those of Chatzistathis et al. (2020) for tomato crop should be ascribed again to the differential response of the two vegetable crop species.
A significantly higher foliar N concentration (3.84% D.W.) was recorded in the CRF compared to all the other treatments, while the leaf’s K was significantly higher with the VER + ZEO (5.10% D.W.) and ZEO (4.51% D.W.) treatments (Table 3), which shows the ability of zeolite to enhance soil exchangeable K and its uptake by plants, since it has a high K concentration (14,984 mg kg−1 vs. 445 mg kg−1 for vermiculite). Indeed, other studies have also shown the beneficial effects of zeolite application on soil fertility and K nutrition for plants [15,34]. In contrast to K, where the independent application of zeolite, or in combination with vermiculite, seems to be a good agronomic practice in order to satisfy K nutritional needs of pepper plants, N nutritional needs were not sufficiently satisfied by inorganic and organic amendments (zeolite, vermiculite and goat manure), since in all these cases, foliar N varied from 1.43% to 2.73% D.W. (Table 3). According to Bergmann (1986), the optimum range for foliar N, P and K concentrations in pepper plants should be 3.0–4.5% D.W., 0.3–0.6% D.W. and 4.0–5.4% D.W., respectively [35]. Based on this categorization, only foliar N in CRF was sufficient (3.84% D.W.) and within the optimum range of sufficiency, while in all the other treatments, the leaf’s N concentrations were insufficient (Table 3). Foliar P levels with the VER, VER + ZEO and MAN + ZEO treatments were marginal to slightly deficient (0.28% D.W., 0.30% D.W. and 0.29% D.W., respectively) (Table 3), while only the leaf’s K concentrations recorded in the ZEO and VER + ZEO treatments were within the optimum levels of sufficiency (4.51% D.W. and 5.10% D.W., respectively); in all the other treatments, foliar K was deficient (<3.0% D.W.) (Table 3). From these data, it can be concluded that ZEO application or ZEO coapplication with VER was beneficial in satisfying the K nutritional needs of pepper plants; thus, their use as soil amendments to enhance K uptake by pepper plants is suggested. However, further multiyear additional research, under field conditions, is required to verify these results.
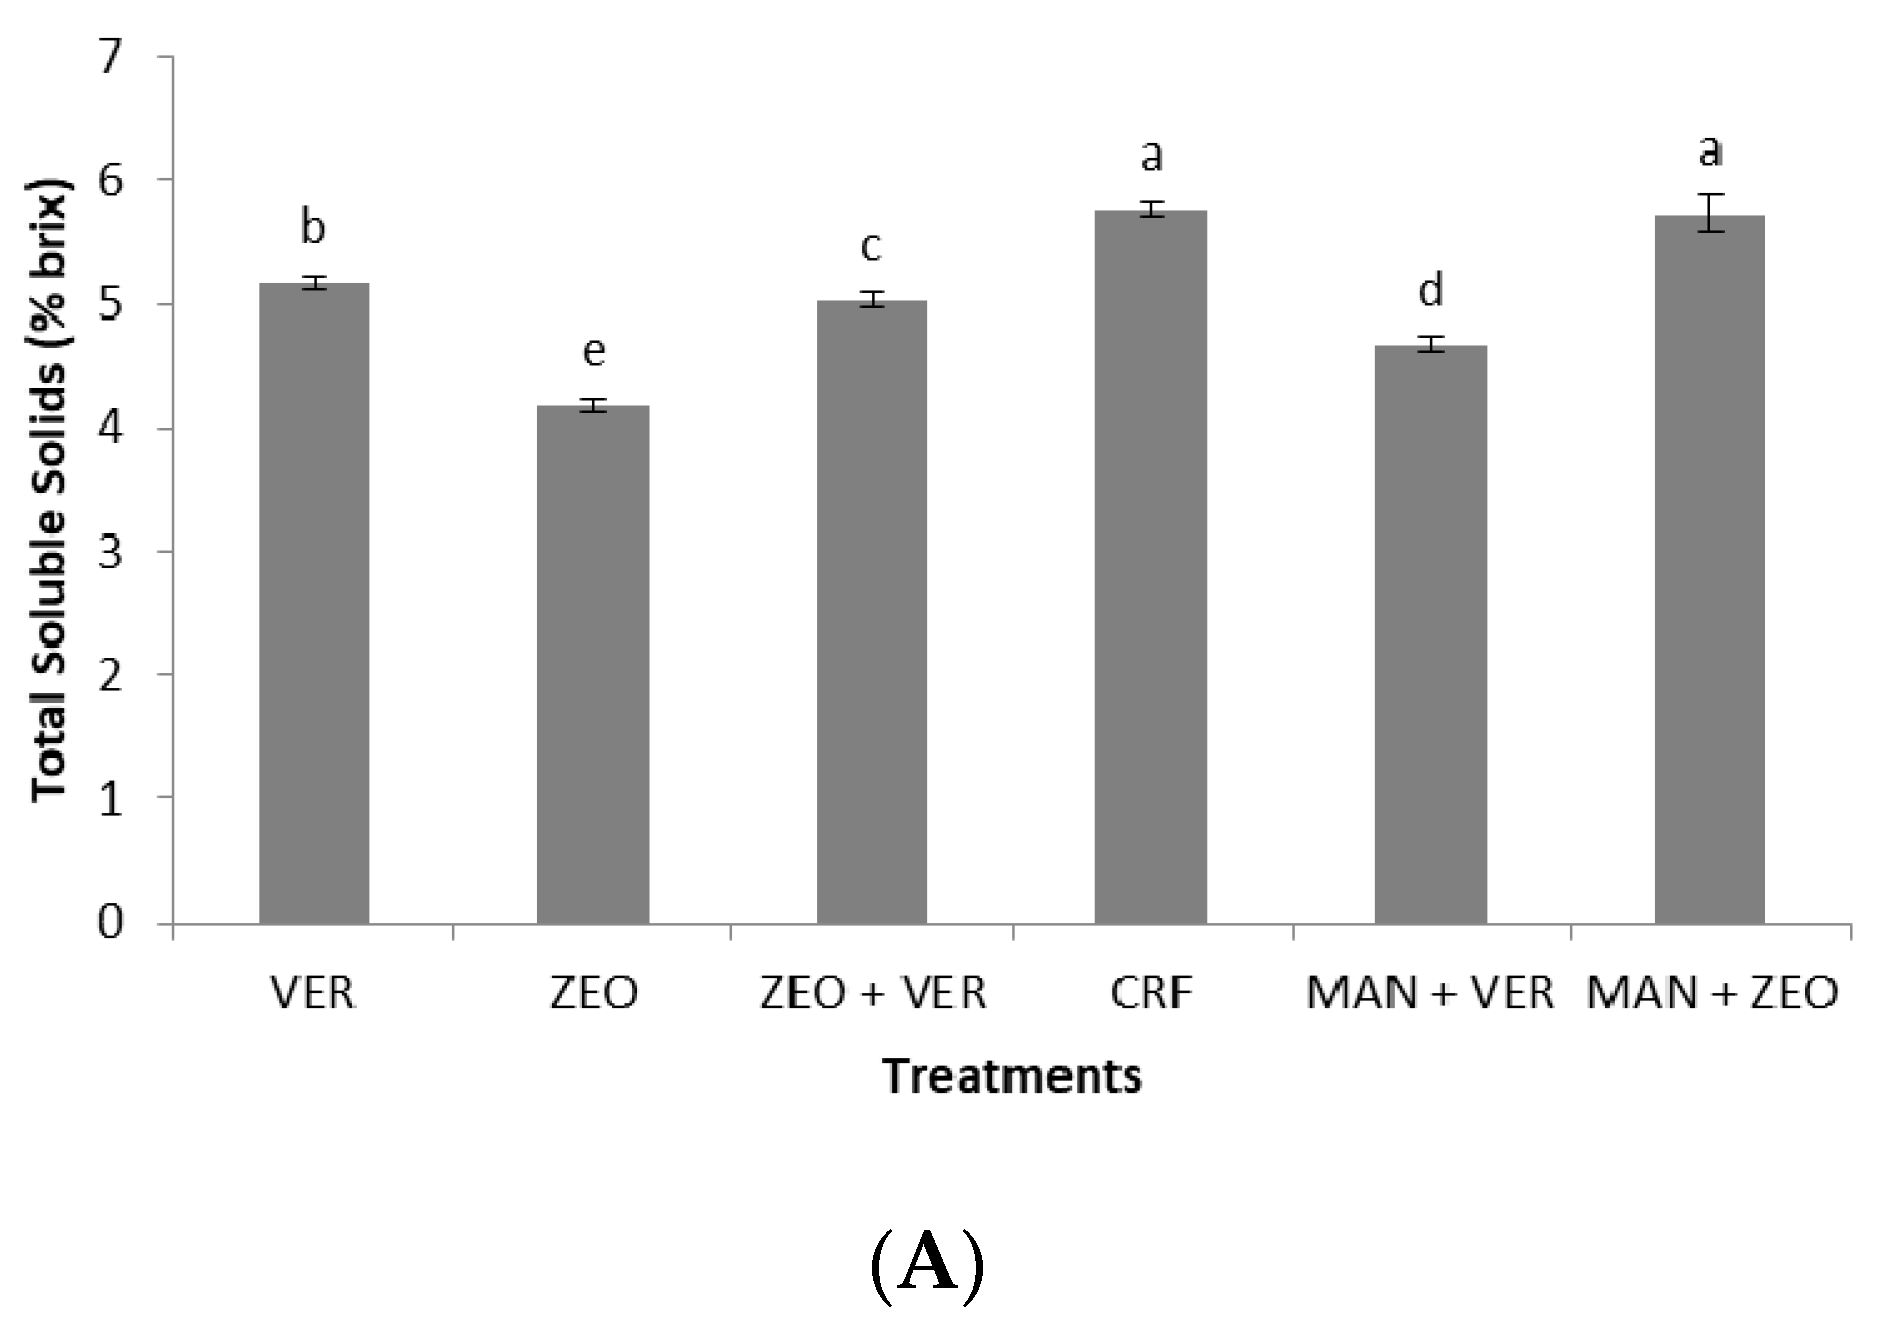
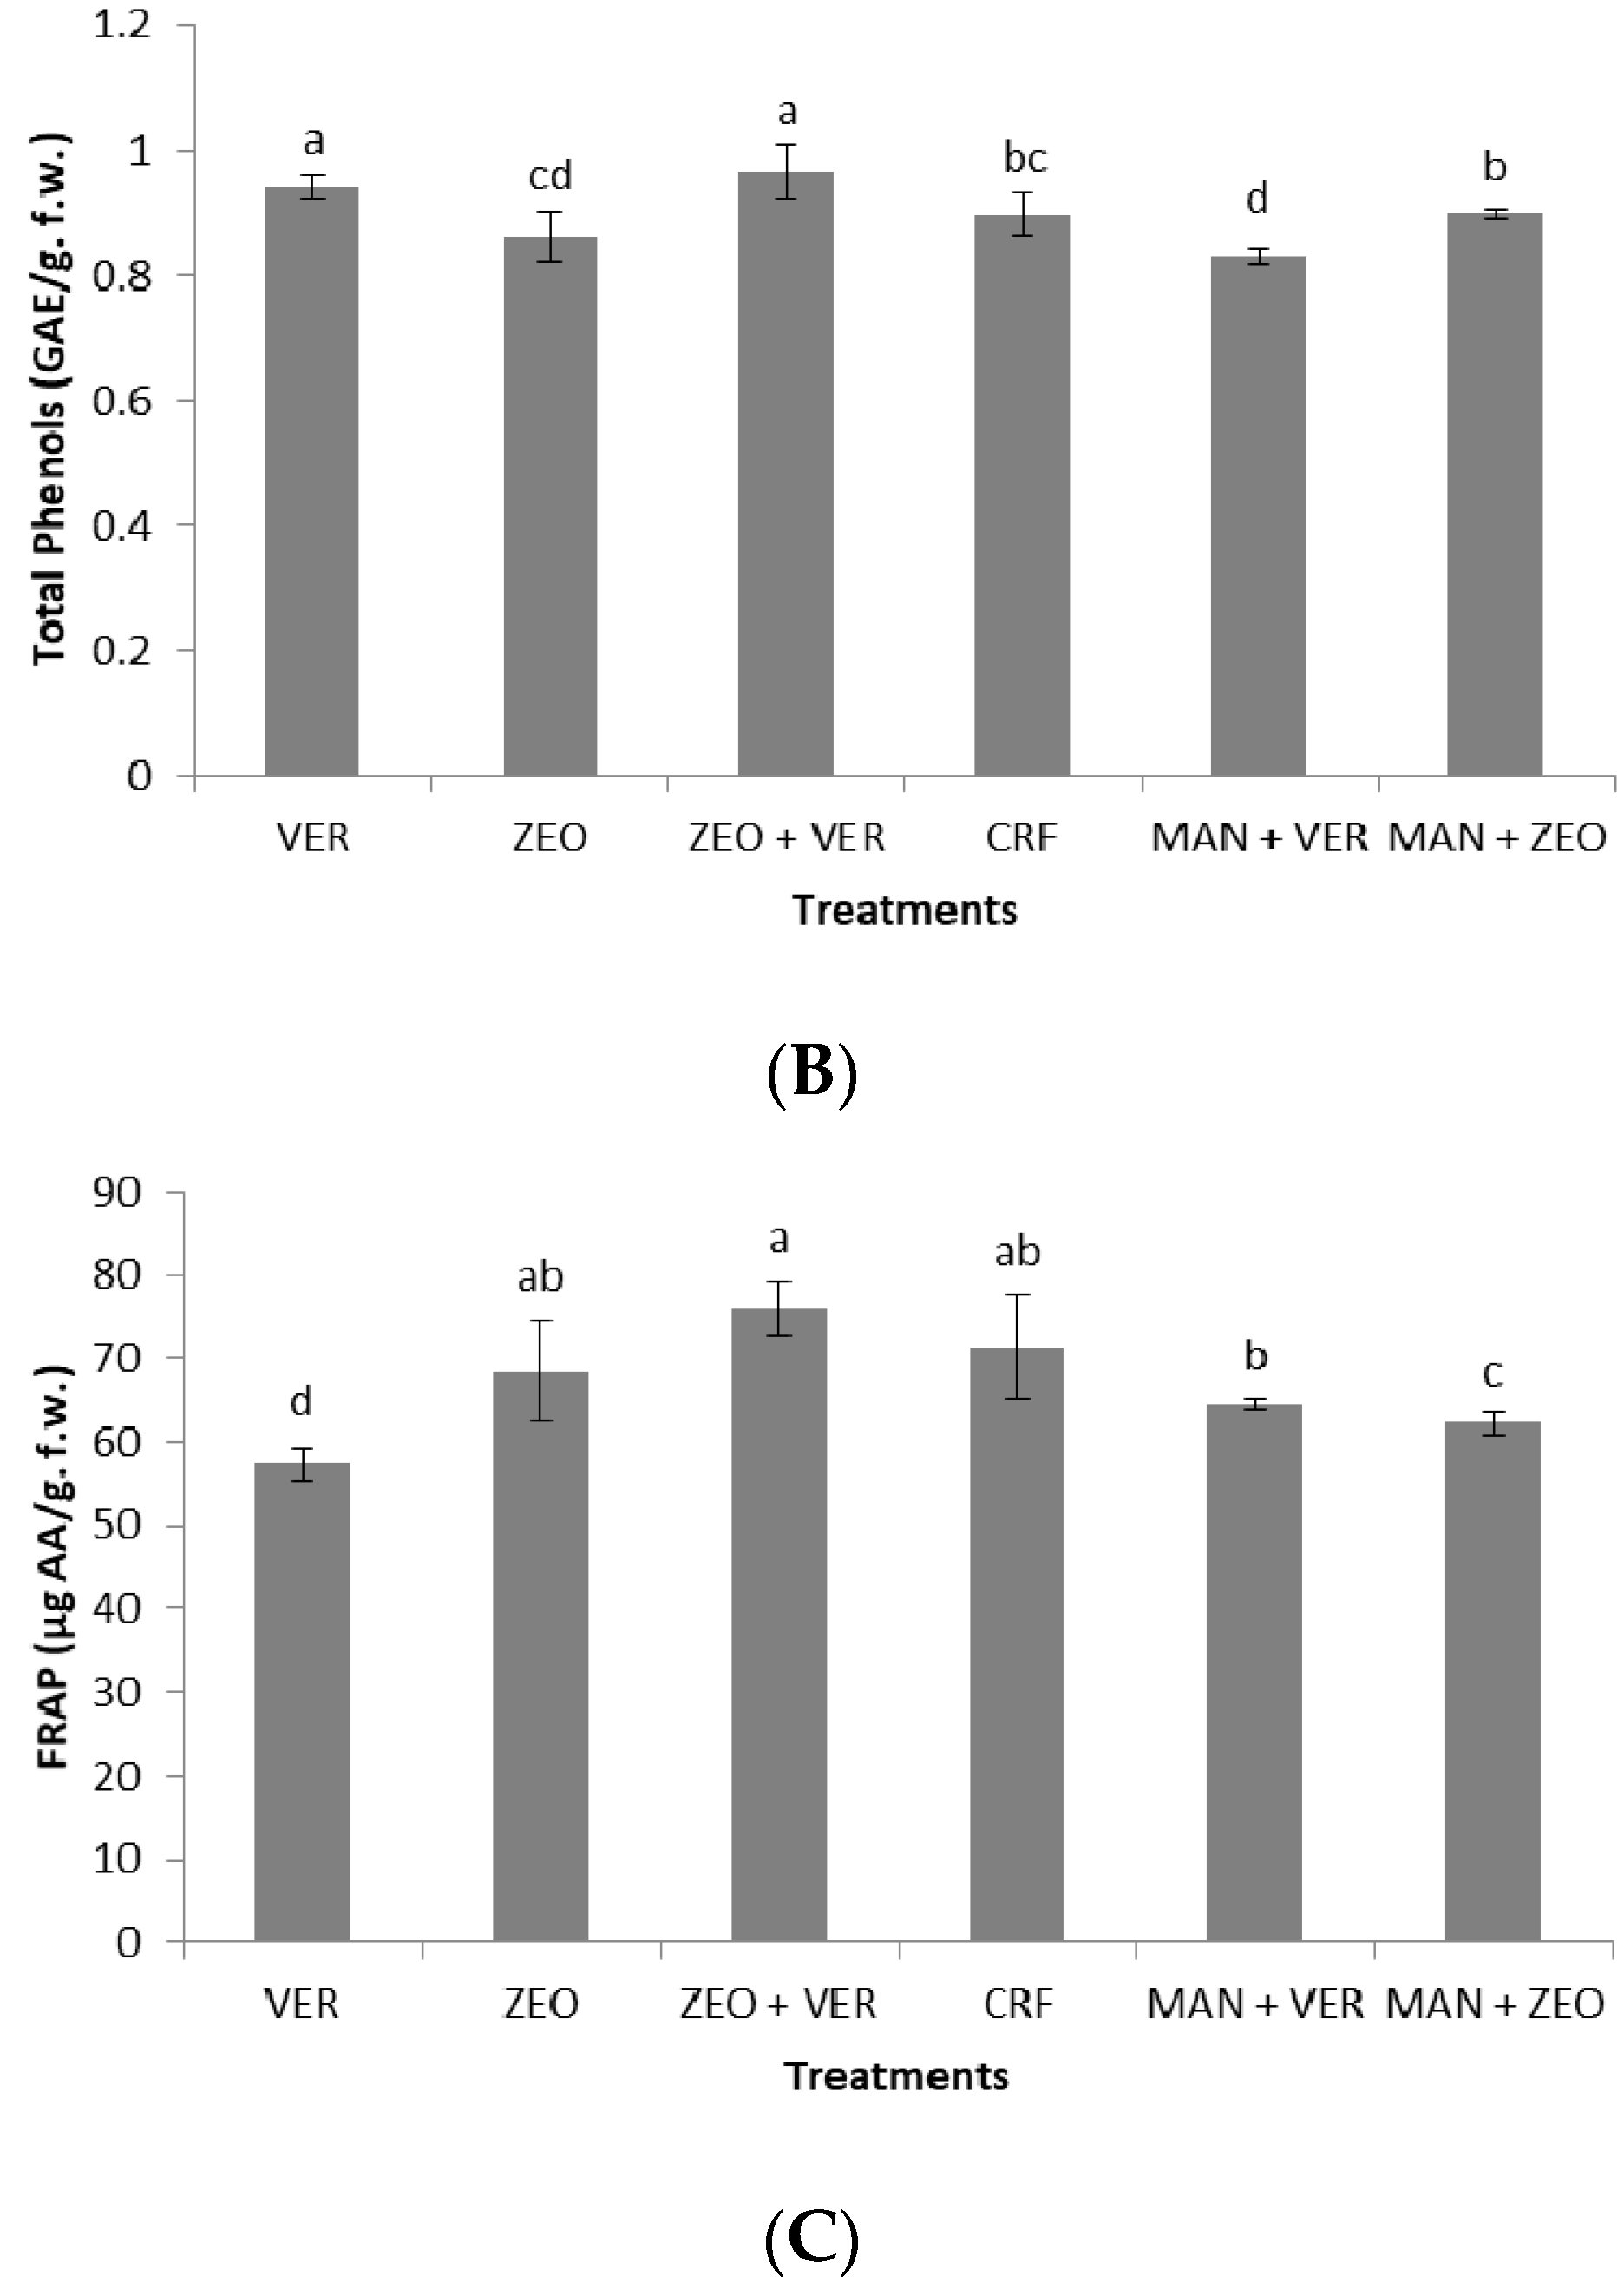
Fruit K, which influences the qualitative fruit characteristics [36], was significantly higher with the ZEO treatment (4.27% D.W.), compared to all the other treatments (Table 5). Nevertheless, the total soluble solids and total phenols were not positively influenced by the high fruit K levels under ZEO application (Figure 5A,B); in contrast, the optimum fruit quality was achieved either in the ZEO + VER, CRF, MAN + ZEO, or in the VER treatments (Figure 5A–C). It seems possible that the influence of K on fruit quality is more profound for other plant species (e.g., tomato, fruits of perennial tree species), rather than for Capsicum annuum L. This is also supported by the fact that insignificant differences among the treatments were found for the mean fruit weight of pepper plants (Figure 2). Thus, it is clear from all the above-mentioned results, that further studies, in the near future, are required to draw stable conclusions about the effects of the optimum K nutrition on pepper fruit quality. Glisic et al. (2009) [37] found that the combinational supply of zeolite with manure provided similar fruit quality characteristics (soluble solids, total acids) with the coapplication of the inorganic fertilizer 15-15-15 and manure, which partially confirms our data for total soluble solids (Figure 5A). Finally, the coapplication of the inorganic fertilizer 15-15-15, calcium ammonium nitrate and natural zeolite induced the highest levels of total phenolics, flavonoid content and total antioxidant capacity in apricot fruits [38].
The glucose formation via photosynthesis is the first step of the processes taking place towards the maintenance of the cellular homeostasis of all plant organs [39]. These processes involve di- and polysaccharide formation, transport via the cellular membranes and the tonoplast as well as phloem loading and translocation to the sink organs [39,40]. Rather recently, a group of specific sugar transporters with discrete roles was identified as a critical regulator of these processes that function in parallel to the well-established biosynthetic routes involving the formation of simple and more complex sugars as well as a plethora of secondary metabolites [41,42]. The importance of the Sweet 2 (SW2) transporter for the phloem loading was identified [43], while the expression of the N3 gene was correlated to the soluble solids’ content in figs [44]. Our results suggest that the substrate may substantially influence the expression of sugar transporters, as well as the expression of genes coding for enzymes critical for the sucrose synthesis, the disaccharide that is synthesized mainly in the leaves and then transferred via the phloem to support the non-photosynthetic organs [40,45] in a comparable way to the expression of a specific potassium transporter that was found to be closely associated to the fruit ripening and accumulation of total soluble solids in strawberry [46]. The coexpression of a Sweet transporter and SPS was also observed in Vitis vinifera L berries [47]. Since the K levels are closely associated with the phloem’s ability to transfer several metabolites [
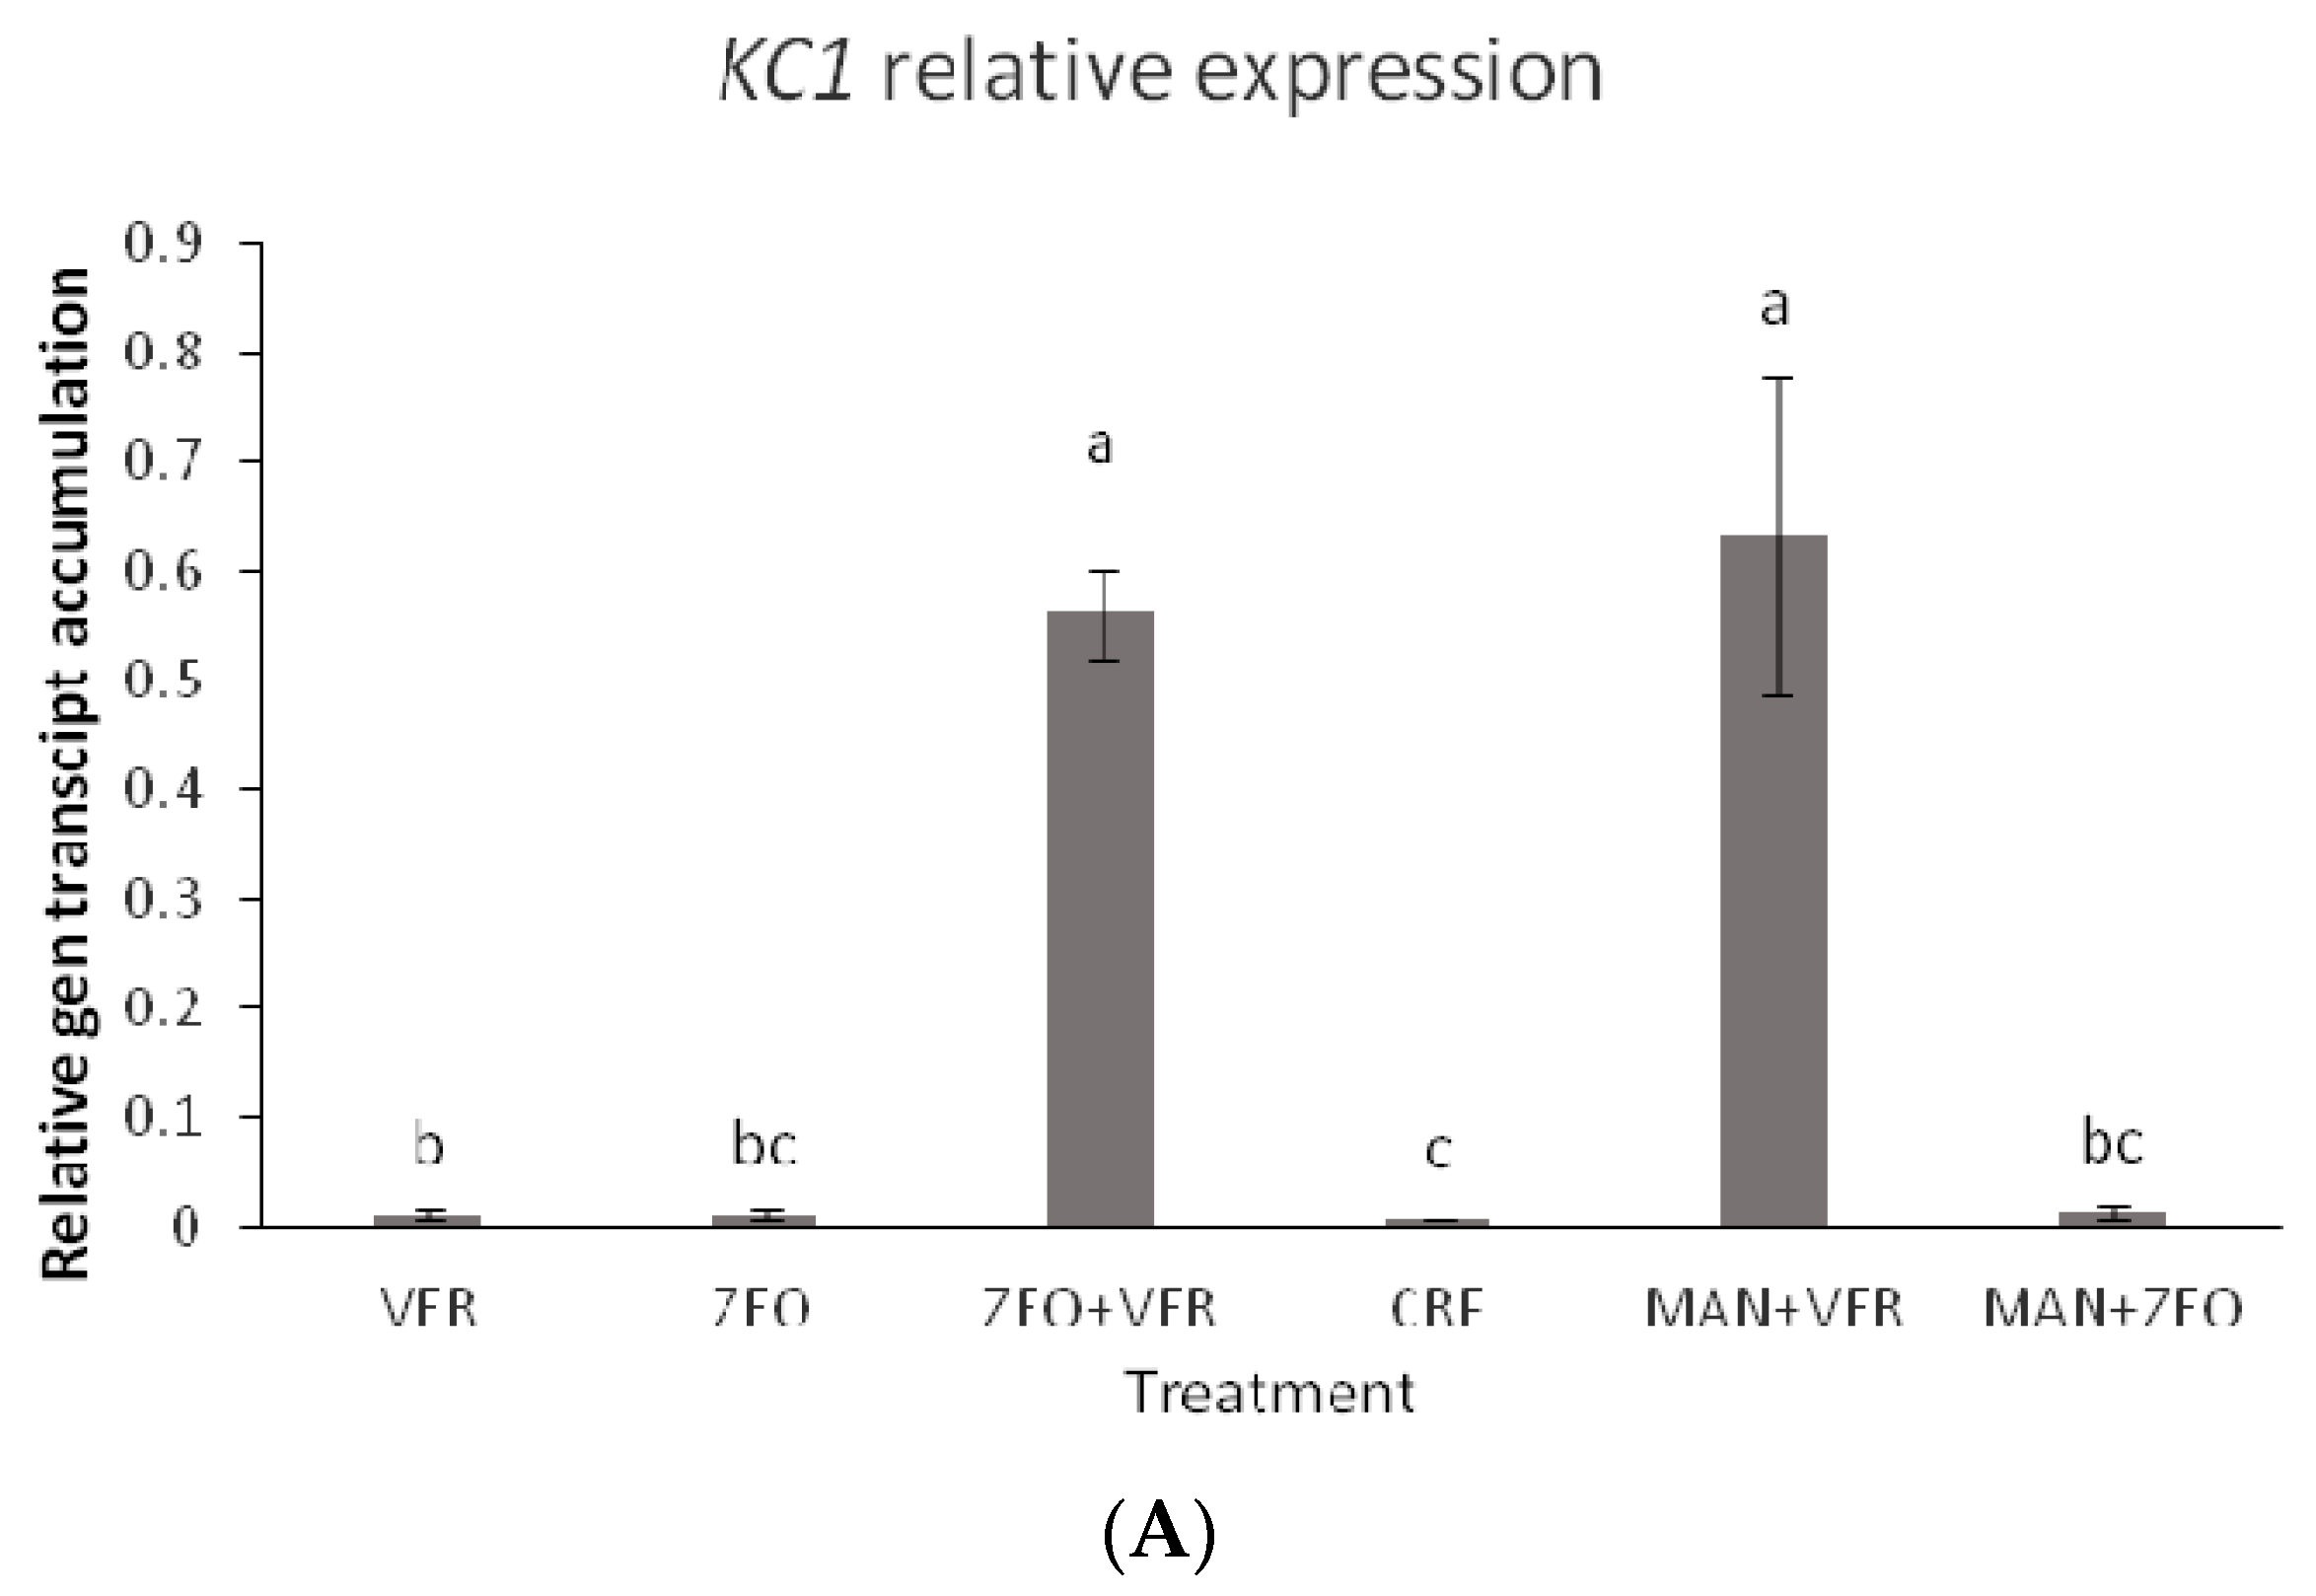
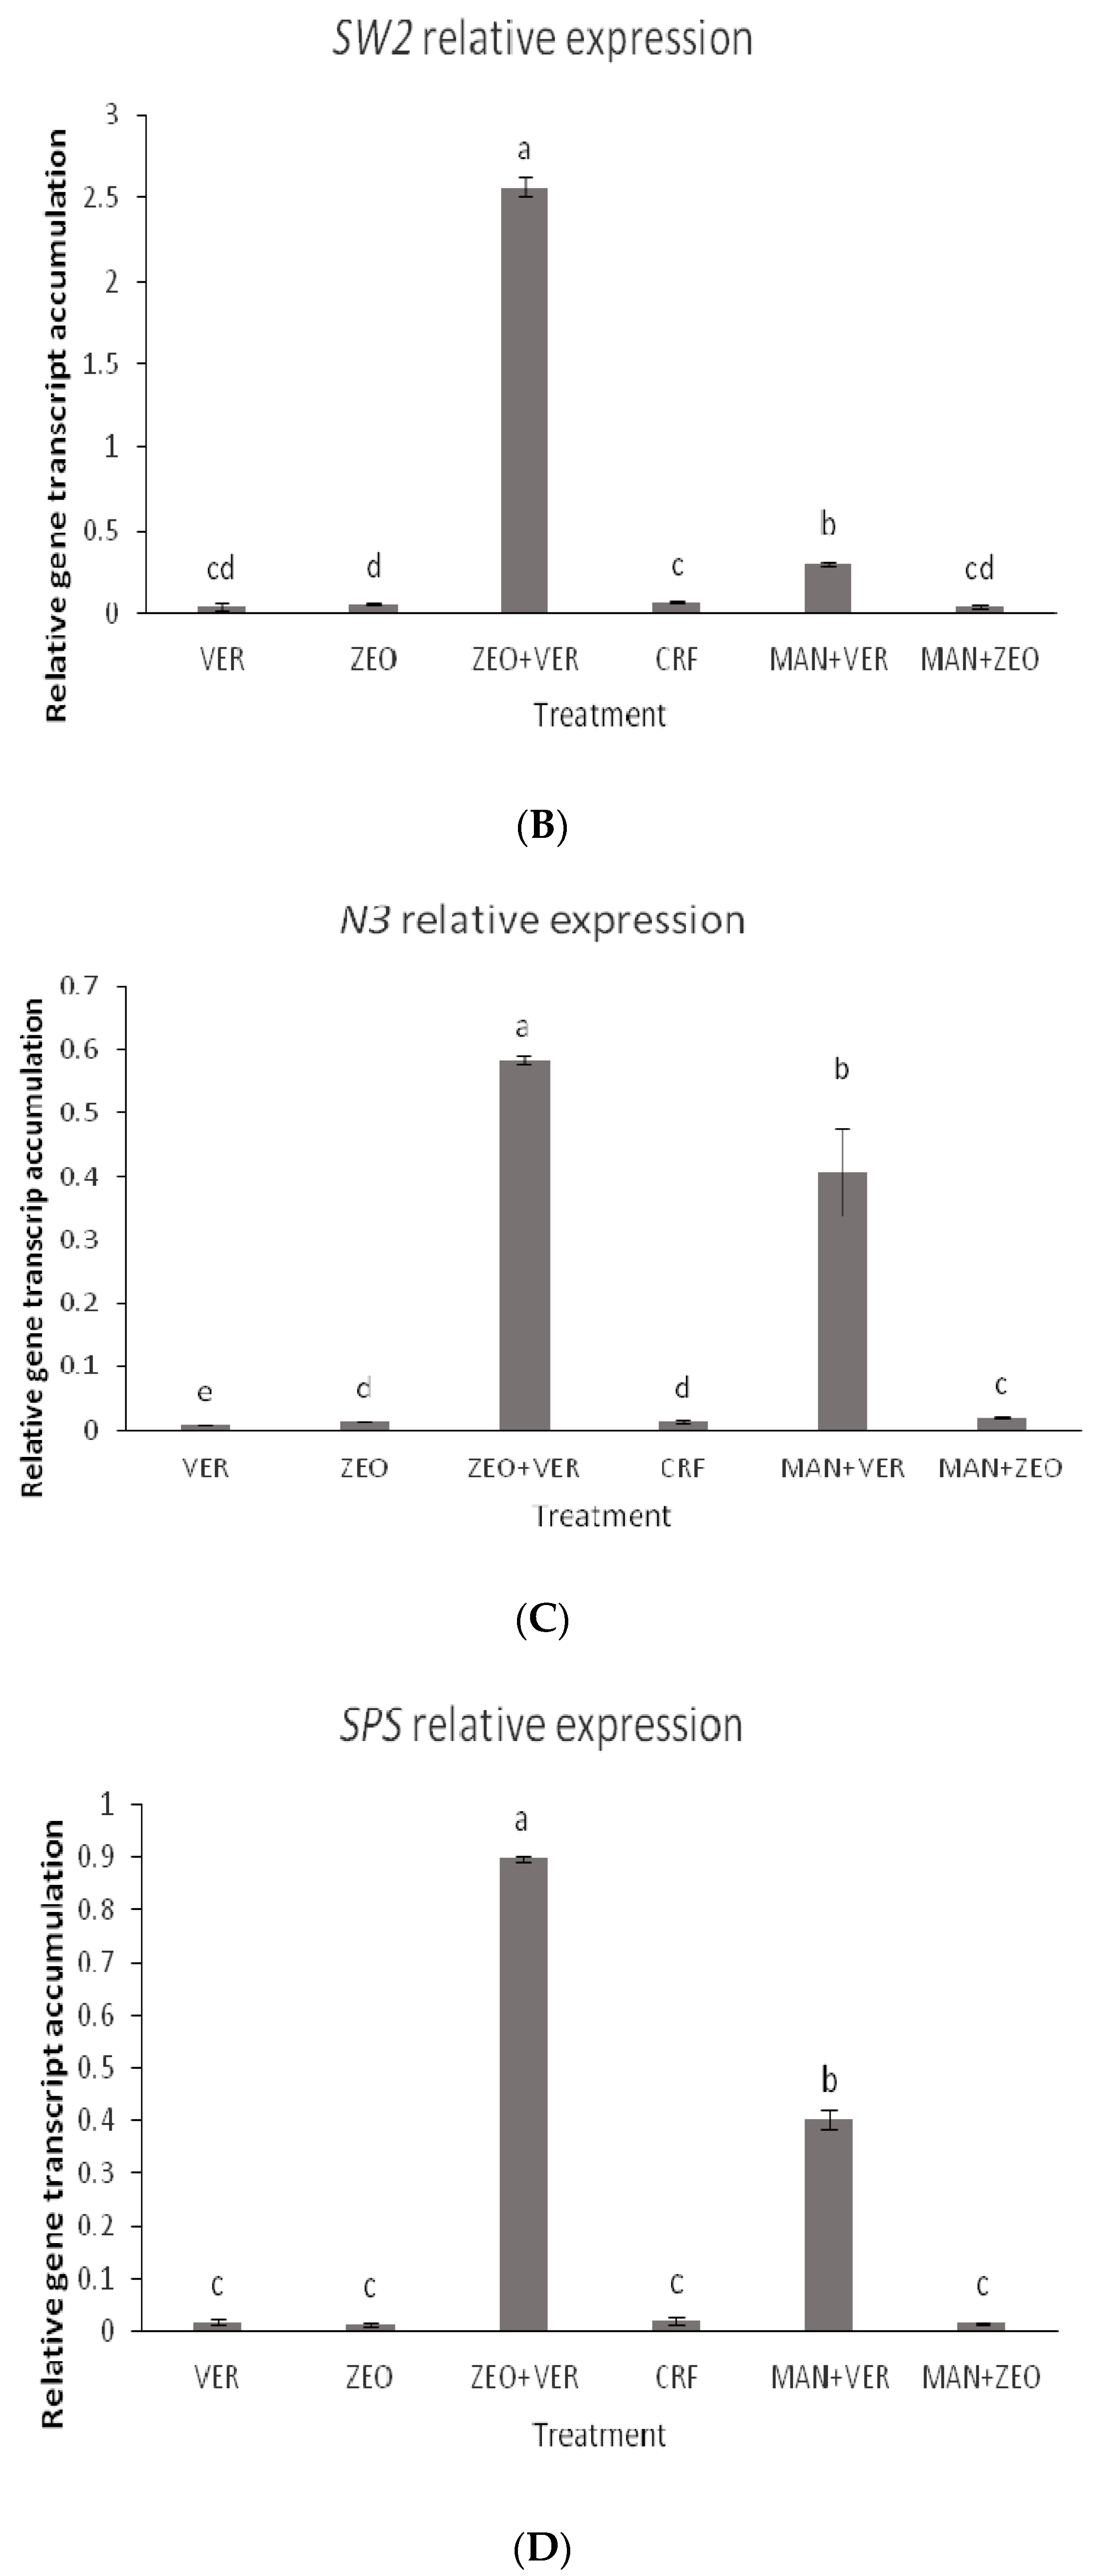
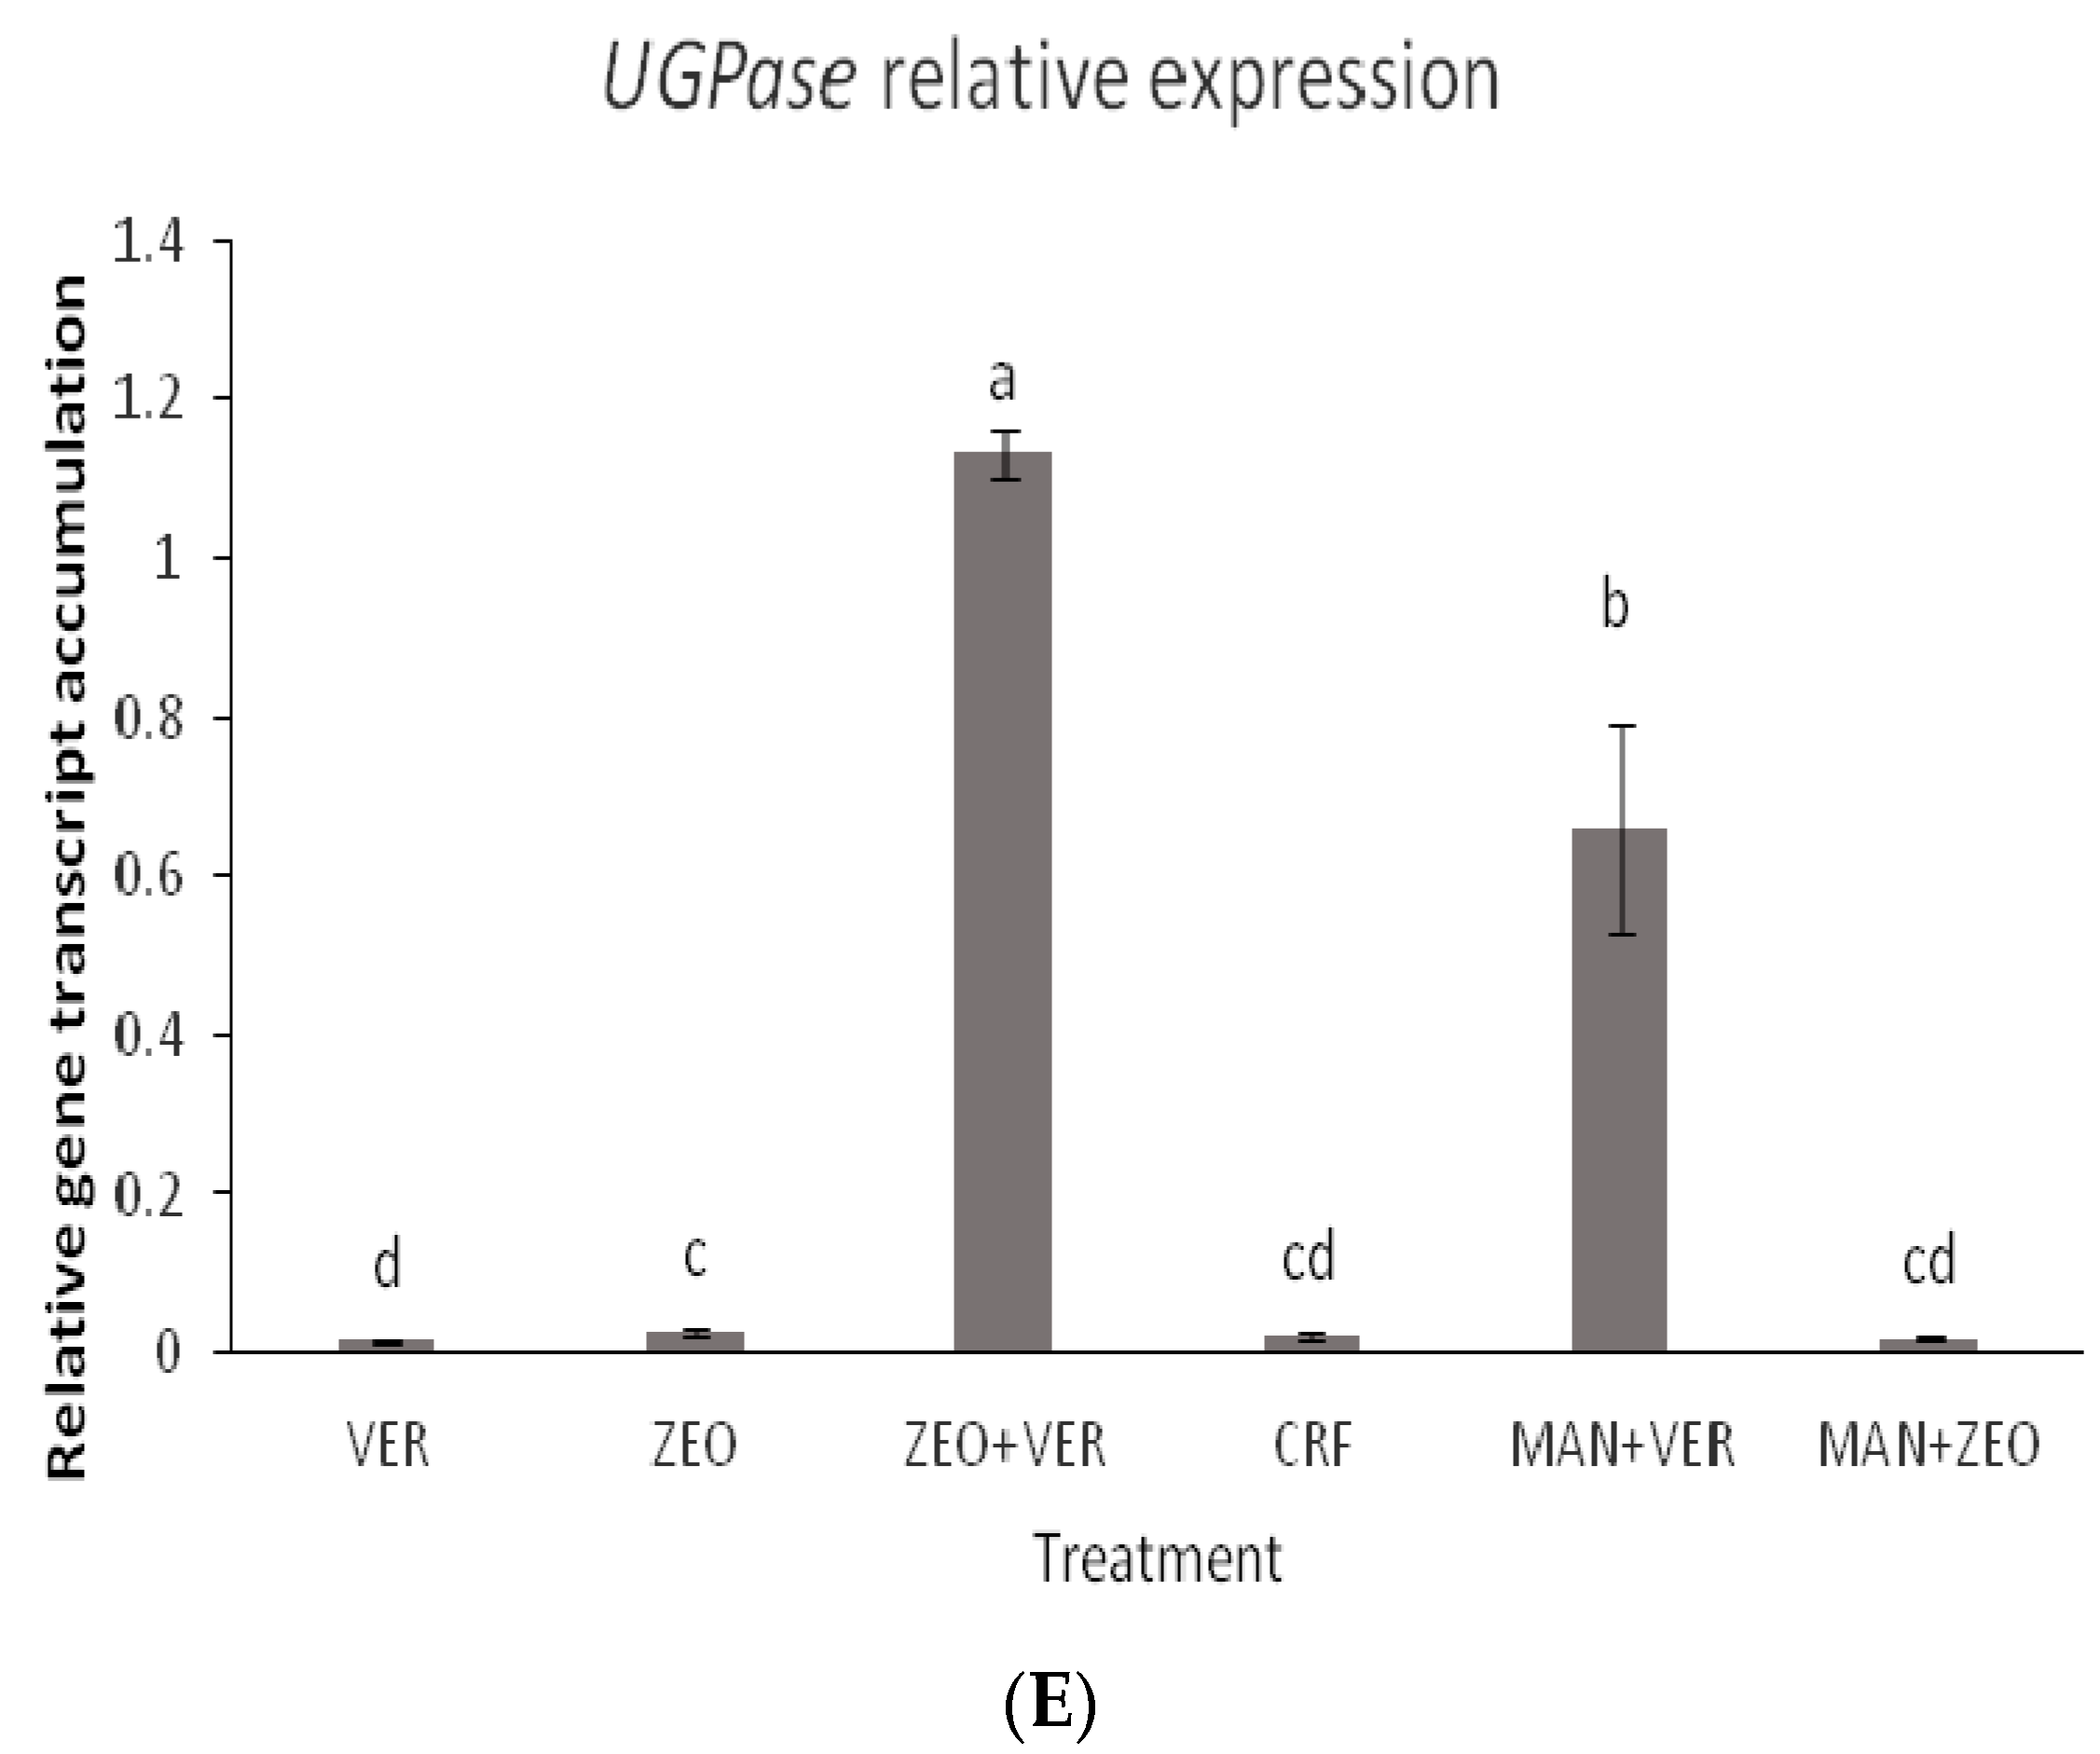
48], via a mechanism that is not yet fully elucidated, the coregulation of the expression of the sugar transport, the sucrose synthesis and the K transporter is not surprising. In our study, the transcript accumulation of all studied genes peaked in the ZEO + VER and MAN + ZEO treatments, while minimal differences were observed between the other treatments (Figure 6A–E). Intriguingly, while a specific clear pattern between the K levels of leaves and fruits and the total soluble solids in fruits is absent, we suggest that the dynamics of the foliar K and sugar levels along with the ones of the sink organs (such as the fruits) may influence gene expression. The ZEO + VER treatment showed high foliar and low fruit K levels (Table 3 and Table 5, respectively), while the MAN + ZEO treatment exhibited rather low total K levels (Table 3 and Table 5) and high soluble sugar levels of fruits (Figure 5A). The exact mechanism, however, triggering gene expression towards the facilitation of the sugar and K transport as well as the sucrose synthesis should be further investigated.
The total plant nutrient content showed significant differences among the CRF and other treatments (Table 4). Since plant biomass did not significantly differ among the treatments (Table 1), the differences determined in nutrient content should be ascribed to differences in nutrient uptake, which were quite distinct among the soil amendments (Table 3). This is in contrast to the results of Chatzistathis et al. (2020) [49], who studied the comparative effects of inorganic fertilization and manure application on olive plants’ response and concluded that the higher nutrient accumulation in the inorganic fertilization treatment should be ascribed to the higher plant biomass, rather than to a higher nutrient uptake. In another study with zeolite (ZEO), vermiculite (VER), combined zeolite and vermiculite (ZEO + VER) applications and fertilization effects with a controlled-release fertilizer (CRF) on Castanea sativa L. plants [17], it was found that the total per-plant uptake for most nutrients was significantly higher in the CRF- and ZEO-treated chestnut plants; these results of Chatzistathis et al. (2021) [17] are partially in contrast to our current data for pepper plants (Table 4). Τhe differences between the two studies may be possibly ascribed to the differential response of the two plant species used for the experimentation (a perennial plant species, Castanea sativa Mill, and an annual one, Capsicum annuum L.).
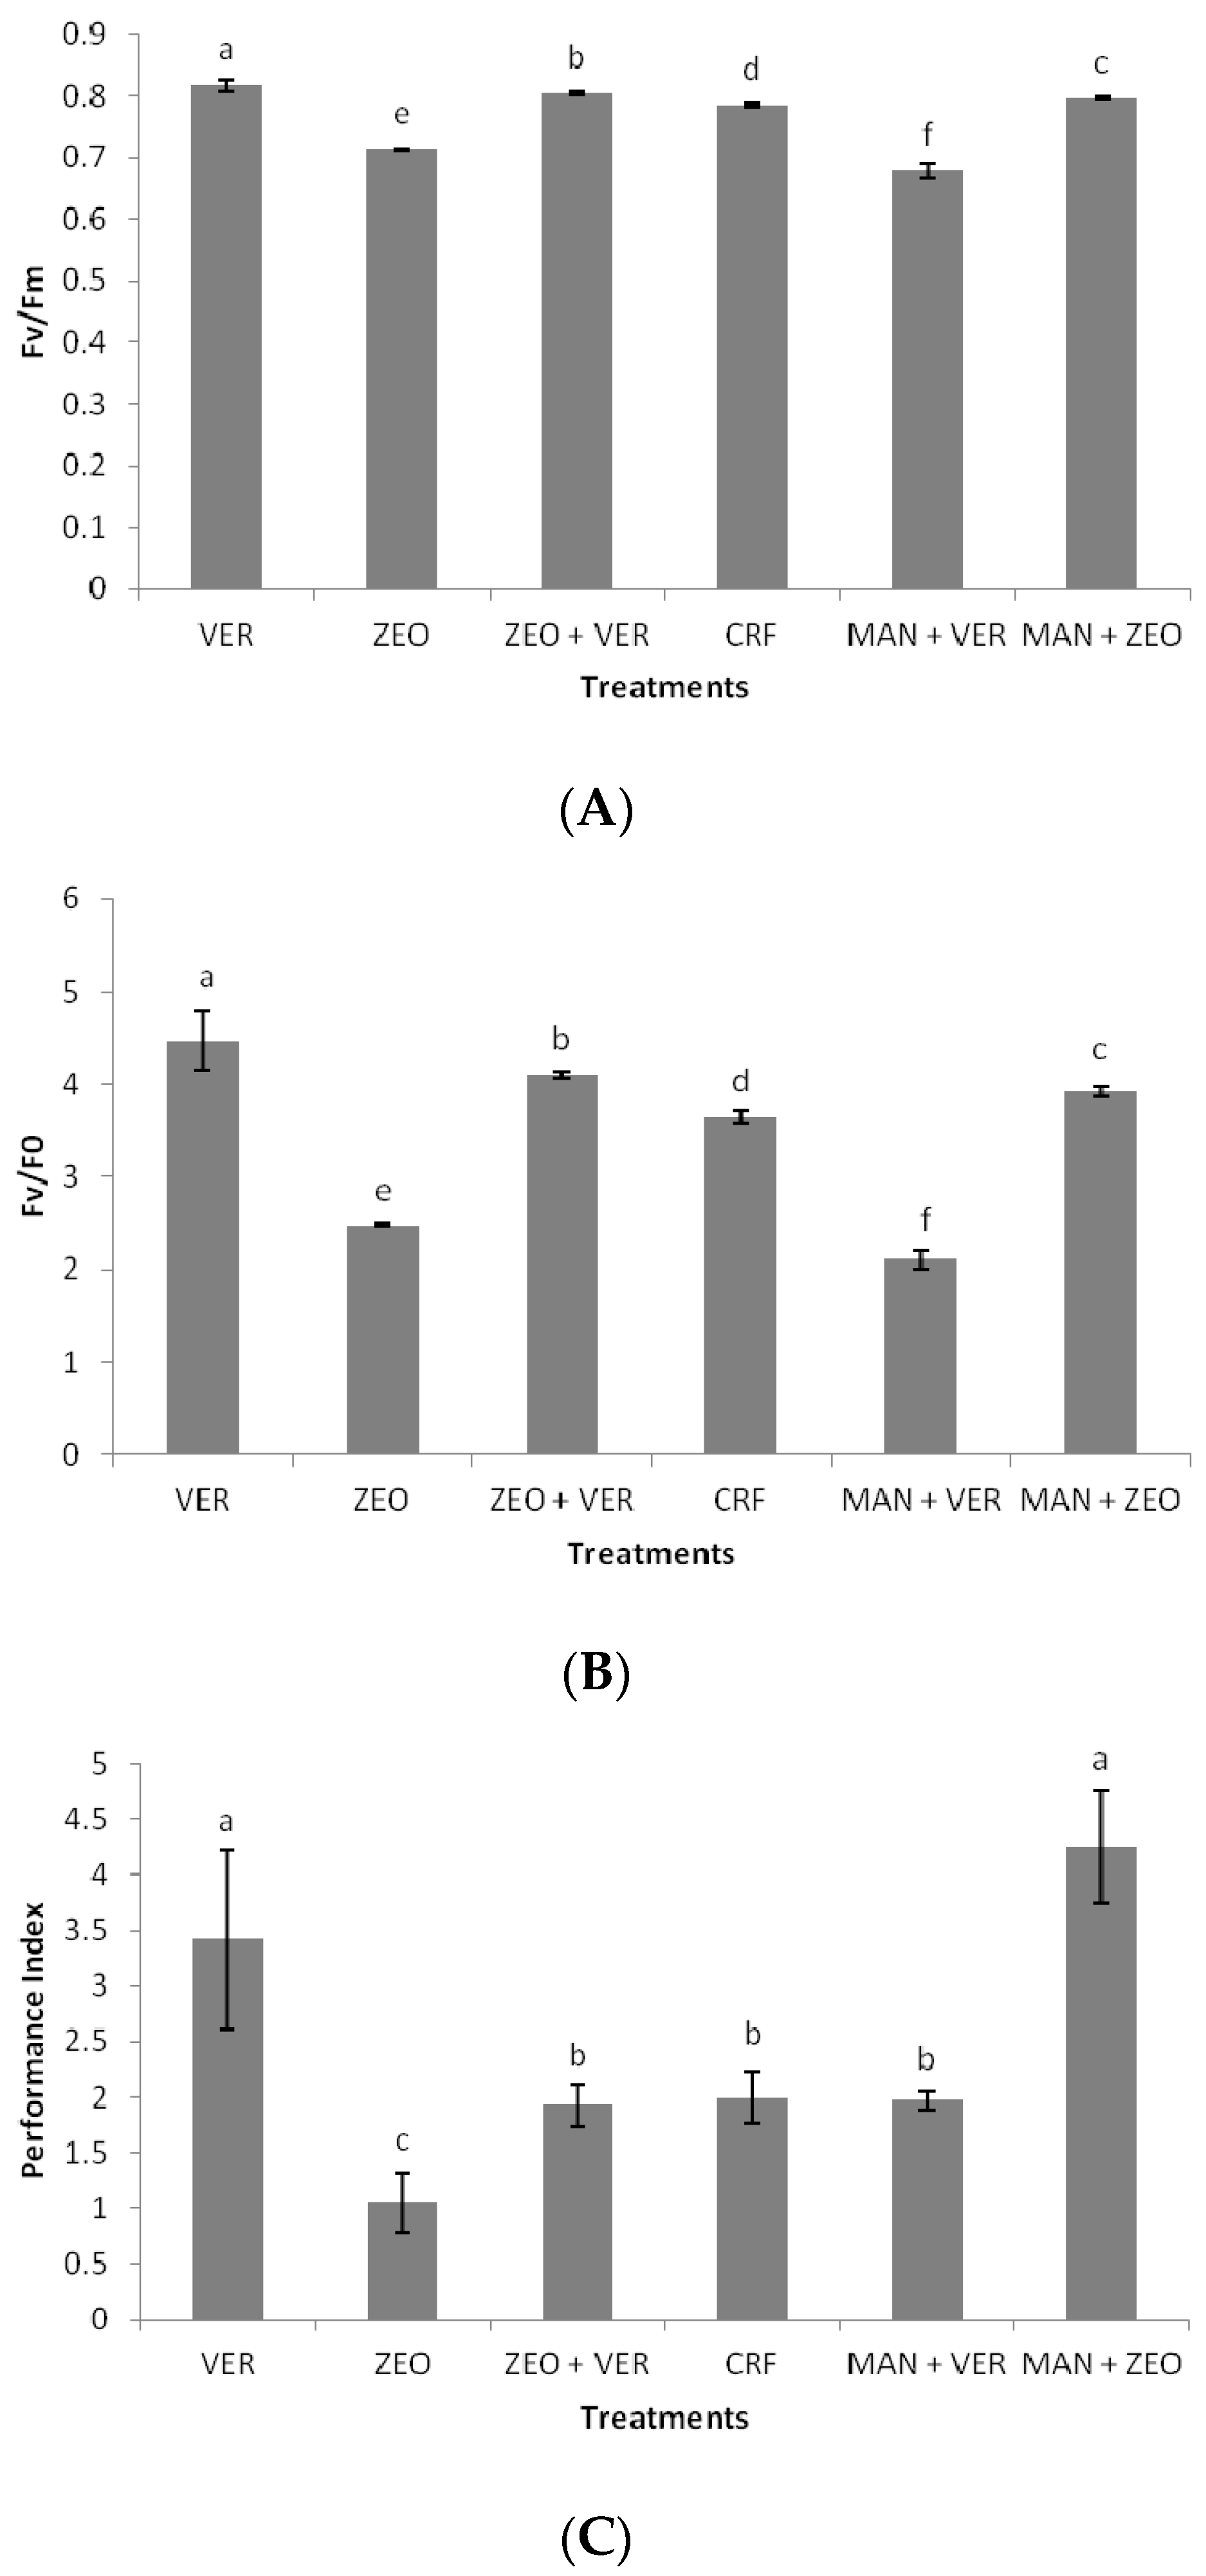
The maximum efficiency of PSII photochemistry (Fv/Fm), as well as the maximum efficiency of the water-splitting complex on the donor side of PSII (Fv/Fo), was recorded in the VER-treated plants, which was significantly higher than in all the other treatments (Figure 3A,B); similar conclusions for the function of PSII were obtained in the studies of Chatzistathis et al. (2020) [16] and Chatzistathis et al. (2021) [17] for Solanum lycopersicon L. and 
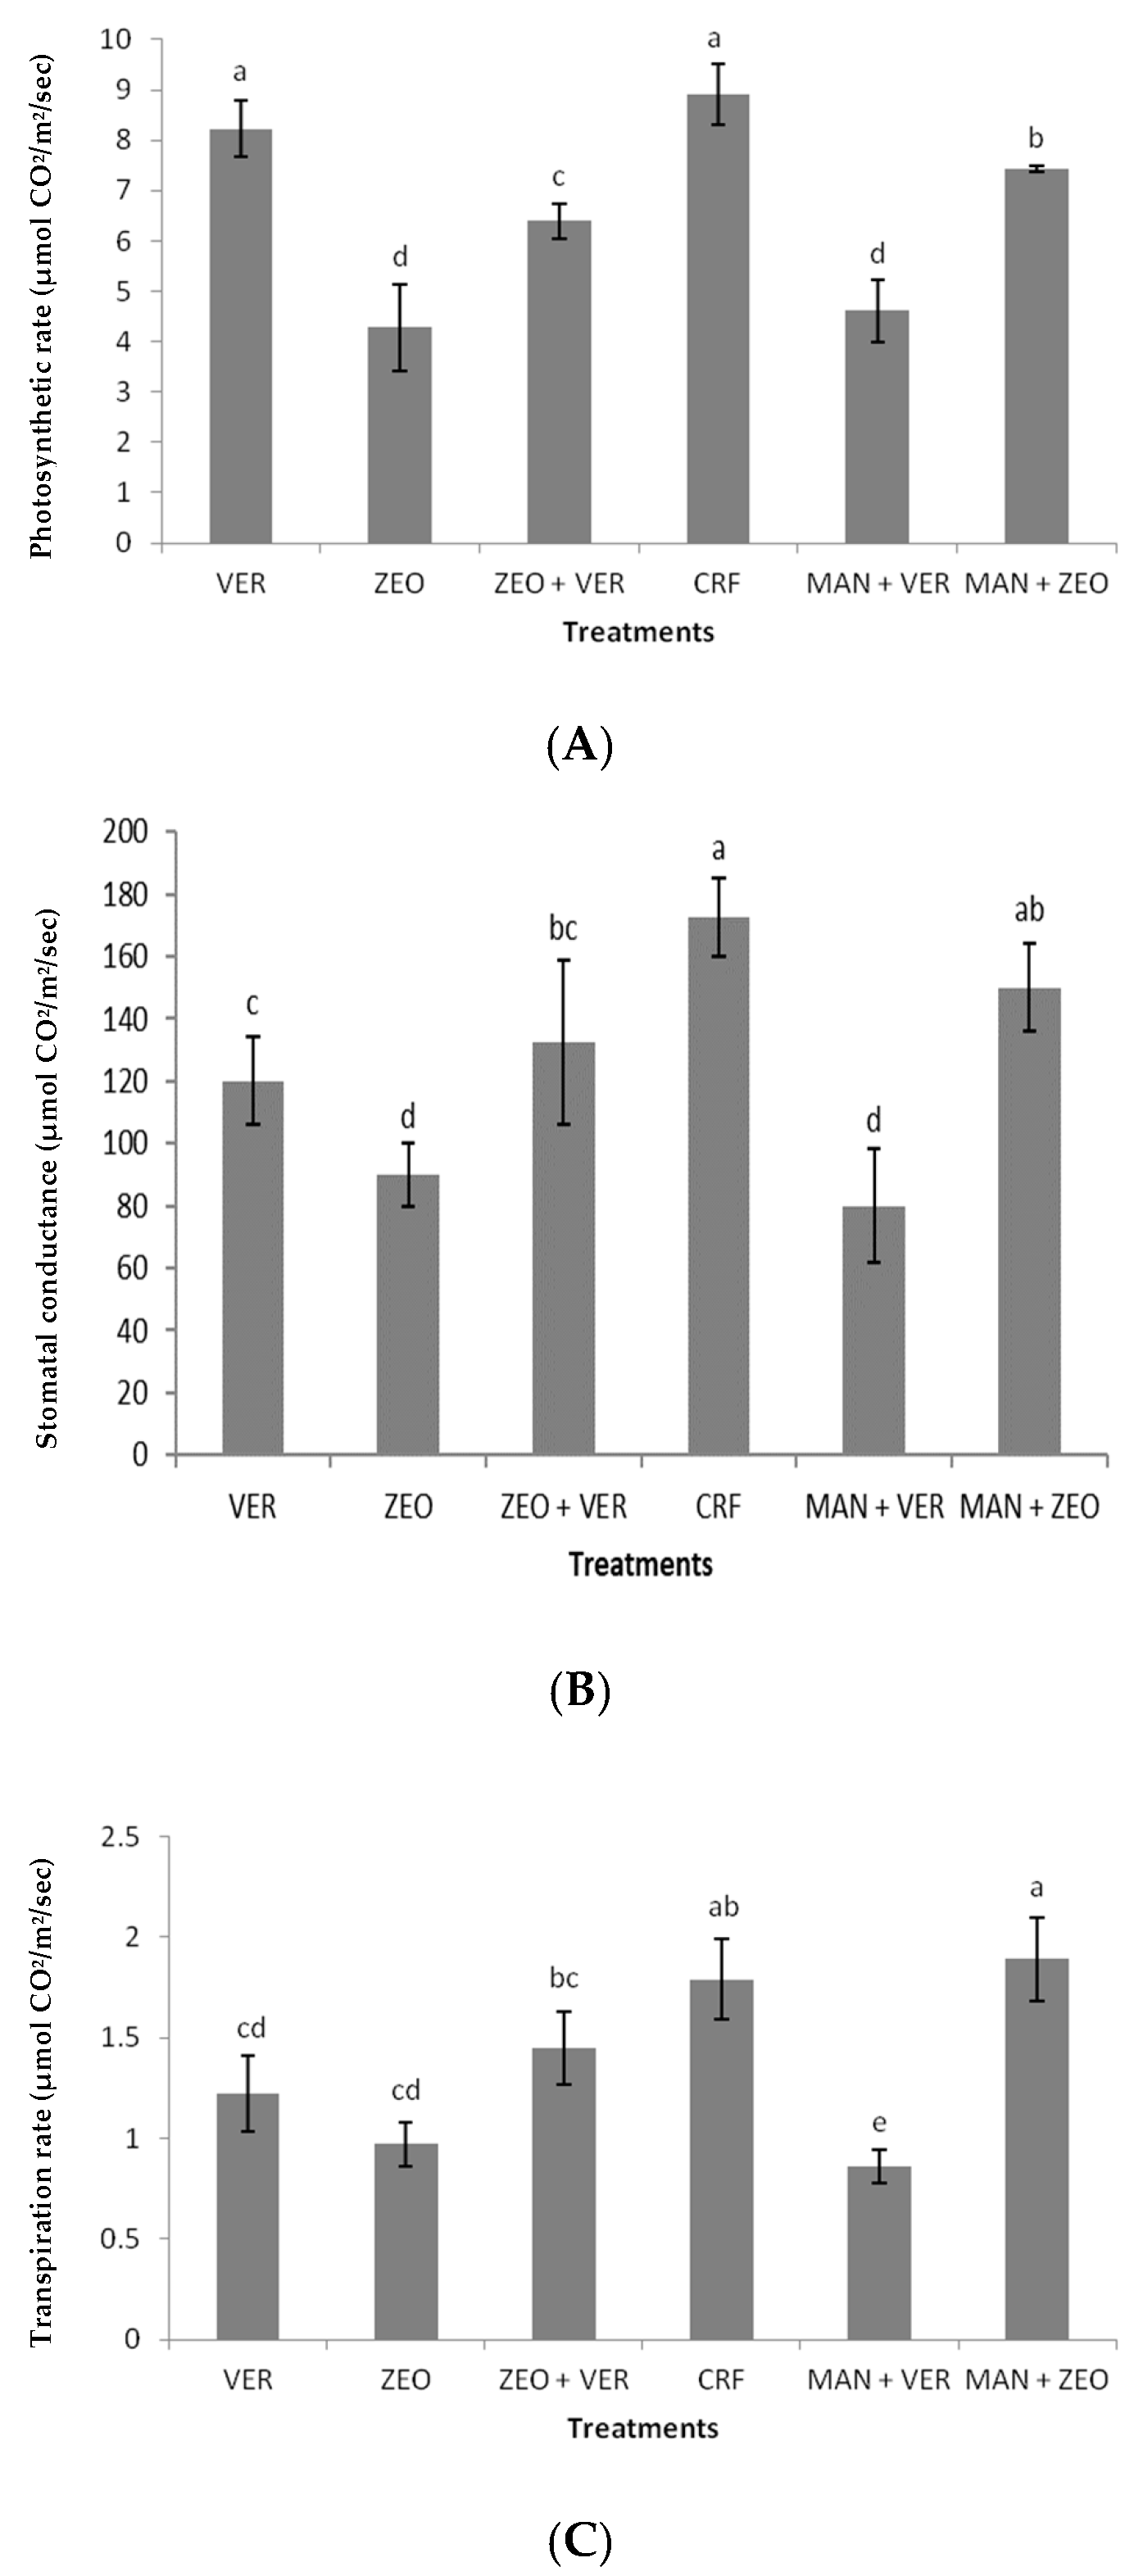
Castanea sativa Mill plants, respectively. Although insignificant differences in photosynthetic rates were determined between CRF- and VER-treated plants (Figure 4A), a significant difference in stomata opening was found between the same treatments (
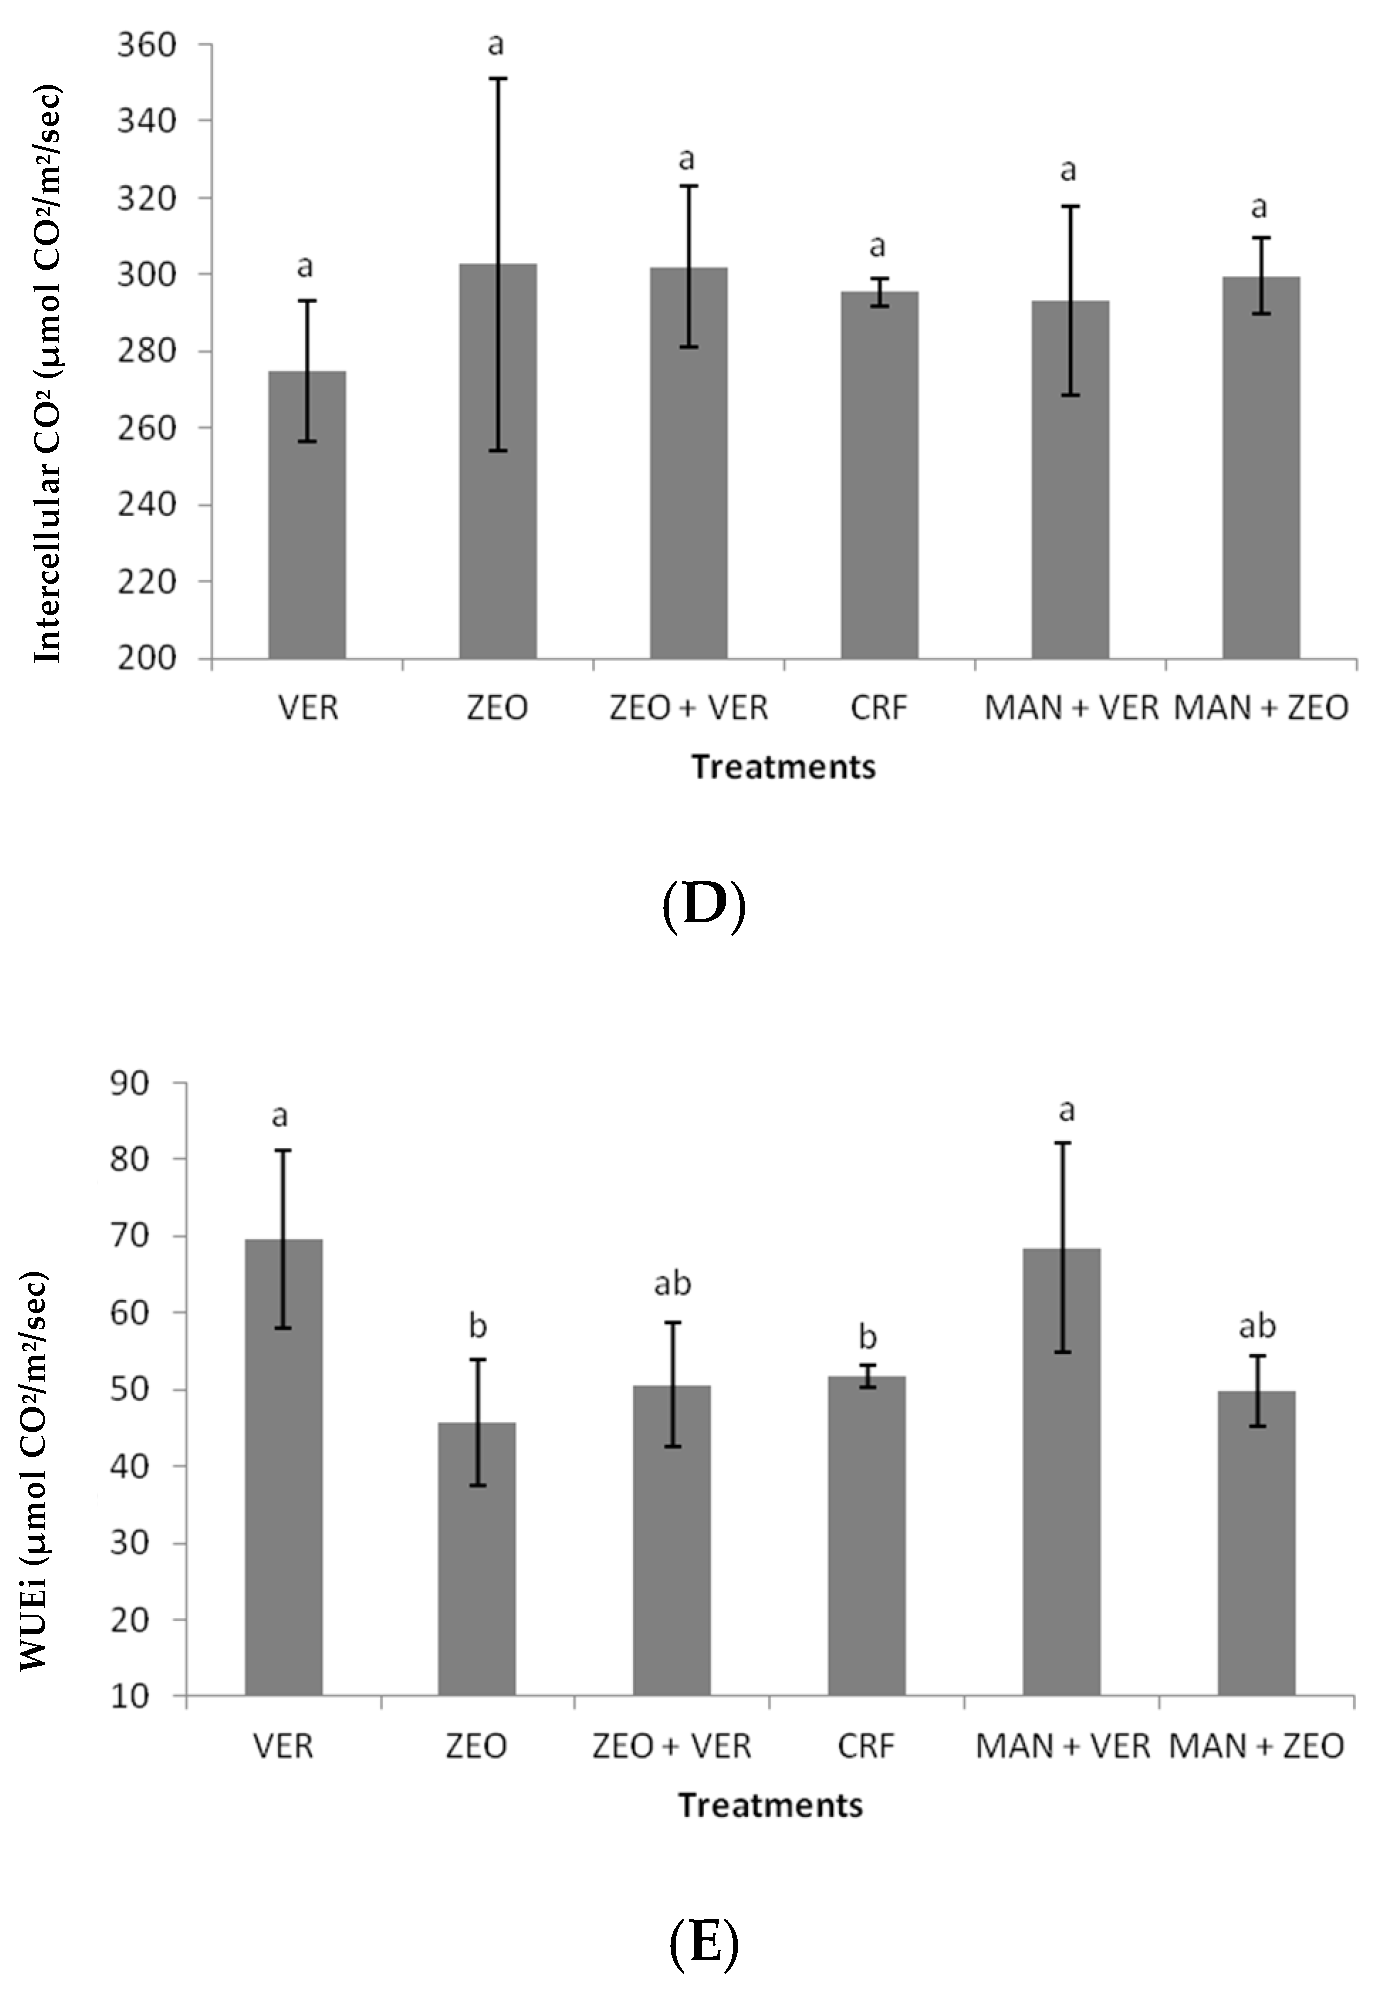
Figure 4B). This probably means that stomatal factors were responsible for the photosynthetic rate of CRF-treated plants, while nonstomatal factors (e.g., an increased activity of photosynthetic enzymes) were responsible for the photosynthetic rate of VER-treated plants. This is also confirmed by the statistically insignificant differences in intercellular CO2 concentrations among the treatments (Figure 4D). Additionally, the ZEO-treated plants exhibited a lower efficiency of the water-splitting complex on the donor side of PSII, as indicated by the decreased Fv/F0 ratio. In our experiment, the decreased Fv/F0 ratio in the ZEO-treated plants revealed a lower efficiency of the water-splitting complex on the donor side of PSII. The donor side photoinhibition mechanism elucidated photoinhibition by the malfunction of the water-splitting complex. If the water-splitting complex does not properly reduce the primary electron donor P680+, then P680+ might cause harmful oxidations in PSII. Finally, intrinsic water use efficiency (WUEi), which provides information on how efficiently water is used by plants, was significantly higher in the VER- and (MAN + VER)-treated plants, compared to ZEO- and CRF-treated plants. This proves that inorganic (ZEO, VER) and organic (MAN) soil amendments affected WUEi. Other researchers found that WUEi was influenced by K application, N fertilization, arbuscular mycorrhiza fungi (AMF) inoculation and this kind of organic fertilization [49,50,51,52].

5. Conclusions

Zeolite, vermiculite and goat manure application influenced soil fertility. In addition, significant differences in nutrient uptake among CRF and the other treatments were determined, since significant differences in foliar nutrient concentrations were recorded. Although for N, only inorganic fertilization (CRF) satisfied the N nutritional needs of pepper plants (leaf N: 3.84% D.W.), for the K uptake, zeolite (in its independent application, or in coapplication with vermiculite) showed very promising results (foliar K concentrations varied between 4.51% D.W. and 5.10% D.W.). A similar image was also obtained for fruit K concentrations, since the maximum K concentration was determined in the ZEO treatment (4.27% D.W.). Although K influences the qualitative characteristics of fruits, no clear conclusions were obtained in our study from the total soluble solids, total phenols and antioxidant activity (FRAP) of pepper fruits; thus, further research studies will be needed in the near future, under field conditions, to investigate the effect of K nutrition on pepper fruit quality. However, the application of soil amendments affected fruit quality characteristics, which is also supported by the results of other researchers. Plant biomass did not significantly differ among CRF and the other treatments; the same also happened for mean fruit weight. The optimum photosystem II (PSII) activity was recorded in the VER-treated plants or in the MAN + ZEO treatment, while the maximum photosynthetic rates were recorded both in VER- and CRF-treated plants. In the first case, it seemed that nonstomatal factors (e.g., an increased activity of photosynthetic enzymes) affected the photosynthetic activity of pepper plants, while in the second case, the CRF caused higher stomata opening. Finally, the intercellular CO2 concentration remained statistically unaffected among the treatments, while WUEi was affected by amendments’ application. It is believed that these data will constitute the first step towards revealing the effects of alternative sources of nutrients’ application on pepper plants’ nutrition, productivity and fruit quality. In addition, it is expected that our results will contribute towards a more sustainable approach of nutrient management for the Capsicum annuum L. crop. Of course, more research, under field conditions, will be necessary to draw more stable conclusions in comparative studies between inorganic fertilization and soil amendments’ application.

Author Contributions

Conceptualization, T.C.; methodology, T.C., G.T. and A.K.; software, A.P. and A.G.; validation, T.C., G.T. and A.K.; formal analysis, T.C., G.T. and A.K.; investigation, T.C., G.T., A.P., A.G. and A.K.; resources, T.C., A.P. and A.G.; data curation, G.T., A.P. and A.G.; writing—original draft preparation, T.C. and G.T.; writing—review and editing, T.C. and G.T. visualization, T.C.; supervision, T.C.; project administration, T.C. All authors have read and agreed to the published version of the manuscript.

Funding

This research was funded from the small-scale research projects of the Soil and Water Research Institute (ELGO ‘DIMITRA’).

Data Availability Statement

Not applicable.

Conflicts of Interest

The authors declare no conflict of interest.

References

  1. Altaf, Μ.A.; Shu, H.; Hao, Y.; Zhou, Y.; Mumtaz, M.A.; Wang, Z. Vanadium toxicity induced changes in growth, antioxidant profiling, and vanadium uptake in pepper (Capsicum annuum L.) seedlings. Horticulturae 2022, 8, 28. [Google Scholar] [CrossRef]
  2. Howard, L.R.; Talcott, S.Y.; Brenes, C.H.; Villalon, B. Changes in phytochemical and antioxidant activity of selected pepper cultivars (Capsicum sp.) as affected by maturity. J. Agric. Food Chem. 2000, 48, 1713–1720. [Google Scholar] [CrossRef] [PubMed]
  3. Gisbert-Mullor, R.; Pascual-Seva, N.; Martinez-Gimeno, M.A.; Lopez-Serrano, L.; Marin, E.B.; Perez-Perez, J.G.; Bonet, L.; Padilla, Y.G.; Calatayud, A.; Pascual, B.; et al. Grafting onto an appropriate rootstock reduces the impact on yield and quality of controlled deficit irrigated pepper crops. Agronomy 2020, 10, 1529. [Google Scholar] [CrossRef]
  4. Karakurt, Y.; Unlu, H.; Unlu, H.; Padem, H. The influence of foliar and soil fertilization of humic acid on yield and quality of pepper. Acta Agric. Scand. Sect. B-Soil Plant Sci. 2009, 59, 233–237. [Google Scholar] [CrossRef]
  5. Pinero, M.C.; Perez-Jimenez, M.; Lopez-Marin, J.; Del Amor, F.M. Fruit quality of sweet pepper as affected by foliar Ca applications to mitigate the supply of saline water under a climate change scenario. J. Sci. Food Agric. 2018, 98, 1071–1078. [Google Scholar] [CrossRef]
  6. Aminifard, M.H.; Aroiee, H.; Nemati, H.; Azizi, M.; Khayatt, M. Effect of nitrogen fertilizer on vegetative and reproductive growth of pepper plants under field conditions. J. Plant Nutr. 2012, 35, 235–242. [Google Scholar] [CrossRef]
  7. Xu, G.; Wolf, S.; Kafkafi, U. Effect of varying nitrogen form and concentration during growing season on sweet pepper flowering and fruit yield. J. Plant Nutr. 2001, 24, 1099–1116. [Google Scholar] [CrossRef]
  8. Xu, G.; Wolf, S.; Kafkafi, U. Interactive effect of nutrient concentration and container volume on flowering, fruiting and nutrient uptake of sweet pepper. J. Plant Nutr. 2001, 24, 479–501. [Google Scholar] [CrossRef]
  9. Xu, G.; Wolf, S.; Kafkafi, U. Ammonium on potassium interaction in sweet pepper. J. Plant Nutr. 2002, 25, 719–734. [Google Scholar] [CrossRef]
  10. Nabi, G.; Rafique, E.; Salim, M. Boron nutrition of four sweet pepper cultivars grown in boron-deficient soil. J. Plant Nutr. 2006, 29, 717–725. [Google Scholar] [CrossRef]
  11. Roosta, H.R.; Mohsenian, Y. Effects of foliar spray of different Fe sources on pepper (Capsicum annuum L.) plants in aquaponic system. Sci. Hortic. 2012, 146, 182–191. [Google Scholar] [CrossRef]
  12. Aminifard, Μ.H.; Aroiee, H.; Azizi, M.; Nemati, H.; Jaafar, H.Z.E. Effect of compost on antioxidant components and fruit quality of sweet pepper (Capsicum annuum L.). J. Cent. Eur. Agric. 2013, 14, 525–534. [Google Scholar] [CrossRef]
  13. Diaz-Perez, J.C.; Germishuizen, P.; Da Silva, A.L.B.R. Effect of compost application at transplant stage and before planting to the field on plant growth and fruit yield in bell pepper (Capsicum annuum L.). Com. Soil Sci. Plant Anal. 2021, 52, 2793–2802. [Google Scholar] [CrossRef]
  14. Singh, R.; Rathore, D. Effects of fertilization with textile effluent on germination, growth and metabolites of chilli (Capsicum annuum L.) cultivars. Environ. Process. 2021, 8, 1249–1266. [Google Scholar] [CrossRef]
  15. Assimakopoulou, A.; Dimitroulia, D.; Kosmidis, S.; Doula, M.K. Growth, yield and nutrient status of pepper plants grown on a soil substrate with olive mill waste sludge and natural zeolite addition. J. Plant Nutr. 2020, 43, 629–640. [Google Scholar] [CrossRef]
  16. Chatzistathis, T.; Tzanakakis, V.; Giannakoula, A.; Psoma, P. Inorganic and organic amendments affect soil fertility, nutrition, photosystem II activity, and fruit weight, and may enhance the sustainability of Solanum lycopersicon L. (cv. ‘Mountain Fresh’) crop. Sustainability 2020, 12, 9028. [Google Scholar] [CrossRef]
  17. Chatzistathis, T.; Papaioannou, E.; Giannakoula, A.; Papadakis, I.E. Zeolite and vermiculite as inorganic soil amendments modify root-shoot allocation, mineral nutrition, photosystem II activity and gas exchange parameters of chestnut (Castanea sativa Mill) plants. Agronomy 2021, 11, 109. [Google Scholar] [CrossRef]
  18. McLean, E. Soil pH and lime requirement. In Methods of Soil Analysis, Part 2: Chemical and Microbiological Properties; Page, A.L., Miller, R.H., Keeney, D.R., Eds.; Agronomy Monograph; ASA; SSSA: Madison, WI, USA, 1982; pp. 199–224. [Google Scholar]
  19. Gee, G.; Bauder, J. Particle-size analysis. In Methods of Soil Analysis, Part 1: Physical and Mineralogical Methods; Klute, A., Ed.; ASA; SSSA: Madison, WI, USA, 1986; pp. 383–411. [Google Scholar]
  20. Nelson, D.W.; Sommers, L.E. Total carbon, organic carbon and organic matter. In Methods of Soil Analysis, Part 2: Chemical and Microbiological Properties; Page, A.L., Miller, R.H., Keeney, D.R., Eds.; Agronomy Monograph; ASA; SSSA: Madison, WI, USA, 1982; pp. 539–547. [Google Scholar]
  21. Hood-Nowotny, R.; Umana, N.H.-N.; Inselbacher, E.; Oswald-Lachouani, P.; Wanek, W. Alternative Methods for Measuring Inorganic, Organic, and Total Dissolved Nitrogen. Soil Sci. Soc. Am. J. 2010, 74, 1018–1027. [Google Scholar] [CrossRef]
  22. Mulvaney, R. Nitrogen—Inorganic Forms. In Methods of Soil Analysis: Part 3 Chemical Methods 5; ASA; SSSA: Madison, WI, USA, 1996; pp. 1123–1184. [Google Scholar]
  23. Olsen, S.; Sommers, L. Phosphorus. In Methods of Soil Analysis, Part 2: Chemical and Microbiological Properties; Page, A.L., Miller, R.H., Keeney, D.R., Eds.; Agronomy Monograph; ASA; SSSA: Madison, WI, USA, 1982; pp. 403–430. [Google Scholar]
  24. Thomas, G.W. Exchangeable cations methods of soil analysis. In Methods of Soil Analysis, Part 2: Chemical and Microbiological Properties; Page, A.L., Miller, R.H., Keeney, D.R., Eds.; Agronomy Monograph; ASA; SSSA: Madison, WI, USA, 1982; pp. 159–166. [Google Scholar]
  25. Lindsay, W.L.; Norvell, W.A. Development of a DTPA soil test for zinc, iron, manganese, and copper. Soil Sci. Soc. Am. J. 1978, 42, 421–428. [Google Scholar] [CrossRef]
  26. Hansen, T.H.; De Bang, T.C.; Laursen, K.H.; Pedas, P.; Husted, S.; Schjoerring, J.K. Multielement plant tissue analysis using ICP spectrometry. In Plant Mineral Nutrients. Methods in Molecular Biology (Methods and Protocols); Maathuis, F., Ed.; Humana Press: Totowa, NJ, USA, 2013; Volume 953. [Google Scholar]
  27. Chapman, H.D.; Pratt, P.F. Methods of Analysis for Soils, Plants and Waters; Division of Agricultural Sciences, University of California: Riverside, CA, USA, 1961; p. 309. [Google Scholar]
  28. Chapin, F.S.; Van Cleve, K. Approaches to studying nutrient uptake, use and loss in plants. In Plant Physiological Ecology-Field Methods and Instrumentation; Pearcy, R.W., Ehleringer, J.R., Mooney, H.A., Rundel, P.W., Eds.; Springer: New York, NY, USA, 1991; pp. 185–207. [Google Scholar]
  29. Strasser, R.J.; Tsimilli-Michael, M.; Srivastava, A. Analysis of the chlorophyll a fluorescence transient. In Chlorophyll a Fluorescence: A Signature of Photosynthesis; Papageorgiou, G., Govindjee, G., Eds.; Springer: Dordrecht, The Netherlands, 2004; pp. 321–362. [Google Scholar]
  30. Schreiber, U.; Schliwa, U.; Bilger, W. Continuous recording of photochemical and non-photochemical chlorophyll fluorescence quenching with a new type of modulation fluorometer. Photosynth. Res. 1986, 10, 51–62. [Google Scholar] [CrossRef]
  31. Scalbert, A.; Monties, B.; Janin, G. Tannins in wood: Comparison of different estimation methods. J. Agric. Food Chem. 1989, 37, 1324–1329. [Google Scholar] [CrossRef]
  32. Benzie, I.F.F.; Strain, J.J. Ferric reducing/antioxidant power assay: Direct measure of total antioxidant activity of biological fluids and modified version for simultaneous measurement of total antioxidant power and ascorbic acid concentration. Methods Enzymol. 1999, 299, 15–27. [Google Scholar] [PubMed]
  33. Pappi, P.; Nikoloudakis, N.; Fanourakis, D.; Zambounis, A.; Delis, C.; Tsaniklidis, G. Differential Triggering of the Phenylpropanoid Biosynthetic Pathway Key Genes Transcription upon Cold Stress and Viral Infection in Tomato Leaves. Horticulturae 2021, 7, 448. [Google Scholar] [CrossRef]
  34. Doostikhah, N.; Panahpour, E.; Nadian, H.; Gholami, A. Tomato (Lycopersicon esculentum L.) nutrient and lead uptake affected by zeolite and DTPA in a lead-polluted soil. Plant Biol. 2020, 22, 317–322. [Google Scholar] [CrossRef] [PubMed]
  35. Bergmann, W. Ernahrungstorungen bei Kulturpflanzen; Gustav Fischer Verlag: Stuttgart, Germany, 1986. [Google Scholar]
  36. Therios, I. Mineral Nutrition of Plants; Dedousi Publications: Thessaloniki, Greece, 1996. (In Greek) [Google Scholar]
  37. Glisic, I.P.; Milosevic, T.M.; Glisic, I.S.; Milosevic, N.T. The effect of natural zeolites and organic fertilizers on the characteristics of degraded soils and yield of crops grown in western Serbia. Land Degrad. Dev. 2009, 20, 33–40. [Google Scholar] [CrossRef]
  38. Milosevic, T.; Milosevic, N.; Glisic, I.; Boskovic-Rakosevic, L.; Milivojevic, J. Fertilization effect on trees and fruits characteristics and leaf nutrient status of apricots which are grown at Cacak region (Serbia). Sci. Hortic. 2013, 164, 112–123. [Google Scholar] [CrossRef]
  39. Slewinski, T.L. Diverse functional roles of monosaccharide transporters and their homologs in vascular plants: A physiological perspective. Mol. Plant 2011, 4, 641–662. [Google Scholar] [CrossRef]
  40. Chen, L.Q.; Qu, X.Q.; Hou, B.H.; Sosso, D.; Osorio, S.; Fernie, A.R.; Frommer, W.B. Sucrose efflux mediated by SWEET proteins as a key step for phloem transport. Science 2012, 335, 207–211. [Google Scholar] [CrossRef]
  41. Payyavula, R.S.; Tschaplinski, T.J.; Jawdy, S.S.; Sykes, R.W.; Tuskan, G.A.; Kalluri, U.C. Metabolic profiling reveals altered sugar and secondary metabolism in response to UGPase overexpression in Populus. BMC Plant Biol. 2014, 14, 265. [Google Scholar] [CrossRef]
  42. Jeena, G.S.; Kumar, S.; Shukla, R.K. Structure, evolution and diverse physiological roles of sweet sugar transporters in plants. Plant Mol. Biol. 2019, 100, 351–365. [Google Scholar] [CrossRef]
  43. Geng, Y.; Wu, M.; Zhang, C. Sugar Transporter ZjSWEET2.2 mediates sugar loading in leaves of Ziziphus jujuba Mill. Front. Plant Sci. 2020, 11, 1081. [Google Scholar]
  44. Cui, Y.; Wang, Z.; Chen, S.; Vainstein, A.; Ma, H. Proteome and transcriptome analyses reveal key molecular differences between quality parameters of commercial-ripe and tree-ripe fig (Ficus carica L.). BMC Plant Biol. 2019, 19, 146. [Google Scholar] [CrossRef] [PubMed]
  45. Braun, D.M.; Wang, L.; Ruan, Y.L. Understanding and manipulating sucrose phloem loading, unloading, metabolism, and signaling to enhance crop yield and food security. J. Exp. Bot. 2014, 65, 1713–1735. [Google Scholar] [CrossRef]
  46. Wang, S.; Song, M.; Guo, J.; Huang, Y.; Zhang, F.; Xu, C.; Xiao, Y.; Zhang, L. The potassium channel FaTPK1 plays a critical role in fruit quality formation in strawberry (Fragaria × ananassa). Plant Biotechnol. J. 2018, 16, 737–748. [Google Scholar] [CrossRef]
  47. Ren, R.; Yue, X.; Li, J.; Xie, S.; Guo, S.; Zhang, Z. Co-expression of sucrose synthase and the sweet transporter, which are associated with sugar hydrolysis and transport, respectively, increases the hexose content in Vitis vinifera L. grape berries. Front. Plant Sci. 2020, 11, 321. [Google Scholar] [CrossRef] [PubMed]
  48. Dreyer, I.; Gomez-Porras, J.L.; Riedelsberger, J. The potassium battery: A mobile energy source for transport processes in plant vascular tissues. New Phytol. 2017, 216, 1049–1053. [Google Scholar] [CrossRef]
  49. Chatzistathis, T.; Papadakis, I.E.; Papaioannou, A.; Chatzissavvidis, C.; Giannakoula, A. Comparative study effects between manure application and a controlled release fertilizer on the growth, nutrient uptake, photosystem II activity and photosynthetic rate of Olea europaea L. (cv. ‘Koroneiki’). Sci. Hortic. 2020, 264, 109176. [Google Scholar] [CrossRef]
  50. Zhu, L.D.; Shao, X.H.; Zhang, Y.C.; Zhang, H.; Hou, M.M. Effects of K fertilizer application on photosynthesis and seedling growth of sweet potato under drought stress. J. Food Agric. Environ. 2012, 10, 487–491. [Google Scholar]
  51. Saykhul, A.; Chatzistathis, T.; Chatzissavvidis, C.; Koundouras, S.; Therios, I.; Dimassi, K. Potassium utilization efficiency of three olive cultivars grown in a hydroponic system. Sci. Hortic. 2013, 162, 55–62. [Google Scholar] [CrossRef]
  52. Zhang, J.; Jiang, X.; Miao, Q.; Yu, B.; Xu, L.; Cui, Z. Combining mineral amendments improves wheat yield and soil properties in a coastal saline area. Agronomy 2019, 9, 48. [Google Scholar] [CrossRef]
Figure 1. Main shoot length (cm) of the pepper plants among the treatments. The different letters on the bars signify statistically significant differences among the treatments, according to Duncan’s multiple range test, for p ≤ 0.05. VER: vermiculite; ZEO: zeolite; CRF: controlled-release fertilizer; MAN: manure.
Agronomy 12 01935 g001
Figure 2. Mean fruit weight (g/pot) of the pepper plants among the treatments. The different letters on the bars signify statistically significant differences among the treatments, according to Duncan’s multiple range test, for p ≤ 0.05. VER: vermiculite; ZEO: zeolite; CRF: controlled-release fertilizer; MAN: manure.
Agronomy 12 01935 g002
Figure 3. Photosystem II activity, as expressed by the chlorophyll fluorescence parameters Fv/Fm (A), Fv/F0 (B) and performance index (C), of pepper plants among the treatments. The different letters on the bars signify statistically significant differences among the treatments, according to Duncan’s multiple range test, for p ≤ 0.05. VER: vermiculite; ZEO: zeolite; CRF: controlled-release fertilizer; MAN: manure.
Agronomy 12 01935 g003
Figure 4. Photosynthetic rate (A), stomatal conductance (B), transpiration rate (C), intercellular CO2 concentration (D) and intrinsic water use efficiency (E) of pepper plants among the treatments. The different letters on the bars signify statistically significant differences among the treatments, according to Duncan’s multiple range test, for p ≤ 0.05. VER: vermiculite; ZEO: zeolite; CRF: controlled-release fertilizer; MAN: manure.
Agronomy 12 01935 g004aAgronomy 12 01935 g004b
Figure 5. Total soluble solids (A), total phenols (B) and antioxidant activity (FRAP) (C) of pepper plants among the treatments. The different letters on the bars signify statistically significant differences among the treatments, according to Duncan’s multiple range test, for p ≤ 0.05. VER: vermiculite; ZEO: zeolite; CRF: controlled-release fertilizer; MAN: manure.
Agronomy 12 01935 g005aAgronomy 12 01935 g005b
Figure 6. Relative gene transcript accumulation for KC1 (A), SW2 (B), N3 (C), SPS (D) and UGPase (E) among the treatments. The different letters on the bars signify statistically significant differences among the treatments, according to Duncan’s multiple range test, for p ≤ 0.05. VER: vermiculite; ZEO: zeolite; CRF: controlled-release fertilizer; MAN: manure.
Agronomy 12 01935 g006aAgronomy 12 01935 g006bAgronomy 12 01935 g006c
Table 1. Fresh weight (F.W.) and dry weight (D.W.) of the different plant tissues (leaves, stems and root) of pepper plants among the treatments.
TreatmentLeavesStemsRoot(Leaves + Stem)/RootTotal Biomass (g)
F.W.D.W.F.W.D.W.F.W.D.W.D.W.F.W.D.W.
VER101.77 a20.38 a123.16 a29.25 ab70.80 ab11.94 a3.93 a297.36 a62.32 a
ZEO56.72 b11.58 b84.34 ab21.30 ab88.21 a14.05 a2.25 b229.27 a46.93 a
ZEO + VER64.62 b10.86 b80.92 b22.12 ab80.62 ab13.14 a2.53 b208.09 a46.13 a
CRF70.75 ab13.86 ab84.12 ab20.76 b57.86 b11.18 a3.11 ab212.74 a45.80 a
MAN + VER.60.23 b13.40 b96.90 ab27.41 ab71.93 ab12.11 a3.40 a229.06 a52.92 a
MAN + ZEO78.67 ab18.76 ab120.02 a33.06 a95.18 a13.06 a3.52 a293.88 a65.73 a
The values are means of 6 replicates; the different letters, in the same column, signify statistically significant differences among the treatments, according to Duncan’s multiple range test, for p ≤ 0.05. VER: vermiculite; ZEO: zeolite; CRF: controlled-release fertilizer; MAN: manure.
Table 2. Elongation rate (cm/day) of the main shoot of pepper plants during the 5 months of the experiment.
TreatmentMonth of the Year
MayJuneJulyAugustSeptember
VER0.43 b0.21 b1.47 a0.22 a0.56 a
ZEO0.70 a0.34 ab0.90 b0.13 bc0.37 b
ZEO + VER0.40 b0.45 a1.03 ab0.09 c0.42 ab
CRF0.40 b0.30 ab0.82 b0.20 ab0.49 a
MAN + VER.0.83 a0.26 b1.05 ab0.26 a0.40 ab
MAN + ZEO0.71 a0.20 b0.96 ab0.21 ab0.25 c
The values are means of 6 replicates; the different letters, in the same column, signify statistically significant differences among the treatments, according to Duncan’s multiple range test, for p ≤ 0.05. VER: vermiculite; ZEO: zeolite; CRF: controlled-release fertilizer; MAN: manure.
Table 3. Foliar nutrient concentrations in pepper plants among the treatments.
TreatmentNPKCaMgFeMnZnCu
% D.W.mg kg−1
VER2.73 b0.28 b2.62 bc2.03 a0.87 ab67 a92 b62 a632 b
ZEO1.80 c0.44 a4.51 a1.57 a0.48 c32 c89 b51 ab944 a
VER + ZEO1.60 c0.30 b5.10 a1.57 a0.55 c43 b90 b55 a838 a
CRF3.84 a0.39 ab2.00 c2.04 a1.12 a63 a226 a48 ab828 a
MAN + VER1.50 c0.47 a2.99 b1.76 a0.75 b30 c71 c42 b839 a
MAN + ZEO1.43 c0.29 b2.86 b1.59 a0.58 c39 bc84 bc50 ab725 ab
The values are means of 6 replicates; the different letters, in the same column, signify statistically significant differences among the treatments, according to Duncan’s multiple range test, for p ≤ 0.05. VER: vermiculite; ZEO: zeolite; CRF: controlled-release fertilizer; MAN: manure.
Table 4. Total plant nutrient content for pepper plants among the treatments.
TreatmentNPKCaMgFeMnZnCu
mg
VER1093 a114 b1078 ab849 a377 a26 b3.22 b2.82 a15.33 a
ZEO605 b100 b1073 ab443 b186 b34 ab2.76 bc2.13 a14.86 a
VER + ZEO549 b115 b1265 ab444 b209 b39 a3.73 ab2.26 a16.18 a
CRF1034 a116 b520 c548 b367 a27 b4.55 a2.29 a14.84 a
MAN + VER685 b201 a922 b572 b315 a23 b2.34 c2.15 a14.07 a
MAN + ZEO692 b161 ab1443 a843 a380 a29 b3.39 b2.14 a17.20 a
The values are means of 6 replicates; the different letters, in the same column, signify statistically significant differences among the treatments, according to Duncan’s multiple range test, for p ≤ 0.05. VER: vermiculite; ZEO: zeolite; CRF: controlled-release fertilizer; MAN: manure.
Table 5. Fruit nutrient concentrations in pepper plants among the treatments.
TreatmentNPKCaMgFeMnZnCu
% d.w.mg kg−1
VER2.45 b0.75 bc2.00 c0.13 a0.16 ab52 b13 ab22 ab12 c
ZEO2.27 cd0.71 bc4.27 a0.12 ab0.15 ab47 bc13 ab20 ab6 d
VER + ZEO2.53 b0.77 b2.78 b0.12 ab0.18 a62 a15 a21 ab14 b
CRF3.09 a0.86 a2.27 bc0.12 ab0.15 ab59 ab14 a23 a21 a
MAN + VER2.15 d0.74 bc3.23 b0.12 ab0.17 a51 bc12 bc18 bc8 d
MAN + ZEO2.34 c0.68 c2.21 bc0.10 b0.14 b45 c11 c16 c3 e
The values are means of 6 replicates; the different letters, in the same column, signify statistically significant differences among the treatments, according to Duncan’s multiple range test, for p ≤ 0.05. VER: vermiculite; ZEO: zeolite; CRF: controlled-release fertilizer; MAN: manure.
Table 6. Nutrient use efficiency of pepper plants among the treatments.
TreatmentNUEPUEKUECaUEMgUEFeUEMnUEZnUECuUE
mg Total Plant d.w./mg of Macronutrientmg Total Plant d.w./μg of Micronutrient
VER59.42 b514.20 a47.76 b75.32 b163.75 b2.26 a19.51 a21.70 a4.11 a
ZEO78.27 a390.69 ab39.69 bc105.05 a253.34 a1.26 c13.40 b19.73 a3.29 a
VER + ZEO81.82 a470.98 a35.82 c97.89 a246.21 a1.73 b12.83 bc20.71 a3.74 a
CRF45.00 b397.54 ab87.92 a78.64 b128.31 b1.67 bc10.45 c20.39 a3.84 a
MAN + VER76.91 a266.30 b57.08 b94.39 a176.15 ab2.11 ab22.86 a24.59 a3.81 a
MAN + ZEO85.99 a433.46 a49.25 b86.72 ab175.36 ab2.38 a17.49 ab27.89 a4.02 a
The values are means of 6 replicates; the different letters, in the same column, signify statistically significant differences among the treatments, according to Duncan’s multiple range test, for p ≤ 0.05. VER: vermiculite; ZEO: zeolite; CRF: controlled-release fertilizer; MAN: manure.
Publisher’s Note: MDPI stays neutral with regard to jurisdictional claims in published maps and institutional affiliations.

