Article

Salt-Induced Autophagy and Programmed Cell Death in Wheat

by
Larisa I. Fedoreyeva
1,*,
Elena M. Lazareva
1,2,
Olga V. Shelepova
1,3,
Ekaterina N. Baranova
1,3 and
Neonila V. Kononenko
1
1
All-Russia Research Institute of Agricultural Biotechnology, Timiryazevskaya 42, 127550 Moscow, Russia
2
Biological Department, M.V. Lomonosov Moscow State University, Leninskie Gory 1, 119991 Moscow, Russia
3
N.V. Tsitsin Main Botanical Garden of Russian Academy of Sciences, Botanicheskaya 4, 127276 Moscow, Russia
*
Author to whom correspondence should be addressed.
Agronomy 2022, 12(8), 1909; https://doi.org/10.3390/agronomy12081909
Submission received: 7 July 2022 / Revised: 3 August 2022 / Accepted: 8 August 2022 / Published: 14 August 2022
(This article belongs to the Special Issue Advances in Plant Physiology of Abiotic Stresses)

Abstract

:
The high salinity of soil salts limits plant growth. Wheat is sensitive to toxic levels of mineral salts. Salinity leads to the accumulation of toxic ions in all organs of wheat. Depending on the level of ion accumulation, wheat is defined as salt stress-tolerant or -sensitive. The wheat variety Zolotaya accumulated Cl and Na+ ions to a greater extent than the Orenburgskaya 22 variety. The accumulation of toxic ions was accompanied by an increase in ROS and an increase in damage to root tissues up to 80% in the Zolotaya variety. The formation of autophagosomes is considered a defense mechanism against abiotic stresses in plants. At a concentration of 150 mM NaCl, an increase in the expression level of TOR, which is a negative regulator of the formation of autophagosomes, occurred. The level of TOR expression in the Zolotaya variety was 2.8 times higher in the roots and 3.8 times higher in the leaves than in the Orenburgskaya 22 variety. Under the action of salinity, homeostasis was disturbed in the root cells and ROS production accumulated. In the unstable variety Zolotaya, ROS was found in the cap zone and the root meristem in contrast to the resistant variety Orenburgskaya 22 in which ROS production was found only in the cap zone. Accumulation of ROS production triggered autophagy and PCD. PCD markers revealed DNA breaks in the nuclei and metaphase chromosomes, cells with a surface location of phosphatidylserine, and the release of cytochrome c into the cytoplasm, which indicates a mitochondrial pathway for the death of part of the root cells during salinity. Based on electron microscopy data, mitophagy induction was revealed in wheat root and leaf cells under saline conditions.

1. Introduction

Wheat is one of the most important grain crops. Soil salinity is the most common abiotic stress that inhibits crop growth and yield. A high concentration of sodium chloride has a negative effect on all aspects of plant physiology and metabolism, mainly due to the disruption of the ionic and osmotic balance of cells. Plant resistance to salinity is due to the presence of specific and/or nonspecific mechanisms for ensuring stable metabolism, growth, and development in plant ontogenesis associated with sensitivity to one or more types of stress factors, namely, osmotic, oxidative, and toxic stress effects of NaCl [1]. Mechanisms of salt tolerance include the excretion of Na+ and Cl ions from vacuoles, blocking the transport of Na+ ions into the cell, exclusion of Na+ from the transpiration flow, and some other mechanisms [2]. High concentrations of Na+ ions are toxic for cell metabolism and can inhibit the activity of many important enzymes, cell division and reproduction, membrane disorganization, and osmotic imbalance, which can ultimately lead to growth inhibition and even plant death. In saline soils, high levels of sodium ions lead to inhibition of plant growth and even death.
The program of cell death is genetically inherent in multicellular organisms. Ontogenesis is impossible without the elimination of individual cells, tissue sections, and even entire organs. Programmed cell death (PCD) is necessary for the normal functioning of the organism in terms of removing diseases and terminating the life cycle of mutated dangerous cells and replacing them with new cells [3,4]. Cell death occurs constantly, not only as a result of pathologies in the body but also as a necessary process during normal life. The destruction and death of cells plays an important role during the period of embryonic development during organ laying and tissue differentiation. The aging process can also be considered to be a form of programmed cell death. However, the absence or excess of cell death is pathological and may be a main cause of disease. Thus, cell death responses must be tightly controlled and well-balanced with cell growth and division to ensure cellular and organismal survival. The regulation of life and death processes involves complex cellular pathways that include metabolic and hormonal signals, as well as abiotic and biotic stresses [5,6,7].
Programmed cell death comprises a series of events which occur in different tissue cells that are programmed to die but with a specific positive effect related to the function of the cell, the tissue itself, or full organism [8]. In land plants, this process can occur in many different highly specialized tissues in relation to their developmental stage; for instance, in the tapetum cells during their lysis, prior to pollen release [9,10], during the death of abnormal megaspores during megasporogenesis in angiosperms [11] by forming antipodal cells [12], or for nucellus dissolution during gametophyte formation [13]. Furthermore, we can see the formation of different tissue structures, such as absorbing trichomes [14] and nectary [15], involving some PCD and autophagic events. Processes associated with an increase in reactive oxygen species (ROS) and their neutralization by organelles have a special role in the processes of programmed cell death [16].
Autophagy is the main pathway for the degradation and processing of cytoplasmic material, including individual proteins, aggregates, and whole organelles [17]. In plants, the role of autophagy in the regulation of programmed cell death (PCD) is still a matter of controversy; however, recent evidence has led to a consensus that autophagy can both promote and limit various forms of PCD [18,19]. In the past few years, the study of autophagy in plants has intensified. It has expanded through studies of the model plant Arabidopsis thaliana, photosynthetic organisms, including aquatic photosynthetic eukaryotes [20], gymnosperms [21], and angiosperms, including monocots [22] and dicots [23]. In addition, new data have emerged on the role of autophagy in cell survival [24] and cell death [25].
Autophagy is involved in almost every aspect of plant life, including germination, seedling formation, development, reproduction, metabolism, and plant responses to biotic and abiotic stresses, including malnutrition, oxidation, osmosis, drought, and pathogenic infections [26,27].
Despite the fact that the study of autophagy in plants is lagging significantly behind the study of the process of autophagy in mammals and yeast, some mechanisms that function in plants have recently been revealed [28,29]. The autophagy process proceeds through the formation of autophagosomes [30]. Under the action of signals initiating macroautophagy, the so-called phagophore is formed, which consists of a lipid membrane and a number of autophagy-related proteins (ATG) encoded by ATG genes or ATG gene homologues. With the help of a complex system of regulation, multicomponent complexes are assembled, the membrane grows, and an open structure is formed. Then, the bilayer membrane closes, and inside the resulting vesicle called autophagosome are macromolecules and organelles (ribosomes, mitochondria, and fragments of the endoplasmic reticulum). Autophagosomes are two membrane vesicles separating part of the cytoplasm. It is believed that, ultimately, the outer membrane of the autophagosome fuses with the vacuole (in yeast and plants) or lysosome (in mammals) to release cytoplasmic material for hydrolytic degradation. More than 30 genes associated with autophagy (ATG) are involved in the processes of membrane remodeling and transport [31,32].
Autophagy-related ATG proteins play an essential role in the process of programmed cell death. The autophagy process is highly conserved, and ATG orthologues are present in fungi, plants, and mammals [33,34]. Autophagic proteins regulate the formation of a double membrane-coated phagophore assembly (PAS, also known as the pre-autophagosomal structure), which then expands to form autophagosomes 500–1000 nm in diameter, and the subsequent fusion of these vesicles with lysosomal or vacuolar compartments to degrade the components [35].
Proteins that are essential for the autophagy process have been grouped into four major functional groups [36,37]. The first group includes the ATG1/ATG13 kinase complex, which initiates the formation of autophagosomes in response to signals of the cell’s need for nutrients, as well as to various stress factors. Further, ATG9 contributes to the expansion of the phagophore by moving membrane components from different sources, and the complex with ubiquitin-like proteins ATG8/ATG12 is involved in the expansion of the phagophore and its maturation [37]. The ATG5-ATG12/ATG16 complex functions as an E3 ligase that transfers phosphoethanoamine (PE) to ATG8 in vitro [38] to produce the autophagosome-localized lipid form of ATG8-PE [29,39].
Redox metabolism in plant cells inevitably includes the formation of ROS. There is evidence that ROS signals may be the primary targets of autophagy [16]. The ROS molecule can function as a signaling molecule to trigger autophagy as a survival mechanism [40]. Autophagy has been shown to be strongly induced by oxidative stress [41]. Oxidative stress in wheat roots caused by prooxidants paraquat and salicylic acid leads to intensive formation of autophagosomes [42]. Dysregulation of autophagy leads to increased oxidative stress, as shown by inhibitory and knockout studies [43,44].
Although autophagy appears to be involved in plant responses to high salinity and osmotic and drought stresses [45], its precise role has yet to be determined. Salt and osmotic stress can also increase ROS production and cause protein damage; one possibility is that autophagy may be responsible for the degradation of oxidized proteins under salt and osmotic stress [46].
The aim of this study was to diagnose tissue damage in durum and soft wheat as a result of the action of sodium chloride at the stage of seedlings and the pathway of cell death of damaged tissues using PCD markers.

2. Materials and Methods

2.1. Plant Material

Two varieties of spring wheat Triticum durum Desf. Zolotaya (2n = 28) and Triticum aestivum L. Orenburgskaya 22 (2n = 42), developed by the Orenburg Research Institute of Agriculture of the steppe ecological group (FGBNU, Federal Scientific Center of the Russian Academy of Sciences, Orenburg, Russia), were used in this study. The sensitivity of wheat seedlings to salinity was assessed using the roll culture method [47]. Seedlings were grown in the presence of 150 mM NaCl, which corresponds to an osmotic pressure of 6 atm, at 24 °C under a 10 h light/14 h dark photoperiod and fluorescent lamps (5000 lx). After 10 days of growth (or 4 days, depending on the task), the fresh plant biomass, root length, and shoot length were measured. Data are expressed as mean ± standard deviation (SD; n = 30), and significant differences were determined p < 0.05.

2.2. Ion Detection

The cell walls of 10-day-old wheat shoots and roots (100–300 mg in 25 mL of deionized water) were destroyed by ultrasonication in an apparatus (Sapfir, Moscow, Russia) at 35 kHz for 30 min at 40 °C. The resulting suspension was filtered on a 0.45 μm Millipore membrane. Samples were analyzed on an ITAN ionometer (TomskAnalit, Tomsk, Russia). The content of ions in mg/L in the samples was determined from the calibration graph. The content of electrolytes in the samples was determined by the electrical conductivity of the solution using an Expert-002 conductometer (Ekoniks, Tomsk, Russia).

2.3. Trypan Blue Staining

Coleoptiles of 10-day-old seedlings were stained with 0.5% trypan blue for 5 min and then washed three times. Samples were visualized by light microscopy (Olympus BX51 microscope; 10× lens) and photographed using a Color View digital camera (Germany).

2.4. Fluorescence Microscopy

Root tips (4–5 mm) of all 10-day-old seedlings were excised and placed on a glass slide in a drop of water (five root tips per glass slide). To determine ROS levels in cells, the root tips were incubated in 25–50 nM carboxy-H2DFFDA (Thermo Fisher Scientific, Waltham, MA, USA) for 30 min and then washed three times with distilled water. The root tip samples were analyzed under Olympus BX51 fluorescence microscope (Japan), fitted with 10× objective lens, at a wavelength of 490 nm. Images were obtained using Color View digital camera (Germany).

2.5. Transmission Electron Microscopy (TEM)

Root apex segments of 4-day-old seedlings (4 mm) were fixed for 24 h in 2.5% glutaraldehyde (Merck, Darmstadt, Germany) dissolved in 0.1 M Sorensen’s phosphate buffer with 1.5% sucrose (pH 7.2). Then, the samples were washed and post-fixed in 1% OsO4 (Sigma-Aldrich, St. Louis, MO, USA) and dehydrated in ethanol of increased concentrations (30, 50, 70, 96, and 100%) and in propylene oxide (Fluka, Nuremberg, Germany). The samples were embedded in a mixture of Epon-812 and Araldite (Merck, Darmstadt, Germany) according to the standard procedure. For TEM, the embedded samples were sectioned using an ultramicrotome LKB-III (LKB, Sweden), placed on formvar coated grids, and stained with uranyl acetate and lead citrate. The ultrathin sections were examined and photographed with an electron microscope H-300 (Hitachi, Tokyo, Japan). The ultrastructure of mitochondria at root parenchyma cells was studied.

2.6. Apoptosis Detection Assay

Root apex segments of 4-day-old seedlings (15 mm) were cut off and fixed in a solution of 4% paraformaldehyde (Sigma Aldrich, St. Louis, MO, USA) in PHEM buffer pH = 6.9 (60 mM PIPES (Sigma Aldrich, St. Louis, MO, USA), 25 mM HEPES (Sigma Aldrich, St. Louis, MO, USA), 10 mM EGTA (Sigma Aldrich, St. Louis, MO, USA), and 2 mM MgCl2 (Sigma Aldrich, St. Louis, MO, USA) for 1.5–2 h at room temperature. The fixative was washed in PHEM buffer.
To prepare preparations of macerated cells (without a cell wall), fixed root tips were incubated for 10–15 min in 0.4 M mannitol containing 1% cellulase (Sigma Aldrich, St. Louis, MO, USA) and 5 mM EGTA, washed in PBS buffer (2 times for 10 min), transferred to a drop of buffer onto a coverslip, and divided into cells with metal needles. The finished preparations were dried in a refrigerator at +4 °C for 24 h.
To identify root tissue cells at the stages of programmed cell death (PCD) under salinity, phosphatidylserine was detected using Xpert Annexin V-FITC Apoptosis Detection Assay (Grisp, Spain). A total of (100 µL) of Annexin V-FITC solution was used at a dilution of 5 µL per 500 µL of reaction buffer, incubated for 30 min in the dark at 22 °C, washed 3 times for 5 min, transferred to drops (100 µL) of propidium iodide at a dilution of 10 µL at 500 µL, washed twice for 5 min, and mounted in Mowiol U-44 (Hoechst, Frankfurt, Germany) supplemented with DAPI (1 µL/1 mL) (4,6-diamidino-2-phenilindole) (Sigma Aldrich, St. Louis, MO, USA).

2.7. TUNEL Analysis

Nuclear DNA breaks were detected by the terminal deoxynucleotidyl transferase dUTP nick end labeling (TUNEL) method. Preparations with macerated cells were permeabilized in a 0.5% solution of Triton X100 in PBS for 30 min, then after washing twice with buffer, they were placed in cocodelate buffer (pH 7.4) containing terminal deoxynucleotidyltransferase 20 units/µL (Silex, Moscow, Russia), 3′ labeled probes with 10 mM dATP (Silex, Moscow, Russia), and 1 mM fluorescein (Silex, Moscow, Russia). The reaction was stopped by placing the preparations in a 2× SSC solution for 15 min. After washing twice with buffer, preparations were mounted in Mowiol U-44 (Hoechst, Frankfurt, Germany) supplemented with DAPI (1 µL/1 mL).

2.8. Cytochrome c Detection

For immunocytochemical detection of cytochrome c, the preparations were placed in PHEM buffer for 5 min and transferred for 30 min to a solution of 0.5% Triton X-100 in PHEM buffer containing 5% DMSO. Then, it was washed in PBS (pH 7.4) and incubated for 16–18 h at room temperature with rabbit polyclonal antibodies to cytochrome c at a dilution of 1:100 in PBS (pH 7.4) containing 0.1% BSA. Then, the preparations were washed and incubated with goat anti-rabbit Igl antibodies conjugated with Texas Red (Sigma, St. Louis, MO, USA) at a dilution of 1:25 for 45 min at 37 °C, washed, stained with DAPI, and enclosed in Mowiol U-88 (Hoechst, Frankfurt, Germany). All obtained preparations were analyzed using an Axiovert 200 M microscope (Zeiss, Oberkochen, Germany) with epifluorescent illumination and a Neofluar ×10 and ×20 objective. Images were obtained using an AxioCam HRm camera.

2.9. Total RNA Isolation and Gene Expression Analysis

Total RNA was isolated from individual shoots and roots using reagent kits for the isolation of RNA-Extran RNA Syntol (Russia), according to the instructions. Then, cDNA was synthesized by reverse transcription using a standard method (Synthol, Moscow, Russia). The concentration of cDNA was determined spectrophotometrically on a nanophotometer IMPLEN.
To analyze gene expression, the cDNA was amplified by a real-time polymerase chain reaction (RT-PCR) using SYBR Green I (Syntol) on CFX 96 Real-Time System thermal cycler (BioRad, Hercules, CA, USA). Information on the structure of Triticum aestivum genes was obtained from the National Center for Biotechnology Information (NCBI). Gene-specific primers were designed using NCBI Primer-BLAST and synthesized by Syntol. The RT-PCR was carried out under the following conditions: 95 °C for 5 min, then 45 cycles of 94 °C for 30 s, 59 °C for 30 s, and 72 °C for 30 s. Each RT-PCR reaction was performed in three replicates.

2.10. Statistical Methods

The calculation of the main statistical parameters was carried out according to standard methods, and Statistica 6.0 and STATAN programs for statistical data processing were used. Values are presented as means ± standard deviation of the three biological replicates. All of the treatment effects were statistically analyzed using the Student’s t-test (DPS software). Different letters indicate significant differences at p< 0.05.

3. Results

3.1. Morphometric Parameters

The impact of salinity in the studied wheat varieties caused a decrease in the growth of both the root system and aboveground organs (Figure 1). Morphometric evaluation of seedlings made it possible to assess the changes more clearly. As can be seen from Figure 1C,D, the variety Orenburgskaya 22 was more stable in the height of the aboveground part in the presence of 150 mM NaCl. In contrast to the variety Orenburgskaya 22, where the decrease in the length of the shoot was about 40%, that in the variety Zolotaya was 65%. Thus, the difference in the reduction in the length of the shoot between wheat varieties was about 25% in the presence of 150 mM NaCl. When salinized with sodium chloride, the difference between varieties along the length of the root was about 20%. Chloride salinity causes various morphological changes in varieties associated with changes in the habitus of plants and the shape of their organs.

3.2. Ionic Detection

The genotypes of shoots and roots of wheat showed a different reaction in relation to the accumulation of Na+ and K+ cations and chloride ions. Since the roots are in direct contact with the soil and absorb nutrients, a higher accumulation of Na+ was observed in the roots compared to the control. Orenburgskaya 22, according to morphometric parameters, is a salt-tolerant wheat variety compared to the Zolotaya variety. The tolerance of plant organisms to high concentrations of toxic ions is determined by various mechanisms of excretion and control over the content of ions in tissues [48,49].
From the results obtained (Table 1), it follows that Na+ enters the roots of the resistant variety Orenburgskaya 22 to a limited extent, then the ions are transported to the shoots. In the unstable variety Zolotaya, accumulation of Na+ ions was observed both in the roots and in the shoots, which may indicate that the mechanisms of excretion of ions from the xylem into the root vacuoles, as well as the outflow of excess Na+ ions from the shoots, are disturbed in the variety Zolotaya. The results showed that the salt-tolerant variety retained K+-to-Na+ selectivity and maintained a lower Na+/K+ ratio in the shoots under stress, while the tolerant Zolotaya variety had an imbalance in the ion ratio.
Comparison of the distribution of Na+ between shoot and root tissues under control conditions revealed the accumulation of Na+ at a higher concentration in the shoot, indicating that the shoot is the main Na+ accumulator. However, when growing wheat in the presence of 150 mM NaCl, an excess of Na+ and Cl accumulated in the roots. It should be noted that while the content of Na+ ions in the roots under stress increased in Orenburgskaya 22 and Zolotaya almost the same (by 3.9 and 4.0 times, respectively), the content of chloride ions in the Zolotaya variety turned out to be significantly higher than in the resistant variety Orenburgskaya 22 (by 8.0 and 5.5 times, respectively).
The electrical conductivity parameter is proportional to the concentration of electrolytes and reflects the degree of accumulation of the sum of ions (K+/Na+/Cl) in wheat tissues. The lowest electrical conductivity was in the roots of the Orenburgskaya 22 variety, and the highest was in the roots of the Zolotaya variety in the presence 150 mM NaCl. In the control in the roots, the electrical conductivity of both varieties was approximately the same. However, in the presence of an increased concentration of NaCl, the sum of ions accumulated in the roots of the unstable variety Zolotaya compared to Orenburgskaya 22 (by 3.5 and 2.4 times, respectively).

3.3. Expression of Gene HKT

The expression of HKT1;4 and HKT2;1 genes, class 1 and 2 ion transporters, was studied in the shoots and roots of wheat varieties Orenburgskaya 22 and Zolotaya (Figure 2).
The level of expression of HKT1;4 and HKT2;1 in variety Orenburgskaya 22 in the root was approximately equal to each other but almost two times higher than in the shoots. Although in the presence of 150 mM NaCl, the expression level of HKT2.1 increased slightly (only by 1.1 times) in the root, we suggest that the role of the class 2 ion transporter, which removes both K+ and Na+ ions, in salt stress increases compared to the class 1 ion transporter, since its expression level decreased by 1.2 times. In the shoot, the activity of genes of both classes decreased in the presence of sodium chloride. It was noted that in the shoot, the level of expression of the HKT1;4 ion transporter under control conditions in the Zolotaya variety was higher than in the Orenburgskaya 22 variety.

3.4. Expression of AFG Genes
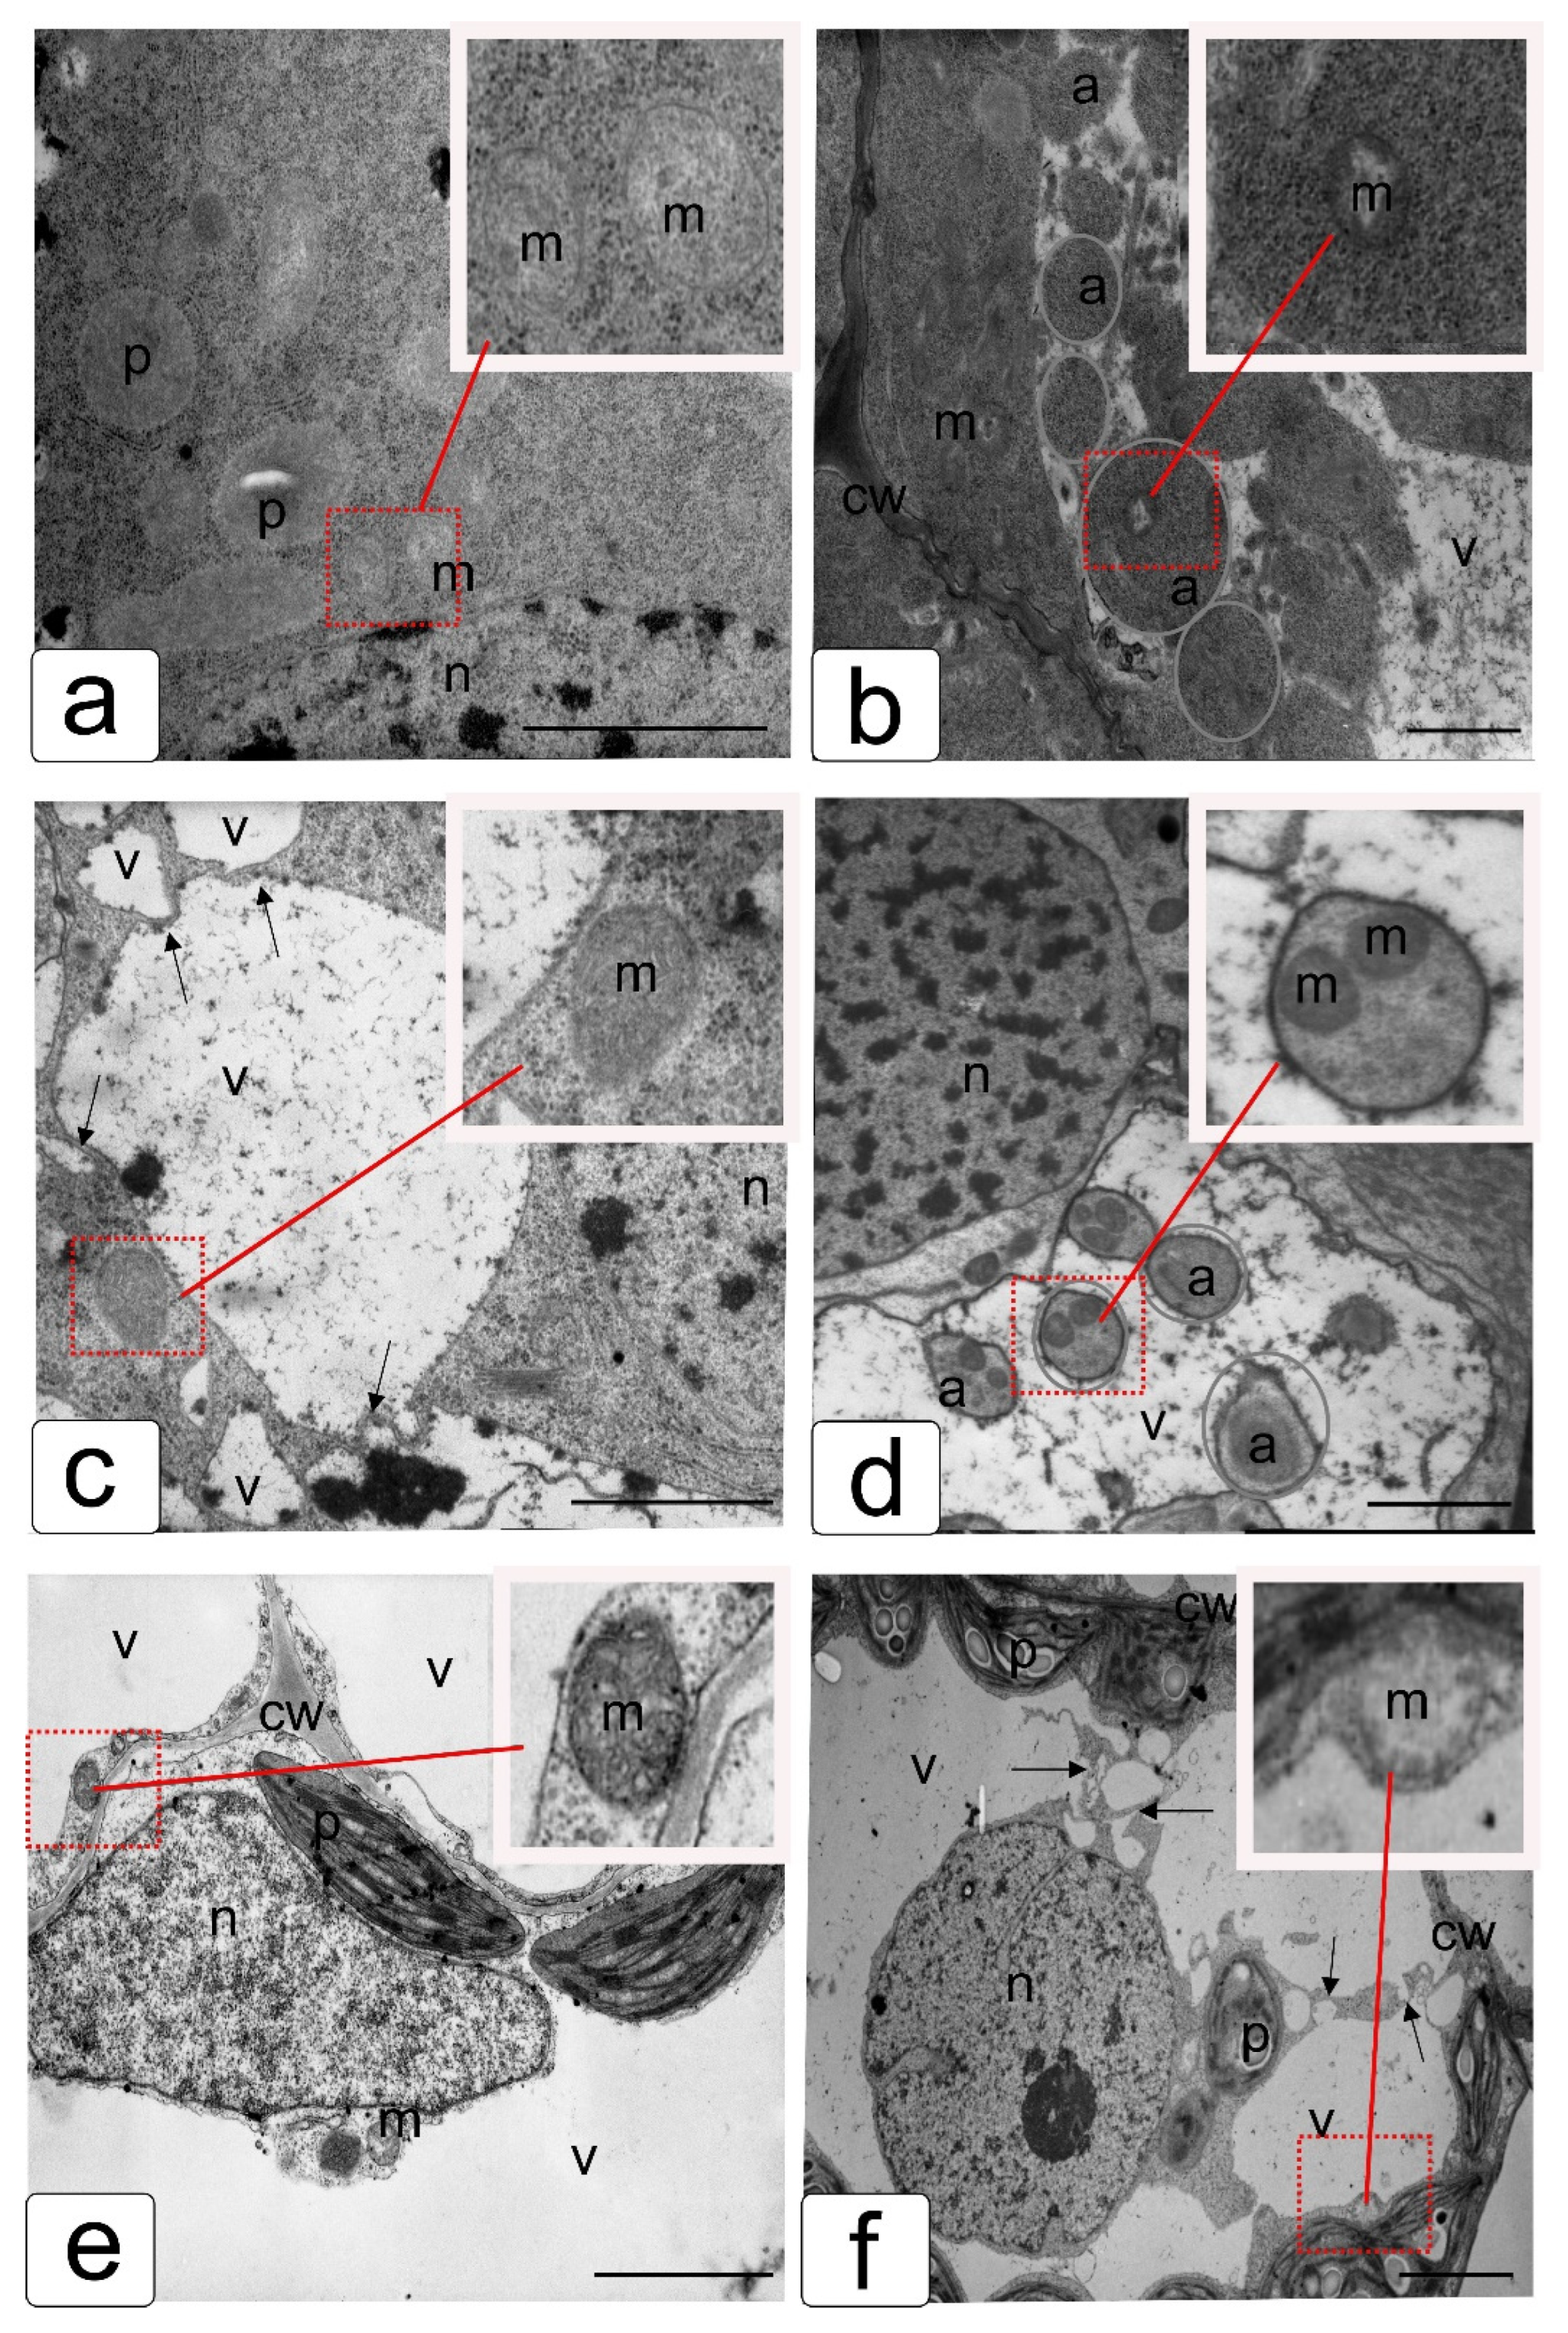
Autophagy proteins (ATGs) play an essential role in the formation of autophagosomes involved in the removal and processing of dying cells and their components. There are few data on the mechanisms and physiological functions of autophagy in cultivated plants, especially in wheat, which is one of the most important food crops in the world. It has been noted that soft wheat ATG4 and ATG8 proteins play the most important role in the process of autophagy in response to adverse environmental influences [50]. We also studied the expression of the ATG4 and ATG8 genes, as well as the ATG1 and TOR genes, which are initiators of phagophore formation (Figure 3).
The relative level of TOR gene expression in the roots of both wheat varieties under control growing conditions was very low. However, in the shoots of the Zolotaya variety, the expression of the TOR gene was 3.8 times higher than in the roots. With an increase in the content of NaCl in solution, the expression of the TOR gene increased in all variants. The expression of the TOR gene in the variety Orenburgskaya 22 increased in the roots (by 30 times) and in the shoots (by 22 times) compared with the control, and in the variety Zolotaya, in the roots by 12 times and in the shoots by 2.3 times. However, the level of expression of the TOR gene in Orenburgskaya 22 in the roots was 2.8 times lower than in the Zolotaya variety and 3.8 times lower in the shoots. TOR is thought to be a negative regulator of autophagy in plants. TOR overexpression blocks autophagy activation under saline and osmotic stress [51]. Based on the obtained data, it follows that under the control conditions of wheat cultivation, the formation of autophagosomes was induced along the TOR-independent pathway. Under salt stress, TOR was activated, which led to the blocking of the autophagy process and an increase in the process of programmed cell death in wheat, especially the Zolotaya variety, thereby confirming that the Zolotaya variety is a salt stress-sensitive variety.
ATG1 protein binds and localizes in phagophores. The expansion of the phagophore depends on the degree of its phosphorylation. In the control variety Orenburgskaya 22, the relative expression of the ATG1 gene both in roots and shoots was 2.6 times higher than in the Zolotaya variety. Under salinization, the expression of the ATG1 gene in the roots of Orenburgskaya 22 increased by 1.5 times and in the Zolotaya variety by 3.3 times. Interestingly, when 150 mM NaCl was added to the solution, ATG1 gene expression in shoots decreased in both wheat varieties. This fact can probably be explained by the fact that under salt stress, the autophagy process proceeds along the TOR-dependent pathway, and overexpression of the TOR gene plays a negative role in ATG1 expression.
The ATG8 protein is one of the most important autophagy proteins. It binds to PE, localizes on the membrane, and participates in membrane closure and its fusion with the vacuole. In the variety Orenburgskaya 22 in the control shoots, the expression of the ATG8 gene was 1.5 times higher. At the same time, in the Zolotaya variety, the expression of the ATG8 gene in the control roots was 1.8 times higher than in the shoots. When sodium chloride was added to the solution, both varieties behaved similarly: there was an increase in the expression of the ATG8 gene in the roots (Orenburgskaya 22 by about 1.1 times and Zolotaya by 1.7 times) and a decrease in the shoots (Orenburgskaya 22 by 2.7 times and Zolotaya by 1.3 times). Although the nature of changes in the ATG8 gene expression was similar, the ATG8 activity in the Orenburgskaya 22 variety was significantly higher than in the Zolotaya variety.
Activation of the ATG8 protein requires cleavage of its C-terminus to release the glycine residue responsible for its lipidation. The ATG4 protein is a cysteine protease. Under salinization, the expression of the ATG4 gene in the roots of the Orenburgskaya 22 variety increased by 1.4 times and in the roots of the Zolotaya variety by 1.1 times. As follows from the data in the Figure 3, the expression profiles of the ATG8 and ATG4 genes in both wheat varieties were similar. This fact confirms that these two proteins are interconnected and necessary for each other.
Although the nature of changes in the expression profile of the ATG8 and ATG4 genes was similar in resistant- and unresistant-to-salinity wheat varieties, the level of the expression of these genes in the Orenburgskaya 22 (resistant) variety was higher than in the Zolotaya (unstable) variety. This fact is most likely associated with a more intensive formation of autophagosomes and thus confirms that the process of autophagy under salt stress is a protective system.

3.5. TEM Analysis

The cells of the initials of the cortex have a dense structure of the cytoplasm with rounded or oval organelles typical for the cells of the meristematic zone. These cells are characterized by the central position of the nucleus and the absence of vacuoles. Plastids and mitochondria have a structure characteristic of these cells: they do not have developed internal membranes and significant inclusions, and they contain a dense stroma and a matrix with randomly arranged ribosomes (Figure 4a). With further development, many small vacuoles are formed in these cells, which actively merge and push the nucleus and the organelle containing the cytoplasm to the cell periphery. The junctions of small and large vacuoles are shown by arrows. Vacuole inclusions do not have a pronounced structure and contain phenolic inclusions, and less often, proteins (dark spots in Figure 4c). Under the action of toxic salt concentrations, a part of the cytoplasm can be modified and localized as autophagosomes in vacuoles, which in this case perform a lytic function (Figure 4b). With the development of damage, most of the organelles are inside the vacuole, the turgor is disturbed, and the structure of the cytoplasm becomes uneven with areas of different density and further autophagosome degradation (Figure 4d).
The cells of the aboveground organs also transform from dense vacuoleless cells to cells with a large central vacuole and peripherally displaced organelles (Figure 4e). Under the action of salinity, the fusion of vacuoles is disrupted, the nucleus remains in the center of the cells, the organelles are located both near the nucleus and on the periphery, and the cytoplasm forms characteristic strands connecting the peripheral cytoplasm and perinuclear fragments (Figure 4f).
Normally, mitochondria of cells that have switched to specialization acquire developed cristae and have a developed matrix (Figure 4a,c,e insets). Salinity changes the structure of mitochondria, causing a change in density and impaired formation of cristae and their uneven location, which differs greatly depending on the location of the cells (Figure 4b,d,f inserts).

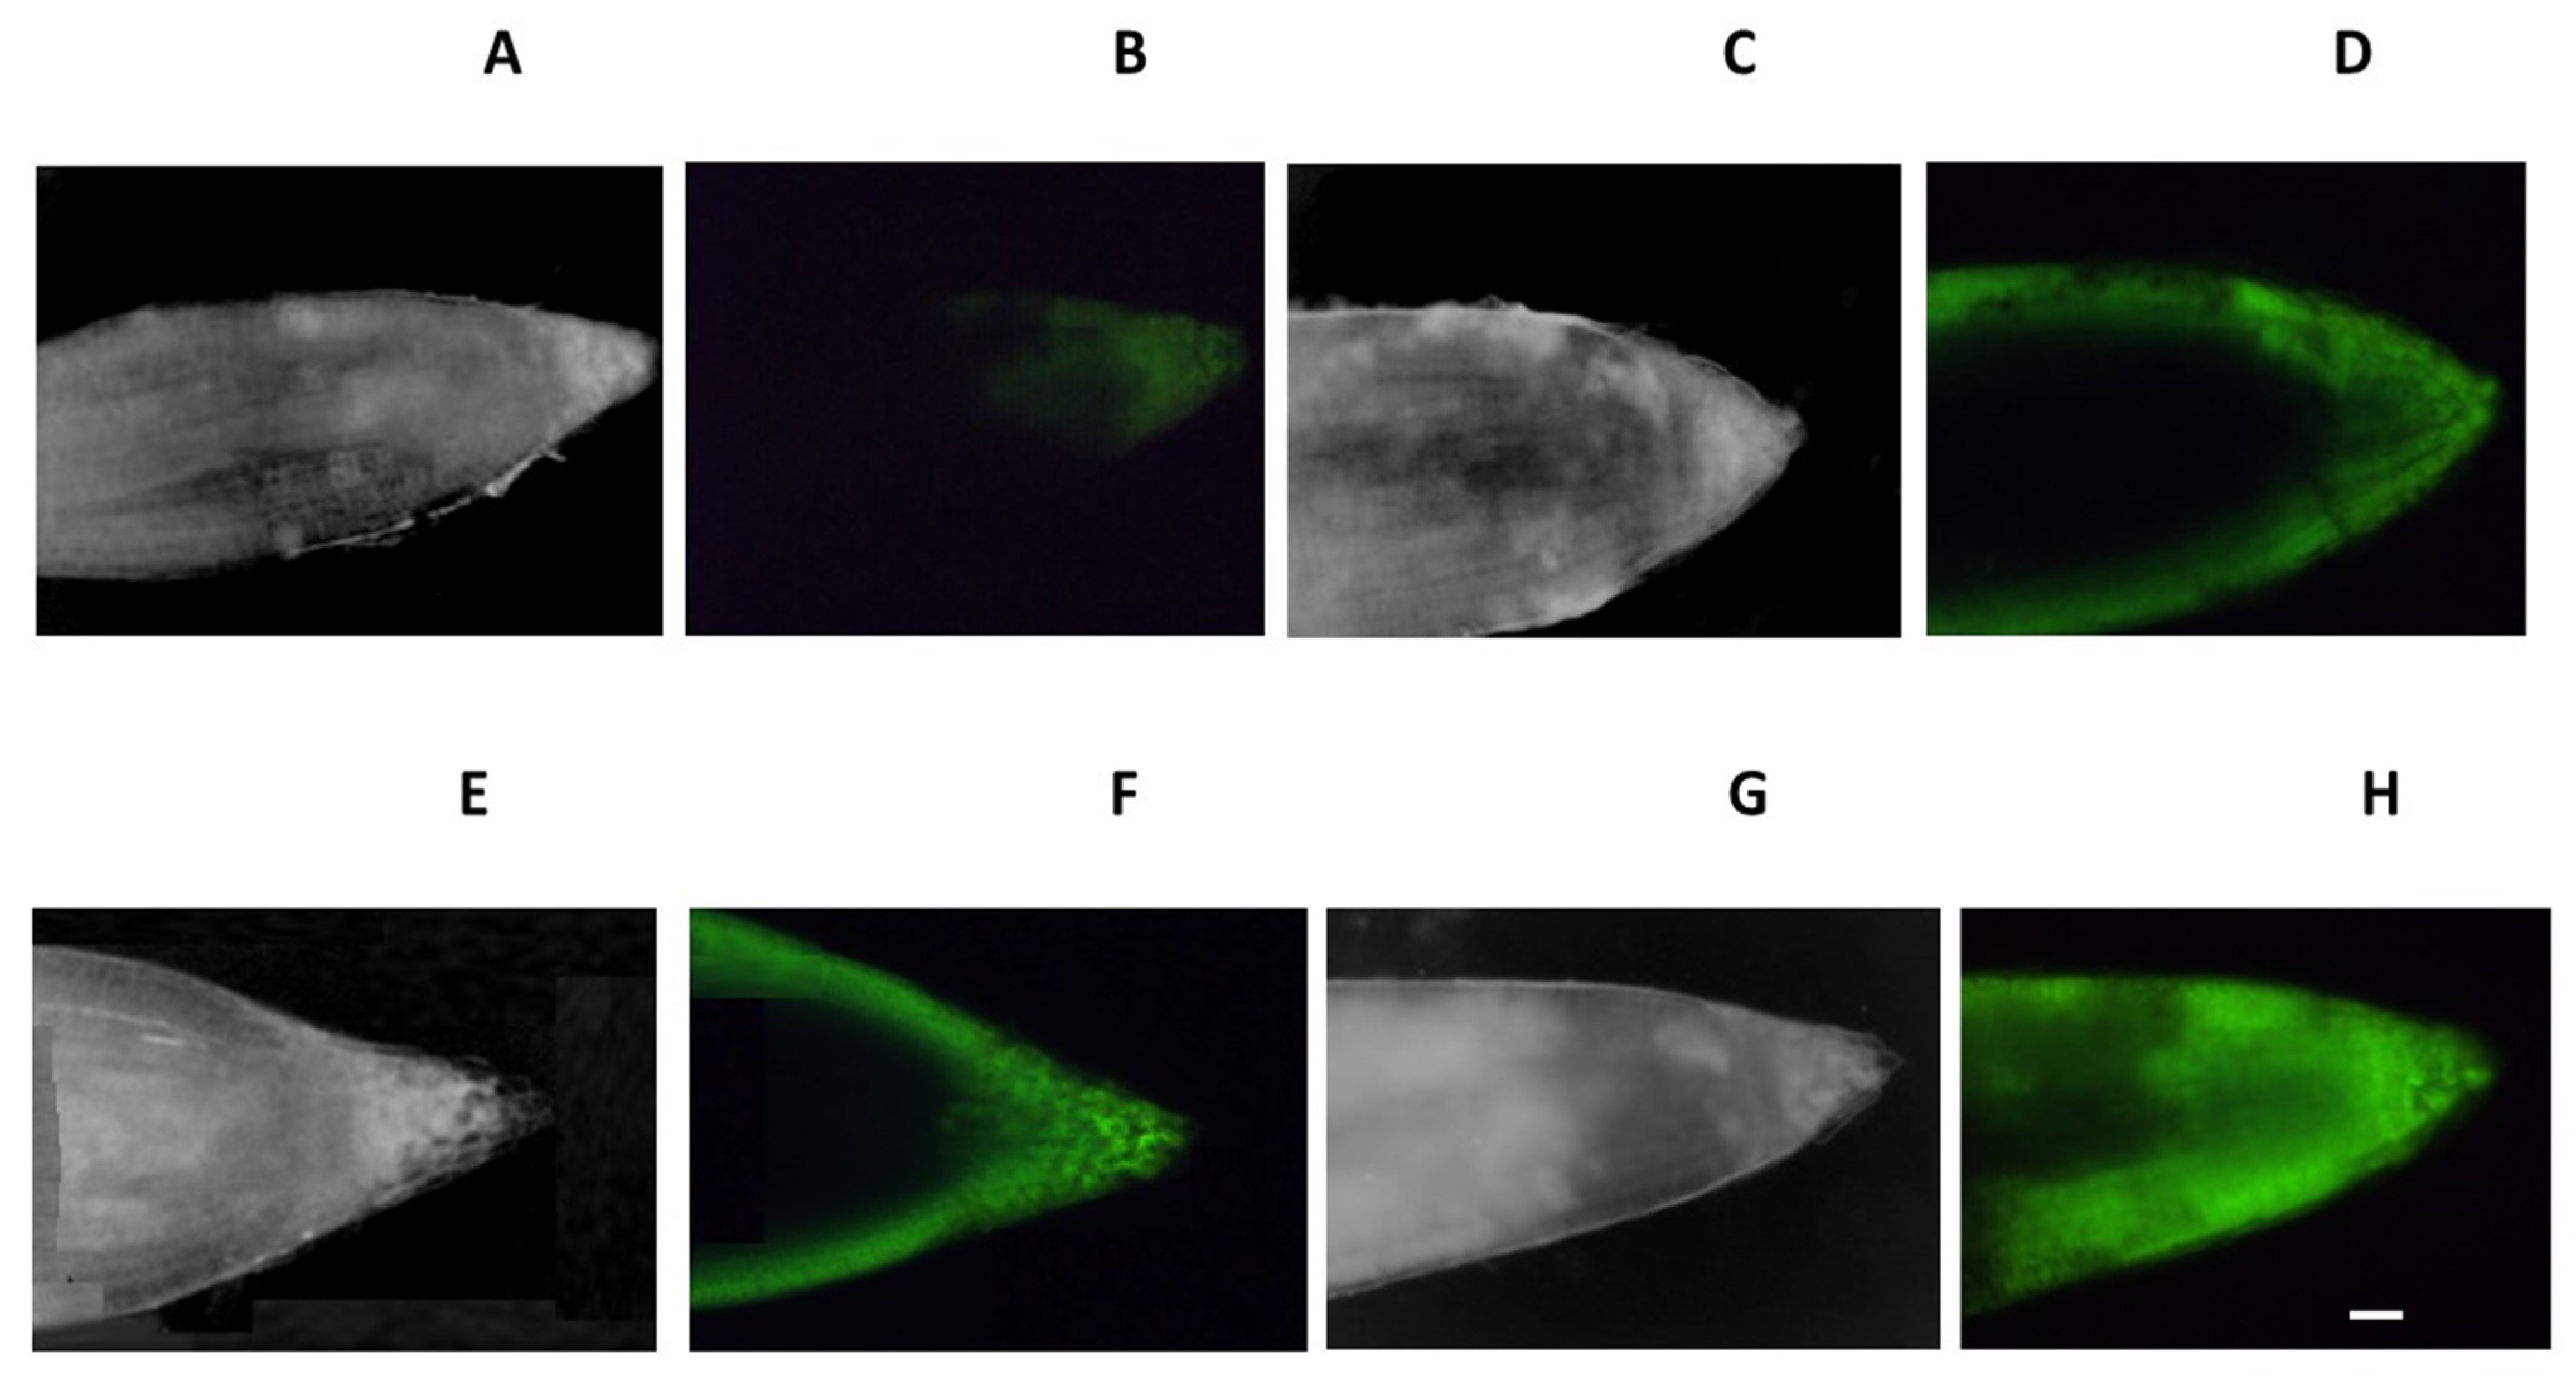
3.6. Fluorescence Analysis

Processes associated with an increase in reactive oxygen species (ROS) and their neutralization by organelles play a special role in the processes of programmed cell death. Single-stained cells are found on the surface of the roots; however, the intensity of staining differs between varieties in cells from different root zones. During salinization, the most intense coloration of ROS was observed in the zone of the cap and division, which was more intense in the Zolotaya variety. At the same time, compared with the control, the increase in the level of ROS was observed to the greatest extent in the cells of the epidermis and cortex and to a lesser extent in the zone of the central cylinder (Figure 5).

3.7. Trypan Blue Analysis

Trypan blue staining of coleoptiles of two wheat varieties was carried out to characterize viability under salt stress. Trypan blue penetrates the membrane of dead cells, and staining determines the degree of tissue damage during salinization and the number of dead cells (Figure 6). In the control, there were almost no visible changes in the coleoptile, while in the presence of sodium chloride, rather strong tissue damage was observed, depending on the wheat variety. Therefore, in the Zolotaya variety, more than 80% of the cells were damaged by salinity. At the same time, in the variety Orenburgskaya 22 in the variant with NaCl, there were up to 20% of dead cells.

3.8. Apoptosis Assay

On preparations macerated with the help of an enzyme that destroys the cell wall of the cells of the roots of seedlings of resistant- and tolerant-to-salinity Zolotaya varieties of wheat, we carried out the detection of phosphatidylserine using Annexin V-FITC (Figure 7a,c), while propidium iodide did not stain the DNA of these nuclei. Such localization of phosphatidylserine was found on the surface of 5% of root cells of 4-day-old seedlings of the Zolotaya variety.

3.9. TUNEL Detection

Nuclear DNA breaks were detected by the TUNEL method (Figure 8). In the salinity-resistant variety Orenburgskaya 22, DNA breaks were observed in the nuclei of 0.4% of the control cells, and in the presence of NaCl, in 19% of the cells (Figure 8e,f). Breaks were observed in metaphase chromosomes and micronuclei (Figure 8f,i). In the salt-tolerant variety Zolotaya, DNA breaks were observed in the nuclei of 0.5% of control cells, and in the presence of NaCl, in 32% of cells.

3.10. Cytochrome c Assay

Cytochrome c immunodetection was carried out in the cytoplasm of root cells (Figure 9). In salinity-resistant variety Orenburgskaya 22, cytochrome c was detected both in mitochondria and in the cytoplasm of 9% of cells. In the salt-tolerant variety Zolotaya, cytochrome c was detected both in mitochondria and in the cytoplasm of 15% of cells.

4. Discussion

For growth and development on saline soils, the plant needs to regulate the accumulation of toxic ions. In the course of evolution, plants have acquired several mechanisms of salt tolerance. It is known that more salt-tolerant plant species have high adaptive properties; they are able not to accumulate Na+ and Cl in vacuoles and they maintain a low concentration in the cytoplasm [52].
Mechanisms of salt tolerance include the excretion of Na+ and Cl ions from vacuoles, blocking the transport of Na+ ions into the cell, exclusion of Na+ from the transpiration flow, and some other mechanisms [53]. Susceptibility and tolerance to stress caused by the action of high concentrations of NaCl in plants is a coordinated action of many genes that respond to stress [54]. Generally, K+ is preferred for uptake by roots from the soil, and most plants show a high degree of K+/Na+ discrimination in their uptake. High-affinity potassium transporters (HKTs) are active at the plasma membrane level and function as a Na+/K+ symporter as well as a Na+ selective uniporter [55]. Plant gene HKT transporters of potassium and sodium ions are divided into two subfamilies [56]. The subfamily HKT 1 is found in all higher plants. Genes of this class encode selective ion transporters, while subfamily 2 genes encode transporters that are permeable to both K+ and Na+ ions. Violation of the expression of genes of the HKT1 family leads to hypersensitivity to Na+ ions and excessive accumulation of sodium in the shoots.
An excess of Na+ and Cl accumulated in the roots of wheat grown in the presence of 150 mM NaCl (Table 1). The content of Na+ and Cl ions in the Zolotaya variety in the roots turned out to be significantly higher than in the resistant variety Orenburgskaya 22 (Na+ −1.39 ± 0.07 and 1.16 ± 0.06, respectively, and Cl −4.63 ± 0.23 and 3.55 ± 0.18, respectively). The level of expression of the genes of ion transporters of both classes in the root of Orenburgskaya 22 and Zolotaya was almost two times higher than in the shoots. In the presence of NaCl, the activity of genes of the HKT family increased in the roots of the Orenburgskaya 22 variety (Figure 2). In the root of the wheat variety Zolotaya, activity of the transporter genes was significantly lower than in the Orenburgskaya 22 variety (HKT1;4 by 1.5 times and HKT2;1 by 2 times). It should be noted that in the presence of sodium chloride, the expression level of the HKT2;1 gene in the Orenburgskaya 22 variety was 1.3 times higher than that of the HKT1;4 gene. At the same time, under these conditions, the expression level of HKT2;1 in the root of the Zolotaya cultivar decreased by 1.1 times compared to the expression of HKT1;4. These indicators are important for characterizing wheat tolerance to salt stress. These data are consistent with morphometric characteristics, confirming that variety Zolotaya is less resistant to high concentrations of sodium chloride than variety Orenburgskaya 22.
TOR (serine/threonine protein kinase) is a regulator that controls ATG1/ATG13-mediated autophagy [57]. There are both TOR-dependent and independent pathways of autophagy regulation [58]. TOR overexpression blocks autophagy activation under saline and osmotic stress in addition to nutrient deficiency but does not affect autophagy activation under oxidative or endoplasmic reticulum stress. In Arabidopsis, activation of autophagy under various stress conditions requires a decrease in TOR activity [58]. Under control development conditions, TOR expression was almost completely inhibited in both wheat varieties, except in the shoots of the Zolotaya variety. However, under salt stress, a significant increase in TOR expression activity was observed, especially in the roots of the Zolotaya wheat variety. Overexpression blocked the activity of autophagy and led to an increase in instability and even death of the Zolotaya variety under conditions of high salt content.
The ubiquitin-like protein ATG8 is one of the active and essential proteins for autophagy [59]. The ATG8 protein is synthesized in an inactive form. The activation of the ATG8 protein occurs upon the release of C-terminal glycine as a result of cleavage by the cysteine protease ATG4. The released C-glycine residue binds to phosphatidylethanolamine to form an adduct [60]. Lipidation of ATG8 and its localization on the autophagosome membrane are critical for assembly, expansion, closure, and fusion of the autophagic membrane with the vacuole [61]. ATG4 can also release ATG8 from autophagic membranes, which promotes autophagosome maturation and fusion [62].
The expression of the ATG4 and ATG8 genes in the Orenburgskaya 22 wheat variety significantly exceeded the values in the Zolotaya variety. Under salt stress, the expression of these genes in the roots of both varieties increased; however, a decrease in expression activity was observed in the shoots. A similar picture occurred with the inhibition of ATG1 expression in shoots under salt stress. Thus, it can be said that the shoots of both wheat varieties, which are more tolerant to the action of salts than the roots, had a lower formation of autophagosomes than the roots. However, under normal conditions, the formation of autophagosomes occurred more actively in shoots than in roots.
It can be assumed that under salt-free conditions of wheat growth, the autophagy process proceeds along a TOR-independent pathway. A complex of autophagosomal proteins, which includes the ATG1 protein, is responsible for the initiation of the formation of autophagosomes. With an increase in the content of sodium chloride, the TOR protein accumulates, resulting in the activation of the autophagy process along the TOR-dependent pathway. The more active the TOR protein, the more resistant the wheat variety to salt stress. Moreover, different wheat organs respond differently to abiotic stress. Thus, in the Zolotaya wheat variety in which the expression of the TOR gene was significantly activated under salt stress, the morphometric parameters of both roots and shoots were significantly reduced in contrast to the resistant variety Orenburgskaya 22 in which shoots, and to a lesser extent, roots, were subject to salt stress. This fact indicates that the processes of autophagosome formation in wheat can be carried out independently in different organs.
Two pathways of plant PCD are known: “apoptosis-like”, the markers of which are DNA breaks, the release of cytochrome c from mitochondria, and the transfer of phosphatidylserine to the outer layer of the membrane, and “vacuolar death”, characterized by the formation of large vacuoles and autophagosomes [63].
Autophagy is a vacuolar degradation pathway by which cells recycle their components, including macromolecules and organelles [64]. Macroautophagy, more commonly referred to simply as autophagy, is the most studied form of autophagy in plants and manifests itself under environmental stresses [29]. Selective autophagy involves the uptake of specific proteins or organelles into autophagosomes [65]. Selective autophagy promotes cellular homeostasis and quality control of proteins and organelles [66]. Selective autophagy includes chlorophagy, which is responsible for the uptake of whole chloroplasts [67], and mitophagy, which is an important mitochondrial control mechanism [68], as well as reticulophagy [69,70] and ribophagy [71,72].
Oxidative stress is the generation of reactive oxygen species, including superoxide anion, hydrogen peroxide, and hydroxyl radical [73]. ROS are a necessary component of normal cell metabolism and important signaling molecules involved in the regulation of many physiological processes associated with plant growth and development [74]. Abiotic and biotic stress factors induce a reaction in plants during which ROS production in cells increases and a series of cascade reactions is triggered to neutralize excess ROS. ROS in cells can participate in various biochemical and physiological reactions depending on the degree of damage to cellular structures, in which cell metabolism is rearranged and plants acclimatize to stress conditions or one or more variants of programmed cell death (PCD) are triggered [75,76,77]. Although reactive oxygen species are inevitable by-products of aerobic metabolism, they cause oxidation of plant lipids, leading to membrane damage, protein degradation, enzyme inactivation, base modification, and DNA breaks, thus generating mutations and ultimately leading to programmed cell death. [78,79].
In control wheat roots, the Carboxy-H2DFFDA marker detects ROS only in the apical part of the root cap. Under salt stress, Carboxy-H2DFFDA accumulates in cells of different root zones, which indicates an increase in the content of ROS in these cells or zones and the activation of oxidative stress and cellular damage. The most intense fluorescent coloration was observed in the root of the Zolotaya variety. Thus, the accumulation of the ROS fluorescent marker Carboxy-H2DFFDA in root cells under the action of salinity indicates that ROS homeostasis was disturbed in these cells and root tissues, which can trigger PCD.
We showed that germination and the subsequent 4-day acclimation of seedlings to salinity of resistant and non-resistant wheat varieties induced some of the root cells to be at the stages of programmed cell death. No significant signs of death were found in the root cells of the control seedlings. In cells of the resistant variety Orenburgskaya 22 compared with the non-resistant variety, no transfer of phosphatidylserine to the surface of the plasma membrane of cells was observed. However, DNA breaks were found in the nuclei and metaphase chromosomes, as well as the release of cytochrome c into the cytoplasm. The localization of cytochrome c in the cell cytoplasm indicates the mitochondrial pathway of root cell death under salinity. We observed similar markers of death only in a larger number of cells in the Zolotaya variety, which is unstable to salinity, in which cells with a superficial location of phosphatidylserine were detected.
The fact that the wheat variety Zolotaya is an unstable variety was also confirmed by the data on the staining of the coleoptile with Trypan blue. The wheat coleoptile is an ideal model for studying cell damage during salinity. Programmed for a relatively short period of development, the coleoptile functions and quickly dies during the growth of the seedling. Under the action of high concentrations of sodium chloride, the viability of wheat coleoptile cells was higher in the Orenburgskaya 22 variety than in the Zolotaya variety.
An important functional test for oxidative stress is in vivo staining of mitochondria using specific fluorescent markers of the mitotracker family. Using one of the mitotracker variants, which accumulates both in active and inactive mitochondria (in this case, the dye accumulated only in undamaged mitochondria), we previously showed that in the presence of NaCl, in which root cells produced an increased content of ROS, there was a change in the nature of mitochondrial staining [47]. When cultivated under normal conditions, all root cells had stained mitochondria, although the intensity of staining in different cells could vary. However, after incubation with salts, in certain areas of the root, there were cells in which mitochondrial staining was absent, indicating damage to them. The number of damaged mitochondria was much higher in sensitive wheat varieties.
Thus, on the basis of electron microscopy data, we revealed the induction of mitophagy in wheat root and leaf cells under saline conditions, which was confirmed by biochemical data and fluorescence microscopy data.

5. Conclusions

A high concentration of sodium chloride leads to the accumulation of toxic ions in all organs of wheat. The level of accumulation of ions in wheat can be an indicator of the resistance of a wheat variety to salt stress. The wheat variety Zolotaya accumulated Cl and Na+ ions to a greater extent than the Orenburgskaya 22 variety. The accumulation of toxic ions was accompanied by an increase in ROS and an increase in damage to root tissues, especially in the Zolotaya variety. Under the action of salinity, ROS production accumulated in root cells, which led to the triggering of autophagy and PCD. At high salt concentrations, an increase in the expression level of TOR, which is a negative regulator of the formation of autophagosomes, occurred. The level of TOR expression in the Zolotaya variety was 2.8 times higher in the roots and 3.8 times higher in the leaves than in the Orenburgskaya 22 variety. With the help of PCD markers, in cells of the resistant variety Orenburgskaya 22 in comparison with the non-resistant variety Zolotaya, no transfer of phosphatidylserine to the cell surface was observed. However, DNA breaks in the nuclei and metaphase chromosomes were revealed, as well as the release of cytochrome c into the cytoplasm, which indicates a mitochondrial pathway for the death of part of the root cells during salinity. We observed similar markers of death only in a larger number of cells in the Zolotaya variety, which is non-resistant to salinity, where cells with a surface location of phosphatidylserine were also detected. Based on electron microscopy data, mitophagy induction was revealed in wheat root and leaf cells under saline conditions, which was confirmed by biochemical data.

Author Contributions

N.V.K. performed light and fluorescent microscopy, evaluated data, and wrote and finalized the manuscript the manuscript; E.N.B. performed electron microscopy and evaluated data; E.M.L. performed light and fluorescent microscopy, evaluated data, and wrote and finalized the manuscript the manuscript; O.V.S. performed ions detection and obtained and characterized plants; L.I.F. designed and performed the experiment and PCR, designed and prepared figures, evaluated data, and wrote and finalized the manuscript. All authors have read and agreed to the published version of the manuscript.

Funding

The reported study was supported by 0574-2019-002 of the Ministry of Science and Higher Education of the Russian Federation.

Institutional Review Board Statement

Not applicable.

Informed Consent Statement

Not applicable.

Data Availability Statement

Not applicable.

Acknowledgments

We are grateful to Ishen Besaliev for technical support.

Conflicts of Interest

The authors declare no conflict of interest.

References

  1. Very, A.-A.; Sentenac, H. Molecular mechanisms and regulation of Na+ transport in higher plants. Annu. Rev. Plant Biol. 2003, 54, 575–603. [Google Scholar] [CrossRef] [PubMed]
  2. Munns, R.; Tester, M. Mechanisms of salinity tolerance. Annu. Rev. Plant Biol. 2008, 59, 651–681. [Google Scholar] [CrossRef] [PubMed]
  3. Fuchs, Y.; Steller, H. Live to die another way: Modes of programmed cell death and the signals emanating from dying cells. Nat. Rev. Mol. Cell Biol. 2015, 16, 329–344. [Google Scholar] [CrossRef] [PubMed]
  4. Huysmans, M.; Lema, A.S.; Coll, N.S.; Nowack, M.K. Dying two deaths—Programmed cell death regulation in development and disease. Curr. Opin. Plant Biol. 2017, 35, 37–44. [Google Scholar] [CrossRef] [PubMed]
  5. He, C.; Klionsky, D.J. Regulation mechanisms and signaling pathways of autophagy. Annu. Rev. Genet. 2009, 43, 67–93. [Google Scholar] [CrossRef]
  6. Farre, J.C.; Subramani, S. Mechanistic insights into selective autophagy pathways: Lessons from yeast. Nat. Rev. Mol. Cell Biol. 2016, 17, 537–552. [Google Scholar] [CrossRef]
  7. Boya, P.; Reggiori, F.; Codogno, P. Emerging regulation and functions of autophagy. Nat. Cell Biol. 2013, 15, 1017. [Google Scholar] [CrossRef]
  8. Papini, A. Investigation of morphological features of autophagy during plant programmed cell death. In Plant Programmed Cell Death; Humana Press: New York, NY, USA, 2018; pp. 9–19. [Google Scholar]
  9. Papini, A.; Mosti, S.; van Doorn, W.G. Classical macroautophagy in Lobivia rauschii (Cactaceae) and possible plastidial autophagy in Tillandsia albida (Bromeliaceae) tapetum cells. Protoplasma 2014, 251, 719–725. [Google Scholar] [CrossRef]
  10. Parish, R.W.; Li, S.F. Death of a tapetum: A programme of developmental altruism. Plant Sci. 2010, 178, 73–89. [Google Scholar] [CrossRef]
  11. Papini, A.; Mosti, S.; Milocani, E.; Tani, G.; Di Falco, P.; Brighigna, L. Megasporogenesis and programmed cell death in Tillandsia (Bromeliaceae). Protoplasma 2011, 248, 651–662. [Google Scholar] [CrossRef]
  12. Doronina, T.V.; Chaban, I.A.; Lazareva, E.M. Structural and Functional Features of the Wheat Embryo Sac’s Antipodal Cells during Differentiation. Russ. J. Dev. Biol. 2019, 50, 194–208. [Google Scholar] [CrossRef]
  13. Brighigna, L.; Milocani, E.; Papini, A.; Vesprini, J.L. Programmed cell death in the nucellus of Tillandsia (Bromeliaceae). Caryologia 2006, 59, 334–339. [Google Scholar] [CrossRef]
  14. Papini, A.; Tani, G.; Di Falco, P.; Brighigna, L. The ultrastructure of the development of Tillandsia (Bromeliaceae) trichome. Flora 2010, 205, 94–100. [Google Scholar] [CrossRef]
  15. Mosti, S.; Ross Friedman, C.; Pacini, E.; Brighigna, L.; Papini, A. Nectary ultrastructure and secretory modes in three species of Tillandsia L. (Bromeliaceae) that have different pollinators. Botany 2013, 91, 786–798. [Google Scholar] [CrossRef]
  16. Broda, M.; Millar, A.H.; Van Aken, O. Mitophagy: A mechanism for plant growth and survival. Trends Plant Sci. 2018, 23, 434–450. [Google Scholar] [CrossRef]
  17. Klionsky, D.J. Guidelines for the use and interpretation of assays for monitoring autophagy. Autopagy 2012, 8, 445–544. [Google Scholar] [CrossRef]
  18. Anding, A.L.; Baehrecke, E.H. Autophagy in cell life and cell death. Curr. Top. Dev. Biol. 2015, 114, 67–91. [Google Scholar]
  19. Üstün, S.; Hafrén, A.; Hofius, D. Autophagy as a mediator of life and death in plants. Curr. Opin. Plant Biol. 2017, 40, 122–130. [Google Scholar] [CrossRef]
  20. Shemi, A.; Ben-Dor, S.; Vardi, A. Elucidating the composition and conservation of the autophagy pathway in photosynthetic eukaryotes. Autophagy 2015, 11, 701–715. [Google Scholar] [CrossRef]
  21. Minina, E.A.; Filonova, L.H.; Fukada, K.; Savenkov, E.I.; Gogvadze, V.; Clapham, D.; Sanchez-Vera, V.; Suarez, M.F.; Zhivotovsky, B.; Daniel, G.; et al. Autophagy and metacaspase determine the mode of cell death in plants. J. Cell Biol. 2013, 203, 917–927. [Google Scholar] [CrossRef]
  22. Wada, S.; Hayashida, Y.; Izumi, M.; Kurusu, T.; Hanamata, S.; Kanno, K.; Kojima, S.; Yamaya, T.; Kuchitsu, K.; Makino, A.; et al. Autophagy supports biomass production and nitrogen use efficiency at the vegetative stage in rice. Plant Physiol. 2015, 168, 60–73. [Google Scholar] [CrossRef] [PubMed]
  23. Zhou, J.; Wang, J.; Yu, J.Q.; Chen, Z. Role and regulation of autophagy in heat stress responses of tomato plants. Front. Plant Sci. 2014, 5, 174–186. [Google Scholar] [CrossRef] [PubMed]
  24. Henry, E.; Fung, N.; Liu, J.; Drakakaki, G.; Coaker, G. Beyond glycolysis: GAPDHs are multifunctional enzymes involved in regulation of ROS, autophagy, and plant immune responses. PLoS Genet. 2015, 11, e1005199. [Google Scholar] [CrossRef] [PubMed]
  25. Minina, E.A.; Bozhkov, P.V.; Hofius, D. Autophagy as initiator or executioner of cell death. Trends Plant Sci. 2014, 19, 692–697. [Google Scholar] [CrossRef]
  26. Bassham, D.C.; Laporte, M.; Marty, F.; Moriyasu, Y.; Ohsumi, Y.; Olsen, L.J.; Yoshimoto, K. Autophagy in development and stress responses of plants. Autophagy 2006, 2, 2–11. [Google Scholar] [CrossRef]
  27. Hayward, A.P.; Dinesh-Kumar, S.P. What can plant autophagy do for an innate immune response? Annu. Rev. Phytopathol. 2011, 49, 557–576. [Google Scholar] [CrossRef]
  28. Michaeli, S.; Galili, G.; Genschik, P.; Fernie, A.R.; Avin-Wittenberg, T. Autophagy in plants—What’s new on the menu? Trends Plant Sci. 2016, 21, 34–144. [Google Scholar] [CrossRef] [PubMed]
  29. Yang, X.; Bassham, D.C. New insight into the mechanism and function of autophagy in plant cells. Int. Rev. Cell Mol. Biol. 2015, 320, 1–40. [Google Scholar]
  30. Lamb, C.A.; Yoshimori, T.; Tooze, S.A. The autophagosome: Origins unknown, biogenesis complex. Nat. Rev. Mol. Cell Biol. 2013, 14, 759–774. [Google Scholar] [CrossRef]
  31. Mizushima, N.; Yoshimori, T.; Ohsumi, Y. The role of Atg proteins in autophagosome formation. Annu. Rev. Cell Dev. Biol. 2011, 27, 107–132. [Google Scholar] [CrossRef]
  32. Reggiori, F.; Klionsky, D.J. Autophagic processes in yeast: Mechanism, machinery and regulation. Genetics 2013, 194, 341–361. [Google Scholar] [CrossRef] [PubMed]
  33. Bassham, D.C. Function and regulation of macroautophagy in plants. Biochim. Biophys. Acta 2009, 1793, 1397–1403. [Google Scholar] [CrossRef] [PubMed]
  34. Liu, Y.; Bassham, D.C. Autophagy: Pathways for self-eating in plant cells. Annu. Rev. Plant Biol. 2012, 63, 215–237. [Google Scholar] [CrossRef] [PubMed]
  35. Klionsky, D.J.; Ohsumi, Y. Vacuolar import of proteins and organelles from the cytoplasm. Annu. Rev. Cell Dev. Biol. 1999, 15, 1. [Google Scholar] [CrossRef]
  36. Behrends, C.; Sowa, M.E.; Gygi, S.P.; Harper, J.W. Network organization of the human autophagy system. Nature 2010, 466, 68–76. [Google Scholar] [CrossRef]
  37. Suzuki, K.; Ohsumi, Y. Current knowledge of the pre-autophagosomal structure (PAS). FEBS Lett. 2010, 584, 1280–1286. [Google Scholar] [CrossRef]
  38. Chung, T.; Phillips, A.R.; Vierstra, R.D. ATG8 lipidation and ATG8-mediated autophagy in Arabidopsis require ATG12 expressed from the differentially controlled ATG12A and ATG12 B loci. Plant J. 2010, 62, 483–493. [Google Scholar] [CrossRef]
  39. Lv, X.; Pu, X.; Qin, G.; Zhu, T.; Lin, H. The roles of autophagy in development and stress responses in Arabidopsis thaliana. Apoptosis 2014, 19, 905–921. [Google Scholar] [CrossRef]
  40. Scherz-Shouval, R.; Shvets, E.; Fass, E.; Shorer, H.; Gil, L.; Elazar, Z. Reactive oxygen species are essential for autophagy and specifically regulate the activity of Atg4. EMBO J. 2007, 26, 1749–1760. [Google Scholar] [CrossRef]
  41. Bassham, D.C. Plant autophagy—More than a starvation response. Curr. Opin. Plant Biol. 2007, 10, 587–593. [Google Scholar] [CrossRef]
  42. Sarkar, S.; Floto, R.A.; Berger, Z.; Imarisio, S.; Cordenier, A.; Pasco, M.; Cook, L.J.; Rubinsztein, D.C. Lithium. Lithium induces autophagy by inhibiting inositol monophosphatase. J. Cell Biol. 2005, 170, 1101–1111. [Google Scholar] [CrossRef] [PubMed]
  43. Kim, I.; Rodriguez-Enriquez, S.; Lemasters, J.J. Selective degradation of mitochondria by mitophagy. Arch. Biochem. Biophys. 2007, 462, 245–253. [Google Scholar] [CrossRef] [PubMed]
  44. Lee, J.; Giordano, S.; Zhang, J. Autophagy, mitochondria and oxidative stress: Cross-talk and redox signaling. Biochem. J. 2012, 41, 523–540. [Google Scholar] [CrossRef] [PubMed]
  45. Liu, Y.; Xiong, Y.; Bassham, D.C. Autophagy is required for tolerance of drought and salt stress in plants. Autophagy 2009, 5, 954–963. [Google Scholar] [CrossRef] [PubMed]
  46. Toyooka, K.; Moriyasu, Y.; Goto, Y.; Takeuchi, M.; Fukuda, H.; Matsuoka, K. Protein aggregates are transported to vacuoles by a macroautophagic mechanism in nutrient-starved plant cells. Autophagy 2006, 2, 96–106. [Google Scholar] [CrossRef] [PubMed]
  47. Kononenko, N.V.; Sharova, A.A.; Fedoreyeva, L.I. Tissue damage to wheat seedlings (Triticum aestivum) under salt exposure. AIMS Agric. Food 2020, 5, 395–407. [Google Scholar] [CrossRef]
  48. Munns, R.; James, R.A.; Lauchli, A. Approaches to increasing the salt tolerance of wheat and other cereals. J. Exp. Bot. 2006, 57, 1025–1043. [Google Scholar] [CrossRef]
  49. Møller, I.S.; Gilliham, M.; Jha, D.; Mayo, G.M.; Roy, S.J.; Coates, J.C. Shoot Na+ exclusion and increased salinity tolerance engineered by cell type-specific alteration of Na+ transport in Arabidopsis. Plant Cell 2009, 21, 2163–2178. [Google Scholar] [CrossRef]
  50. Pei, D.; Zhang, W.; Sun, H.; Wei, X.; Yue, J.; Wang, H. Identification of autophagy-related genes ATG4 and ATG8 from wheat (Triticum aestivum L.) and profiling of their expression patterns responding to biotic and abiotic stresses. Plant Cell Rep. 2014, 33, 1697–1710. [Google Scholar] [CrossRef]
  51. Wanga, W.; Mugumea, Y.; Basshama, D.C. New advances in autophagy in plants: Regulation, selectivity and function. Semin. Cell Dev. Biol. 2018, 80, 113–122. [Google Scholar] [CrossRef]
  52. Shi, H.; Lee, B.H.; Wu, S.J.; Zhu, J.K. Overexpression of a plasma membrane Na+/H+ antiporter gene improves salt tolerance in Arabidopsis thaliana. Nat. Biotechnol. 2003, 21, 81–85. [Google Scholar] [CrossRef] [PubMed]
  53. Deinlein, U.; Stephan, A.B.; Horie, T.; Luo, W.; Xu, G.; Schroeder, J.I. Plant salt-tolerance mechanisms. Trends Plant Sci. 2014, 19, 371–379. [Google Scholar] [CrossRef] [PubMed]
  54. Yamaguchi, T.; Hamamoto, S.; Uozumi, N. Sodium transport system in plant cells. Front. Plant Sci. 2013, 4, 410–417. [Google Scholar] [CrossRef]
  55. Horie, T.; Hauser, F.; Schroeder, J.I. HKT transporter mediated salinity resistance mechanisms in Arabidopsis and monocot crop plants. Trends Plant Sci. 2009, 14, 660–668. [Google Scholar] [CrossRef] [PubMed]
  56. Platten, J.D.; Cotsaftis, O.; Berthomieu, P.; Bohnert, H.; Davenport, R.J.; Fairbairn, D.J. Nomenclature for HKT transporters, key determinants of plant salinity tolerance. Trends Plant Sci. 2006, 11, 372–374. [Google Scholar] [CrossRef] [PubMed]
  57. Noda, T.; Ohsumi, Y. Tor, a phosphatidylinositol kinase homologue, controls autophagy in yeast. J. Biol. Chem. 1998, 273, 3963–3966. [Google Scholar] [CrossRef]
  58. Pu, Y.; Luo, X.; Bassham, D.C. TOR-dependent and -independent pathways regulate autophagy in Arabidopsis thaliana. Front. Plant Sci. 2017, 8, 1204–1217. [Google Scholar] [CrossRef] [PubMed]
  59. Ryabovol, V.V.; Minibayeva, F.V. Autophagic Proteins ATG4 and ATG8 in Wheat: Structural Characteristics and Their Role under Stress Conditions Doklady. Biochem. Biophys. 2014, 458, 179–181. [Google Scholar] [CrossRef]
  60. Romanov, J.; Walczak, M.; Ibiricu, I.; Schüchner, S.; Ogris, E.; Kraft, C.; Martens, S. Mechanism and functions of membrane binding by the Atg5-Atg12/Atg16 complex during autophagosome formation. EMBO J. 2012, 31, 4304–4317. [Google Scholar] [CrossRef]
  61. Xie, Z.; Nair, U.; Klionsky, D.J. Atg8 controls phagophore expansion during autophagosome formation. Mol. Biol. Cell 2008, 19, 3290–3298. [Google Scholar] [CrossRef]
  62. Nair, U.; Yen, W.L.; Mari, M.; Cao, Y.; Xie, Z.; Baba, M. A role for Atg8-PE deconjugation in autophagosome biogenesis. Autophagy 2012, 8, 780–793. [Google Scholar] [CrossRef] [PubMed]
  63. Van Doorn, W.G.; Beers, E.P.; Dangl, J.L.; Franklin-Tong, V.E.; Gallois, P.; Hara-Nishimura, I.; Jones, A.M.; Kawai-Yamada, M.; Lam, E.; Mundy, J.; et al. Morphological classification of plant cell deaths. Cell Death Differ. 2011, 18, 1241–1246. [Google Scholar] [CrossRef] [PubMed]
  64. Inoue, Y.; Suzuki, T.; Hattori, M.; Yoshimoto, K.; Ohsumi, Y.; Moriyasu, Y. AtATG genes, homologs of yeast autophagy genes, are involved in constitutive autophagy in Arabidopsis root tip cells. Plant Cell Physiol. 2006, 47, 1641–1652. [Google Scholar] [CrossRef]
  65. Birgisdottir, A.B.; Lamark, T.; Johansen, T. The LIR motif—Crucial for selective autophagy. J. Cell Sci. 2013, 126, 3237–3247. [Google Scholar] [CrossRef]
  66. Zaffagnini, G.; Martens, S. Mechanisms of selective autophagy. J. Mol. Biol. 2016, 428, 1714–1724. [Google Scholar] [CrossRef] [PubMed]
  67. Izumi, M.; Ishida, H.; Nakamura, S.; Hidema, J. Entire photodamaged chloroplasts are transported to the central vacuole by autophagy. Plant Cell 2017, 29, 377–394. [Google Scholar] [CrossRef]
  68. Ashrafi, G.; Schwarz, T.L. The pathways of mitophagy for quality control and clearance of mitochondria. Cell Death Differ. 2013, 20, 31–42. [Google Scholar] [CrossRef]
  69. Bernales, S.; McDonald, K.L.; Walter, P. Autophagy counterbalances endoplasmic reticulum expansion during the unfolded protein response. PLoS Biol. 2006, 4, 2311–2324. [Google Scholar] [CrossRef]
  70. Yorimitsu, T.; Nair, U.; Yang, Z.; Klionsky, D.J. Endoplasmic reticulum stress triggers autophagy. J. Biol. Chem. 2006, 281, 30299–30304. [Google Scholar] [CrossRef]
  71. Kraft, C.; Deplazes, A.; Sohrmann, M.; Peter, M. Mature ribosomes are selectively degraded upon starvation by an autophagy pathway requiring the Ubp3p/Bre5p ubiquitin protease. Nat. Cell Biol. 2008, 10, 602–610. [Google Scholar] [CrossRef]
  72. Waliullah, T.M.; Yeasmin, A.M.; Kaneko, A.; Koike, N.; Terasawa, M.; Totsuka, T.; Ushimaru, T. Rim15 and Sch9 kinases are involved in induction of autophagic degradation of ribosomes in budding yeast. Biosci. Biotechnol. Biochem. 2017, 81, 307–310. [Google Scholar] [CrossRef] [PubMed]
  73. Inze, I.; Van Montagu, M. Oxidative stress in plants. Curr. Opin. Biotechnol. 1995, 6, 153–158. [Google Scholar] [CrossRef]
  74. Apel, K.; Hirt, H. Reactive oxygen species: Metabolism, oxidative stress and signal transduction. Annu. Rev. Plant Biol. 2004, 55, 373–399. [Google Scholar] [CrossRef] [PubMed]
  75. Pasternak, T.; Rudas, V.; Potter, G.; Jansen, K.M.A. Morphogenic effects of abiotic stress: Reorientation of growth in Arabidopsis thaliana seedlings. Environ. Exp. Bot. 2005, 53, 299–314. [Google Scholar] [CrossRef]
  76. Potters, G.; Pasternak, T.; Guisez, Y.; Palme, K.J.; Jansen, K.M.A. Stress-induced morphogenic responses: Growing out of trouble? Trends Plant Sci. 2007, 12, 98–105. [Google Scholar] [CrossRef]
  77. Potters, G.; Pasternak, T.; Guisez, Y.; Jansen, M.A.K.; Potters, G. Different stresses, similar morphogenic responses: Integrating a plethora of pathways. Plant Cell Environ. 2009, 32, 158. [Google Scholar] [CrossRef]
  78. Wang, L.Y.; Wang, G. Salt stress-induced programmed cell death in tobacco protoplastsis mediated by reactive oxygen species and mitochondrial permeability transition pore status. J. Plant Physiol. 2006, 63, 731–739. [Google Scholar]
  79. Mancini, A.; Buschini, A.; Maria Restivo, F.M.; Rossi, C.; Poli, P. Oxidative stress as DNA damage in different transgenic tobacco plants. Plant Sci. 2006, 170, 845–852. [Google Scholar] [CrossRef]
Figure 1. 10-day seedlings of wheat after germination under normal conditions (left) and chloride salinization (right) in roll culture. (A)—Variety Orenburgskaya 22; (B)—variety Zolotaya; (C,D)—biometric parameters; (C)—Root length: (D)—Shoot length: 1—variety Orenburgskaya 22; 2—variety Zolotaya. Blue—control, Orange—150 mM NaCl. The mean values (n = 30) and their standard deviations, p < 0.05. Different letters indicate significant differences at p< 0.05.
Agronomy 12 01909 g001
Figure 2. Expression of genes HKT in root and shoot of wheat Orenburgskaya 22 (1, 3) and Zolotaya (2, 4) grown in control condition (1, 2) and in presence of 150 mM NaCl. Bar represent standard deviation, p < 0.05. Different letters indicate significant differences at p < 0.05.
Agronomy 12 01909 g002
Figure 3. Expression of genes TOR, ATG1, ATG4, and ATG8 in root (1, 2) and shoot (3, 4) of wheat Orenburgskaya 22 (1, 3) and Zolotaya (2, 4) grown in control condition (1, 2) and in presence of 150 mM NaCl. Bar represent standard deviation, p < 0.05. Different letters indicate significant differences at p < 0.05.
Agronomy 12 01909 g003
Figure 4. Formation and fusion of vacuoles and autophagosomes in cells of the root cortex (ad) and aerial part (e,f) under control conditions and (a,c,e) under the influence of 150 mM NaCl. Designations: p—plastid; m—mitochondria; cw—cell wall; n—nucleus; v—vacuoles; a—autophagosomes; arrows point to the vacuole fusion sites; Red arrows indicate the position of the enlarged fragment with inserts with mitochondria. Bar 3 µm.
Agronomy 12 01909 g004
Figure 5. Distribution of ROS+ and ROS cells in the zones of 10-day wheat roots. (AD)—Orenburgskaya 22; (EH)—Zolotaya; (A,B,E,F)—control; (C,D,G,H)—150 mM NaCl: (A,C,E,G)—light microscopy; (B,D,F,H)—fluorescence microscopy, respectively. Bar 400 µm.
Agronomy 12 01909 g005
Figure 6. Trypan blue staining of coleoptile of 10-day seedlings differing in the number of dead cells. (A,B)—Orenburgskaya 22; (C,D)—Zolotaya; (A,C)—control; (B,D)—150 mM NaCl. Bar 400 µm.
Agronomy 12 01909 g006
Figure 7. Localization of phosphatidylserine on the surface of plasma membranes of root cells of 4-day-old seedlings of Triticum durum variety Zolotaya in the presence of 150 mM NaCl. (a,c)—Clusters of phosphatidylserine on surface plasmatic membranes (Annexin V-FITC), blue arrows; (b,d)—nuclei of cells (DAPI). Bar 200 µm.
Agronomy 12 01909 g007
Figure 8. DNA breaks in the nuclei of cell tissues of the roots of 4-day-old seedlings of Triticum aestivum variety Orenburgskaya 22 and Triticum durum variety Zolotaya in the presence of 150 mM NaCl, detected by the TUNEL method. (a,b,g)—Root cell nuclei (DAPI); (c,d,h)—phase contrast of cells; (e,f,i)—nuclei, micronuclei (arrows—white), and chromosomes with DNA breaks (arrows—red). Bar 200 µm.
Agronomy 12 01909 g008
Figure 9. DNA breaks in the nuclei of cell tissues of the roots of 4-day-old seedlings in the presence of 150 mM NaCl, detected by the TUNEL method in Triticum aestivum variety Orenburgskaya 22: (a,b,g)—root cell nuclei (DAPI); (c,d,h)—phase contrast of cells; and (e,f,i)—nuclei, micronuclei (arrows—white), and chromosomes with DNA breaks (arrows—green); and in Triticum durum variety Zolotaya, (c)—nuclei of root tissue cells (DAPI); (c,d)—nuclei with DNA breaks (arrows—green), Bar 200 µm.
Agronomy 12 01909 g009
Table 1. Ion content and electrical conductivity in root and shoot of Orenburgskaya 22 and Zolotaya wheat.
Wheat Variety Ions
K+, mkg/gNa+, mkg/gNa+/K+Cl, mkg/gElectrical Conductivity, mkSm
Oren-22control0.43 ± 0.02 e0.3 ± 0.01 e0.70 ± 0.03 d0.64 ± 0.03 e95.81 ± 4.8 f
root150 mM NaCl0.64 ± 0.03 d1.16 ± 0.06 c1.81 ± 0.06 a3.55 ± 0.18 b 234.73 ± 11.74 c
Oren-22control1.24 ± 0.06 c0.74 ± 0.04 d0.60 ± 0.03 e0.53 ± 0.03 f116.4 ± 5.82 e
shoot150 mM NaCl1.47 ± 0.07 b1.22 ± 0.06 c0.83 ± 0.04 c1.65 ± 0.08 d230.69 ± 11.53 c
Zolotayacontrol0.66 ± 0.03 d0.35 ± 0.02 e0.53 ± 0.02 f0.58 ± 0.03 e116.68 ± 5.83 e
root150 mM NaCl1.18 ± 0.06 c1.39 ± 0.07 b1.78 ± 0.05 a4.63 ± 0.23 a411.05 ± 20.55 a
Zolotayacontrol1.38 ± 0.07 b0.80 ± 0.04 d0.58 ± 0.02 e0.54 ± 0.03 f133.43 ± 6.67 d
shoot150 mM NaCl1.88 ± 0.09 a2.25 ± 0.11 a1.20 ± 0.04 b2.42 ± 0.12 c274.51 ± 13.72 b
The mean values (n = 3) and their standard deviations are shown according standard deviation, p < 0.05. Different letters indicate significant differences at p < 0.05.
Publisher’s Note: MDPI stays neutral with regard to jurisdictional claims in published maps and institutional affiliations.

