Article

Measuring Fluorescence as a Means to Evaluate the Physiological Reaction to Growth Retardant Applied to Manage Turf

Plant Breeding and Acclimatization Institute–National Research Institute, 05-870 Radzików, Poland
*
Author to whom correspondence should be addressed.
These authors contributed equally to this work.
Agronomy 2022, 12(8), 1776; https://doi.org/10.3390/agronomy12081776
Submission received: 31 May 2022 / Revised: 12 July 2022 / Accepted: 25 July 2022 / Published: 28 July 2022
(This article belongs to the Special Issue Turfgrass Simulation for Increased Performance in Changing Climate)

Abstract

:
This paper presents the effects of the physiological reaction of the main cool-season grass species used for turf in a temperate climate: perennial ryegrass, Kentucky bluegrass, and tall fescue, on a twice-a-year trinexapac-ethyl (TE) application in late spring and early autumn, seasons of rapid turf growth. The fully established turf plots in the split-plot system of three replicates, with three cultivars/species, were treated by TE (1.5 and 4.5 g/100 m2). The 4.5 g/100 m2 was harmful to Kentucky bluegrass. The perennial ryegrass responded by dose-dependent growth inhibition; 30–60% in spring and 25–40% in autumn for lower and higher doses, respectively. Tall fescue responded by 50% growth inhibition independently of concentration and season. Plant physiological responses, visualized as graphs of fluorescence data, revealed the stress of Kentucky bluegrass upon high TE dose. Based on principal component analysis (PCA) analysis, three groups were distinguished: perennial ryegrass varieties from high and low TE treatments and Kentucky bluegrass varieties from high TE. TE-dependent growth reduction with no significant quality decrease benefits the environment by reducing carbon footprint machine operations (mowing). Utilizing fluorescence measurement may help to manage turf physiology.

1. Introduction

Perennial ryegrass (Lolium perenne L.), Kentucky bluegrass (Poa pratensis L.), and tall fescue (Festuca arundinacea L. syn. Schedonorus arundinaceus L.) are the most used species among cool season turfgrasses on urban turfs. In a temperate climate zone, perennial ryegrass is used virtually in every turf grass seed mixture due to rapid seed emergence and high vigor of seedlings resulting in rapid turf establishment. As a component of well-managed turf, it is resistant to traffic, but unfortunately, it is also prone to diseases that develop in temperatures around zero centigrade [1]. Kentucky bluegrass, by contrast, germinates relatively slowly and takes longer to establish turf. Its significant advantage is forming rhizomes, which are more resistant to tearing, facilitating easier recovery (if tears happen) compared to the bunch-type perennial ryegrass or tall fescue [2]. Tall fescue creates a deep root system, making this species the most tolerant to drought among the three investigated species [3,4].
Late spring and early autumn are periods of frequent mowing in Europe and North America’s temperate climate zones corresponding to timing of growth of grasses during optimal temperatures and light conditions. As a result, the biomass of clippings is about 5.3 times greater than in the middle of the summer [5,6]. The intensity of grass elongation growth in late spring/early autumn can be estimated as fourfold higher than in March and in November, at the beginning and the end of annual vegetation, and 2.5 times higher as compared to the midsummer (Figure 1).
Ignatieva et al. [7,8] estimated that, on a world scale, turfs occupy more than half of urban green areas as green carpets surrounding buildings, decorative elements in parks, and natural covers of stadiums and playgrounds. Although there is currently scientific evidence of the adverse effects of low-mown turfs on biodiversity, low-mown turfs are still a frequent priority for green architecture [9]. Low-mown properties also result from what is often pictured as a perfect yard [10,11]. In such places, the limits of turf care should be considered a pro-ecological action, reducing maintenance costs and the carbon footprint.
Mowing is still one of turf management’s most energy-intensive cultural practices [12]. Continuous use of mowers powered by internal combustion engines results in release to the atmosphere: carbon mono and di-oxides, sulfur trioxide, and hydrocarbons (HC) and their derivatives. It was estimated that lawnmowers contribute 5.2 and 11.6% to the emission of carbon monoxide and non-methane hydrocarbons, respectively, compared to road transport emissions in Australia [13]. The meta-analysis of the mowing frequency impact on the environment shows positive ecological effects with reduced mowing frequency [5]. High turf maintenance costs consist of fossil-fuel-driven mowing, application of chemicals, and irrigation [14]. Fuel used for mowing is responsible for 0.85 kg of carbon equivalent (Ce) emitted to the atmosphere for 1 kg of gasoline and 0.94 kg for 1 kg of diesel fuel used [14]. According to Allaire et al. [15], frequently mowed sites emit up to 2.0 kg m−2 CO2 annually.
Plant growth regulators (primarily acting as gibberellins’ inhibitors) are commonly used to slow down plant elongation and, consequently, the number of mowings and accumulated biomass [16,17,18,19,20]. Growth inhibition results in a higher density of leaf mesophilic cells and thus higher chlorophyll concentration, seen as a darker green. It also affects turf density, tillering, longer greenness in fall and earlier greening up in spring, greater grass tolerance to shade, diseases, and unfavorable temperatures [17,21,22,23,24].
Our present research aimed to determine whether using a growth regulator contributes to the stress induction in plants and, if so, is this reaction the same for different species of grasses. Chl a fluorescence measurements are used as a screening method to detect plant physiological state.
In 1991 Syngenta introduced Primo maxx®, containing trinexapac-ethyl (TE), as an active substance [21], which suppresses the activity of the 3-β-hydroxylase enzyme required for the synthesis of gibberellin (GA1) active form. As the labeling of Primo maxx® gives divergent dosing recommendations for different years (Table 1), we decided to use a lowered dose to assess whether the TE dose reducing or overdosing could be possible. Three turf species, three varieties each, were studied under the two doses of TE treated in the field twice a year.

2. Materials and Methods

2.1. Plant Materials and Field Studies

Three grass species, each represented by three varieties, were used for the experiment: perennial ryegrass (Lolium perenne L.), varieties: Goalkeeper, Jackento, Top Gun; Kentucky bluegrass (Poa pratensis L.), varieties: Award, BlueChip, Liberator, and tall fescue (Festuca arundinacea L. syn. Schedonorus arundinaceus L.), varieties: Arid 3, Pixi and Stowell. The experiment was performed twice (in 2018 and 2019), in 3 replications in the split-plot system, in which the TE dose was the first factor and grass varieties were the second- factor. The experiment was run at the Plant Breeding and Acclimatization Institute-National Research Institute, Poland (GPS 52°12′49″ N, 020°38′33″ E), in an open area with full sun on sandy loam soil (58.4% of sand, 38.7% of silt, 2.9% of clay). The initial contents of macronutrients was (in mg/L of soil): N—16, P—88, K—130, Mg117 and Ca—1120. Soil pHKCl was 7.24, and soil organic matter content 1.5%. The field size was 77 m × 25 m, and the size of a single plot of 2 m × 2 m. Seeds sowing rates were: 20 g/m2 of perennial ryegrass, 10 g/m2 Kentucky bluegrass, and 25 g/m2 tall fescue [25].
The management practice consisted of once a week of mowing (at midday) to a height of 3 cm, beginning in April and continuing through to mid-November (in sum, 30 mowings per year). Ammonium nitrate, NH4NO3, was applied twice (2.5 kg/100 m2) in the last weeks of both April and August. Additionally, plots were watered by a Rain Bird system equipped with SMRT-Y Soil Moisture Sensor (Rain Bird Ltd., Brentwood, UK), which turned on/off irrigation in response to soil moisture at 60–80% of soil water capacity. Spray applications of TE (Modus, Syngenta Ltd., Bracknell, UK; 250 g/L concentration) were made on fully established turf plots for two consecutive years (2018 and 2019) twice a year, at the beginning of May and at the transition between August and September, promptly after mowing and fertilization, during windless and sunny days at temperatures 20–23 °C and air humidity 55–70%, typical for the study’s region. A Kombi Classic battery sprayer (Fleet Line Markers Ltd., Malvern, UK), generating 200 kPa (2 bar) pressure, was used to apply TE in doses: 0 (control), 1.5 (low), and 4.5 (high) [g/100 m2].

2.2. Evaluation of TE Influence on Turfs

The turfgrass quality, grass height, clipping yield, chlorophyll content, and Chl a fluorescence were collected one and five weeks after TE application. Evaluations based on a 9-grade scale included: visual merit, turf density, and color. Visual merit is defined by the British Society of Plant Breeders Ltd. (2021) as “an overall measure of the suitability of the turf for its potential use. It is a combination of sward density, leaf width, disease resistance, color, and other factors which could influence appearance, such as “cleanness of cut” (Table 2) [26].
Grass height was measured on three randomly selected places per plot Using Prism Gauge (Bernhard and Company Ltd., Rugby, Warwickshire, UK). The dry mass of the clippings was determined after overnight drying at 105 °C. Clippings were collected separately from each plot using a Stiga Ltd. rotary mower 48 cm wide, with a basket (cutting height 3 cm).
Chlorophyll index (CI) was estimated using a contactless FieldScout Chlorophyll Meter CM100 (Spectrum Technologies, Inc., Plainfield, IL, USA) and expressed in relative units (0–999). Three measurements per plot were done at noon on a full sunny day.
Chl a fluorescence was measured using PocketPEA portable fluorimeter (Hansatech Instruments, King’s Lynn, Norfolk, UK) in three replications per plot [27]. First, the fluorescence was induced in a leaf previously darkened for 30 min by red (627 nm), saturating light of 3500 µmol m−2 s−1. Then, the first 3 s of fluorescence were registered, and the collected data were elaborated using PocketPEA dedicated software to extract the photosynthesis-related parameters [28,29]. Parameters list and their biophysical meaning: FO (initial fluorescence value at 50 µs responding to radiation losses during migration of excitation energy induced by photons in chlorophyll antennas); FM (maximum usually after 0.5–1 s responding to a total reduction of Photosystem II (PS II)); TFM (time to reach FM); FV (maximal variable fluorescence, a difference between maximal and minimal fluorescence); FV/FM (the ratio of variable and maximal fluorescence reflecting the force of the photosynthetic light reactions); FV/FO (the ratio of variable and initial fluorescence reflecting the efficiency of the water-splitting complex on the donor side of PS II); Area (the total area between the y-axis and increasing part of fluorescence curve on fluorescence plot reflecting the pool size of reduced acceptors); RCABS (the number of active reaction centers in chlorophyll antennas per absorption); (1 − VJ)/VJ) (the measure of forwarding electron transport); PIABS (the performance index).
Additionally, the row fluorescence data were double normalized. The differences between the fluorescence values of TE-treated plants and the values measured on control plants, presented on a logarithmic time scale, formed the ΔWOJ parabolic curves. On such graphs, the extremum with the negative value is characteristic of the plants in good physiological condition, contrary to the positive ones [28,30,31].

2.3. Climatic Data

The temperature and the precipitation were registered by automatic weather station MAWS101 (Vaisala, Finland) localized on the experimental fields.
The weather differed slightly from the multi-year average during the investigation (years 2018 and 2019) (Table 3). The annual average temperatures were higher by 2.0 °C in the first year and 2.6 °C in the next year than the long-term average (8.3 °C). Exceptions occurred only in February and March 2018, thus in months with no plant vegetation in a temperate climate. On the other hand, the annual sum of precipitations was lower (in 2018 by 4%, and in 2019 by 15%) than the long-term average, inducing the periodical droughts. The experimental fields were irrigated to eliminate the effects of drought.

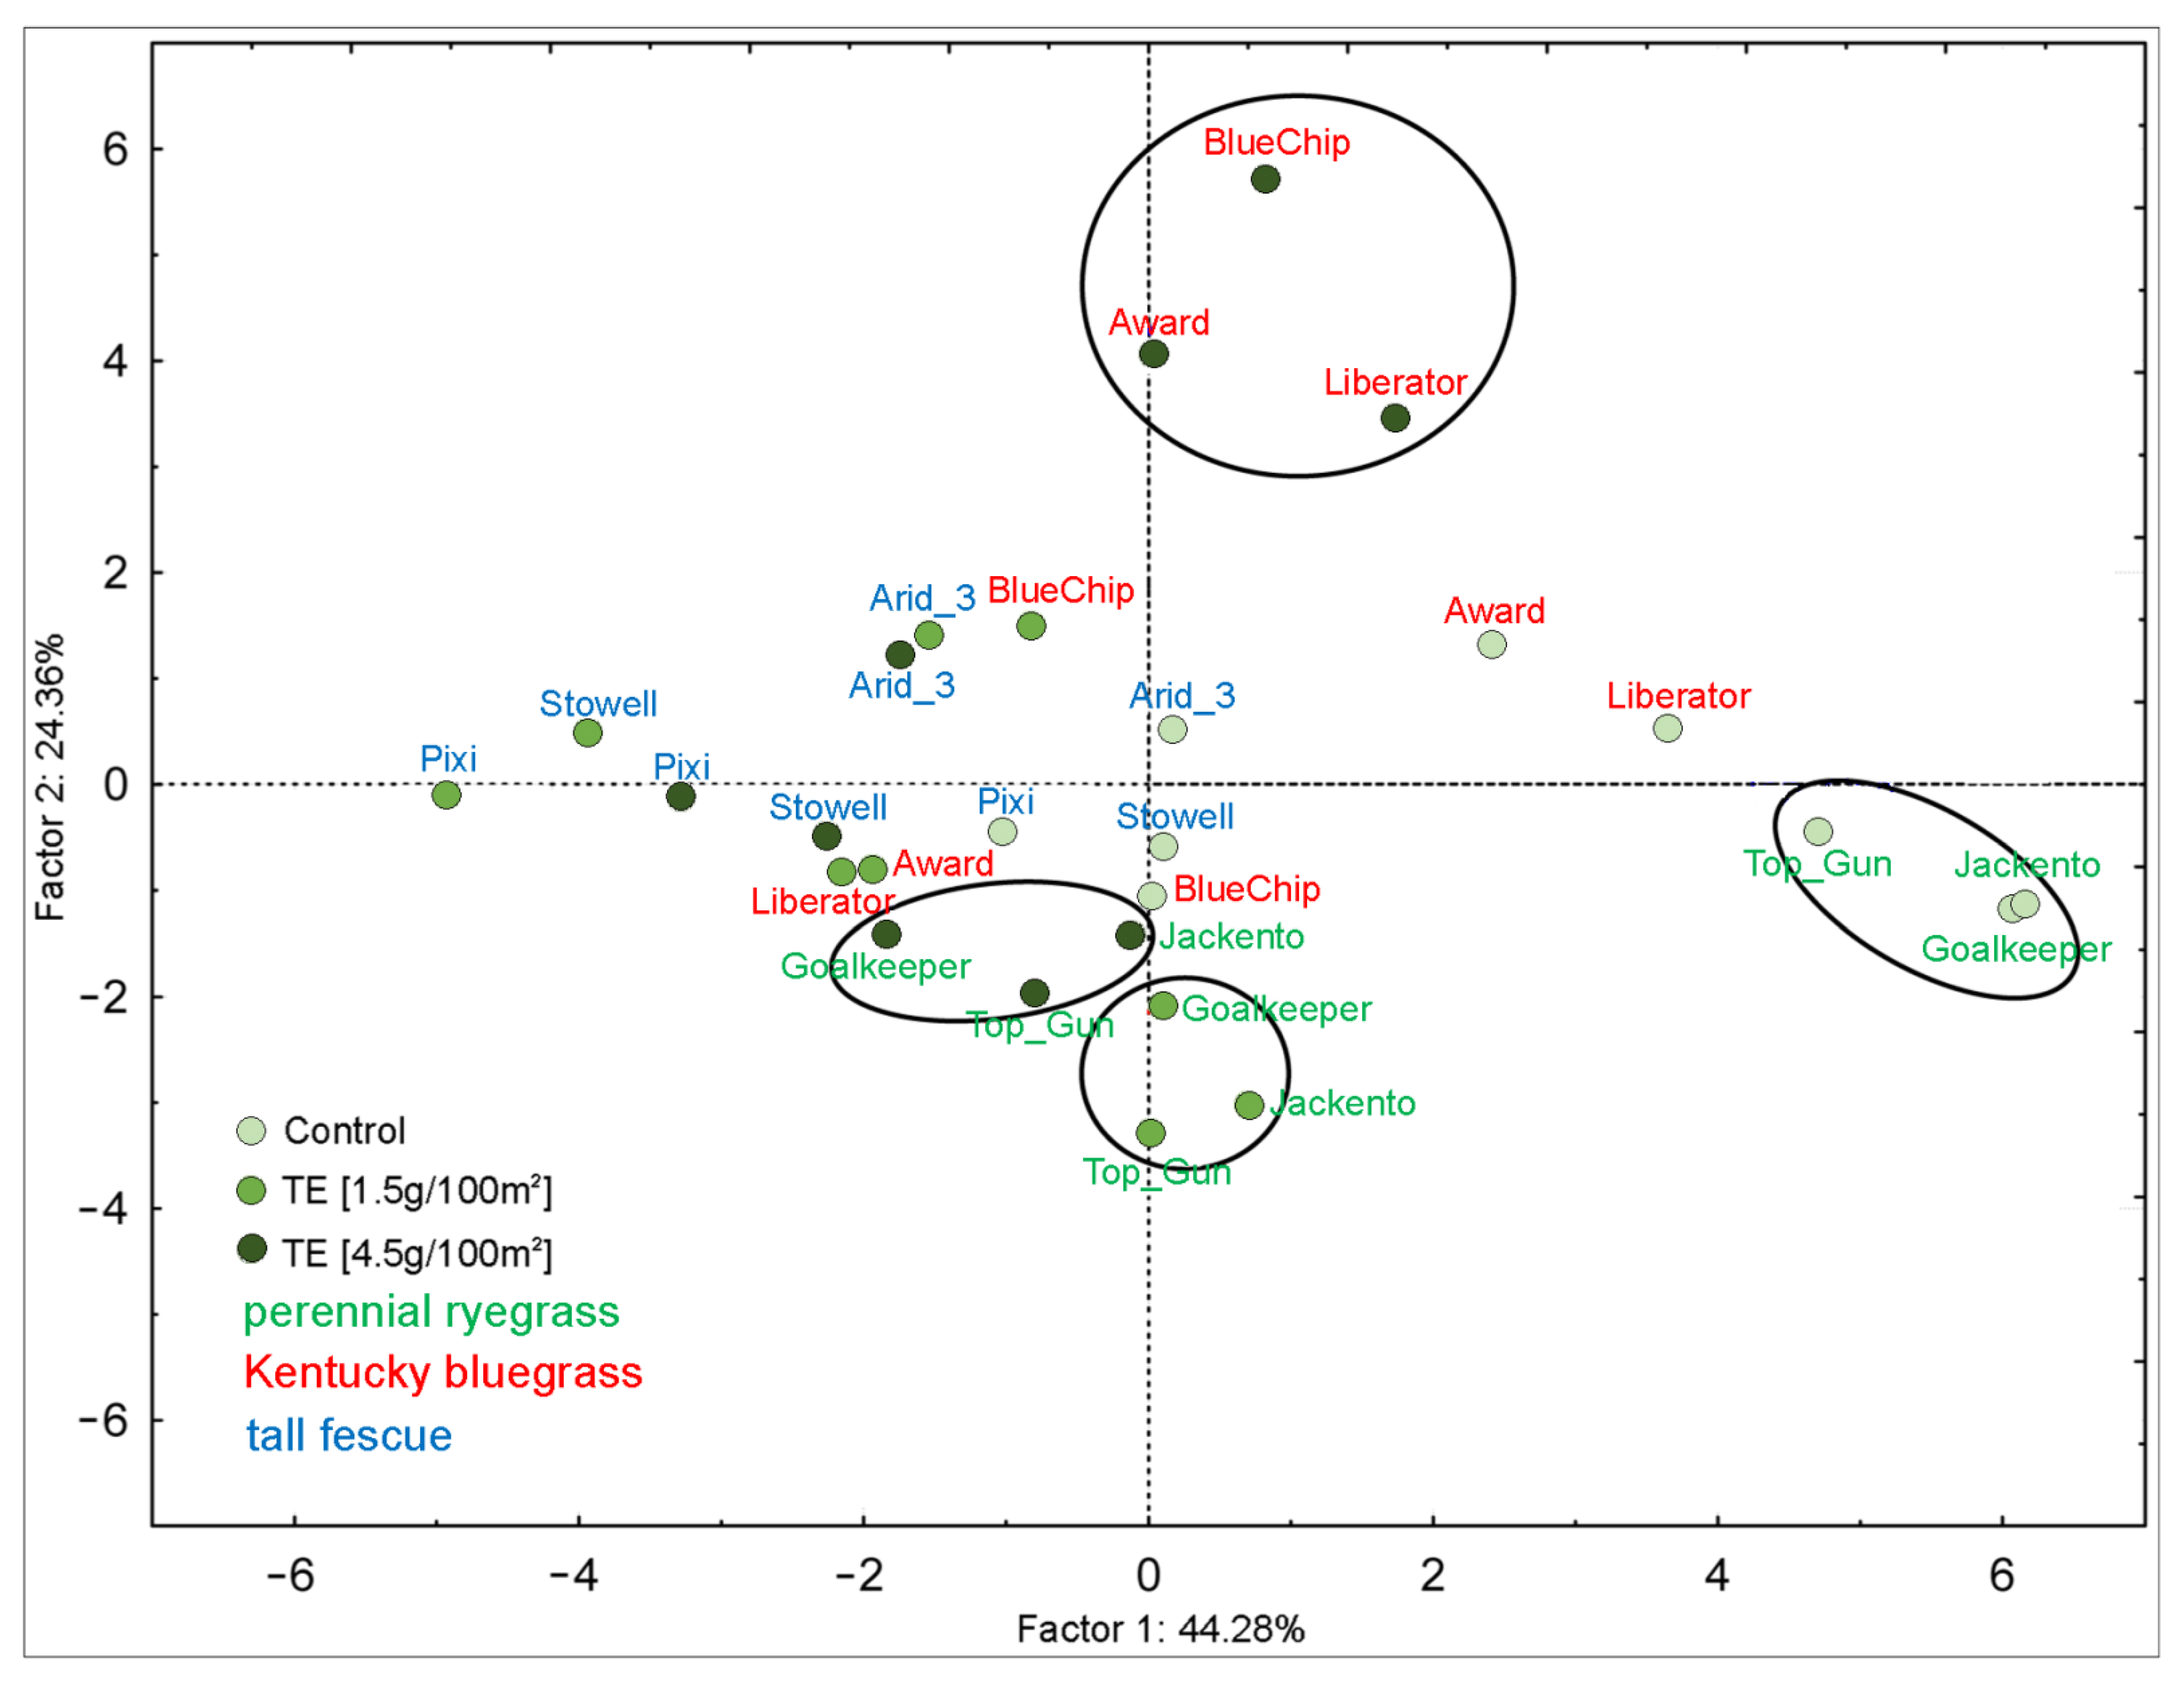
2.4. Statistical Analysis and Results Visualization

The two-way analysis of variance (ANOVA) for the split-plot experiment, at p ≤ 0.05, and post-hoc Duncan test were applied for differences probability evaluation. Additionally, the Least Significant Difference (LSD) was calculated with the same accuracy. Detailed results of ANOVA are given in Supplementary Materials. In the main text results are presented in Figures. Principal component analysis (PCA), based on a correlation matrix algorithm, was performed for CI, all chlorophyll a fluorescence traits, and visually collected data. Two-year averages were used for the calculations. All calculations were made using STATISTICA® 13 for Windows (StatSoft (Europe) GmbH, Hamburg, Germany).

3. Results

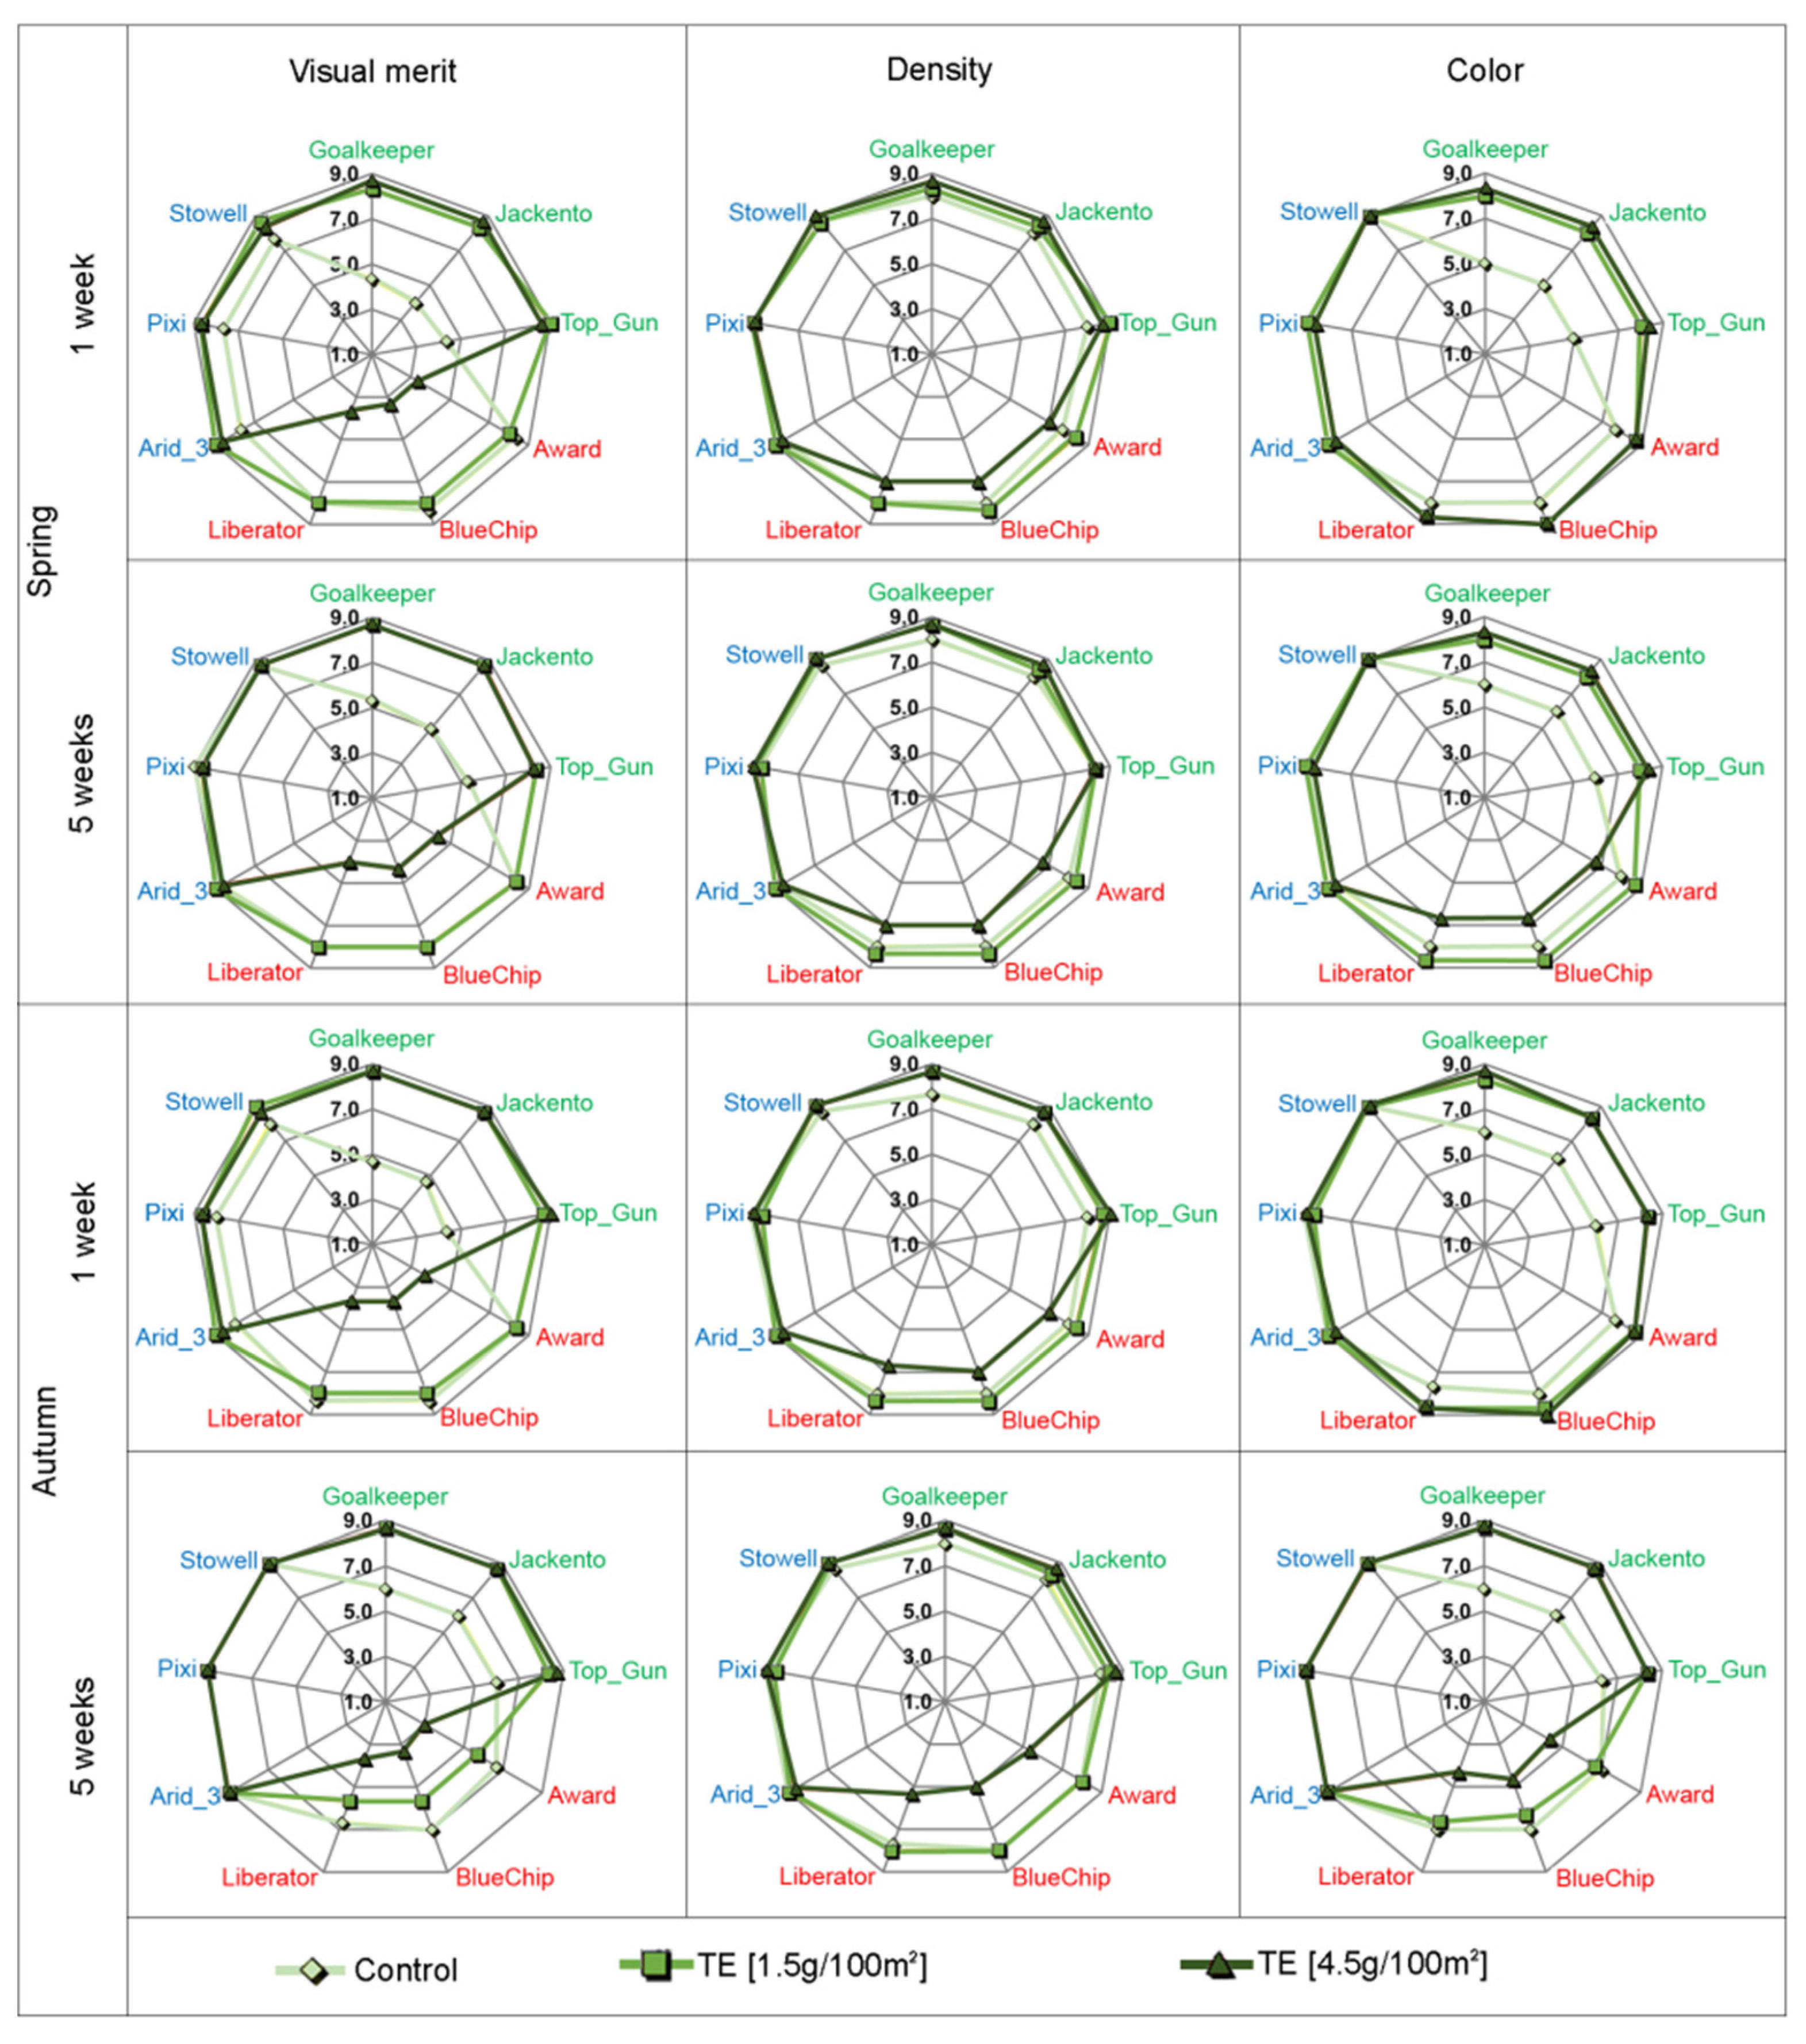
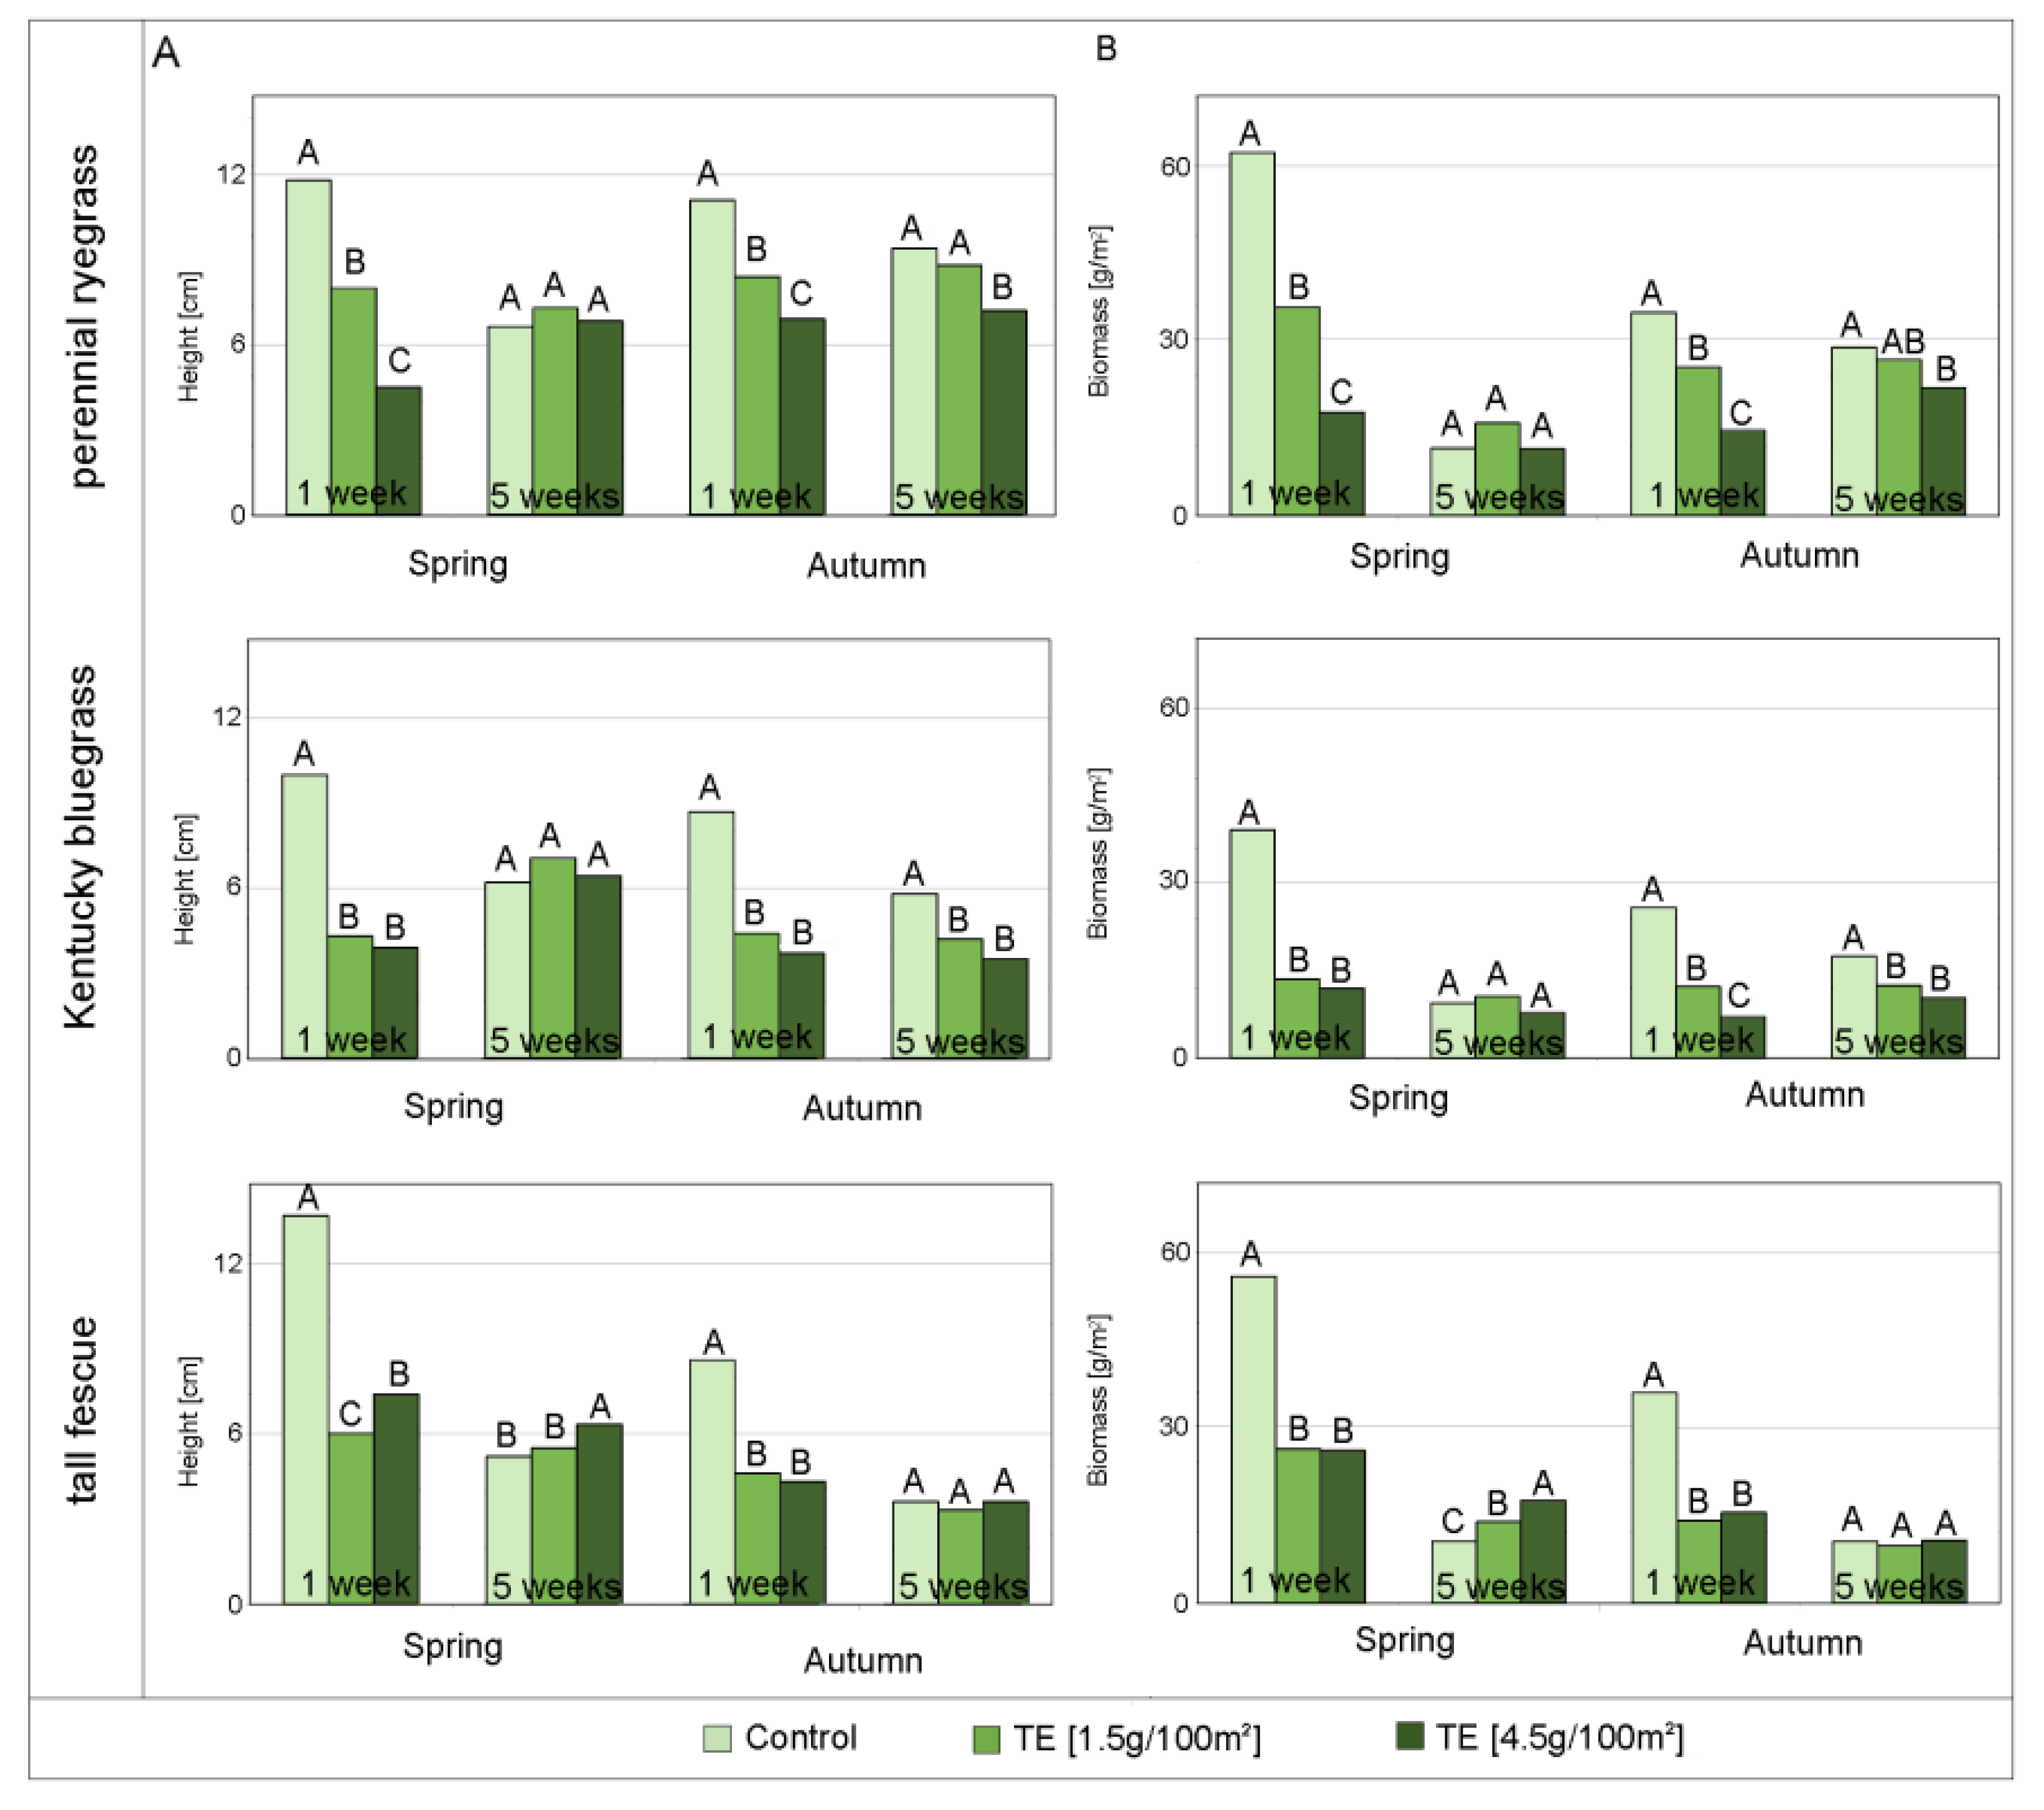
3.1. Turf Visual and Biometric Ratings

The trinexapac-ethyl application resulted in variation of visual scores for different turf species but not among varieties within species (Figure 2, Supplementary Table S1). The Kentucky bluegrass was the most sensitive: a high TE dose irreversibly decreased the turf’s visual merit, evaluated in spring was changing from 8 points in control to 3 after one week and 5 points after five weeks post-treatment. No regeneration post five weeks was detected in the autumn. On the contrary, the visual merit of perennial ryegrass was enhanced by 4 points, independently of the dose. The tall fescue turfs were ideal in all conditions. Turf density and color were less affected than visual merit. Turf density was, in general, high (7–9 points). Only the Kentucky bluegrass turfs were thinned via the high TE dose (5 points). Moreover, its color was light green, and after the TE treatment, it became even weaker. On the contrary, the perennial ryegrass color became darker via the TE treatment, independently of term and dose (increasing up to 8 points) (Figure 2, Supplementary Table S1).
The higher the TE dose, the slower regrowth rate, and thus lower biomass clipped, especially after the first week of TE application. The differences were visible between species (Figure 3) and slightly between varieties (Supplementary Table S2). In spring, a 1st-week post TE application, the growth of perennial ryegrass was inhibited by 30% and 60%, by lower and higher TE doses, respectively, whereas for other species, regardless of the growth retardant concentration (Kentucky bluegrass by 60% and tall fescue by 50%). In the 5th week, nearly no statistically proven differences between control and TE-treated plots were detected. The only exception was tall fescue treated by a higher TE dose, with regrowth ca. 10% higher than control. The regrowth patterns were repeated when the grass elongation growth was slower in the autumn. The ryegrass regrowth was inhibited by ca. 25 and 40% depending on TE dose, whereas the two other species by 50% regardless of TE concentration. After five weeks in fall, the TE influence on turfs regrowth was minor (Figure 3, Supplementary Table S2). The clipping yields aligned with the elongation growth (Supplementary Figure S1, Supplementary Table S2).

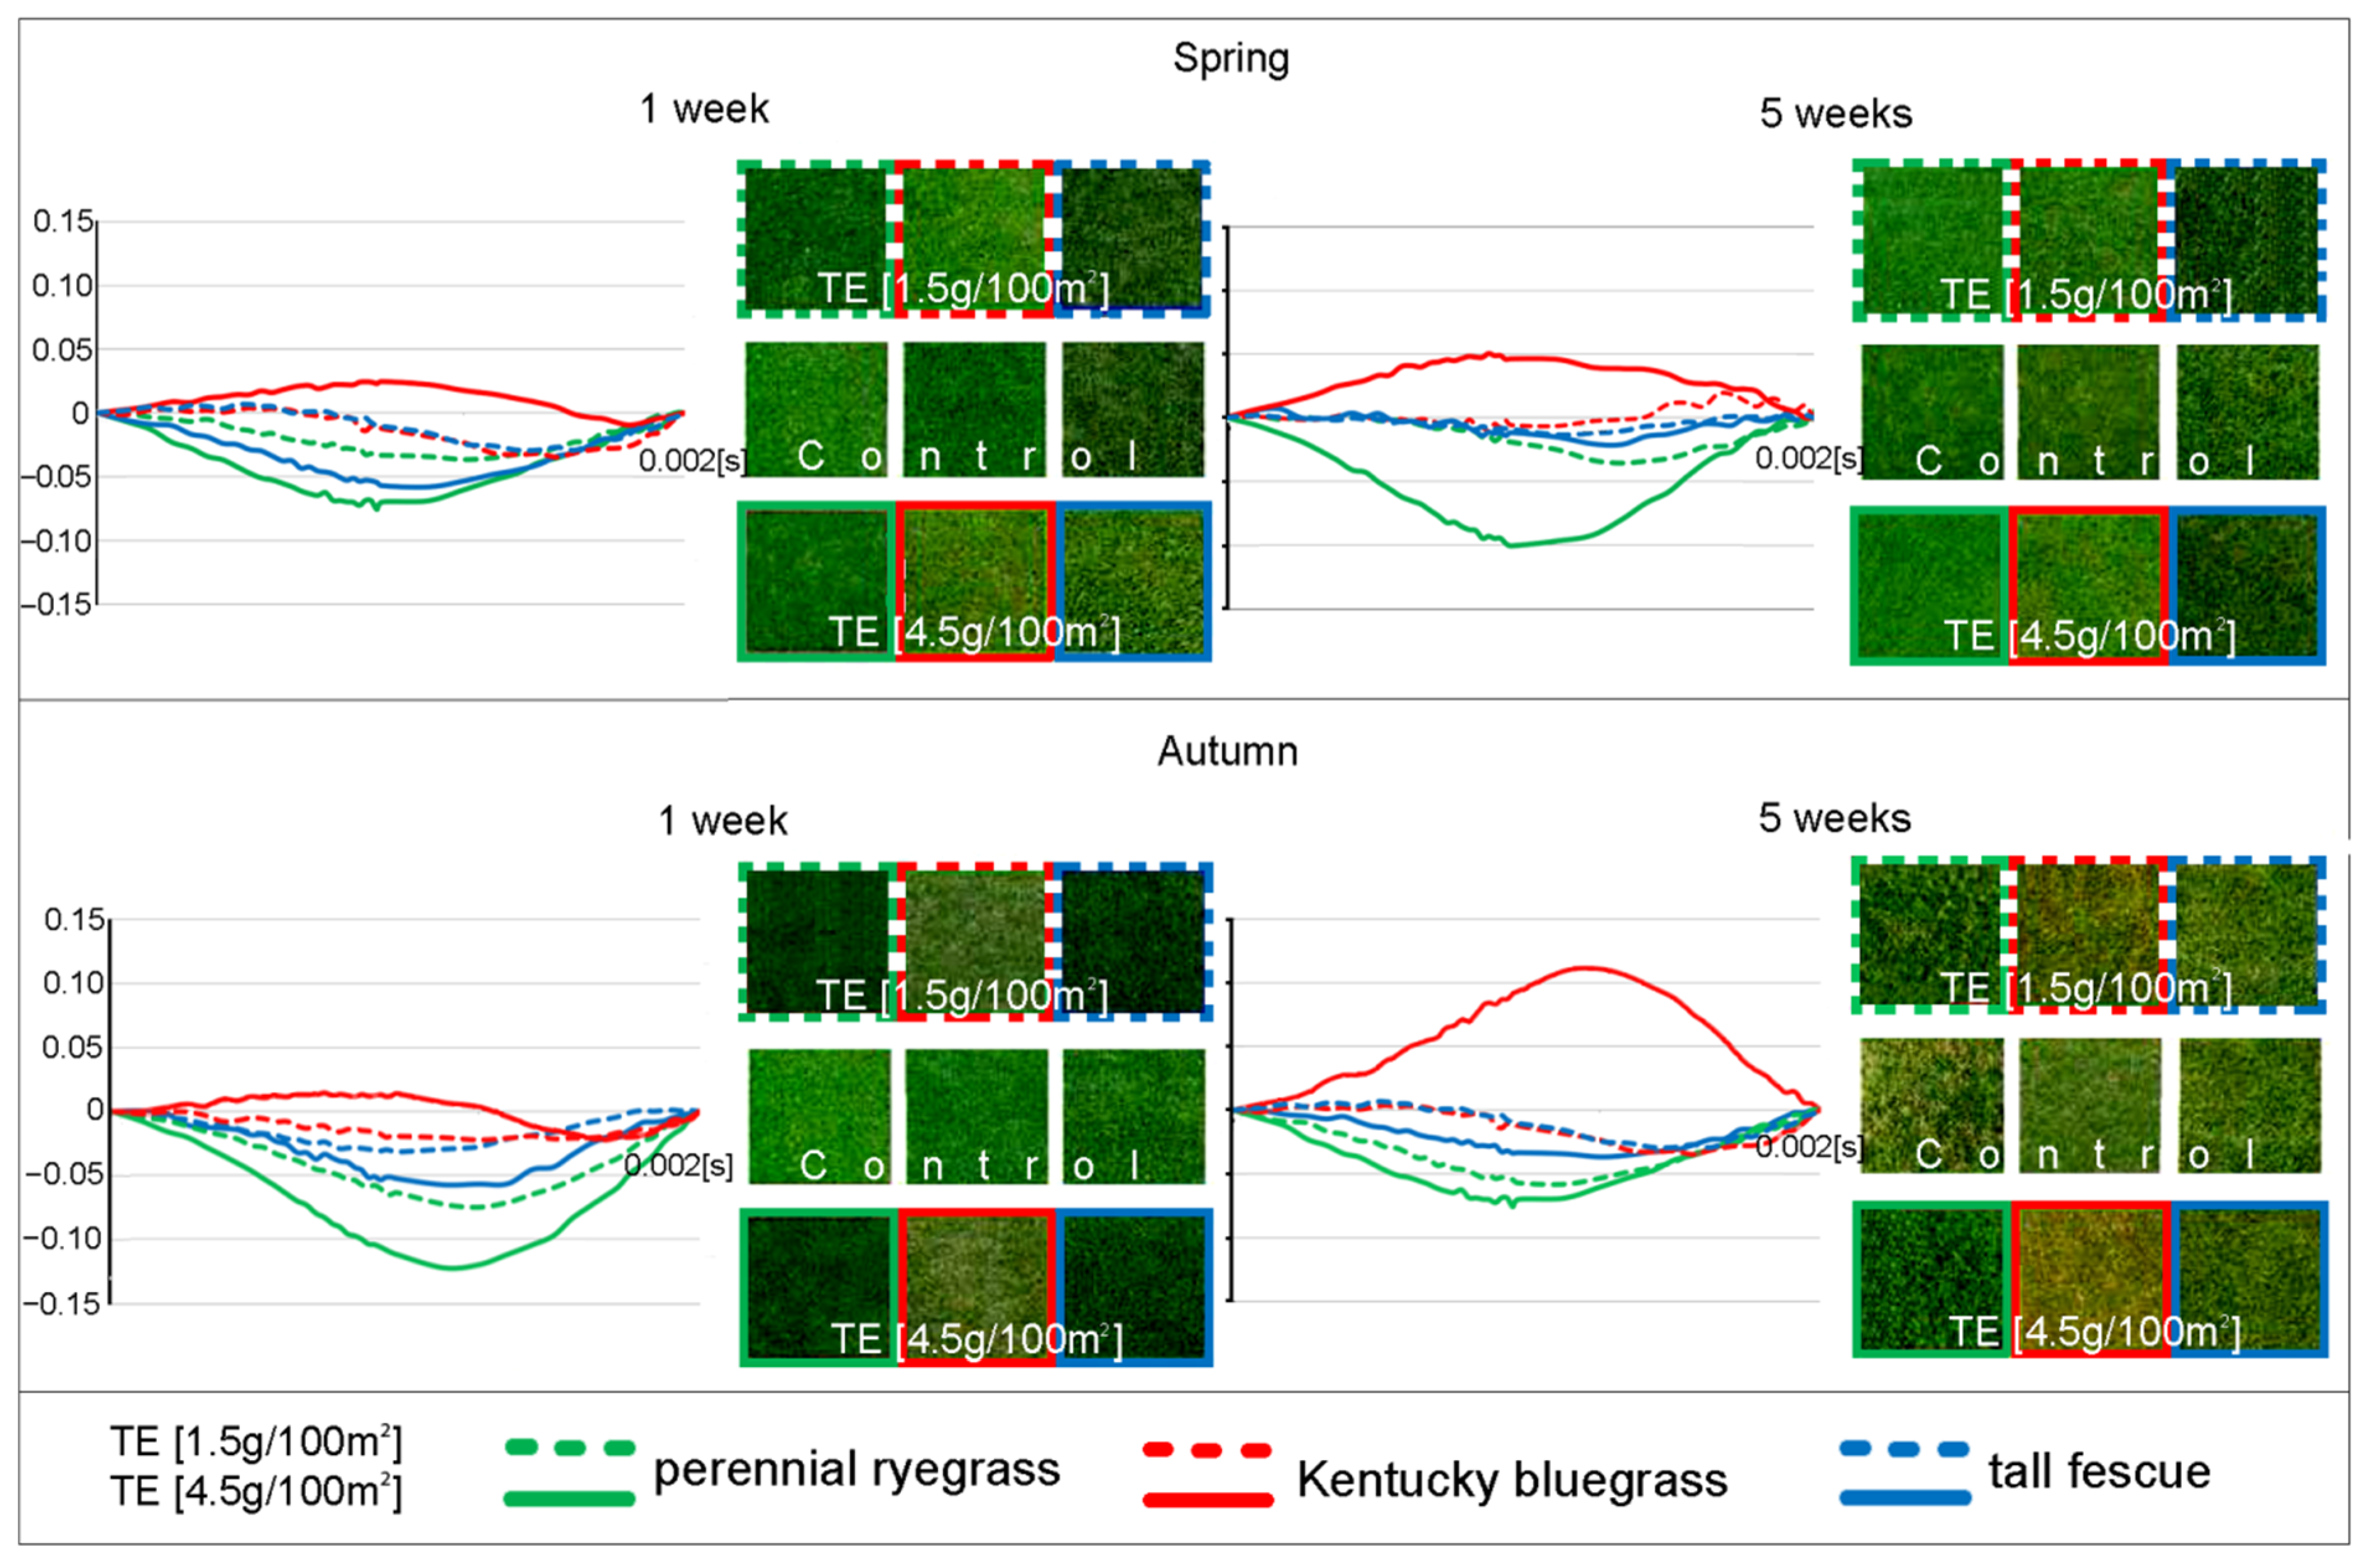
3.2. TE Influence on the Chlorophyll Index (CI) and Chl a Fluorescence

The Chlorophyll Index (CI) reflects the turf greenness by giving information about the relative chlorophyll content in plants. The higher the CI, the greener the turf is. In the first-week post-TE treatment, the CI of control plots in spring was more elevated than treated ones except for the Goalkeeper variety of perennial ryegrass. In five weeks, in spring and autumn, CI was higher on TE-treated plots by 22% on average. Kentucky bluegrass and tall fescue (beside Pixi variety) responded to a single dose (on average by 60% CI increase, whereas perennial ryegrass to a triple dose by 80%) (Table 4).
Results of Chl a fluorescence measures were analyzed as double normalized fluorescence curves (Figure 4) and in the form of fluorescence parameters (Supplementary Table S3a,b) [28,31,32,33]. TE treatments at both terms and doses, for all species but Kentucky bluegrass, have a neutral or positive influence on photosynthesis. All ΔWOJ curves have minor inflection points (Figure 4) beside the maximum of Kentucky bluegrass at the 5th-week post-high TE dose. On the other hand, a significant ΔWOJ minimum was found for perennial ryegrass at the 5th week post-high TE dose, thus outperforming the other two species in terms of photosynthesis. Interaction between TE doses and cultivar was most evident in tall fescue (Supplementary Table S3a,b).
The Chl a fluorescence parameters, the chlorophyll index, the turfgrass height, clipped biomass, and visual evaluation parameters were used for the principal component analysis (PCA) (Figure 5, Supplementary Table S3).
Four factors explained over 90% of the cumulative variance (Supplementary Table S4). The first component (PC1) explains 45% of the variance and includes 11 out of 16 parameters used for PCA. Extreme negative weights (<−0.9) have: PIABS (performance index), FV/FO (efficiency of the water-splitting complex on the donor side of PSII), FV/FM (the ratio of variable and maximal fluorescence reflecting the force of the photosynthetic light reactions) and RCABS (the number of active reaction centers in chlorophyll antennas per absorption). The second component explains 26% of the variance and includes eight parameters, among which strong negative weights (<−0.7) belonged to FO (initial fluorescence) and FM (maximal fluorescence). Finally, factors 3 and 4 explain about 20% of the variability. PC3 components with positive weights (>+0.5) were: visual merit and turf density. PC4 components were: TFM with a positive weight (>+0.8), and the Chlorophyll Index with a negative weight (<−0.6). PCA grouping in a two-dimensional coordinate system was as follows: perennial ryegrass, three groups of varieties: control, low, and high TE doses; Kentucky bluegrass, only one group separated upon high-TE treatment; tall fescue varieties not grouped (Figure 5).

4. Discussion

4.1. Effects of Trinexapac-Ethyl (TE) on Turf Physiology as Measured via Chlorophyll Index and Fluorescence Data

In general, the growth inhibition is accompanied by good visual merit of perennial ryegrass and tall fescue turfs; the deeper green of leaves resulting from the same number of chloroplasts in leaves of a lower leaf area in TE-treated plants [17,21,22,23,30,31,32]. However, our experiment shows growth inhibition of the Kentucky bluegrass without improvement of visual merit. That is in line with Meghyn et al. [32], who used 2.3 g/100 m2 of TE to test the hybrid bluegrass’s shade response (Poa arachnifera Torr. × Poa pratensis L.) in comparison with Kentucky bluegrass and tall fescue. Serensits et al. [20] used 1.7 g/100 m2 of TE and Ervin and Koski [31,33] 2.7 g/100 m2 with the same effect. According to our knowledge, there is no information about Kentucky bluegrass reaction to TE overdose. In our studies, Kentucky bluegrass’ over-sensitive response to TE is manifested by the decreased turf quality and gray-green color. The worse physiological condition was confirmed by chlorophyll index (CI) and Chl a fluorescence data [34]. The fluorescence parameters and the ∆WOJ curves demonstrated the stress of Kentucky bluegrass plants treated by a higher TE dose. Both gave information about the biophysical status of photosynthetic apparatus and showed a worse physiological state of Kentucky bluegrass [8,27,35,36,37]. The concentration of TE, which is harmful, depends on the species. Overdosing induces physiological stress, reflected by the reduction of the chlorophyll antenna and light-capturing complexes, slowing down the redox reactions at the PS II donor and acceptor sides and even along the entire electron transport chain, influencing the redox balance of the whole cell [28,29,38]. Aamlid et al. suggested a general rule when using Primo MAXX® on nordic golf courses: the dose should be reduced by half of that recommended by the manufacturer [16]. The perennial ryegrass response proportional to TE doses is typical, i.e., as seen in Sheikh Mohammadi et al. [22] or Głąb et al. [17]. The response of tall fescue in the way independent of TE dose suggests the lower TE requirements of that species. In our experiment, the CI and Chl a fluorescence parameters and the ∆WOJ curves with visible minimum indicate a better physiological status of that species via TE treatment.

4.2. Benefits of the Study and Possibilities of the Use of TE in Turfgrass Management

Our experiment overviews the variation in turf response to TE, used twice per year, at months of the highest biomass formation during the season. Its usage reduced, on average, the clipped biomass by 30%. Besides subjective visual turf quality evaluation (Table 2), the non-invasive measuring devices were used to objectify an assessment of the lawn quality and to generate many parameters, which could be used for statistical inference.
Our research was carried out on separate species. Thus, the evaluation of species succession in the lawn calls for the further investigation of Kentucky bluegrass successes after perennial ryegrass during turf formation at a newly seeded area [38]. Since the Kentucky bluegrass is sensitive to TE. TE overdoses can seriously damage the freshly sown lawn. Such information is essential for green areas management. Further research should explore TE’s influence on the species in turf mixtures and the degree of weed infestation.

4.3. Implications for Turf Management

Implications for turf management should be considered in two aspects, i.e., aesthetic, with local scope, and the carbon footprint aspect, at a global scale.
When using TE, the turf colonization by particular species should be considered due to differential sensitivity to TE treatment. Since perennial ryegrass (very tolerant to adverse impacts of TE) dominates in turfs in the first two years after sowing, and Kentucky bluegrass (sensitive) begins to dominate after that, TE overdoses should be avoided, especially on older turfs. Tall fescue has an intermediate turf establishment rate, slightly slower than perennial ryegrass but faster than Kentucky bluegrass. It is used in seed mixtures due to lower demand for water and fertilization, critical for lowering turf maintenance costs, and the pro-ecological importance of water saving in a warming climate [39].
We have shown that perennial ryegrass is very tolerant to TE doses, while Kentucky bluegrass is sensitive. High TE doses in the first years of the turf usage may result in the disappearance of a Kentucky bluegrass and the formation of a perennial ryegrass monoculture turf, which is sensitive to diseases due to the relatively low resistance of perennial ryegrass to diseases, for example, snow mold [1,40,41]. Such monoculture turf under low fertilization can become visually unattractive (gray-green color instead of dark green). So, balancing the proportion of fertilizers and growth retardants with an expectation of the turf’s age, influencing the succession of species, is essential for turf visual appearance. If tall fescue dominates on the turf TE doses can be considered lower than 1.5 [g/100 m2].
The present experiment may aid the choice of TE doses depending on the turf species composition. However, the TE doses should be as small as possible to obtain the highest turf quality and the lowest maintenance costs, jointly with the pro-ecological principle of sustainable development [42]. Additionally, our studies have shown that using the Fieldscout CM 1000 Meter, the detection of TE influence on grass species and its potential harmful effect is possible. A previously documented use of the CM 1000 Meter was for turf nitrogen fertilization effects or differences in savannah grass (Axonopus compressus (Sw.) P. Beauv.) responses to drought and soil compaction [42,43]. Measures of Chlorophyll a fluorescence make it possible to compare plants’ physiological status upon the TE treatment.

Supplementary Materials

The following are available online at https://www.mdpi.com/article/10.3390/agronomy12081776/s1; Table S1: Results of ANOVA, two-way analysis of variance for the split-plot designed experiment, followed by homogeneous group identification using Duncan’s multiple comparisons of turf ratings, Table S2: Results of ANOVA, two-way analysis of variance for the split-plot designed experiment, followed by homogeneous group identification using Duncan’s multiple comparisons of phenotypic data (height, biomass, Chlorophyll index), Table S3. Results of ANOVA, two-way analysis of variance for the split-plot designed experiment, followed by homogeneous group identification using Duncan’s multiple comparison procedures for (a) measured Chl a fluorescence parameters: FO, FM, FV, TFM, Area; (b) calculated Chl a fluorescence parameters: FV/FM, FO/FM, RCABS, (1−VJ)/VJ and PI, Table S4: (a) Eigenvector values of principal components calculated for a complete dataset; (b) The loading weights of each dataset variable on each principal component, Figure S1. The correlation between grass height [cm] and clipped biomass [g/m2]. Circles mark varieties of perennial ryegrass (pr), squares- Kentucky bluegrass (Kb), and triangles- tall fescue (tf).

Author Contributions

Conceptualization, K.P., K.R., D.M. and G.Ż.; methodology, K.P. and K.R.; validation, K.P., K.R., D.M. and G.Ż.; formal analysis, K.P.; investigation, K.P.; resources, K.P. and D.M.; data curation, K.P.; writing—original draft preparation, K.P. and K.R.; writing—review and editing, K.R.; visualization, K.P.; supervision, G.Ż.; funding acquisition, D.M. and G.Ż. All authors have read and agreed to the published version of the manuscript.

Funding

This research received no external funding.

Institutional Review Board Statement

Not applicable.

Informed Consent Statement

Not applicable.

Data Availability Statement

Data available upon request.

Conflicts of Interest

The authors declare no conflict of interest.

References

  1. Braverman, S.W. Disease resistance in cool-season forage range and turf grasses II. Bot. Rev. 1986, 52, 1–112. [Google Scholar] [CrossRef]
  2. Ma, X.; Huang, B. Gibberellin-Stimulation of Rhizome Elongation and Differential GA-Responsive Proteomic Changes in Two Grass Species. Front. Plant Sci. 2016, 7, 905. [Google Scholar] [CrossRef] [Green Version]
  3. Dziamski, A.; Stypczyńska, Z.; Żurek, G. Estimation of Root and Shoot Growth of Selected Grass Species on the Basis of Seedling Characterization. Plant Breed. Seed Sci. 2014, 65, 3–14. [Google Scholar] [CrossRef]
  4. Cougnon, M.; Deru, J.; van Eekeren, N.; Baert, J.; Reheul, D. Root depth and biomass of tall fescue vs. perennial ryegrass. In Proceedings of the 17th Symposium of the European Grassland Federation “The Role of Grasslands in a Green Future: Threats and Perspectives in Less Favoured Areas”, Akureyri, Iceland, 23–26 June 2013; Helgadottir, A., Hopkins, A., Eds.; Euroepan Grassland Federation and Agricultural University of Iceland: Borgarnes, Iceland, 2013; pp. 285–288. [Google Scholar]
  5. Watson, C.J.; Carignan-Guillemette, L.; Turcotte, C.; Maire, V.; Proulx, R. Ecological and economic benefits of low-intensity urban lawn management. J. Appl. Ecol. 2020, 57, 436–446. [Google Scholar] [CrossRef]
  6. Kaufmann, J.E. How turfgrass biology affects responses to growth regulators. In Proceedings of the 6th International Turfgrass Research Conference, Tokyo, Japan, 31 July–5 August 1989; Takatoh, H., Ed.; Japanese Society of Turfgrasses Science: Tokyo, Japan, 1989; pp. 83–88. [Google Scholar]
  7. Ignatieva, M.; Haase, D.; Dushkova, D.; Haase, A. Lawns in Cities: From a Globalised Urban Green Space Phenomenon to Sustainable Nature-Based Solutions. Land 2020, 9, 73. [Google Scholar] [CrossRef] [Green Version]
  8. Ignatieva, M.; Hedblom, M. An alternative urban green carpet. Science 2018, 362, 148–149. [Google Scholar] [CrossRef] [Green Version]
  9. Stier, J.C.; Steinke, K.; Ervin, E.H.; Higginson, F.R.; McMaugh, P.E. Turfgrass Benefits and Issues. In Agronomy Monographs. Turfgrass: Biology, Use, and Management; Stier, J.C., Horgan, B.P., Bonos, S.A., Eds.; Wiley: Madison, WI, USA, 2013; Volume 56, pp. 105–145. [Google Scholar] [CrossRef] [Green Version]
  10. Dobson, A.D.M.; Taylor, J.L.; Randolph, S.E. Tick (Ixodes ricinus) abundance and seasonality at recreational sites in the UK: Hazards in relation to fine-scale habitat types revealed by complementary sampling methods. Ticks Tick-Borne Dis. 2011, 2, 67–74. [Google Scholar] [CrossRef] [PubMed]
  11. Nassauer, J.; Wang, Z.; Dayrell, E. What will the neighbors think? Cultural norms and ecological design. Landsc. Urban Plan. 2009, 92, 282–292. [Google Scholar] [CrossRef]
  12. Law, Q.D.; Bigelow, C.A.; Patton, A.J. Selecting turfgrasses and mowing practices that reduce mowing requirements. Crop Sci. 2016, 56, 3318–3327. [Google Scholar] [CrossRef] [Green Version]
  13. Priest, M.W.; Williams, D.J.; Bridgman, H.A. Emissions from in-use lawnmowers in Australia. Atmos. Environ. 2000, 34, 657–664. [Google Scholar] [CrossRef]
  14. Selhorst, A.; Lal, R. Net carbon sequestration potential and emission in home lawn turfgrasses of the United States. Environ. Manag. 2013, 51, 198–208. [Google Scholar] [CrossRef] [PubMed]
  15. Allaire, S.E.; Dufour-L’Arrivee, C.; Lafond, J.A.; Lalancette, R.; Brodeur, J. Carbon dioxide emission by urban turfgrass areas. Can. J. Soil Sci. 2008, 88, 529–532. [Google Scholar] [CrossRef]
  16. Aamlid, T.; Niemelainen, O.; Rannikko, M.; Noteng, O.; Waldner, M.; Haugen, T.; Junnila, S.; Pettersen, T.; Espevig, T. Evaluation of the plant growth regulator Primo MAXX® (trinexapacethyl) on Nordic golf courses. Bioforsk Rep. 2009, 4, 1. Available online: http://www.sterf.org/Media/Get/1550/final-report (accessed on 13 August 2021).
  17. Głąb, T.; Szewczyk, W.; Gondek, K.; Knaga, J.; Tomasik, M.; Kowalik, K. Effect of plant growth regulators on visual quality of turfgrass. Sci. Hortic. 2020, 267, 109314. [Google Scholar] [CrossRef]
  18. Lickfeldt, D.W.; Gardner, D.S.; Branham, B.E.; Voigt, T.B. Implications of Repeated Trinexapac-Ethyl Applications on Kentucky Bluegrass. Agron. J. 2001, 93, 1164–1168. [Google Scholar] [CrossRef]
  19. Rademacher, W. Growth retardants: Effect of gibberellin biosynthesis and other metabolic pathways. Ann. Rev. Plant Physiol. Plant Mol. Biol. 2000, 51, 501–531. [Google Scholar] [CrossRef] [Green Version]
  20. Serensits, T.J.; McNitt, A.S.; Petrunak, D.M. Improving surface stability on natural turfgrass athletic fields. Proc. Inst. Mech. Eng. Part P J. Sports Eng. Technol. 2011, 225, 85–92. [Google Scholar] [CrossRef]
  21. Ervin, E.; Zhang, X. Applied Physiology of Natural and Synthetic Plant Growth Regulators on Turfgrasses. In Turfgrass Management and Physiology; Pessarakli, M., Ed.; CRC Press: Boca Raton, FL, USA, 2008; pp. 171–202. ISBN 978-170-8493-7069-8494. [Google Scholar]
  22. Mohammadi, M.H.S.; Etemadi, N.; Arab, M.M.; Aalifar, M.; Arab, M.; Pessarakli, M. Molecular and physiological responses of Iranian Perennial ryegrass as affected by Trinexapac ethyl, Paclobutrazol and Abscisic acid under drought stress. Plant Physiol. Biochem. 2017, 111, 129–143. [Google Scholar] [CrossRef] [PubMed]
  23. Stier, J.C.; Rogers, J.N. Trinexapac-Ethyl and Iron Effects on Supina and Kentucky Bluegrasses Under Low Irradiance. Crop Sci. 2001, 41, 457–465. [Google Scholar] [CrossRef]
  24. Qian, Y.L.; Engelke, M.C.; Foster, M.J.V.; Reynolds, S. Trinexapac-ethyl Restricts Shoot Growth and Improves Quality of ‘Diamond’ Zoysiagrass Under Shade. HortSci. 1998, 33, 1019. [Google Scholar] [CrossRef] [Green Version]
  25. Brede, D. (Ed.) Turfgrass Maintenance Reduction Handbook: Sports, Lawns, and Golf; Ann Arbor Press: Chelsea, MI, USA, 2000; p. 374. ISBN 71-57504-106-5. [Google Scholar]
  26. British Society of Plant Breeders Ltd. Turfgras Seed. 2021. Available online: http://www.plantbreedingmatters.com/sg_userfiles/BSPB_Turfgrass_2020_LRes.pdf (accessed on 13 August 2021).
  27. Prokopiuk, K.; Żurek, G.; Rybka, K. Turf covering for sport season elongation cause no stress for grass species as detected by Chl a fluorescence. Urban For. Urban Green. 2019, 41, 14–22. [Google Scholar] [CrossRef]
  28. Strasser, R.J.; Srivastava, A.; Govindjee, G. Polyphasic chlorophyll a fluorescence transient in plants and cyanobacteria. Photochem. Photobiol. 1995, 61, 32–42. [Google Scholar] [CrossRef]
  29. Goltsev, V.N.; Kalaji, H.M.; Paunov, M.; Bąba, W.; Horaczek, T.; Mojski, J.; Kociel, H.; Allakhverdiev, S.I. Variable chlorophyll fluorescence and its use for assessing physiological condition of plant photosynthetic apparatus. Russ. J. Plant Physiol. 2016, 63, 869–893. [Google Scholar] [CrossRef]
  30. Oukarroum, A.; Madidi, S.E.; Schansker, G.; Strasser, R.J. Probing the responses of barley cultivars (Hordeum vulgare L.) by chlorophyll a fluorescence OLKJIP under drought stress and re-watering. Environ. Exp. Bot. 2007, 60, 438–446. [Google Scholar] [CrossRef]
  31. Stirbet, A.; Riznichenko, G.Y.; Rubin, A.B. Govindjee Modeling chlorophyll a fluorescence transient: Relation to photosynthesis. Biochem. Mosc. 2014, 79, 291–323. [Google Scholar] [CrossRef] [PubMed]
  32. Żurek, G.; Rybka, K.; Pogrzeba, M.; Krzyżak, J.; Prokopiuk, K. Chlorophyll a Fluorescence in Evaluation of the Effect of Heavy Metal Soil Contamination on Perennial Grasses. PLoS ONE 2014, 9, e91475. [Google Scholar] [CrossRef]
  33. Heckman, N.L.; Caussoin, R.E.; Horst, G.L.; Elowsky, C.G. Growth regulator effects on cellular characteristics of two turfgrass species. Int. Turfgrass Soc. Res. J. 2005, 10, 857–861. Available online: https://www.academia.edu/26897007/Growth_regulator_effects_on_cellular_characteristics_of_two_turfgrass_species (accessed on 13 August 2021).
  34. Ervin, E.; Koski, A.J. Trinexapac-ethyl Increases Kentucky Bluegrass Leaf Cell Density and Chlorophyll Concentration. HortSci. 2001, 36, 787–789. [Google Scholar] [CrossRef] [Green Version]
  35. Meghyn, M.; Ambika, C.; Wherley, B.G. Growth Responses of Hybrid Bluegrass and Tall Fescue as Influenced by Light Intensity and Trinexapac-ethyl. HortSci. 2015, 50, 1241–1247. [Google Scholar] [CrossRef] [Green Version]
  36. Ervin, E.; Koski, A. Kentucky Bluegrass Growth Responses to Trinexapac-Ethyl, Traffic, and Nitrogen. Crop Sci. 2001, 41, 1871–1877. [Google Scholar] [CrossRef]
  37. Fan, J.; Zhang, W.; Amombo, E.; Hu, L.; Kjorven, J.O.; Chen, L. Mechanisms of Environmental Stress Tolerance in Turfgrass. Agronomy 2020, 10, 522. Available online: https://www.mdpi.com/2073-4395/2010/2074/2522 (accessed on 13 August 2021). [CrossRef] [Green Version]
  38. Foyer, C.H. Reactive oxygen species, oxidative signaling and the regulation of photosynthesis. Environ. Exp. Bot. 2018, 154, 134–142. [Google Scholar] [CrossRef] [PubMed]
  39. Macolino, S.; Pignata, G.; Giolo, M.; Richardson, M. Species Succession and Turf Quality of Tall Fescue and Kentucky Bluegrass Mixtures as Affected By Mowing Height. Crop Sci. 2014, 54, 1220–1226. [Google Scholar] [CrossRef]
  40. Prończuk, M.; Zagdańska, B. Effect of Microdochium nivale and Low Temperature on Winter Survival of Perennial Ryegrass. J. Phytopathol. 1993, 138, 1–8. [Google Scholar] [CrossRef]
  41. Hofgaard, I.S.; Wanner, L.A.; Tronsmo, A.M. The effect of age and cold hardening on resistance to pink snow mould (Microdochium nivale) in perennial ryegrass (Lolium perenne L). Acta Agric. Scand. B Soil Plant Sci. 2006, 56, 315–323. [Google Scholar] [CrossRef]
  42. Leinauer, B. Turf solutions for the future, the 7th European turfgrass society research conference: Agronomy Journal special issue. Agron. J. 2020, 112, 3361–3362. [Google Scholar] [CrossRef]
  43. Springer, R.; Eudoxie, G.; Gouveia, G. Comparative Evaluation of Common Savannahgrass on a Range of Soils Subjected to Different Stresses I: Productivity and Quality. Agronomy 2014, 4, 202–216. [Google Scholar] [CrossRef] [Green Version]
Figure 1. Ideogram of changes in lawn growth intensity during the year in the temperate climate zone (52°12′58.536″ N, 20°38′43.008″ E) expressed as changes in grass height. Winter dormancy usually lasts from half of November until half of March.
Agronomy 12 01776 g001
Figure 2. Radar plots for comparison of visual merit, turf density, and turf color. The statistical importance of differences is shown in Table S1. In addition, color code is used in inscriptions categorizing species: varieties names in green letters– varieties of perennial ryegrass: Goalkeeper, Jackento, Top Gun; varieties names in red letters– varieties of Kentucky bluegrass: Award, BlueChip, Liberator; varieties names in blue letters– varieties of tall fescue: Arid 3, Pixi and Stowell.
Agronomy 12 01776 g002
Figure 3. The effect of TE doses on grass regrowth in spring and autumn, after 1 and 5 weeks post-TE-application: (A) height [cm]; (B) Dried clippings biomass [g/100 m2]. Letters designate homogeneous groups within the term, based on the post-hoc Duncan test, with probability ≥95%. ANOVA analysis is presented in Supplementary Materials Table S2.
Agronomy 12 01776 g003
Figure 4. The influence of different TE doses, 1 and 5 weeks post-treatment, on chlorophyll a fluorescence was analyzed as ΔWOJ curves. See methods for details of ΔWOJ. The columns present turf photos of perennial ryegrass, Kentucky bluegrass, and tall fescue. Color code: green—perennial ryegrass; red—Kentucky bluegrass; blue—tall fescue.
Agronomy 12 01776 g004
Figure 5. The distribution of tested varieties in the PCA plot is based on the data set: visual merit, turf density, turf color, chlorophyll index, and Chl a fluorescence parameters. In addition, color code is used for species: green—varieties of perennial ryegrass: Goalkeeper, Jackento, Top Gun; red—varieties of Kentucky bluegrass: Award, BlueChip, Liberator; blue—varieties of tall fescue: Arid 3, Pixi and Stowell.
Agronomy 12 01776 g005
Table 1. Recommended doses [ml and g of active ingredient/100 m2] of trinexapac-ethyl (TE) for application on turfgrass species: perennial ryegrass, Kentucky bluegrass, and tall fescue in different years, as specified on Primo maxx® (Syngenta) product label information. The trinexapac-ethyl concentration is 12 [%].
Recommended TE Doses Per 100 m2 * (2018)
Perennial ryegrass (1)16–30 (1.8–3.4)
Kentucky bluegrass (2)20 (2.3)
Tall fescue (3)24 (2.7)
Mix (1) × (2)24 (2.7)
Mix (1) × (2) × (3)24 (2.7)
* 12% TE doses are given in ml/100 m2 and in (g of active ingredient/100 m2).
Table 2. Description of scale grades used for visual evaluation of lawn quality.
Scale GradesVisual MeritTurf DensityTurf Color
1no plantsno plantsno plants
2poorly lookingvery weakdried
3weak≤20%yellow-brown turf
4poor≤45%bleaching turf
5sufficient≤60%gray-brown
6average>60%green-blue
7goodquite dense (ca. 80%)light-green
8very goodnearly 100% densegreen turf
9idealfully dense turfdark green
Table 3. Mean month air temperatures and a sum of month precipitations during the experiment compared with typical values calculated as multiannual averages based on archival data (1995–2015).
JanuaryFebruaryMarchAprilMayJuneJulyAugustSeptemberOctoberNovemberDecember
YearsTemperature [°C]
1995–2015−1.8−1.02.88.114.216.918.518.213.38.32.8−0.1
20180.9−3.10.813.517.919.221.120.916.110.24.42.1
2019−1.63.05.911.713.922.819.120.814.611.06.43.3
Precipitation [mm]
1995–201521.317.522.330.346.063.074.351.843.531.530.328.4
201826.08.816.426.073.225.280.034.434.028.028.863.8
201939.634.236.83.09.240.853.237.474.413.615.834.8
Table 4. Results of TE on Chlorophyll Index measured one and five weeks after TE treatments. Homogeneous groups were identified using Duncan's multiple comparisons.
FactorPerennial RyegrassKentucky BluegrassTall Fescue
GoalkeeperJackentoTop GunAwardBlueChipLiberatorArid 3PixiStowell
Spring (1 week)
Control289A281A287A276A264A253A236A283A266A
TE [1.5 g/100 m2]276A267A276A235B238B234A216B212B229B
TE [4.5 g/100 m2]249A214B200B177C171C173B221B195C193C
Spring (5 weeks)
Control359B348B373B386A406A401A400B393A388B
TE [1.5 g/100 m2]383B374B336B426A435A400A458A335B432A
TE [4.5 g/100 m2]478A462A440A326B365B345B320C338B375B
Autumn (1 week)
Control387A386A373A452C380A393A320B380A390A
TE [1.5 g/100 m2]305B312B335B367B310B344B291C286C333B
TE [4.5 g/100 m2]300B285B291C271A285B305B351A312B297C
Autumn (5 weeks)
Control122C139C134C170C198B221B234B222C241C
TE [1.5 g/100 m2]294B279B283B440A414A438A438A476A483A
TE [4.5 g/100 m2]347A327A325A218B193B286B252B343B314B
Publisher’s Note: MDPI stays neutral with regard to jurisdictional claims in published maps and institutional affiliations.

