Article

Tillage and Urea Fertilizer Application Impacts on Soil C Fractions and Sequestration

by
Bonginkosi S. Vilakazi
1,2,*,
Rebecca Zengeni
3 and
Paramu Mafongoya
3
1
Department of Crop Sciences, Faculty of Natural and Agricultural Sciences, North-West University, Private Bag X2046, Mmabatho 2790, South Africa
2
Food Security and Safety Niche Area, Faculty of Natural and Agricultural Sciences, North-West University, Private Bag X2046, Mmabatho 2790, South Africa
3
School of Agricultural, Earth and Environmental Sciences, University of KwaZulu-Natal (UKZN), Private Bag X01, Scottsville 3209, South Africa
*
Author to whom correspondence should be addressed.
Agronomy 2022, 12(7), 1725; https://doi.org/10.3390/agronomy12071725
Submission received: 4 May 2022 / Revised: 5 July 2022 / Accepted: 7 July 2022 / Published: 21 July 2022

Abstract

:
Conservation tillage has been considered a smart agriculture practice which preserves soil organic carbon (SOC). However, little work on the labile C fractions in South Africa has been documented. As such, this work focused on C fractions under different management systems. The objective of this study was to assess the impact of different tillage techniques and fertilizer application rates on soil C fractions along the soil profile. Samples from no-till (NT), conventional tillage after 5th season (CT-Y5), and annual conventional tillage, longer than 5 years (CT-ANNUAL) at 0, 60, 120, and 240 kg N ha−1 were taken at 0–10, 10–20, and 20–30 cm depths and analyzed for C fractions. The 30 cm depth was chosen as the sampling depth because of the 30 cm plough layer. At 0–10 cm, soil NT had higher total C, organic C, particulate organic C (POC), and permanganate oxidizable C (POxC) for all application rates, especially in the control treatment, compared to both the CT-Y5 and CT-ANNUAL treatments (p < 0.05). At the 10–20 cm soil depth, CT-Y5 had higher POC than both NT and CT-ANNUAL at 60 kg N ha−1 (p < 0.05). Greater C fractions in the surface soil under NT, and at deeper depths under CT, was due to litter availability on the surface under NT and incorporation to the subsoil on CT. Higher C sequestration in NT than in CT-Y5 and CT-ANNUAL was observed because of slower organic matter (OM) turnover in NT leading to the formation and stabilization of C. A larger input over output of OM, through high crop residue accumulation over decomposition, is the reason for the increase of C fractions in the fertilized treatments. Therefore, using conservation agriculture, particular NT, with 0 kg N ha−1 application rate in dryland agriculture is recommended.

1. Introduction

Soil can function as a source or sink of atmospheric carbon (C) and may have an important role in decreasing the build-up of atmospheric greenhouse gases (GHGs), thereby aiding in mitigating global climate change [1]. Farming practices such as conservation tillage, which allow soil to be a sink of C must be intensified on agricultural land. Intensive ploughing has caused enormous losses of soil organic C (SOC) to the atmosphere [2]. Estimates indicate SOC loss to be as high as 60% in temperate and 75% in tropical regions that has been depleted by conventional tillage (CT), contributing about 23% of the total GHGs concentration in the atmosphere [3]. Tillage is generally considered to increase SOC mineralization due to the mechanical and rain-induced disruption of soil aggregates and the consequent release of carbon dioxide (CO2) [4]. No-till (NT) practices result in the net accumulation of C in the surface layers of 333.8 cm depth, with a net loss in the deeper layers of 60–90 cm [5]. Therefore, shallow sampling under NT may imply an overestimation of SOC gains in those treatments, given that losses occurring at deeper soil layers are not accounted for.
The amount of SOC that is stored in the deeper layers of 60 cm is the most important fraction for long-term soil C sequestration [2]. Ref. [4] postulated that under NT, there may be additional SOC storage in superficial soil layers, but little to no SOC sequestration for the land unit if the whole soil profile of 100 cm depth is considered. This seems to be particularly the case in humid and temperate regions [6], as opposed to drier semi-arid climates, where significant benefits of NT relative to CT are observed. Ref. [7] observed that under temperate and tropical climatic conditions the decomposition of C residues was the same whether the residues were incorporated or not, whereas under semi-arid conditions decomposition was greater when the residues were incorporated than left on the surface. Ref. [6] also showed that the response of SOC to NT is dependent on climate, in particular precipitation, with a greater response in drier conditions. This is because dry years allow C sequestration in NT system due to a greater reduction in SOC mineralization compared to CT [6].
Therefore, in dryland agriculture, especially in semi-arid regions such as KwaZulu Natal, South Africa where this current study was conducted, conservational tillage can be practiced as a low cost and smart agriculture which will assist in soil C sequestration. High fertilizer requirements can be attenuated in conservation agriculture due to the enhancement of C sequestration. C sequestration can be defined as an increase in C storage in soil or plant material [8], whereas the C sequestration potential of a given soil would be the maximum gain in SOC allowing a net removal of CO2 from the atmosphere under a given climate and for a specified timeline [4]. Some argue that only very recalcitrant C should be regarded as sequestered C; however, soil C varies in degree of permanence. Furthermore, different C fractions such as particulate organic C (POC), microbial biomass C (MBC), soil organic C (SOC), and permanganate oxidizable C (POxC) are more stable in various soil characteristics showing different residence time in the soil.
The labile SOC fractions, which are SOC, POC, MBC, and POxC, are relatively small fractions of the total C that have a short half-life and responds quickly to changes in soil tillage and fertilization practices [9]. It is an important component of soil quality because of its soil aggregate stabilization effect and direct link to soil C or N mineralization [10]. An ability to predict or detect SOC changes at the early stages of land-use or management is important to allow land managers to make informed decisions that reduce soil fertility decline, erosion, and GHG emissions [11]. Little work has been documented on the labile C fractions of South Africa and KwaZulu Natal province to be specific, hence this work focused on C fractions under different management systems in a dryland maize monocrop at Loskop, KwaZulu Natal. The alternative hypothesis was that an increase in fertilizer application rate and intensification of tillage will increase the labile C pools with an increase in depth. The objectives of the study were to:
Assess the impact of different tillage techniques and fertilizer application on soil C fractions.
To assess the impact of soil depth on C pools under different tillage systems.

2. Material and Methods

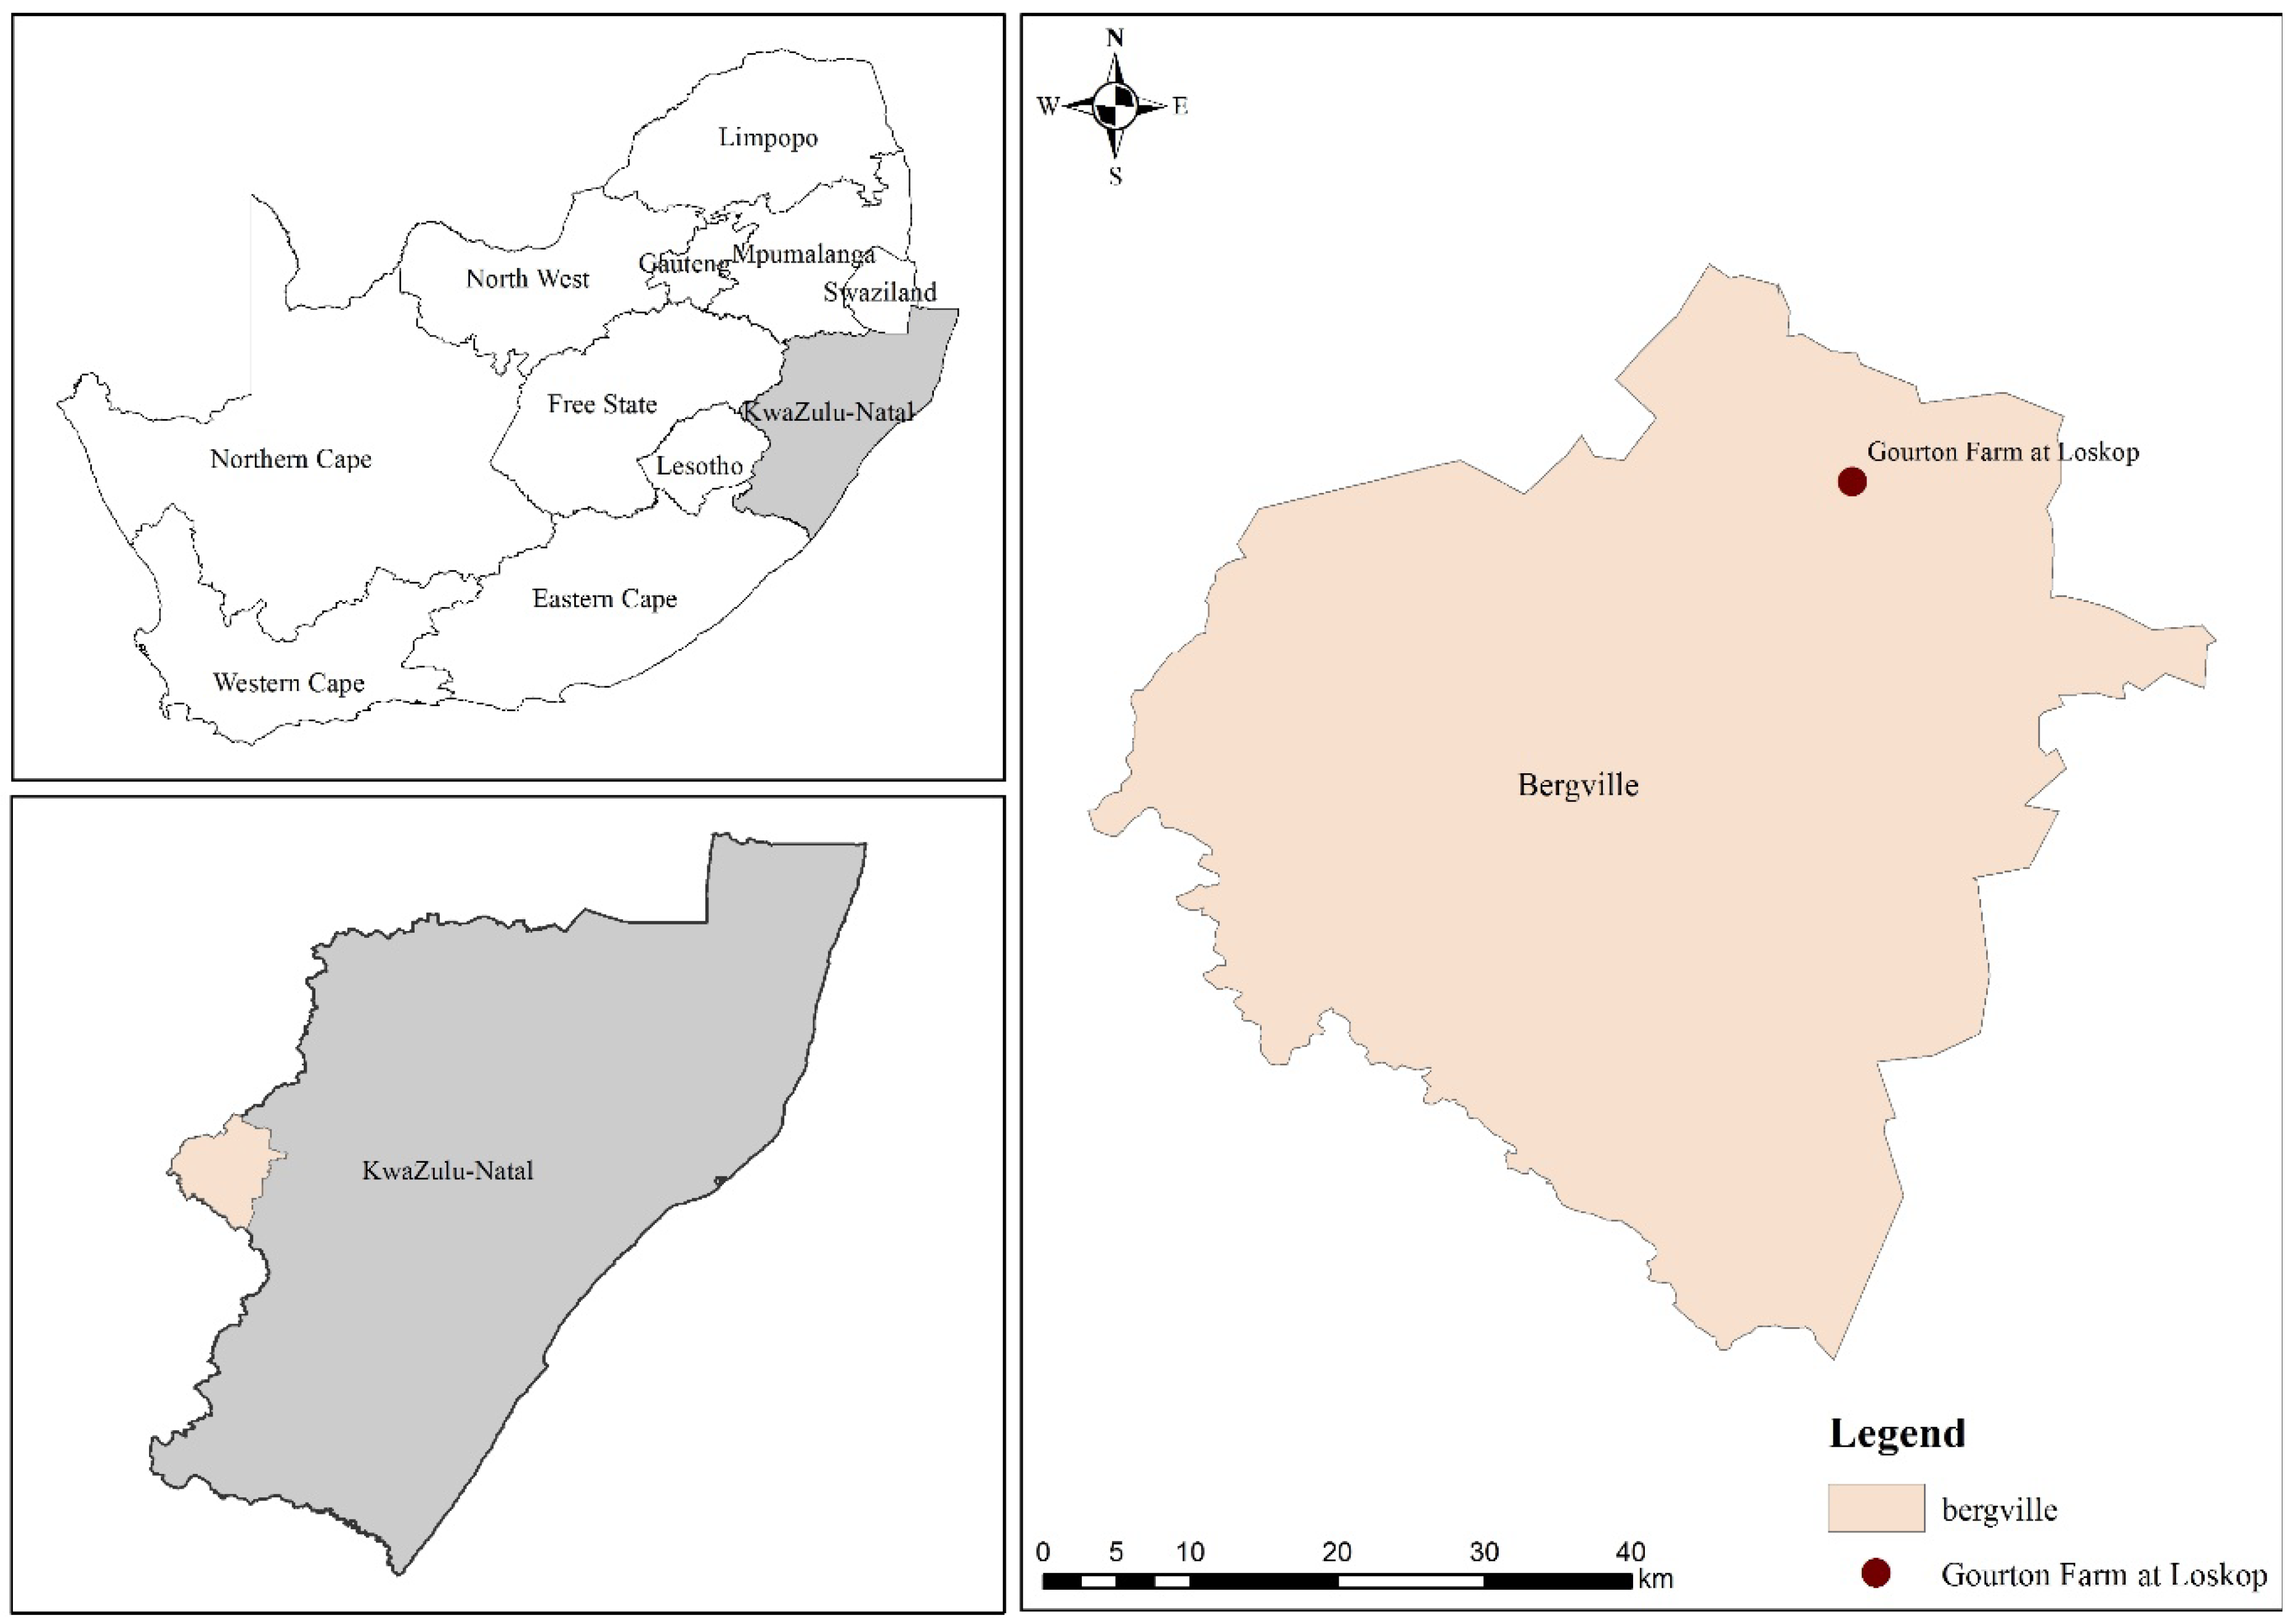
2.1. Study Site and Sampling Procedure

The study was done in Loskop, KwaZulu Natal Province, South Africa, located at latitude 28°55′26.83″ S and longitude 29°33′38.64″ E, depicted in Figure 1. The trial started in the 2003/2004 season. The site had been previously utilized for dry-land maize and soybean in rotations and was NT since 1990. Dry-land agriculture, maize in summer and fallow in winter, was practiced and managed under NT, annual conventional till (CT-ANNUAL), and conventional tillage every 5th season (CT-Y5) since 2003/2004 season. The soil was classified as Lixisols [12] characterized by high erodibility with high leaching of base cations. The predominant parent material was dolerite which under chemical weathering weathers to clay loam textural class. There was no effervescence when HCI was used indicating an absence of carbonates in the soil. The area receives approximately 643 mm of rainfall per year which occurs mostly during summer (November-January), and has mean average midday temperature ranging between 19.3 °C in June and 28 °C in January [13].
The field trial was arranged as a randomized split plot design, with tillage forming the main plot (1 m × 4 m) and fertilizer application rate being the sub-plot (1 m × 1 m). In each tillage urea fertilizer was applied at four application rates of 0, 60, 120, and 240 kg N ha−1. NT was characterized by no soil disturbance (no ploughing), while a sod seeder was utilized for planting. CT-Y5 comprised of leaving the soil unploughed for four seasons, then tilling every 5th season. Soil sampling in CT-Y5 was done in the 5th season (five years after the last tillage). In CT-ANNUAL there was annual disturbance of soil by tilling using a tractor to a depth of 30 cm. Soil was sampled after harvest to avoid plant disturbance at three depths of 0–10, 10–20, and 20–30 cm. Each tillage treatment had three blocks that were sampled making nine blocks in total, with each block having four N fertilizer application rates which were all replicated three times.

2.2. Laboratory Analyses

The total C was analyzed using LECO TruMac CNS/NS, St. Joe, MI, USA [14]. Air-dried soil samples were passed through a 0.53 mm sieve size, then a 0.2 g sample was put into the LECO for analysis of C. The procedure is based on the dry combustion of air-dried samples in crucibles, subjected to a 1450 °C furnace temperature for 6 min. The SOC was determined using the WalkeyBlack method [15]. Further, SOC and bulk density were used to calculate the soil C stock per depth. Wet sieving by [16] was used to determine the particulate organic C (POC). The permanganate oxidizable C (POxC) was analyzed by dispersing 2.5 g soil with 2 mL of 0.2 M KMnO4 and 18 mL of distilled water [17]. After settling, about 0.5 mL of supernatant was extracted and mixed with 49.5 mL deionized water in a 50 mL centrifuge tube. A spectrophotometer was utilized to read the absorbance at 550 nm. The fumigation-incubation method by [18] was used to estimate the microbial biomass C (MBC). Thereafter the microbial quotient (qMic) in the soil was calculated as ratios of MBC to SOC [19].

2.3. Statistical Analyses

An analysis of variance (two-way ANOVA) test was done to determine the effect of tillage and urea fertilizer application on soil C pools at various soil depths. The Fisher’s protected LSD test was used as a post hoc test for multiple comparison to compare the treatment means and their interactions. The p value (<0.05) was used to test for significant differences between the treatment factors. All the tests were performed with GenStat 14.1 for Windows software [20].

3. Results

3.1. Soil Total C

Figure 2 shows that at 0–10 cm soil depth, the NT had higher total C for all the application rates compared to CT-Y5 and CT-ANNUAL treatments. At 10–20 cm depth, the control of NT and CT-ANNUAL had higher total C compared with CT-Y5. NT at 60 kg N ha−1 in 10–20 cm soil depth had higher total C (15.3 g C kg−1) than CT-ANNUAL (13.8 g C kg−1). While at 120 and 240 kg N ha−1, the CT-ANNUAL had higher total C than NT and CT-Y5 (Figure 2). In the 20–30 cm soil depth, NT had higher total C at 60 and 120 kg N ha−1 compared to CT-ANNUAL. Furthermore at 120 kg N ha−1, CT-Y5 had higher total C than CT-ANNUAL.

3.2. Organic C Variation in Different Treatments

Figure 3 shows that at 0–10 cm soil depth, NT had higher organic C than both CT-Y5 and CT-ANNUAL in all fertilizer application rates. Both NT and CT-ANNUAL at 240 kg N ha−1 in 20–30 cm soil depth, had higher organic C levels compared with CT-Y5 while at 120 kg N ha−1, CT-ANNUAL had the lowest organic C.

3.3. POC Variations in Different Treatments

NT had the highest POC for all the application rates at 0–10 cm soil depth (Figure 4). While at 120 and 240 kg N ha−1, CT-Y5 had higher POC than CT-ANNUAL in the 0–10 cm soil depth. At 10–20 cm soil depth, CT-ANNUAL had the lowest POC at 60 kg N ha−1. On the contrary, at 120 and 240 kg N ha−1, CT-ANNUAL had the highest POC at this depth. Figure 4 shows that in 20–30 cm soil depth, NT had the lowest POC at 60 kg N ha−1.

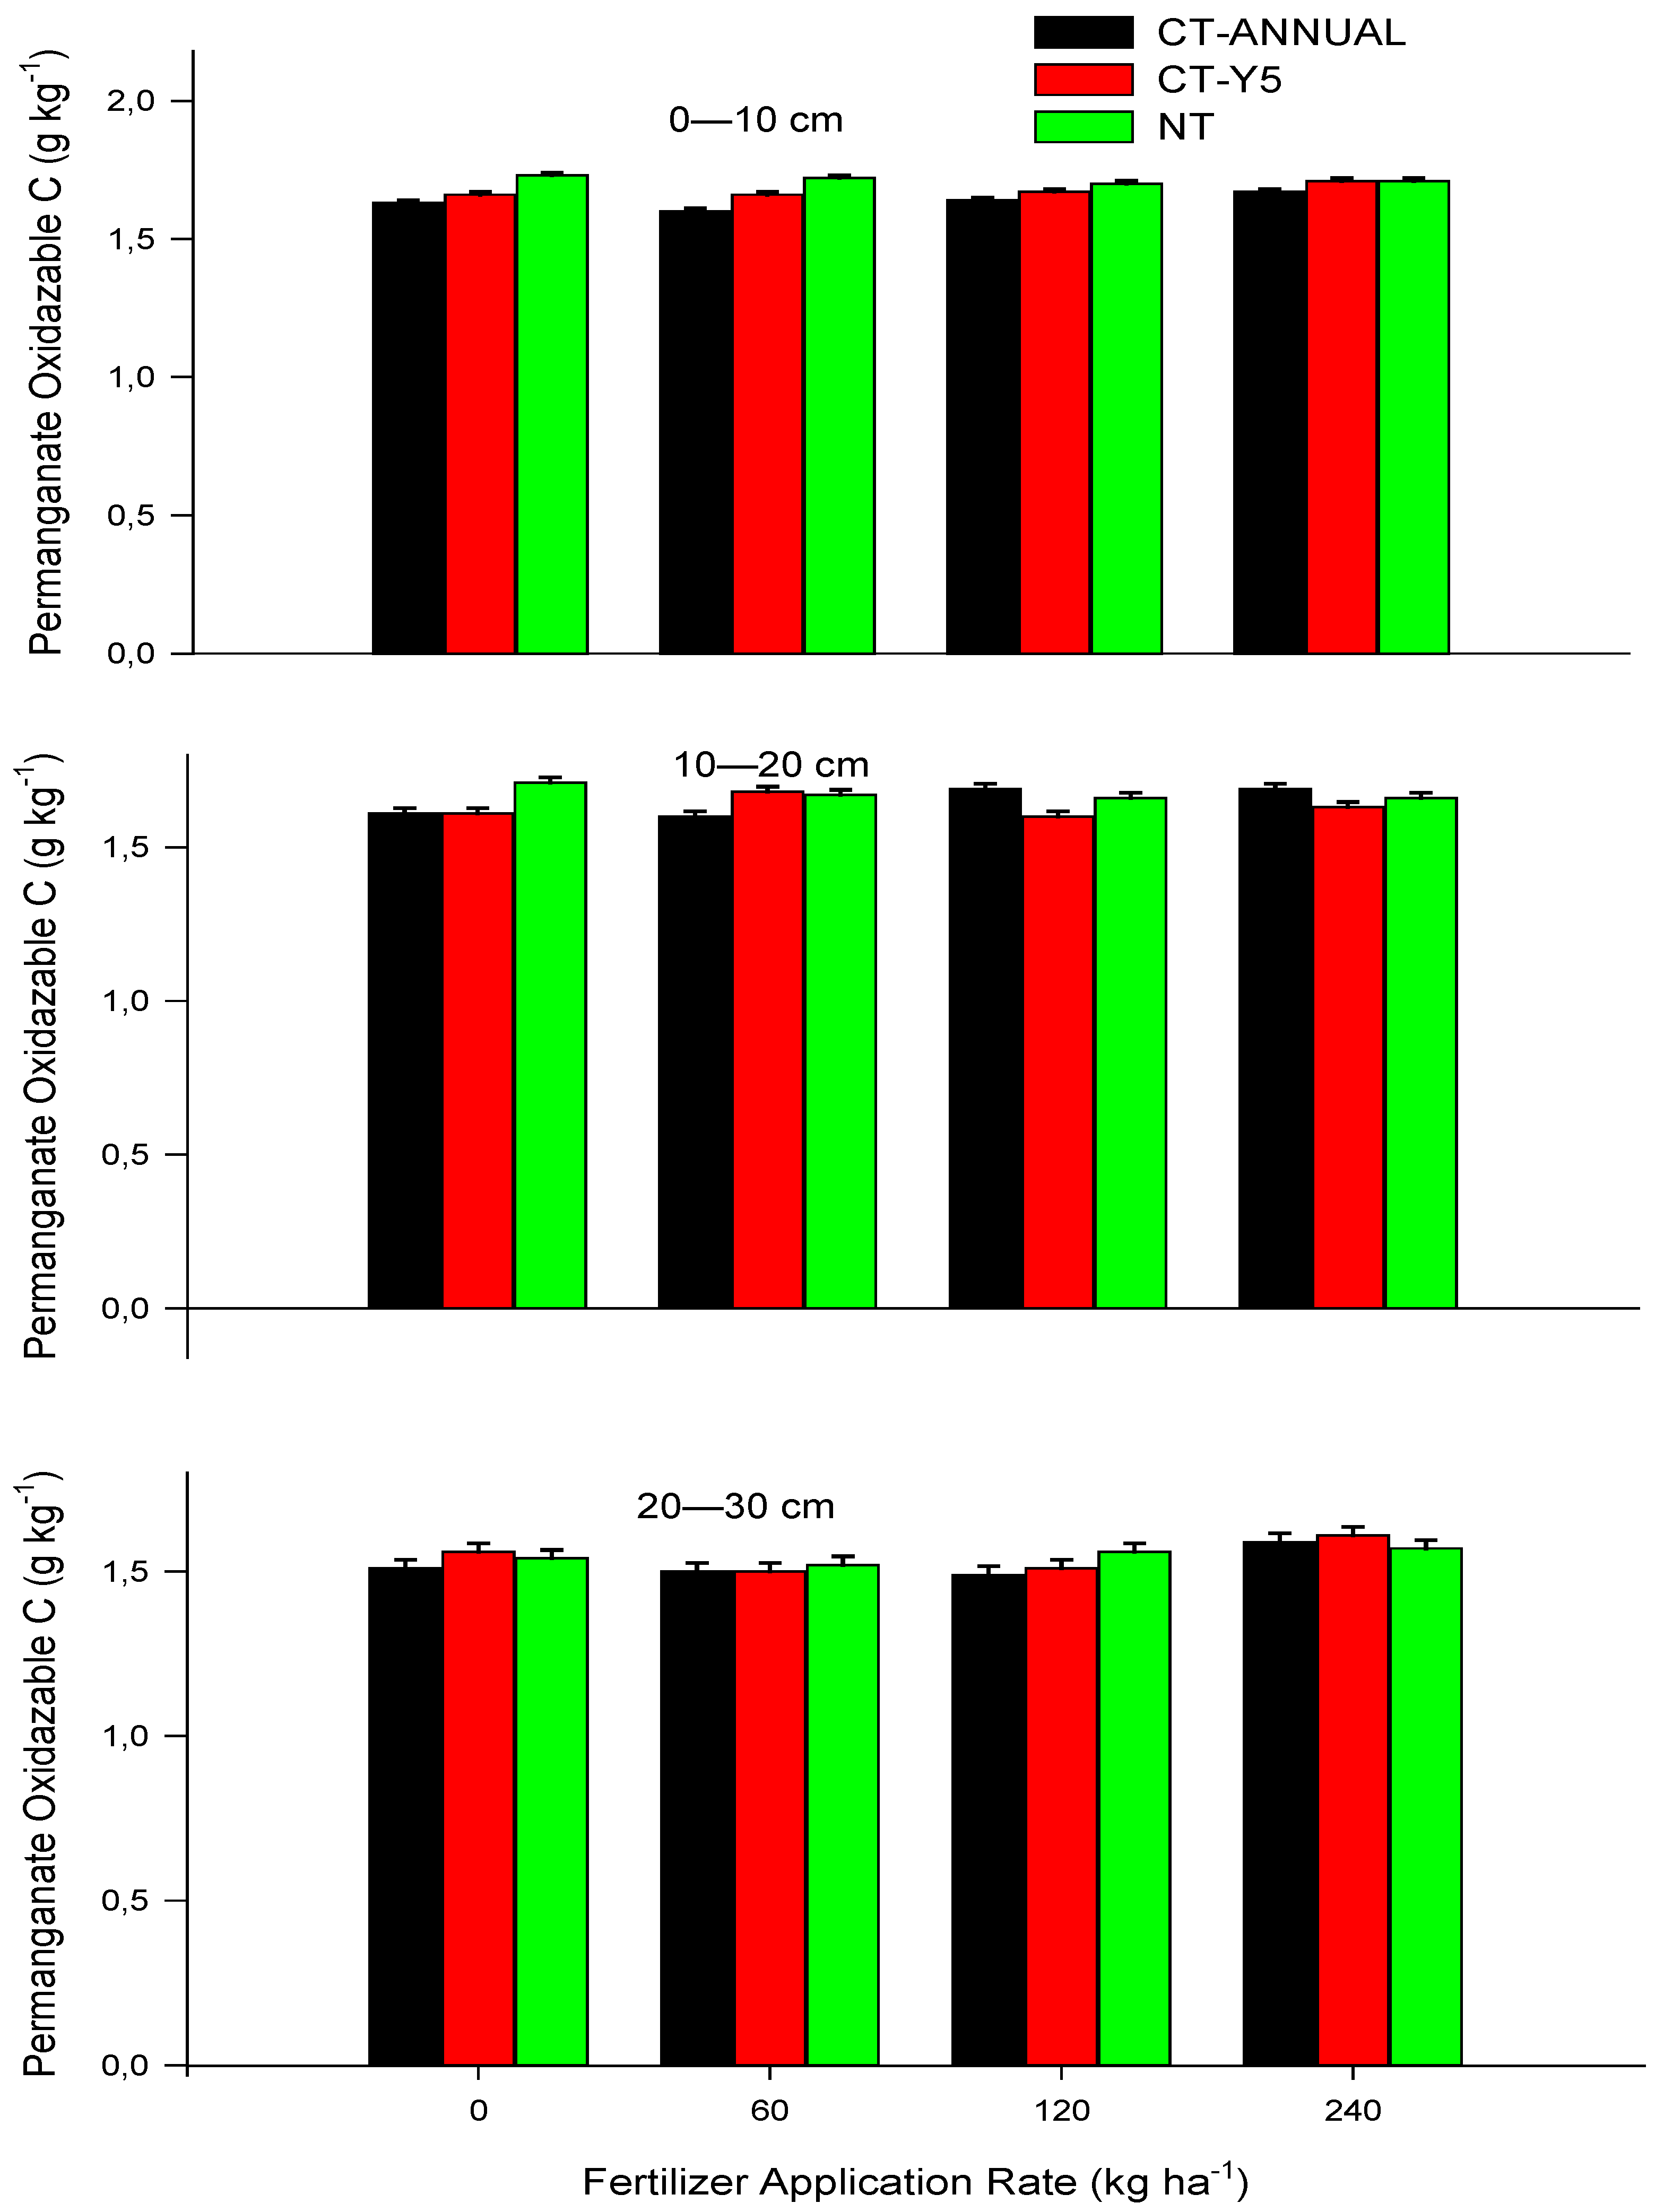
3.4. POxC on Different Tillage and N Rates

Figure 5 shows that in the 0–10 cm soil depth, NT had higher POxC than CT-ANNUAL at 0, 60 and 120 kg N ha−1. At 60 and 240 kg N ha−1 application rates in 0–10 cm soil depth CT-Y5 had higher POxC than CT-ANNUAL but again it had lower POxC than NT. At 10–20 cm soil depth, NT had the highest POxC in the control, while at 60 kg N ha−1, CT-Y5 (which was not different from NT) had higher POxC than CT-ANNUAL. Figure 5 shows that both 120 and 240 kg N ha−1 application rates of CT-ANNUAL had higher POxC than CT-Y5 at 10–20 cm soil depth. However, at 20–30 cm soil depth, CT-Y5 had higher POxC than CT-ANNUAL in the control (Figure 5). Whereas at 120 kg N ha−1 NT had higher POxC than CT-ANNUAL in the 20–30 cm soil depth.

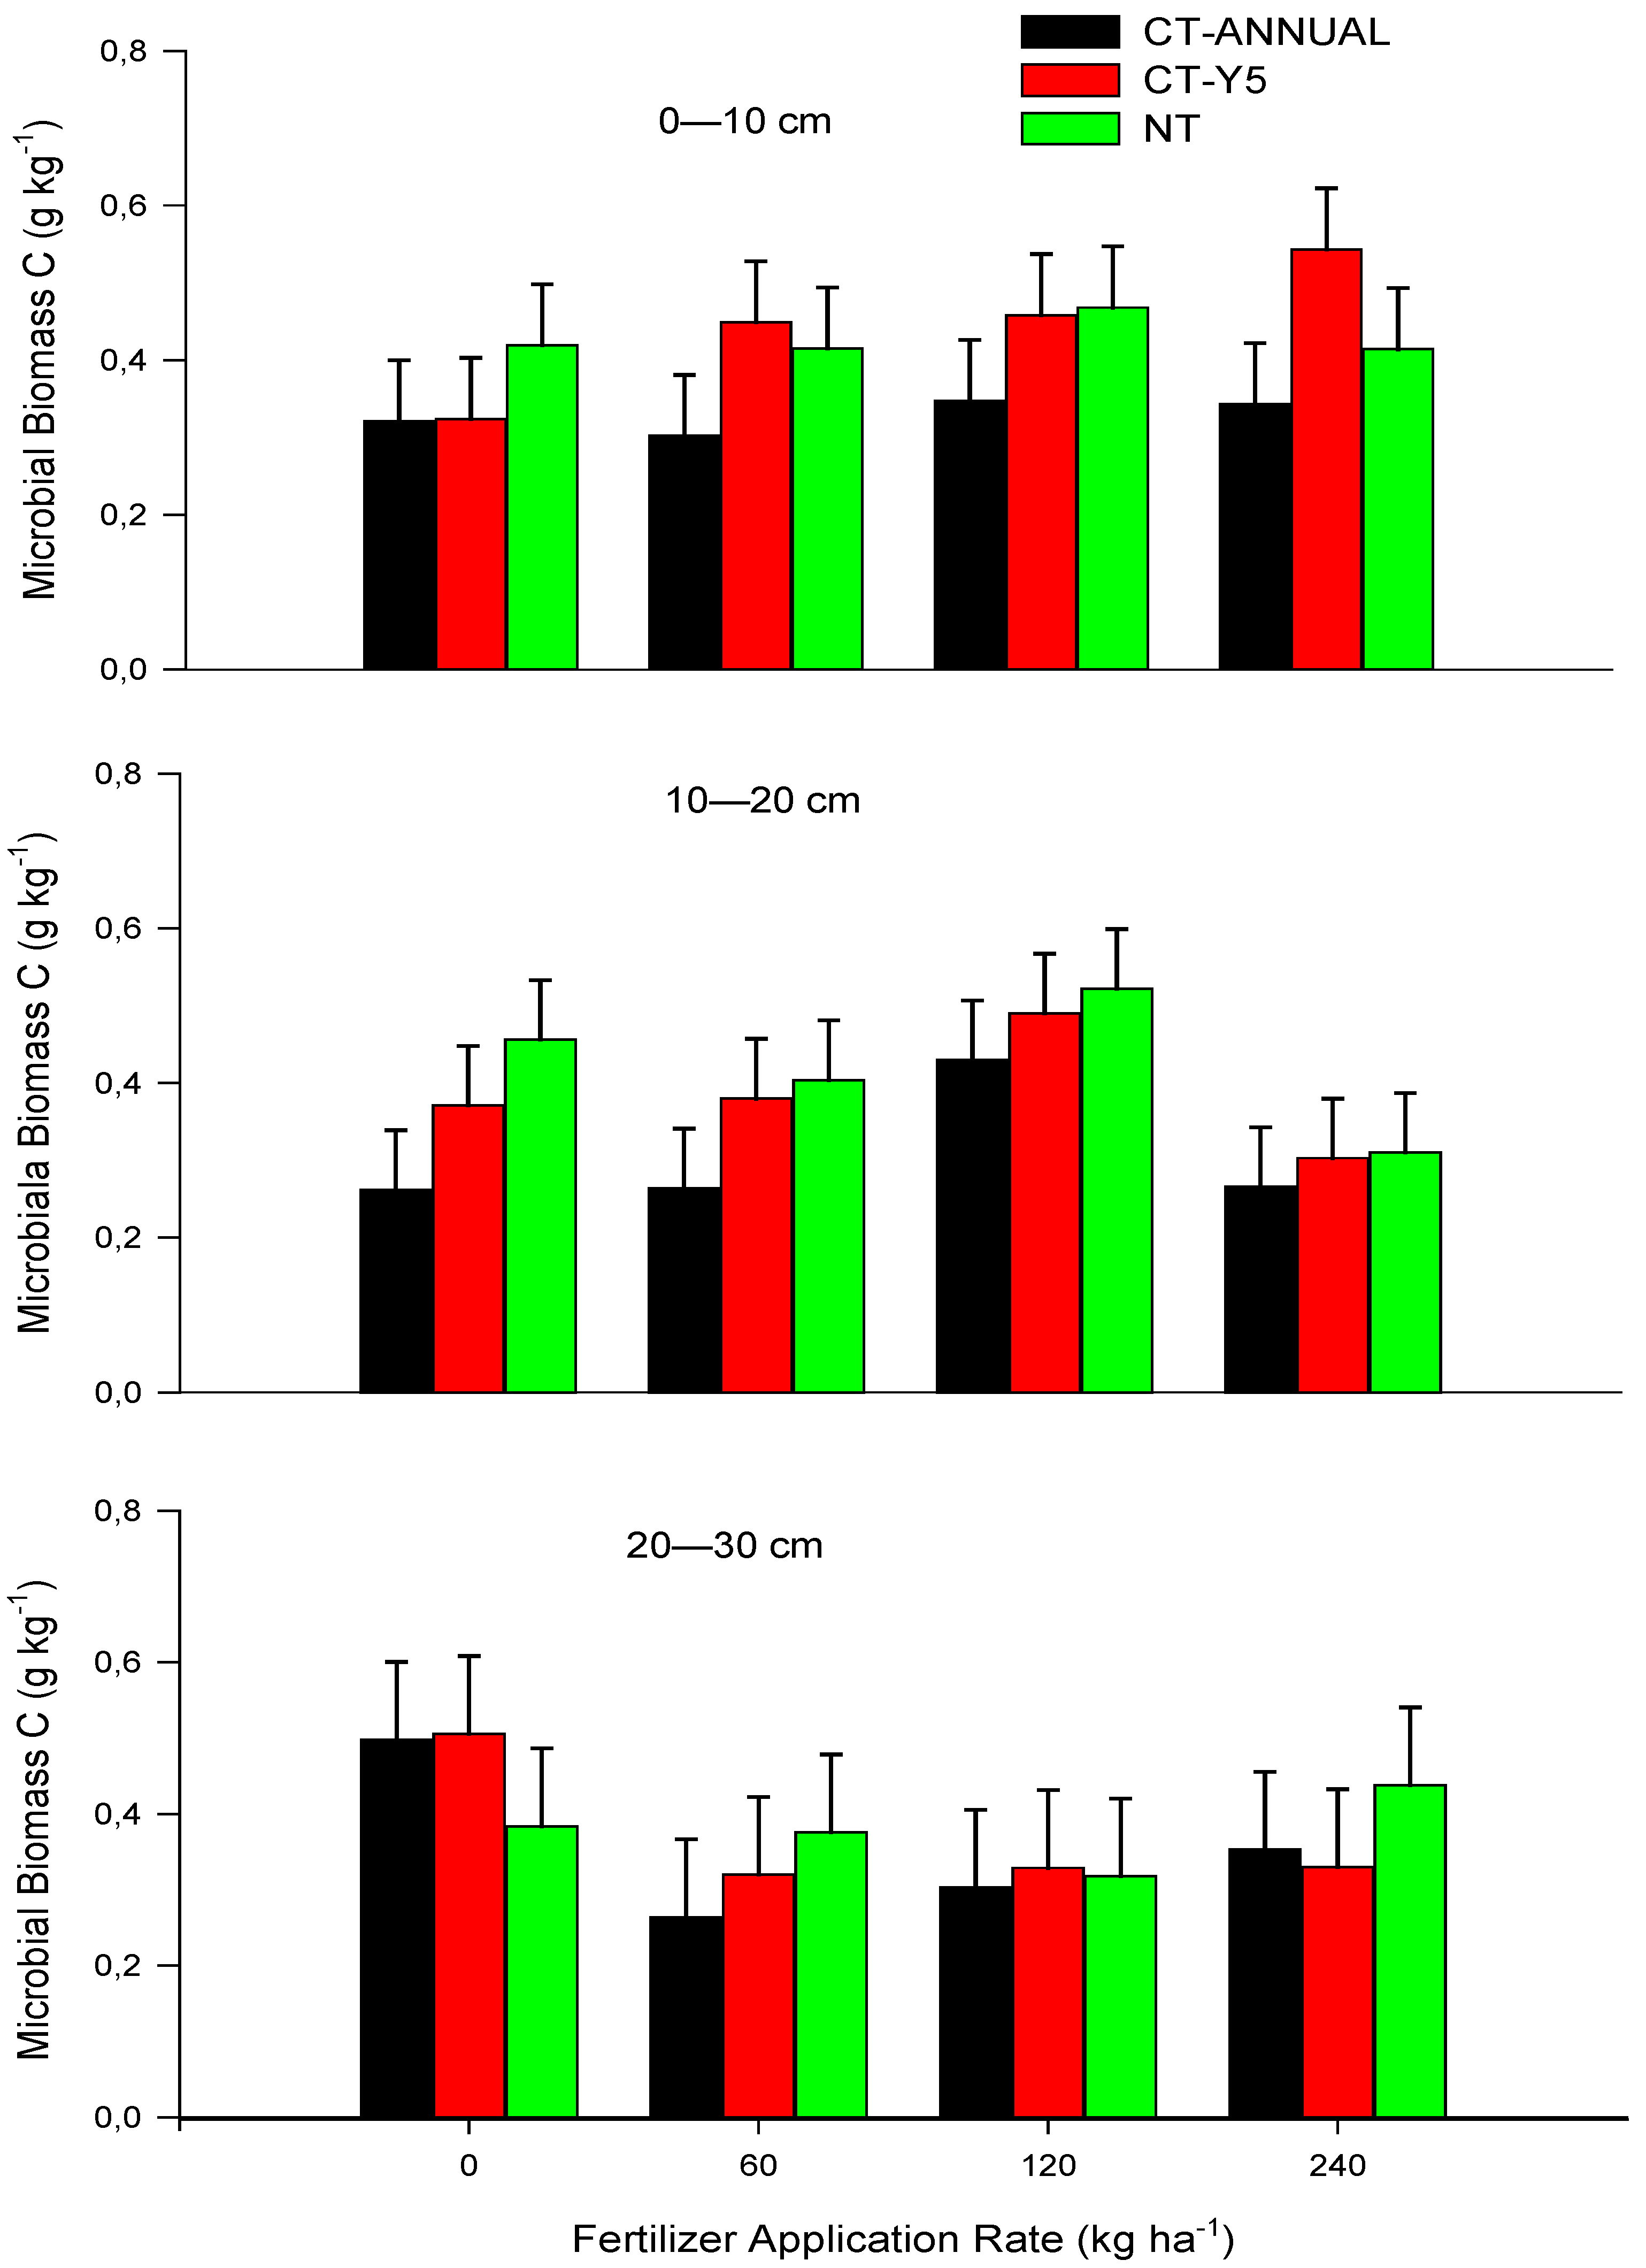
3.5. Microbial Biomass Carbon (MBC) Variations

Figure 6 shows that, mostly, NT and CT-Y5 did not significantly differ in MBC at these depths, with the exception of the 240 kg N ha−1 application rate at 0–10 cm where CT-Y5 recorded the highest MBC, as well as in the control at 10–20 cm depth where NT had higher MBC (0.46 g C kg−1) than CT-ANNUAL (0.26 g C kg−1).

3.6. Microbial Quotient (qMic) Variations

Figure 7 shows that qMic at 240 kg N ha−1 in CT-Y5 was higher in all the treatments in the 0–10 cm soil depth. Further, in 0–10 cm depth CT-Y5 had higher qMic compared to NT at 120 kg N ha−1 and CT-ANNUAL at 60 kg N ha−1. In the control treatment of 0–10 cm depth, CT-ANNUAL had higher qMic than NT. In the control treatment of 10–20 cm depth, CT-Y5 had lower qMic than NT but higher qMic than CT-ANNUAL. Figure 7 shows that CT-Y5 at 240 kg N ha−1 had the highest qMic of all the treatments in 20–30 cm soil depth.

4. Discussion

SOC plays an important role in long-term ecosystem productivity, by maintaining a soil nutrient pool and improving nutrient availability for uptake. Fertilizer application resulted in an increase in various C pools which may have been influenced by an increase in crop biomass. Changes of C pools were not only dependent on N fertilizer but also the type of tillage technique had a salient role. Changes in the amount of total soil C generally occurs slowly unless the soil is subject to severe disturbance such as intensive tillage or erosion [21]. According to [22], SOC is a heterogeneous mixture of organic substances with different fractions or pools of SOC exhibiting different sensitivity to management. Earlier studies have also shown that some biologically active or labile SOC pools respond to changes in management to a greater extent than the total C [23].
The total C had a similar trend to SOC. Thus, in the top 0–10 cm, NT had higher total C than CT-Y5 and CT-ANNUAL. According to [24], the elimination of soil mixing in NT leads to a concentration of OM at the soil surface. Previous research has shown a substantial increase of the total C in soil under NT compared to CT [25]. However, at 10–20 cm depth, CT-ANNUAL at 120 and 240 kg N ha−1 had higher total C than both NT and CT-Y5. This may be attributed to the vertical distribution of soil C under CT-ANNUAL with increasing fertilizer rates allowing a higher amount of total C to accumulate in the subsoil. Further, higher crop biomass input in fertilized treatment could have contributed significantly to C accrual. Peculiarly, at 20–30 cm soil depth at both 60 and 120 kg N ha−1, NT had higher total C than CT-ANNUAL. Ref. [26] found that NT increased soil C in surface soils at the expense of the lower plough layer, resulting in no net increase in the total C storage within the soil profile.
It is reasonable to believe that soil C depletion at depth found under NT mainly results from reduced burial of crop residues and less root inputs compared to CT [27]. Again, low C storage under CT-ANNUAL at 0–10 cm was probably due to high oxidation rates, release of organic compounds to the soluble form, and greater microbial activity. Ref. [24] elucidated that soil C is higher in the entire profile under NT and concluded that there is a stratification of soil C in surface horizons without any depletion of it at deeper horizons compared to treatments receiving tillage. Therefore, the higher C in NT at 20–30 cm soil depth is because of high inputs of C in the surface and less turnover of OM at lower depths. In a study by [28], the turnover soil C in aggregates was faster in CT than in NT, resulting in a greater loss of 53 to 250 µm intra-macro-aggregate POC in CT.
In the current study, the soil surface had the highest concentration of organic C compared to the other depths in all the tillage treatments and fertilizer rates, with NT having higher organic C. This may be related to the moist anaerobic conditions under NT, since it had higher soil moisture resulting in slower oxidation of OM. Tilling mixed the profile soil, thus OM on the surface was able to migrate into the deeper soil layers thereby reducing organic C in the surface under CT-ANNUAL. Ref. [29] explained that less subsoil organic C under NT was a result of a lack of redistribution of surface soil C into deeper soil layers by ploughing. In addition, the restricted root growth due to soil compaction, caused by using heavy machinery and lack of soil loosening under NT may limit root penetration into the deeper soil layers. Usually roots respire, exude C, and, during senescence, decompose, thus assist in adding organic C on the subsoil. Ref. [30] also found that under reduced tillage, C was higher in the surface compared to CT.
It is worth noting that at 10–20 cm soil depth, there were no significant differences in SOC for all the fertilizer application rates or tillage treatments. This was similar to the findings of [30], who noted non-significant differences in SOC at 10–20 cm depth between different tillage treatments. Contrarily, previous research has shown that CT significantly affects the vertical distribution of SOC with the concentration of SOC increasing with both depth and tillage [31]. Ref. [30] further argued that the influence of tillage on SOC depends on the depth to which the tillage operation incorporated plant material. In the current study, the influence of NT on SOC, with significantly higher organic C compared to CT-Y5 and CT-ANNUAL, was observed especially at 0–10 cm. NT leads to increased soil cover and reduced soil disturbance which increases soil strength. The increased soil strength under NT not only discourages root growth into deeper soil layers [32], but also reduces the downward movement of surface soil C.
The difference in the concentration and sensitivity of labile C fractions may be due to climate, soil type, cropping system, and laboratory procedures that were utilized in different analyses. Unlike MBC and POxC, which utilized chemical composition, POC relied on physical fractionation to determine its concentration which can respond in less of a short space of time to management. POC represents a partially decomposed C fraction with a short turnover time, while POxC reflects a more processed fraction of soil C [33]. This was demonstrated by [34], who observed a significant relationship between POxC and SOC but none between POxC and labile C fractions such as MBC. Ref. [35] had similar findings to the current study with POC showing greater sensitivity to N fertilization than SOC and POxC for the three soil depths that were studied (0–5, 5–20, and 20–40 cm), and greater sensitivity to tillage management at 5–20 and 20–40 cm depth. POC represents the highest response to changes in agricultural management and can be used as an early indicator of optimized practices to sequester soil C [35]. However, it does not necessary disqualify POxC and MBC as good soil quality indicators.
Ref. [36] observed that POC comprised roughly 20–40% of the total C in the soil, while POxC and MBC made up only 4 and 2% of the total C, respectively. These findings contrasted with the current data where POxC comprised 8–14%, POC 20–48%, and MBC had 0.4–1–1.0% of the total C. Thus, POC can be regarded as the most labile C that is sensitive to management such as tillage and fertilizer application, followed by POxC and then MBC. Ref. [37] also observed a greater response to tillage by POC compared to the POxC fraction, while Ref. [38] observed a higher increase in POC than bulk SOC in response to long-term fertilization of maize. Contrarily, Ref. [36], found POxC to be a more sensitive indicator of differences in management (tillage and fertilizer application) than other measured C fractions. POxC was more strongly related to heavier and smaller, than lighter and larger POC fractions, indicating that it reflects a more processed, stabilized pool of labile soil C [36]. In a study by [39], it was evident, however, that total C exhibited greater sensitivity than POxC to changes in land management or soil depth. Ref. [11] also observed that POxC did not provide a clear advantage over SOC when considering major land use alterations such as pasture vs agriculture.
POC was higher under CT-ANNUAL at both 120 kg N ha−1 and 240 kg N ha−1 compared to NT and CT-Y5 in the 10–20 cm soil depth. This was probably a result of ploughing and crop residue incorporation into soil under CT-ANNUAL, whereas plant residues accumulate on the surface under NT and CT-Y5. According to [40], NT sequesters more POC in the soil than CT. This was evident in the current study at 0–10 cm depth, where NT had higher POC at all application rates compared to CT-Y5 and CT-ANNUAL. A higher accumulation of organic material under NT than other treatments may be the cause of this. POC can account for over 10% of the soil C [41]. This was supported by the findings of the current study where it was between 20–48% of total C. SOC had no observable differences with tillage at 10–20 cm depth, however major differences were observed in POC. This shows that POC is more sensitive to management than SOC. Tillage impacts on POC were consistent with those of total C but were still more pronounced with POC. Ref. [42] also found that changes in POC at different sites followed the trend of total C.
Ref. [43] observed that NT increased POC by up to 70% at the surface but was lower by 18% in subsoil when compared with CT. Ref. [28] attributed this increase to a combination of reduced litter decomposition and less soil disturbance under NT. Reduced rates of litter decomposition may be due to microclimates which hinder microbial activity in the surface residue layer. The CT-Y5 treatments had intermediate POC fractions of both NT and CT-ANNUAL. Ref. [44] explained that a fraction of SOM is lost due to tillage and this explains low POC under CT in the topsoil, which concurs with the current results. On the other hand, Ref. [24] noted that although NT had higher POC concentrated in the surface horizons, there was no depletion of this fraction in deeper horizons, making the magnitude of differences between tillage systems more important at the upper depth. Ref. [43] found the differences in POC at the 5–17.5 and 17.5–30 cm depths to be greater in CT than NT soils. Many studies credit soil mixing with an even distribution of SOM with depth in CT soils [45].
Differences in POC concentrations at depth could also be a result of root productivity. Although we did not quantify crop productivity, we were informed that in previous years NT had a bumper harvest than CT-Y5 and CT-ANNUAL. According to [43], NT had greater yields than CT which suggested accumulation of SOM by NT surface soils, which may be a result of reduced mineralization and erosion rates. Fertilizer application and tillage exposed C to microbial attack due to high contact between plant residues and the soil mineral matrix, and the POC pool with its high sensitivity is easily mineralized. CT treatments have less stable aggregates compared to NT as these are constantly disrupted through tillage [28]. Disrupted aggregates release higher amounts of C compared to stable aggregates which help in C sequestration. When POC is released from aggregates, it becomes exposed to microbial decay, which leads to its loss and increased CO2 flux in CT compared with NT [28]. Ref. [46] reported that the biochemical environment of NT soils is less oxidative than CT, especially at lower depths. Ref. [47], explained that greater POC under NT at 15–30 cm might be explained by more anaerobic conditions in deeper soil layers and contributions from crop roots.
Although SOC showed no significance difference of tillage and application rates at 10–20 and 20–30 cm, the trend was different with POxC. However, significant positive correlations between the total C and POxC at 0–5 and 5–10 cm depth showed that the total C is a major determinant of the quantity of labile organic C fractions [48,49]. A strong positive relationship between POxC and SOC has been reported previously which was attributed to similar methodology; both rely on soil C oxidation [36,49]. SOC is determined by the complete oxidation of all soil C while POxC relies on the partial oxidation of the more easily oxidized C pool [50]. According to [50], the POxC fraction is a pool of labile soil C that has greater sensitivity to changes in management or environmental variation than other commonly measured pools. Ref. [17] stated that compared to total C, POxC measured a C pool that was more closely associated with soil biological functions.
A decline of POxC with depth in this study reflects decreased root density and residue accumulation. Decreased root density with depth is thought to be associated with a parallel decline in sub-surface rhizodeposition [51]. With higher microbial populations and respiration activity nearer the soil surface, POxC in surface soil will be more rapidly oxidized or converted into protected soil total C than in the deeper soil [52]. According to [53], frequent tillage under CT may break down aggregates and expose protected OM to microbial decomposition, thereby increasing the loss of POxC which is evident in the current study. Residue in conservation tillage system improves soil physical and chemical quality through increased infiltration, aggregate stability, and enhancing POxC fractions [54]. At all soil depths, an increase in fertilizer application did not have an impact on the POxC pools. This may be attributed to soil acidification, with the application of N fertilizer, which impedes enzymatic oxidation. Ref. [55] found that organic mulches generally increased POxC contents in the upper soil profile compared with inorganic fertilizer. According to [56], the application of organic mulches on soil increases the soil pH, which may be attributed to a liberation of bases during the decay process. Contrarily, Ref. [52], stated that POxC was higher in high N soil especially in the lower subsoil, suggesting that N-rich soil stimulated more root growth and rhizodeposition in the fertilized crop.
MBC, as the living component of SOM, plays a critical role in nutrient cycling, OM decomposition, and transformation [53]. MBC responded differently from total or SOC. MBC had lower concentrations than both POC and POxC labile fractions. The lower sensitivity of MBC compared to POC might be due to a greater abundance within micro-aggregates sizes and its highly labile nature [57]. The increase of MBC with increased N application rate at 0–10 cm depth can be explained by the increase of root biomass, crop productivity, residue accumulation, and henceforth decomposable organic material. The reported effects of chemical fertilizer on MBC are inconsistent. Ref. [58] reported that chemical fertilizers decreased MBC because severe N resulted in a microbial population with a comparatively high proportion of dormant cells. Ref. [59] also noted low MBC with chemical fertilizer use that was comparable with that of the control. However, in a study by [23], chemical fertilizer increased MBC because it resulted in higher organic C input into the soil, implying that microbial biomass is more controlled by substrate supply and less by chemical fertilizer. Ref. [55] found that chemical fertilizer increased MBC by 63.2% compared to the control after 37 years.
In a study by [60], the highest MBC was associated with the highest N application rate of 225 kg N ha−1. This is similar to the current study which had the highest MBC at 240 kg N ha−1 in the 0–10 and 20–30 cm depths, whereas at 10–20 cm depth 120 kg N ha−1 gave the highest MBC. Ref. [61] observed greater MBC in surface soil under NT, and at deeper depths under CT, which was explained by the effects of litter availability on the surface under NT and incorporation into the subsoil in CT. Ref. [62] suggested that crop residue accumulation provides substrate for microorganisms, which accounts for higher MBC in the surface soil. Furthermore, wetter and higher temperature soil under NT was more favorable for soil microbial activity [63]. CT-Y5 had similar soil properties with NT, but with a better advantage of mixing of crop residues after four seasons thereby enhancing decomposition, giving it the highest MBC at 240 kg N ha−1 in 0–10 cm depth. Ref. [60] noticed that the combined effect of residue retention and minimum tillage increased MBC by 82% over control. However, in NT the surface application of retained residues increased MBC only by 36% over the control [60]. CT-Y5 is a proxy of minimum tillage; therefore, our findings were in line with the above study.
The MBC decreased with depth but 20–30 cm soil depth had, on total average, almost the same concentration as at 10–20 cm. This may be attributed to less OM in subsoil. Ref. [61] also observed decreased MBC with depth. In general, situations favoring the accumulation of OM increase MBC [64]. At 0–10 and 20–30 cm soil depths, CT-Y5 had greater average MBC than NT and CT-ANNUAL. According to [65], MBC was the highest under minimum tillage at 2.5–7.5 cm soil depth. Most impacts of NT on enhancing C sequestration have been observed in surface soils near the rooting zone and residue litter [66]. However, long-term increases in SOM have been observed in subsurface soils after 20 years of NT [67]. This experiment has been running for more than 20 years, hence observations were made of higher MBC values under NT than CT-ANNUAL (particularly in the control) at 10–20 cm soil depth. The living fraction of OM rather than total organic C has been suggested as a useful and more sensitive measure of change in OM status [36]. These changes can be monitored by the qMic ratio which is the ratio of MBC to SOC. According to [19], the qMic ratio represents the amount of metabolic active C in the total SOM. The qMic ratio could serve to indicate if soil C is in equilibrium, accumulating, or decreasing from the threshold of 2.3 under monoculture and 2.5 under rotations with fertilizer [68]. Although, in this case, sampling was only done once making it difficult to assess if it was decreasing, increasing, or in equilibrium. However, using qMic ratios from the literature, the study area had very low qMic. These findings, with low values of qMic, suggest that a larger proportion of non-microbial C was contained in the SOC rather than MBC.
Generally, the lowest qMic was in CT-ANNUAL, with CT-Y5 having higher qMic at 0–10 and 20–30 cm while NT was predominantly higher at 10–20 cm. Ref. [69] suggested that the higher qMic under conservation tillage rather than CT was caused by the quality of the OM input which was more suitable for microbial growth and survival. These results show that CT-ANNUAL had a continuous reduction in SOC and MBC and eventually qMic. In the study by [70], the lowest qMic in CT and NT indicated the lowest substrate availability to microorganisms. Both NT and CT-Y5 resulted in an increase of SOM from crop residues, compared to CT-ANNUAL which eventually resulted in higher MBC. The 240 kg N ha−1 of CT-Y5 had the highest qMic ratio at the 0–10 and 20–30 cm depth whereas at 10–20 cm, the highest qMic ratio was observed under NT at 120 kg N ha−1 which was similar to the trend of MBC. The qMic generally increased with an increase in N application. In contrast, Ref. [71] reported that unfertilized soil increased the qMic ratio, while increasing the total soil N did not increase the qMic ratio. Consequently, it can be inferred that the increase in the qMic ratio is from the organic C inputs and not necessarily related to the N status of the soil [71]. The significant effect of both tillage and N application on qMic shows that C is not stabilized in the soil. The consistency of the qMic ratio is thus an indication of a system at a new equilibrium [68].

5. Conclusions

Tillage and fertilizer application had an effect on the soil C fractions at different depths. NT increased most C fractions (except MBC) in the upper soil layer, which could lead to higher soil productivity. Thus, C sequestration is greater in NT than in CT-Y5 and CT-ANNUAL. This was because of slower OM turnover in NT leading to the formation and stabilization of C. Whereas under CT-ANNUAL, SOM turnover was easily intensified by tillage which breaks down aggregates protecting C, thus releasing it into the atmosphere as CO2 or it is consumed by microbes. On the other hand, CT-ANNUAL had higher POC, POxC, and total C in the 10–20 cm depth and higher application rates of 120 and 240 kg N ha−1 than CT-Y5 and NT. This may be attributed to the mixing of residual material during ploughing to lower depths. In general, all the C pools were higher in the surface soil relative to lower depths. Tillage, fertilizer application, and depth had significant effects on the labile C fractions, showing a greater sensitivity compared to total C. POC exhibited a relatively greater response to tillage, fertilizer application, and depth than MBC and POxC, while POxC showed more sensitivity to management than the MBC labile fraction. The MBC responded more to CT-Y5 at 0–10 cm, with significantly higher values at 240 kg N ha−1, compared to other tillage techniques. CT-Y5 at 240 kg N ha−1 (0–10 cm) and NT at 120 kg N ha−1 (10–20 cm) had the highest qMic which was similar to MBC. The significant difference in the qMic ratio among both tillage and fertilizer rates explicitly clarifies that there is no C balance in the soil. Although CT-Y5 did not always have the highest C fractions, it maintained intermediate concentrations compared with other tillage techniques. C sequestration will not automatically increase with an increase of C input, but will depend on the rate of C output from the soils, which is affected by the management type that is employed. A larger input over output of OM is the reason for the increase of the total C and its various fractions in the fertilized treatments. This implies that a high amount of organic material input through better crop production and N fertilizer application is required for increasing the SOC pools. Therefore, using conservation agriculture, particular NT or CT-Y5 at 0–10 cm, with 120 kg N ha−1 application rate in dryland agriculture is recommended. The alternative hypothesis of the study stating that an increase in fertilizer application rate and intensification of tillage will increase labile C pools with increase in depth was rejected.

Author Contributions

Conceptualization, B.S.V., R.Z. and P.M.; methodology, B.S.V. and R.Z.; software, B.S.V.; validation, R.Z. and P.M.; formal analysis, B.S.V.; investigation, B.S.V.; resources, P.M. and R.Z.; data curation, B.S.V.; writing—original draft preparation, B.S.V.; writing—review and editing, R.Z. and P.M.; visualization, B.S.V.; supervision, R.Z. and P.M.; project administration, B.S.V.; funding acquisition, B.S.V. and P.M. All authors have read and agreed to the published version of the manuscript.

Funding

This research was funded by National Research Fund (NRF) grant number 4959. And The APC was funded by NRF.

Acknowledgments

The study was funded by National Research Foundation through the South African Research Chair: Agronomy and Rural Development at the University of KwaZulu-Natal, in South Africa.

Conflicts of Interest

The authors declare no conflict of interest.

References

  1. Johnson, M.G.; Kern, J.S.; Lammers, D.A.; Lee, J.J.; Liegel, L.H. Sequestering Carbon in Soils: A Workshop to Explore the Potential for Mitigating Global Climate Change. Held in Corvallis, Oregon on February 26–28, 1990; ManTech Environmental Technology, Inc.: Corvallis, OR, USA, 1991. [Google Scholar]
  2. Blanco-Canqui, H.; Lal, R. No-tillage and soil-profile carbon sequestration: An on-farm assessment. Soil Sci. Soc. Am. J. 2008, 72, 693–701. [Google Scholar] [CrossRef] [Green Version]
  3. Lal, R. Soil carbon sequestration to mitigate climate change. Geoderma 2004, 123, 1–22. [Google Scholar] [CrossRef]
  4. Chenu, C.; Angers, D.A.; Barré, P.; Derrien, D.; Arrouays, D.; Balesdent, J. Increasing organic stocks in agricultural soils: Knowledge gaps and potential innovations. Soil Tillage Res. 2019, 188, 41–52. [Google Scholar] [CrossRef]
  5. Aguilera, E.; Lassaletta, L.; Gattinger, A.; Gimeno, B.S. Managing soil carbon for climate change mitigation and adaptation in Mediterranean cropping systems: A meta-analysis. Agric. Ecosyst. Environ. 2013, 168, 25–36. [Google Scholar] [CrossRef]
  6. Dimassi, B.; Mary, B.; Wylleman, R.; Labreuche, J.; Couture, D.; Piraux, F.; Cohan, J.P. Long-term effect of contrasted tillage and crop management on soil carbon dynamics during 41 years. Agric. Ecosyst. Environ. 2014, 188, 134–146. [Google Scholar] [CrossRef]
  7. Helgason, B.L.; Gregorich, E.G.; Janzen, H.H.; Ellert, B.H.; Lorenz, N.; Dick, R.P. Long-term microbial retention of residue C is site-specific and depends on residue placement. Soil Biol. Biochem. 2014, 68, 231–240. [Google Scholar] [CrossRef]
  8. Kern, J.S.; Johnson, M.G. Conservation tillage impacts on national soil and atmospheric carbon levels. Soil Sci. Soc. Am. J. 1993, 57, 200–210. [Google Scholar] [CrossRef]
  9. Magdoff, F.; Weil, R.R. Soil organic matter management strategies. In Soil Organic Matter in Sustainable Agriculture; CRC Press: Boca Raton, FL, USA, 2004; pp. 45–65. [Google Scholar]
  10. Gunapala, N.; Scow, K.M. Dynamics of soil microbial biomass and activity in conventional and organic farming systems. Soil Biol. Biochem. 1998, 30, 805–816. [Google Scholar] [CrossRef]
  11. Skjemstad, J.O.; Swift, R.S.; McGowan, J.A. Comparison of the particulate organic carbon and permanganate oxidation methods for estimating labile soil organic carbon. Soil Res. 2006, 44, 255–263. [Google Scholar] [CrossRef]
  12. World Reference Base for Soil Resources. International Soil Classification System for Naming Soils and Creating Legends for Soil Maps; Food and Agriculture Organization of the United Nations: Rome, Italy, 2014. [Google Scholar]
  13. Vilakazi, B.S. Indigenous Knowledge Systems Available to Physico-Chemical Properties on Selected Smallholder Farms of KwaZulu-Natal. Master’s Thesis, Soil Science School of Agricultural, Earth and Environmental Sciences, University of KwaZulu Natal, Pietermaritzburg, South Africa, 2017. [Google Scholar]
  14. LECO Corporation. TruMac CNS/NS Determinators; LECO Corporation: St Joseph, MI, USA, 2012. [Google Scholar]
  15. Van Reeuwijk, L.P. Procedures for Soil Analysis; Soil Reference and Information Centre (ISRIC): Wageningen, The Netherlands, 2002. [Google Scholar]
  16. Elliott, E.T.; Palm, C.A.; Reuss, D.E.; Monz, C.A. Organic matter contained in soil aggregates from a tropical chronosequence: Correction for sand and light fraction. Agric. Ecosyst. Environ. 1991, 34, 443–451. [Google Scholar] [CrossRef]
  17. Weil, R.R.; Islam, K.R.; Stine, M.A.; Gruver, J.B.; Samson-Liebig, S.E. Estimating active carbon for soil quality assessment: A simplified method for laboratory and field use. Am. J. Altern. Agric. 2003, 18, 3–17. [Google Scholar]
  18. Alef, K.; Nannipieri, P. Methods in Applied Soil Microbiology and Biochemistry; Academic Press: Cambridge, MA, USA, 1995. [Google Scholar]
  19. Makova, J.; JavorekovÁ, S.; Medo, J.; Majerčíková, K. Characteristics of microbial biomass carbon and respiration activities in arable soil and pasture grassland soil. J. Cent. Eur. Agric. 2011, 12, 745–758. [Google Scholar] [CrossRef] [Green Version]
  20. VSN International. Genstat for Windows; VSN International: Hemel Hempstead, UK, 2011. [Google Scholar]
  21. Govers, G.V.; Van Oost, K.; Poesen, J. Responses of a semi-arid landscape to human disturbance: A simulation study of the interaction between rock fragment cover, soil erosion and land use change. Geoderma 2006, 133, 19–31. [Google Scholar] [CrossRef]
  22. Benbi, D.K.; Brar, K.; Toor, A.S.; Singh, P. Total and labile pools of soil organic carbon in cultivated and undisturbed soils in northern India. Geoderma 2015, 237, 149–158. [Google Scholar] [CrossRef]
  23. Gong, W.; Yan, X.Y.; Wang, J.Y.; Hu, T.X.; Gong, Y.B. Long-term manuring and fertilization effects on soil organic carbon pools under a wheat–maize cropping system in North China Plain. Plant Soil 2009, 314, 67–76. [Google Scholar] [CrossRef]
  24. Mrabet, R.; Saber, N.; El-Brahli, A.; Lahlou, S.; Bessam, F. Total, particulate organic matter and structural stability of a Calcixeroll soil under different wheat rotations and tillage systems in a semiarid area of Morocco. Soil Tillage Res. 2001, 57, 225–235. [Google Scholar] [CrossRef]
  25. Halvorson, A.D.; Peterson, G.A.; Reule, C.A. Tillage system and crop rotation effects on dryland crop yields and soil carbon in the central Great Plains. Agron. J. 2002, 94, 1429–1436. [Google Scholar] [CrossRef] [Green Version]
  26. Baker, J.M.; Ochsner, T.E.; Venterea, R.T.; Griffis, T.J. Tillage and soil carbon sequestration—What do we really know? Agric. Ecosyst. Environ. 2007, 118, 1–5. [Google Scholar] [CrossRef]
  27. Yang, X.M.; Drury, C.F.; Wander, M.M.; Kay, B.D. Evaluating the effect of tillage on carbon sequestration using the minimum detectable difference concept. Pedosphere 2008, 18, 421–430. [Google Scholar] [CrossRef]
  28. Six, J.; Elliott, E.T.; Paustian, K. Aggregate and soil organic matter dynamics under conventional and no-tillage systems. Soil Sci. Soc. Am. J. 1999, 63, 1350–1358. [Google Scholar] [CrossRef] [Green Version]
  29. Luo, Z.; Wang, E.; Sun, O.J. Can no-tillage stimulate carbon sequestration in agricultural soils? A meta-analysis of paired experiments. Agric. Ecosyst. Environ. 2010, 139, 224–231. [Google Scholar] [CrossRef]
  30. Deen, W.; Kataki, P.K. Carbon sequestration in a long-term conventional versus conservation tillage experiment. Soil Tillage Res. 2003, 74, 143–150. [Google Scholar] [CrossRef]
  31. Angers, D.A.; Bolinder, M.A.; Carter, M.R.; Gregorich, E.G.; Drury, C.F.; Liang, B.C.; Voroney, R.P.; Simard, R.R.; Donald, R.G.; Beyaert, R.P.; et al. Impact of tillage practices on organic carbon and nitrogen storage in cool, humid soils of eastern Canada. Soil Tillage Res. 1997, 41, 191–201. [Google Scholar] [CrossRef]
  32. Martínez, E.; Fuentes, J.P.; Silva, P.; Valle, S.; Acevedo, E. Soil physical properties and wheat root growth as affected by no-tillage and conventional tillage systems in a Mediterranean environment of Chile. Soil Tillage Res. 2008, 99, 232–244. [Google Scholar] [CrossRef]
  33. Cambardella, C.A.; Elliott, E.T. Particulate Soil Organic-Matter Changes across a Grassland Cultivation Sequence. Soil Sci. Soc. Am. J. 1992, 56, 777–783. [Google Scholar] [CrossRef]
  34. Tirol-Padre, A.; Ladha, J.K. Assessing the reliability of permanganate-oxidizable carbon as an index of soil labile carbon. Soil Sci. Soc. Am. J. 2004, 68, 969–978. [Google Scholar] [CrossRef]
  35. Plaza-Bonilla, D.; Álvaro-Fuentes, J.; Cantero-Martínez, C. Identifying soil organic carbon fractions sensitive to agricultural management practices. Soil Tillage Res. 2014, 139, 19–22. [Google Scholar] [CrossRef] [Green Version]
  36. Culman, S.W.; Snapp, S.S.; Freeman, M.A.; Schipanski, M.E.; Beniston, J.; Lal, R.; Drinkwater, L.E.; Franzluebbers, A.J.; Glover, J.D.; Grandy, A.S.; et al. Permanganate oxidizable carbon reflects a processed soil fraction that is sensitive to management. Soil Sci. Soc. Am. J. 2012, 76, 494–504. [Google Scholar] [CrossRef] [Green Version]
  37. Awale, R.; Chatterjee, A.; Franzen, D. Tillage and N-fertilizer influences on selected organic carbon fractions in a North Dakota silty clay soil. Soil Tillage Res. 2013, 134, 213–222. [Google Scholar] [CrossRef]
  38. Gregorich, E.G.; Monreal, C.M.; Schnitzer, M.; Schulten, H.R. Transformation of plant residues into soil organic matter: Chemical characterization of plant tissue, isolated soil fractions, and whole soils. Soil Sci. 1996, 161, 680–693. [Google Scholar] [CrossRef]
  39. Romero, C.M.; Engel, R.E.; D'Andrilli, J.; Chen, C.; Zabinski, C.; Miller, P.R.; Wallander, R. Patterns of change in permanganate oxidizable soil organic matter from semiarid drylands reflected by absorbance spectroscopy and Fourier transform ion cyclotron resonance mass spectrometry. Org. Geochem. 2018, 120, 19–30. [Google Scholar] [CrossRef]
  40. Hok, L.; de Moraes Sá, J.C.; Boulakia, S.; Reyes, M.; Leng, V.; Kong, R.; Tivet, F.E.; Briedis, C.; Hartman, D.; Ferreira, L.A.; et al. Short-term conservation agriculture and biomass-C input impacts on soil C dynamics in a savanna ecosystem in Cambodia. Agric. Ecosyst. Environ. 2015, 214, 54–67. [Google Scholar] [CrossRef]
  41. Carter, M.R.; Kunelius, H.T.; Angers, D.A. Soil structural form and stability, and organic matter under cool-season perennial grasses. Soil Sci. Soc. Am. J. 1994, 58, 1194–1199. [Google Scholar] [CrossRef]
  42. Chan, K.Y. Soil particulate organic carbon under different land use and management. Soil Use Manag. 2001, 17, 217–221. [Google Scholar] [CrossRef]
  43. Wander, M.M.; Bidart, M.G.; Aref, S. Tillage impacts on depth distribution of total and particulate organic matter in three Illinois soils. Soil Sci. Soc. Am. J. 1998, 62, 1704–1711. [Google Scholar] [CrossRef]
  44. Six, J.; Elliott, E.T.; Paustian, K.; Doran, J.W. Aggregation and soil organic matter accumulation in cultivated and native grassland soils. Soil Sci. Soc. Am. J. 1998, 62, 1367–1377. [Google Scholar] [CrossRef] [Green Version]
  45. Collins, H.P.; Rasmussen, P.E.; Douglas, C.L., Jr. Crop rotation and residue management effects on soil carbon and microbial dynamics. Soil Sci. Soc. Am. J. 1992, 56, 783–788. [Google Scholar] [CrossRef]
  46. Doran, J.W.; Elliott, E.T.; Paustian, K. Soil microbial activity, nitrogen cycling, and long-term changes in organic carbon pools as related to fallow tillage management. Soil Tillage Res. 1998, 49, 3–18. [Google Scholar] [CrossRef]
  47. Franzluebbers, A.J.; Stuedemann, J.A. Bermudagrass management in the southern piedmont USA. III. Particulate and biologically active soil carbon. Soil Sci. Soc. Am. J. 2003, 67, 132–138. [Google Scholar] [CrossRef]
  48. Yang, X.; Ren, W.; Sun, B.; Zhang, S. Effects of contrasting soil management regimes on total and labile soil organic carbon fractions in a loess soil in China. Geoderma 2012, 177, 49–56. [Google Scholar] [CrossRef]
  49. Badagliacca, G.; Romeo, M.; Lo Presti, E.; Gelsomino, A.; Monti, M. Factors Governing Total and Permanganate Oxidizable C Pools in Agricultural Soils from Southern Italy. Agriculture 2020, 10, 99. [Google Scholar] [CrossRef] [Green Version]
  50. Wang, F.; Weil, R.R.; Nan, X. Total and permanganate-oxidizable organic carbon in the corn rooting zone of US Coastal Plain soils as affected by forage radish cover crops and N fertilizer. Soil Tillage Res. 2017, 165, 247–257. [Google Scholar] [CrossRef] [Green Version]
  51. Andrén, O.; Lindberg, T.; Boström, U.; Clarholm, M.; Hansson, A.C.; Johansson, G.; Lagerlöf, J.; Paustian, K.; Persson, J.; Pettersson, R.; et al. Organic carbon and nitrogen flows. Ecol. Bull. 1990, 40, 85–126. [Google Scholar]
  52. Wang, Z.; Hoffmann, T.; Six, J.; Kaplan, J.O.; Govers, G.; Doetterl, S.; Van Oost, K. Human-induced erosion has offset one-third of carbon emissions from land cover change. Nat. Clim. Change 2017, 7, 345–349. [Google Scholar] [CrossRef]
  53. Wang, Q.; Wang, Y.; Wang, Q.; Liu, J. Impacts of 9 years of a new conservational agricultural management on soil organic carbon fractions. Soil Tillage Res. 2014, 143, 1–6. [Google Scholar] [CrossRef]
  54. Govaerts, B.; Mezzalama, M.; Unno, Y.; Sayre, K.D.; Luna-Guido, M.; Vanherck, K.; Dendooven, L.; Deckers, J. Influence of tillage, residue management, and crop rotation on soil microbial biomass and catabolic diversity. Appl. Soil Ecol. 2007, 37, 18–30. [Google Scholar] [CrossRef]
  55. Mi, W.; Wu, L.; Brookes, P.C.; Liu, Y.; Zhang, X.; Yang, X. Changes in soil organic carbon fractions under integrated management systems in a low-productivity paddy soil given different organic amendments and chemical fertilizers. Soil Tillage Res. 2016, 163, 64–70. [Google Scholar] [CrossRef]
  56. Shashidhar, K.R.; Narayanaswamy, T.K.; Bhaskar, R.N.; Jagadish, B.R.; Mahesh, M.; Krishna, K.S. Influence of organic based nutrients on soil health and mulberry (Morus indica L.) production. J. Biol. Sci. 2009, 1, 94–100. [Google Scholar]
  57. Chen, H.; Hou, R.; Gong, Y.; Li, H.; Fan, M.; Kuzyakov, Y. Effects of 11 years of conservation tillage on soil organic matter fractions in wheat monoculture in Loess Plateau of China. Soil Tillage Res. 2009, 106, 85–94. [Google Scholar] [CrossRef]
  58. Omay, A.B.; Rice, C.W.; Maddux, L.D.; Gordon, W.B. Changes in soil microbial and chemical properties under long-term crop rotation and fertilization. Soil Sci. Soc. Am. J. 1997, 61, 1672–1678. [Google Scholar] [CrossRef]
  59. Grego, S.; Marinari, S.; Moscatelli, M.C.; Badalucco, L. Effects of ammonium nitrate and stabilised farmyard manure on microbial biomass and metabolic quotient of soil under Zea Mays L. Agric. Mediterr. 1998, 128, 132–137. [Google Scholar]
  60. Kushwaha, C.P.; Tripathi, S.K.; Singh, K.P. Variations in soil microbial biomass and N availability due to residue and tillage management in a dryland rice agroecosystem. Soil Tillage Res. 2000, 56, 153–166. [Google Scholar] [CrossRef]
  61. Dou, F.; Wright, A.L.; Hons, F.M. Sensitivity of labile soil organic carbon to tillage in wheat-based cropping systems. Soil Sci. Soc. Am. J. 2008, 72, 1445–1453. [Google Scholar] [CrossRef]
  62. Balota, E.L.; Colozzi Filho, A.; Andrade, D.S.; Dick, R.P. Long-term tillage and crop rotation effects on microbial biomass and C and N mineralization in a Brazilian Oxisol. Soil Till. Res. 2004, 77, 137–145. [Google Scholar] [CrossRef]
  63. Franzluebbers, A.J.; Hons, F.M.; Zuberer, D.A. Tillage and crop effects on seasonal dynamics of soil CO2 evolution, water content, temperature, and bulk density. Appl. Soil Ecol. 1995, 2, 95–109. [Google Scholar] [CrossRef]
  64. Zhang, Y.; Wang, L.; Li, W.; Xu, H.; Shi, Y.; Sun, Y.; Cheng, X.; Chen, X.; Li, Y. Earthworms and phosphate-solubilizing bacteria enhance carbon accumulation in manure-amended soils. J. Soils Sediments 2017, 17, 220–228. [Google Scholar] [CrossRef]
  65. Wright, A.L.; Provin, T.L.; Hons, F.M.; Zuberer, D.A.; White, R.H. Dissolved organic carbon in soil from compost-amended bermudagrass turf. HortScience 2005, 40, 830–835. [Google Scholar] [CrossRef] [Green Version]
  66. Paustian, K.A.; Andren, O.; Janzen, H.H.; Lal, R.; Smith, P.; Tian, G.; Tiessen, H.; Van Noordwijk, M.; Woomer, P.L. Agricultural soils as a sink to mitigate CO2 emissions. Soil Use Manag. 1997, 13, 230–244. [Google Scholar] [CrossRef]
  67. Wright, A.L.; Hons, F.M. Soil aggregation and carbon and nitrogen storage under soybean cropping sequences. Soil Sci. Soc. Am. J. 2004, 68, 507–513. [Google Scholar] [CrossRef]
  68. Van Wesemael, B.; Chartin, C.; Wiesmeier, M.; von Lützow, M.; Hobley, E.; Carnol, M.; Krüger, I.; Campion, M.; Roisin, C.; Hennart, S.; et al. An indicator for organic matter dynamics in temperate agricultural soils. Agric. Ecosyst. Environ. 2019, 274, 62–75. [Google Scholar] [CrossRef]
  69. Anderson, T.-H.; Domsch, K.H. Application of eco-physiological quotients (qCO2 and qD) on microbial biomasses from soils of different cropping histories. Soil Biol. Biochem. 1990, 22, 251–255. [Google Scholar] [CrossRef]
  70. Jiang, M.; Griffin, W.M.; Hendrickson, C.; Jaramillo, P.; VanBriesen, J.; Venkatesh, A. Life cycle greenhouse gas emissions of Marcellus shale gas. Environ. Res. Lett. 2011, 6, 034014. [Google Scholar] [CrossRef]
  71. Sparling, G.P. Ratio of microbial biomass carbon to soil organic carbon as a sensitive indicator of changes in soil organic matter. Soil Res. 1992, 30, 195–207. [Google Scholar] [CrossRef]
Figure 1. The experimental site, shaded with grey on the map, at Loskop in Estcourt, KwaZulu Natal Province, South Africa.
Agronomy 12 01725 g001
Figure 2. Total carbon variation with soil depths for three tillage techniques.
Agronomy 12 01725 g002
Figure 3. Organic carbon with depths and urea fertilizer application (kg N ha−1) for three tillage techniques.
Agronomy 12 01725 g003
Figure 4. Particulate organic carbon with soil depths and fertilizer application (kg N ha−1) for three tillage techniques.
Agronomy 12 01725 g004
Figure 5. Permanganate oxidizable C with soil depths and urea fertilizer application (kg N/ha) for three tillage techniques.
Agronomy 12 01725 g005
Figure 6. Microbial biomass C with soil depths and urea application (kg N ha−1) for three tillage techniques.
Agronomy 12 01725 g006
Figure 7. Variation of the microbial quotient of different soil depths.
Agronomy 12 01725 g007
Publisher’s Note: MDPI stays neutral with regard to jurisdictional claims in published maps and institutional affiliations.

