
Research on the Hydrological Variation Law of the Dawen River, a Tributary of the Lower Yellow River

Abstract
:1. Introduction
2. Material and Methods
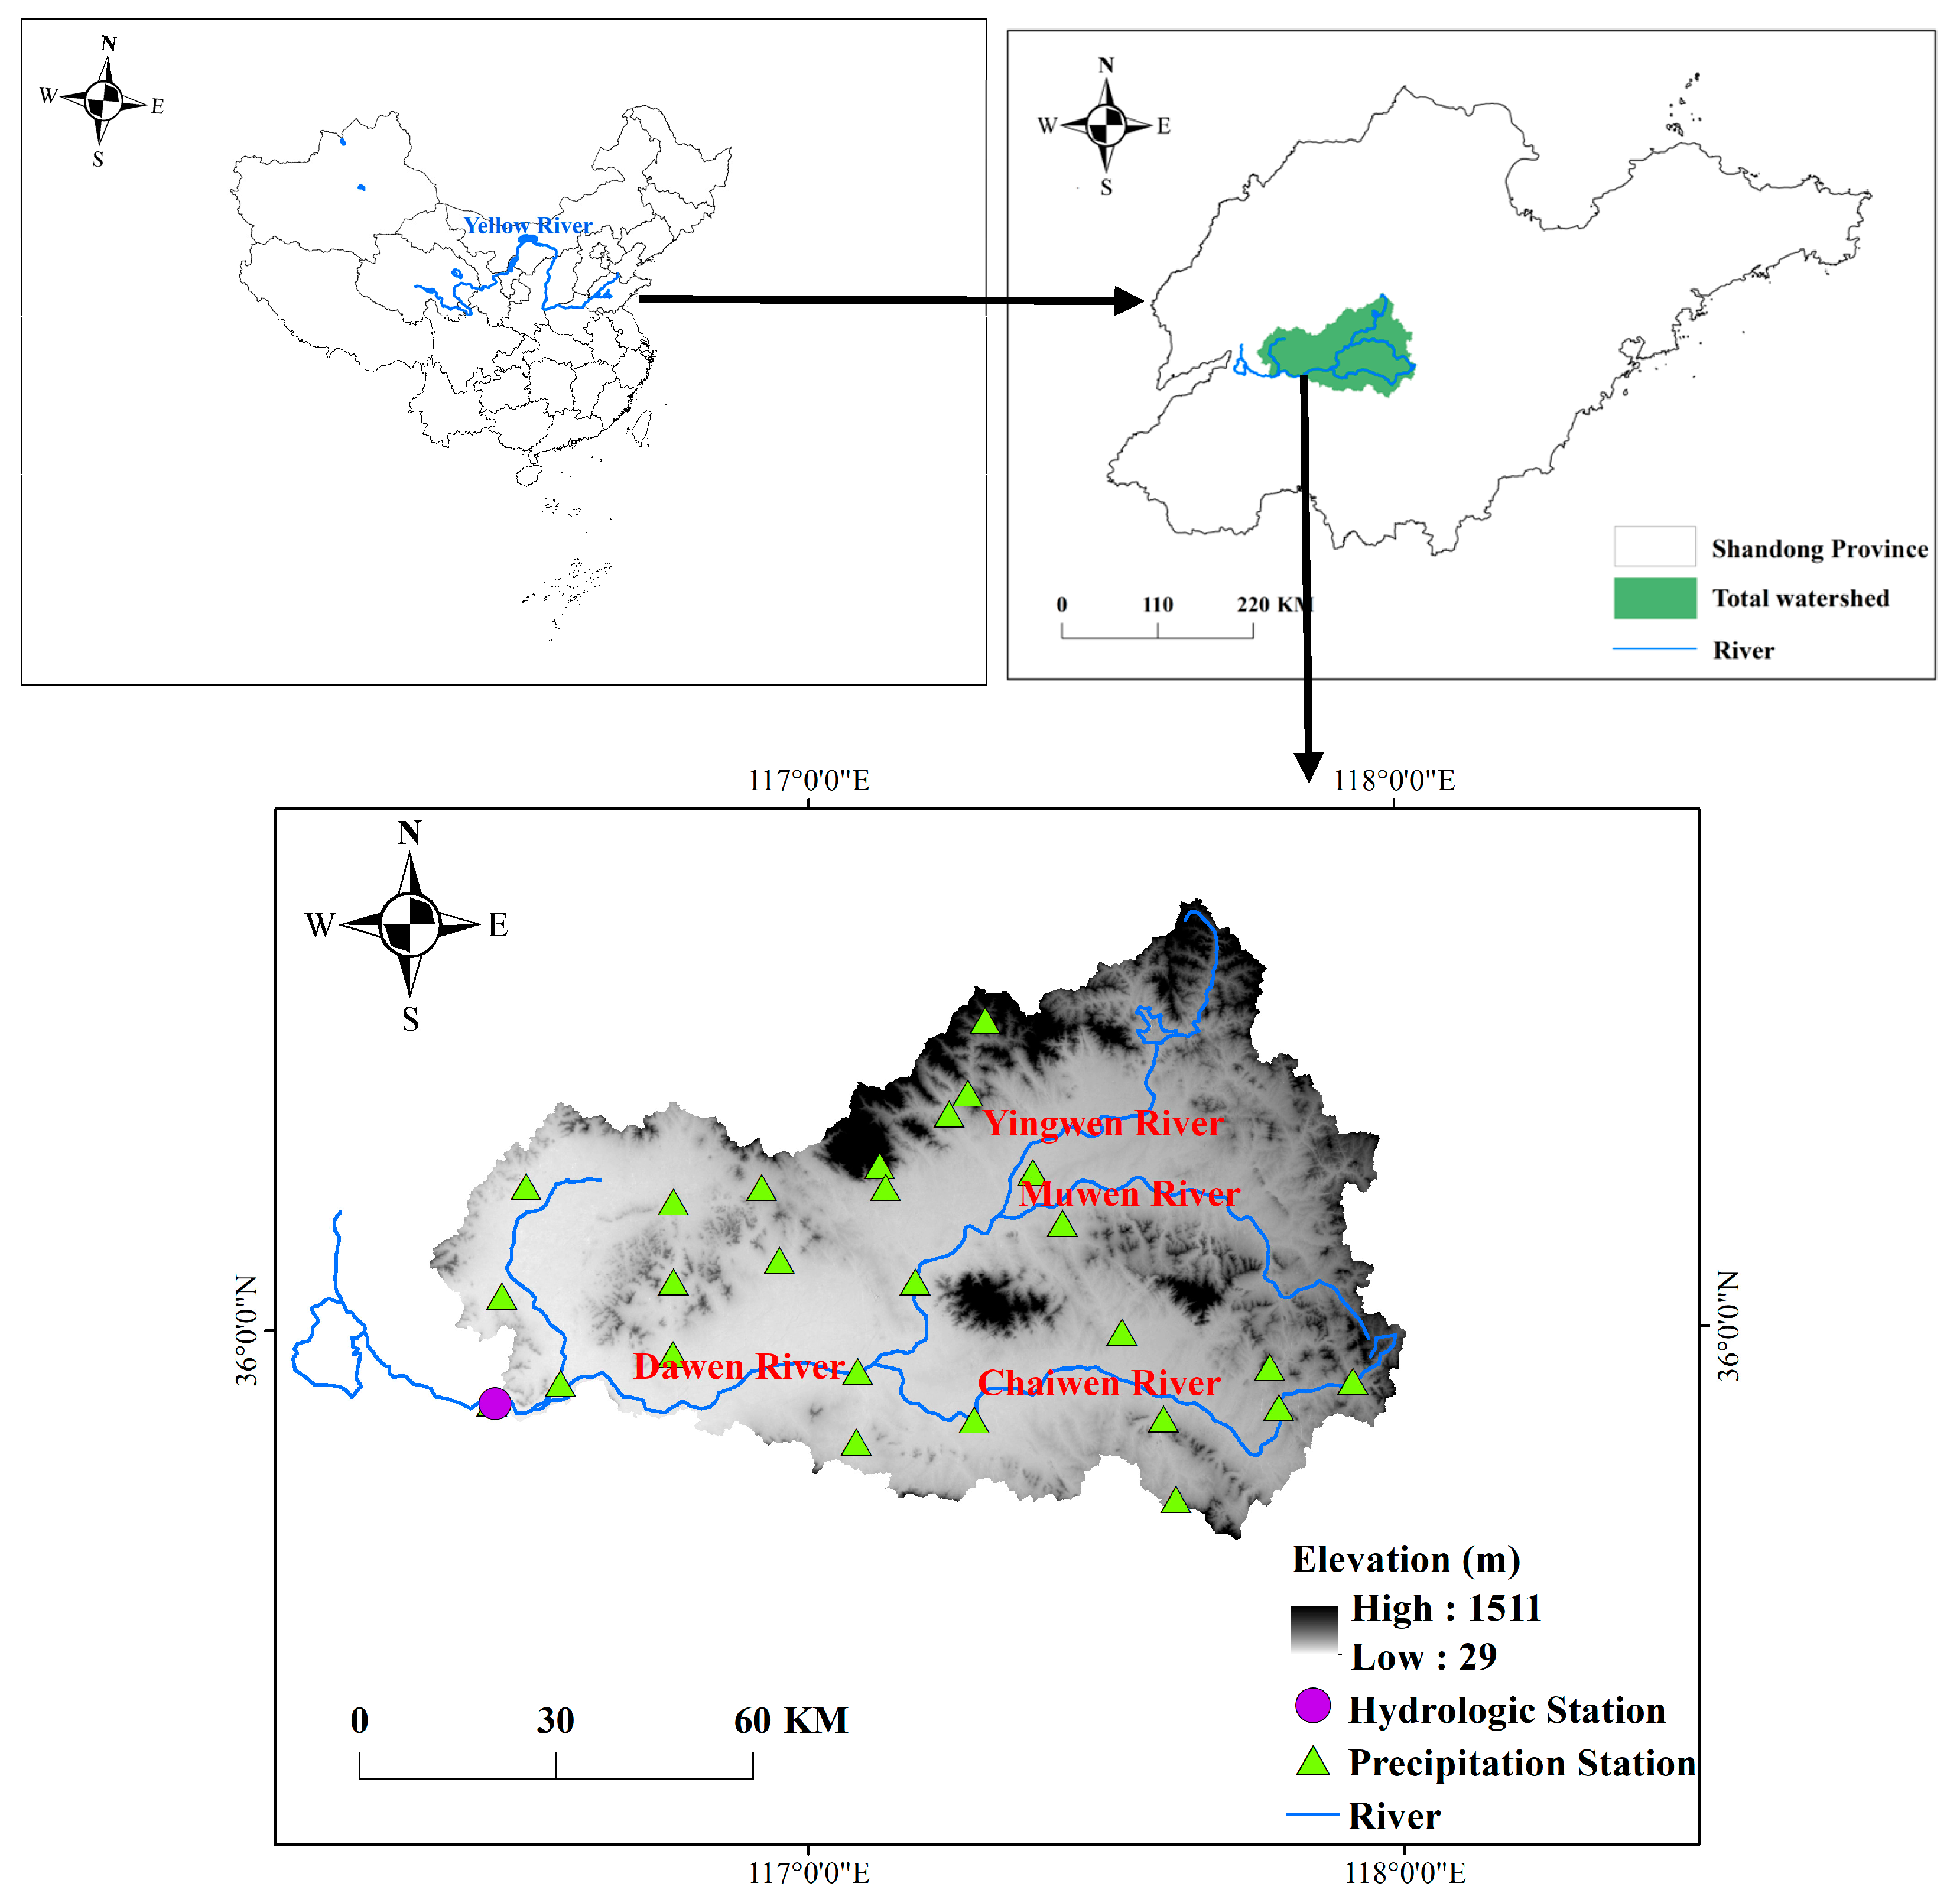
2.1. Study Area
2.2. Data Sources
2.3. Hydrological Statistical Analysis Methods
- (1)
- Mann–Kendall text
- (2)
- Cumulative anomaly method
- (3)
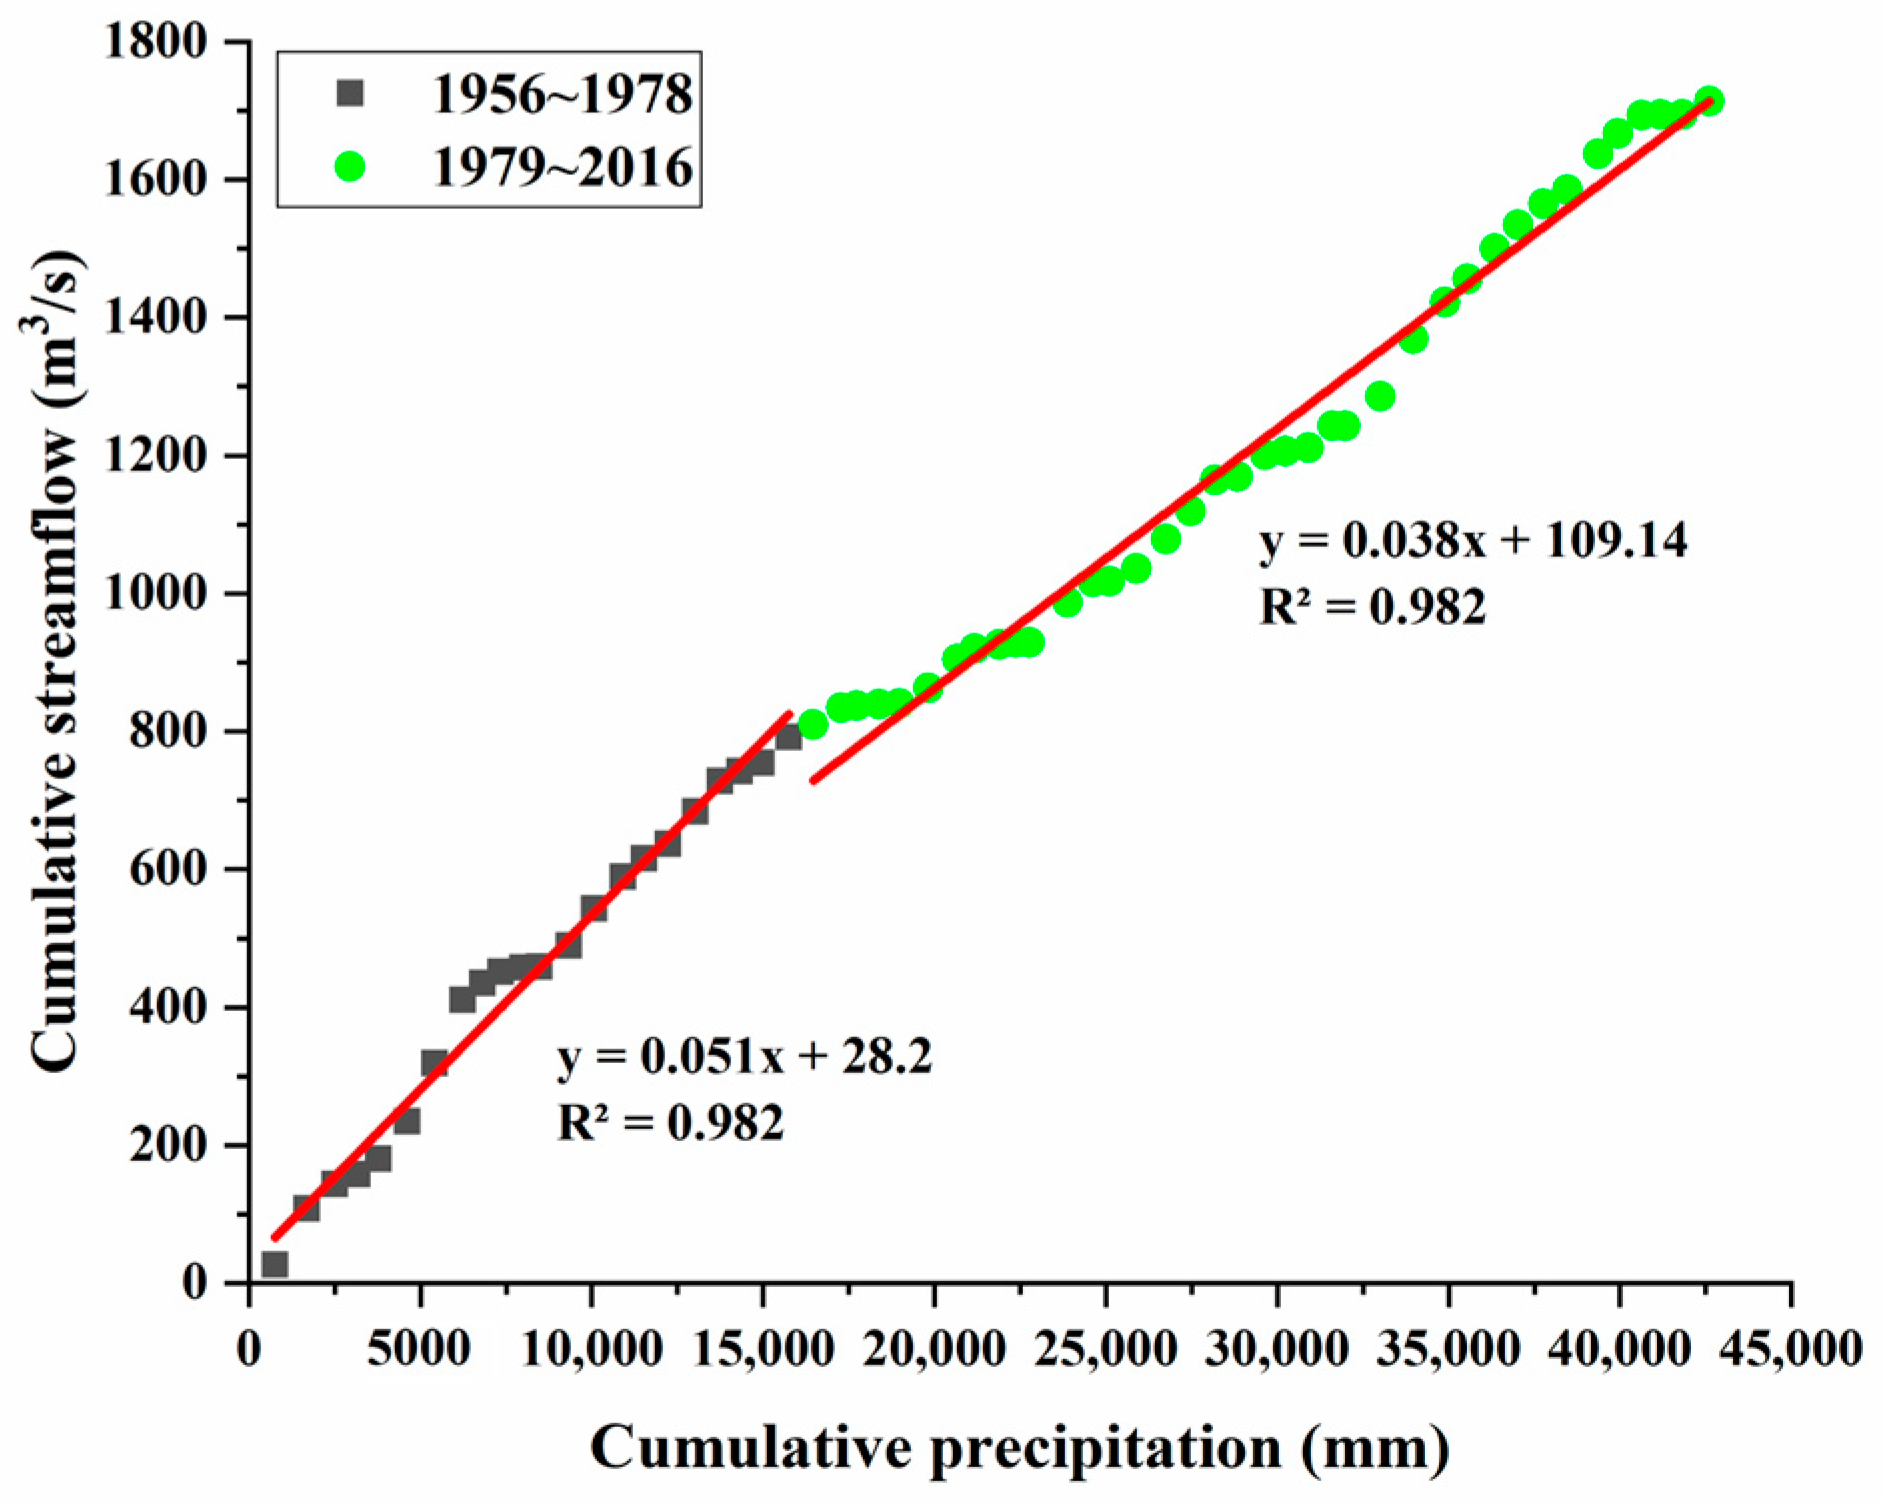
- Rainfall–runoff double-cumulative curve
2.4. IHA/RVA
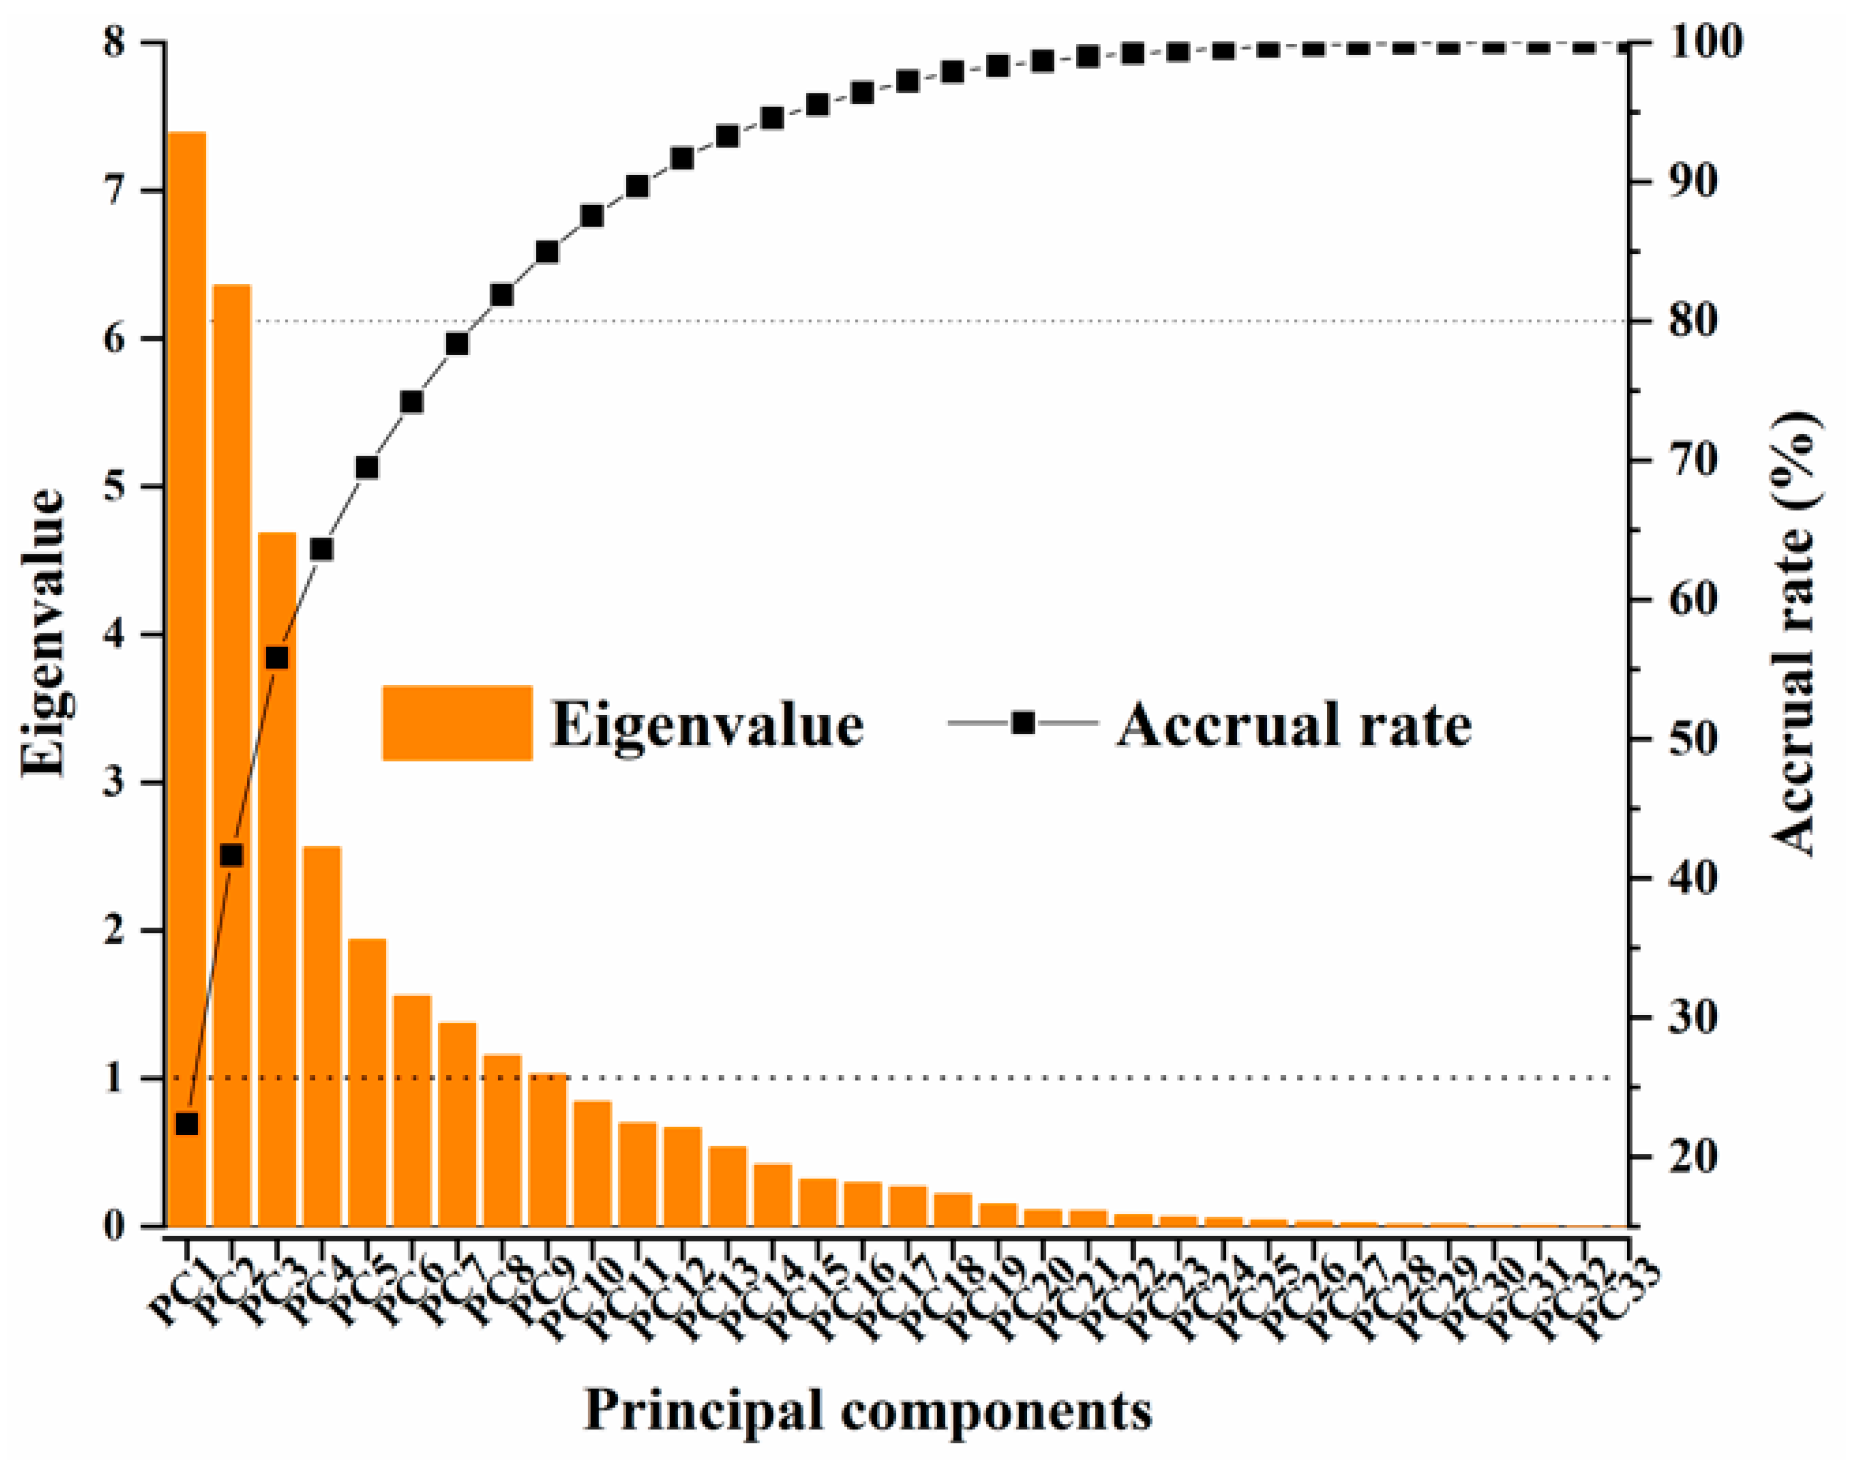
2.5. Principal Component Analysis (PCA)
3. Results
3.1. Evolution Characteristics of Hydrological Factors in Dawen River
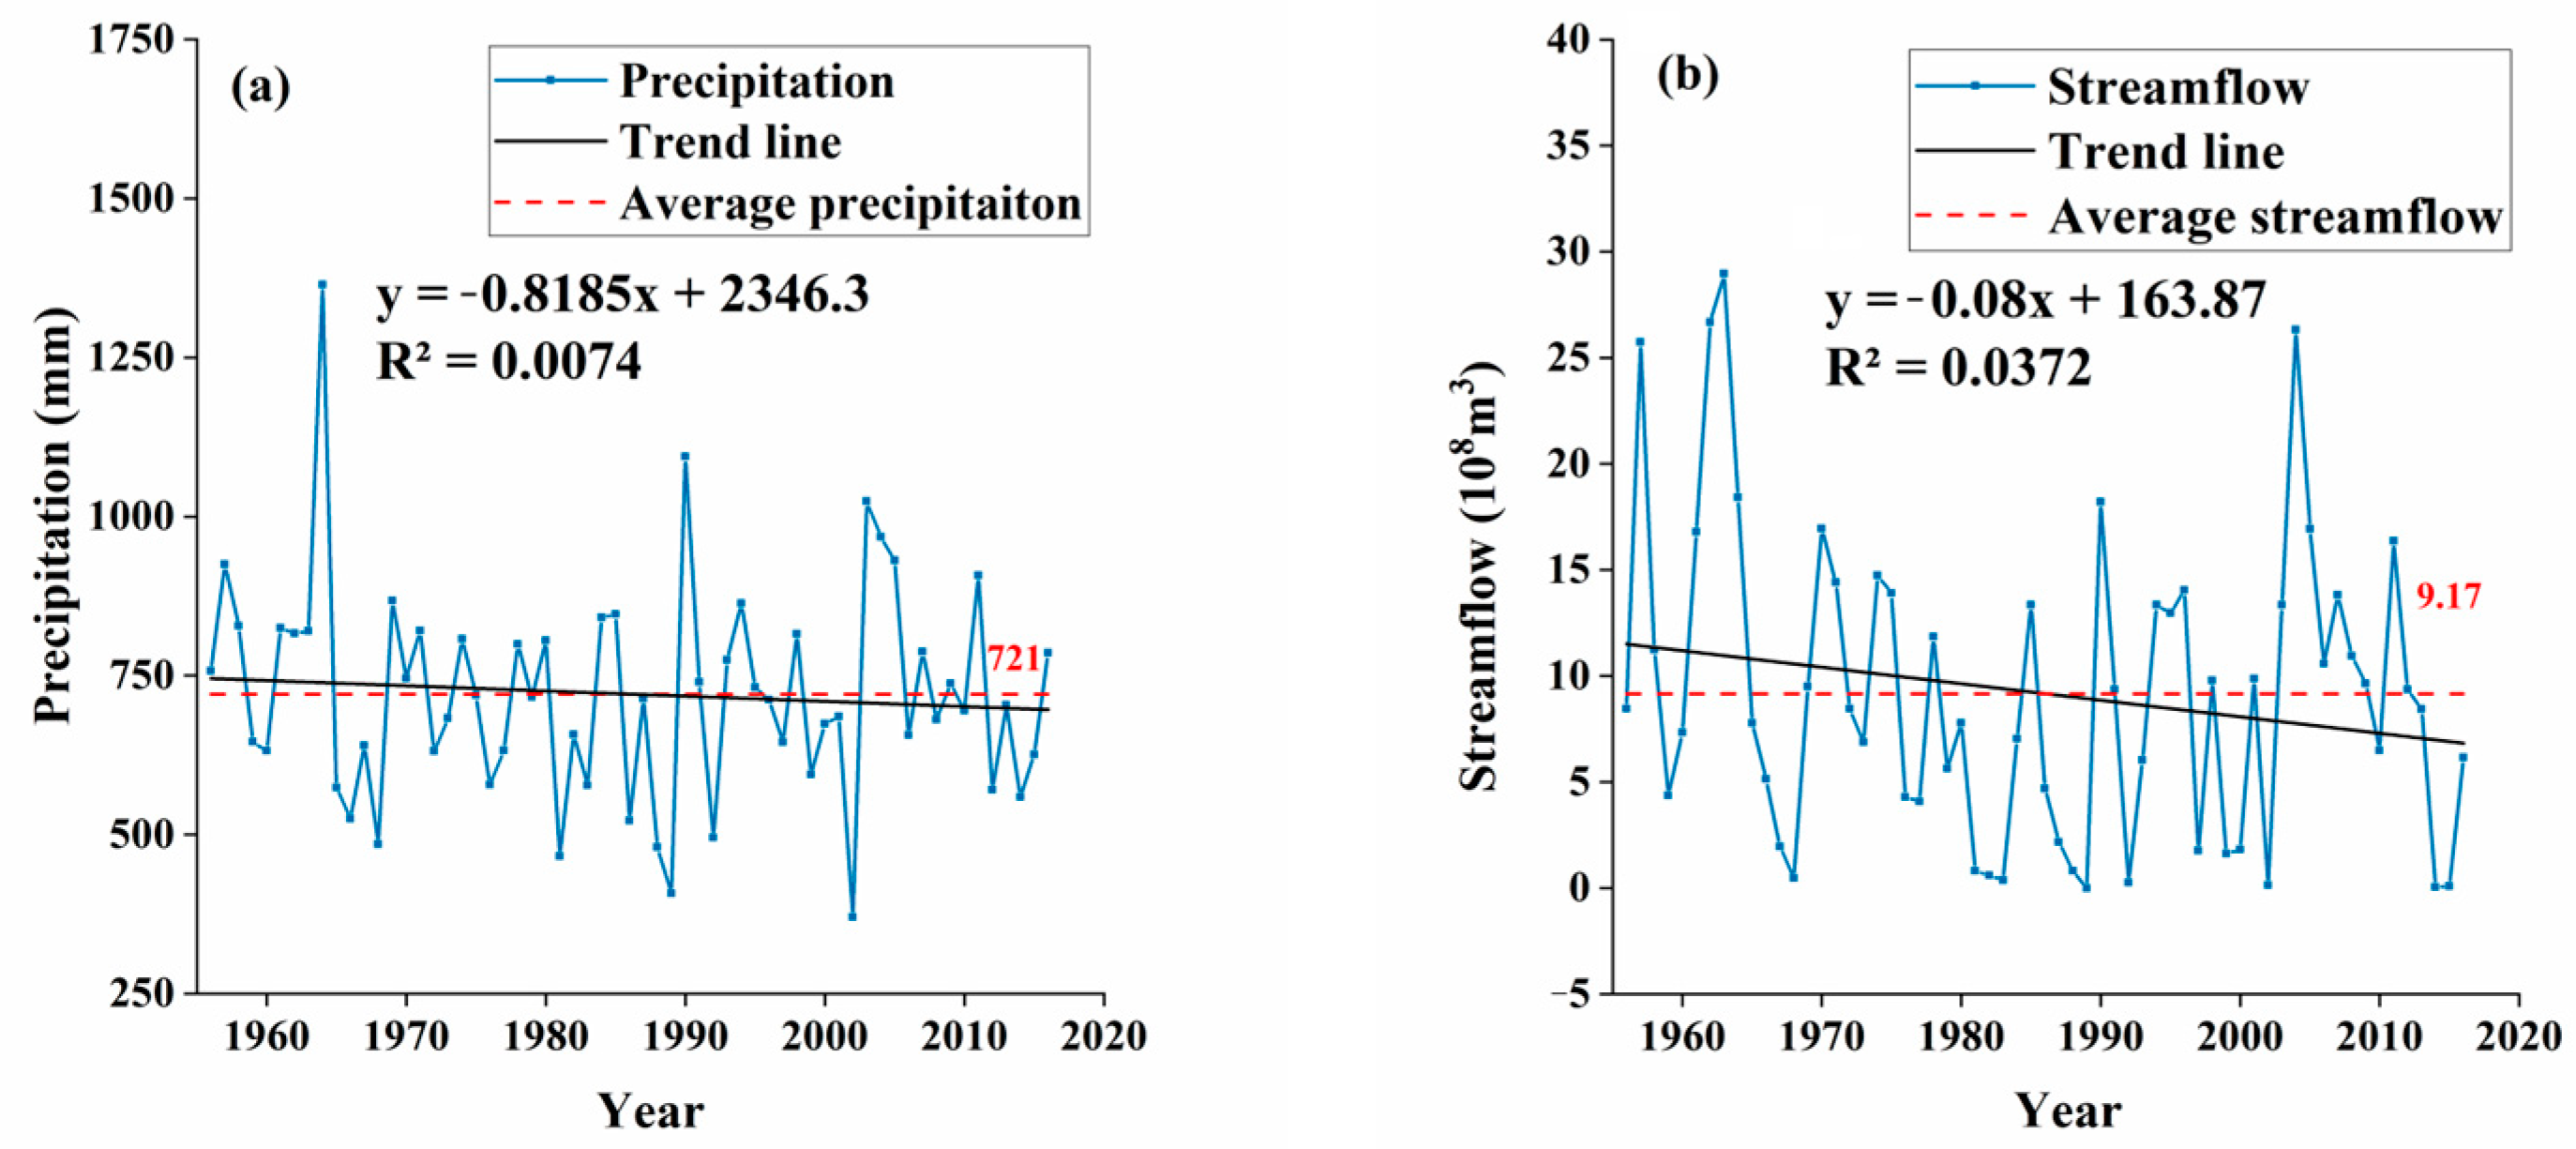
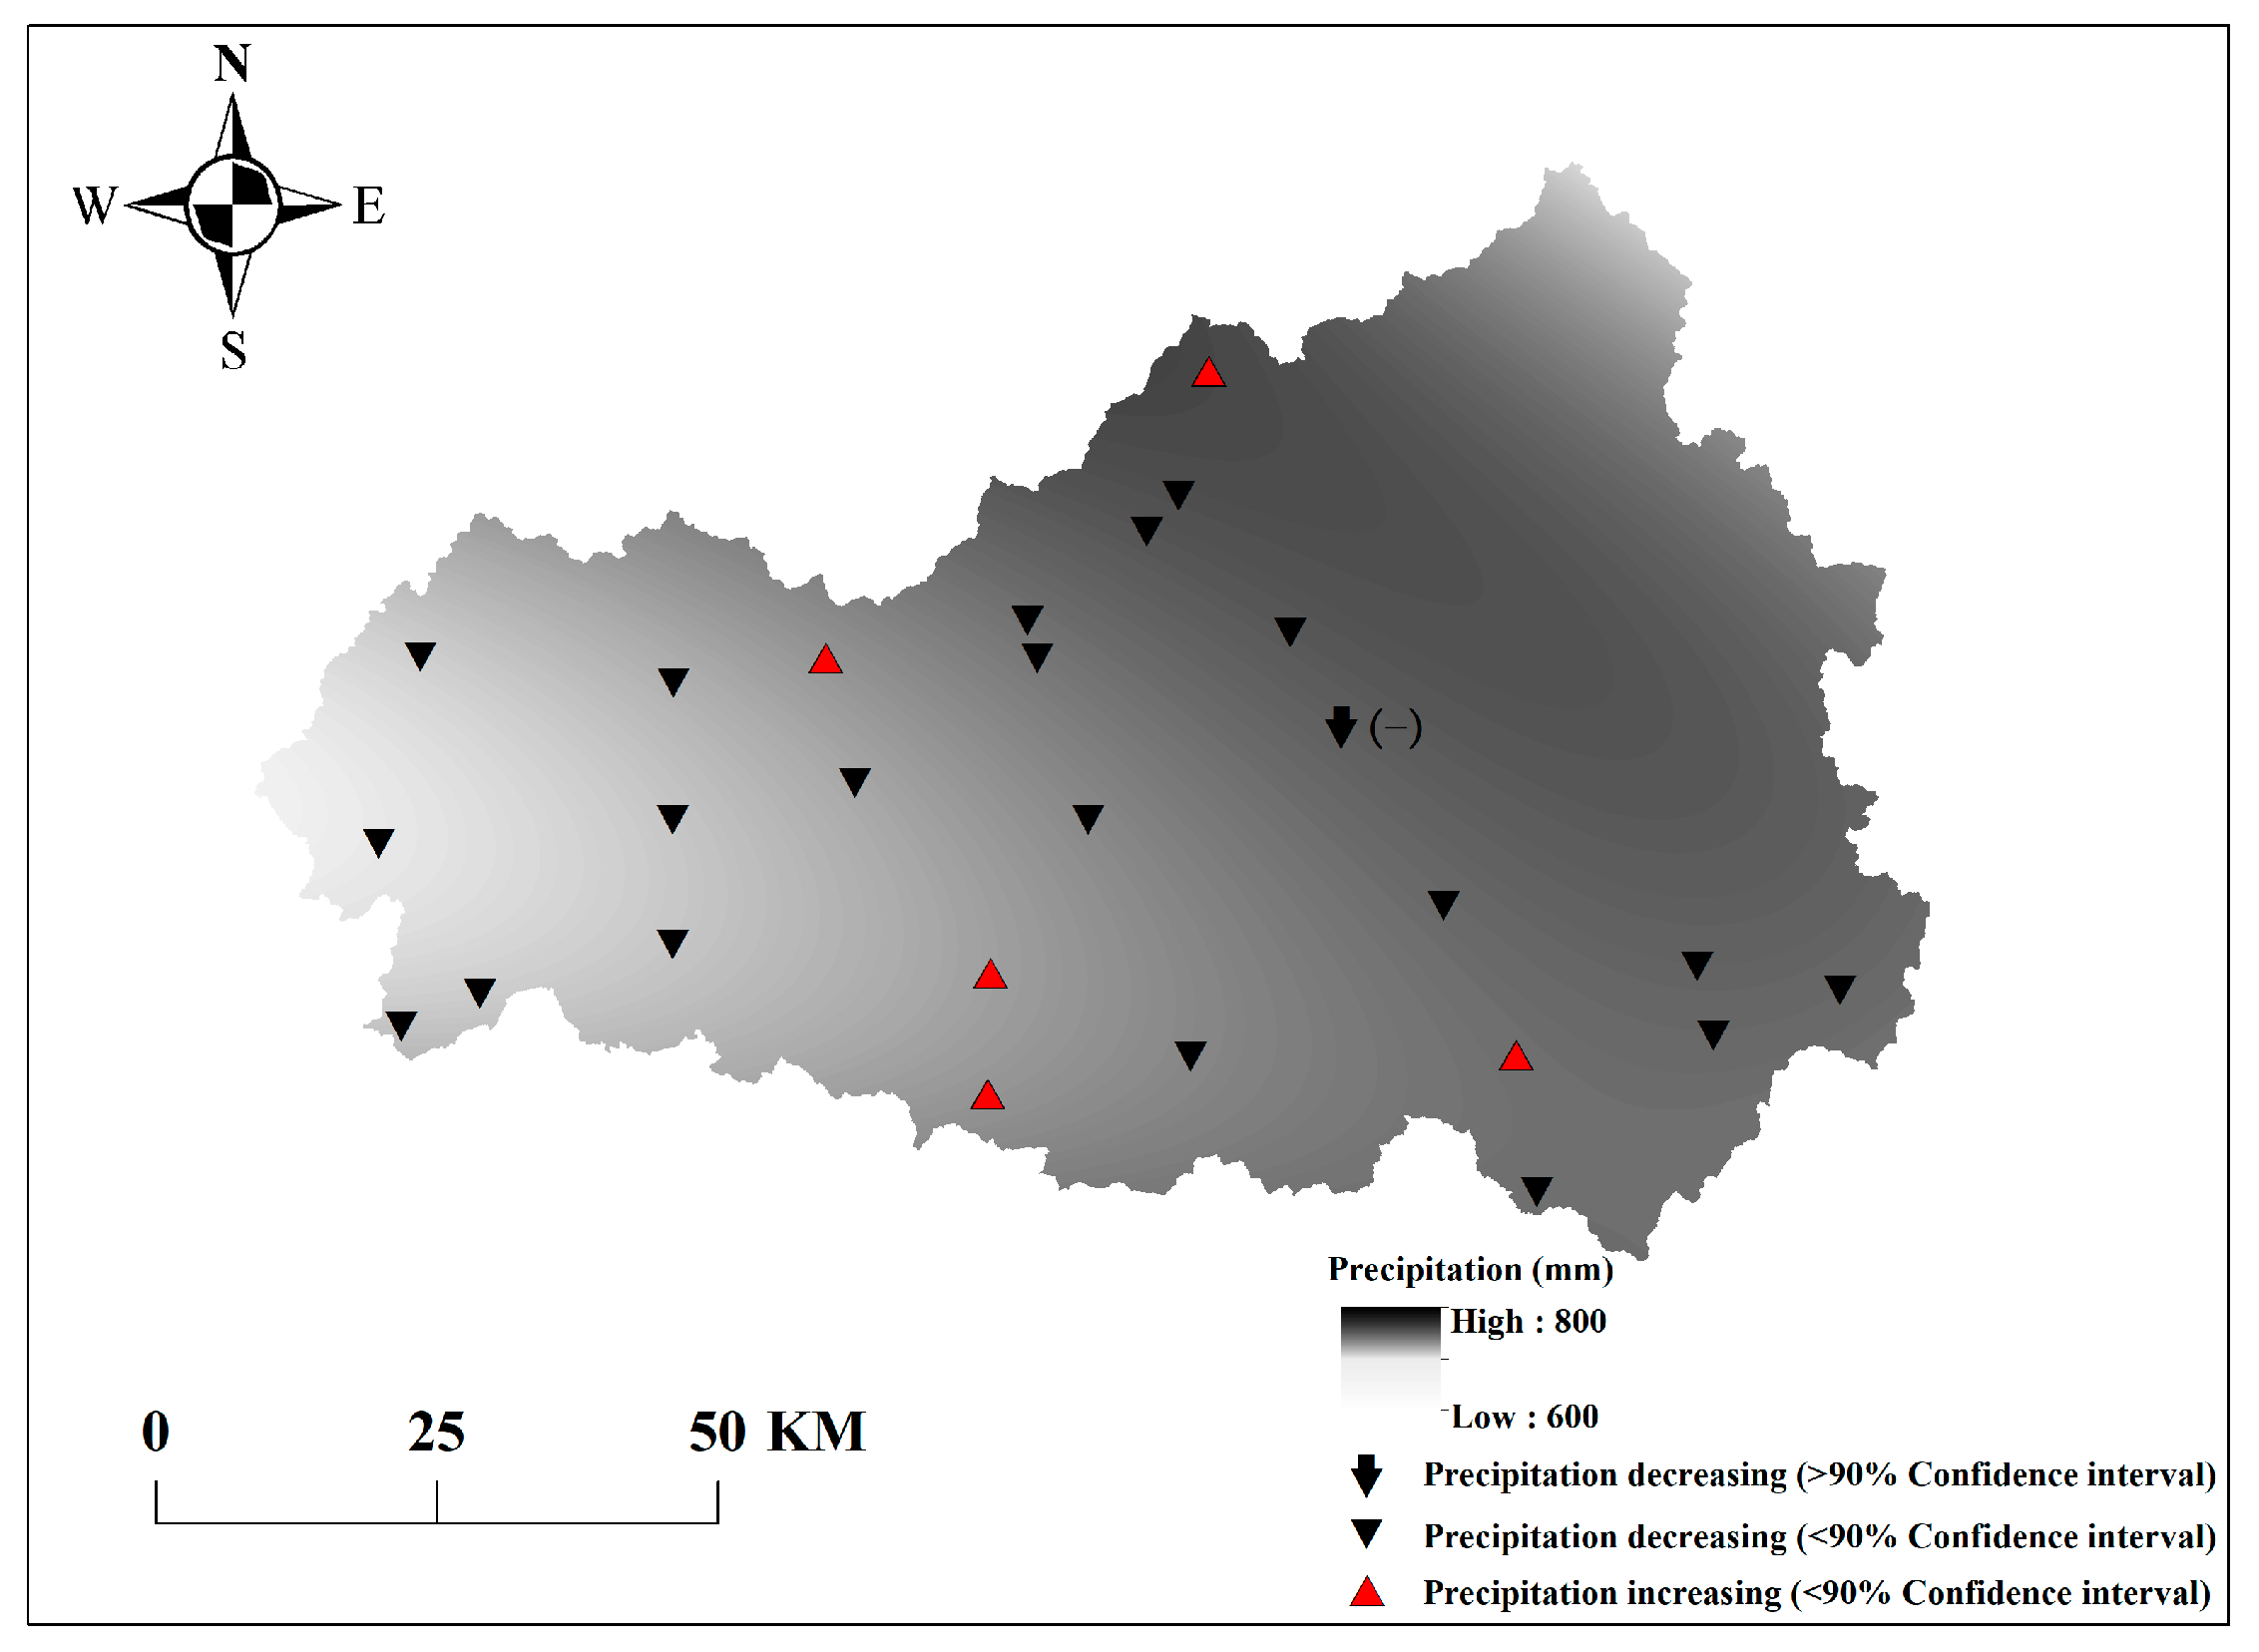
3.1.1. Trend Analysis
3.1.2. Analysis of Mutation
3.2. The Law of Hydrological Variation of Dawen River
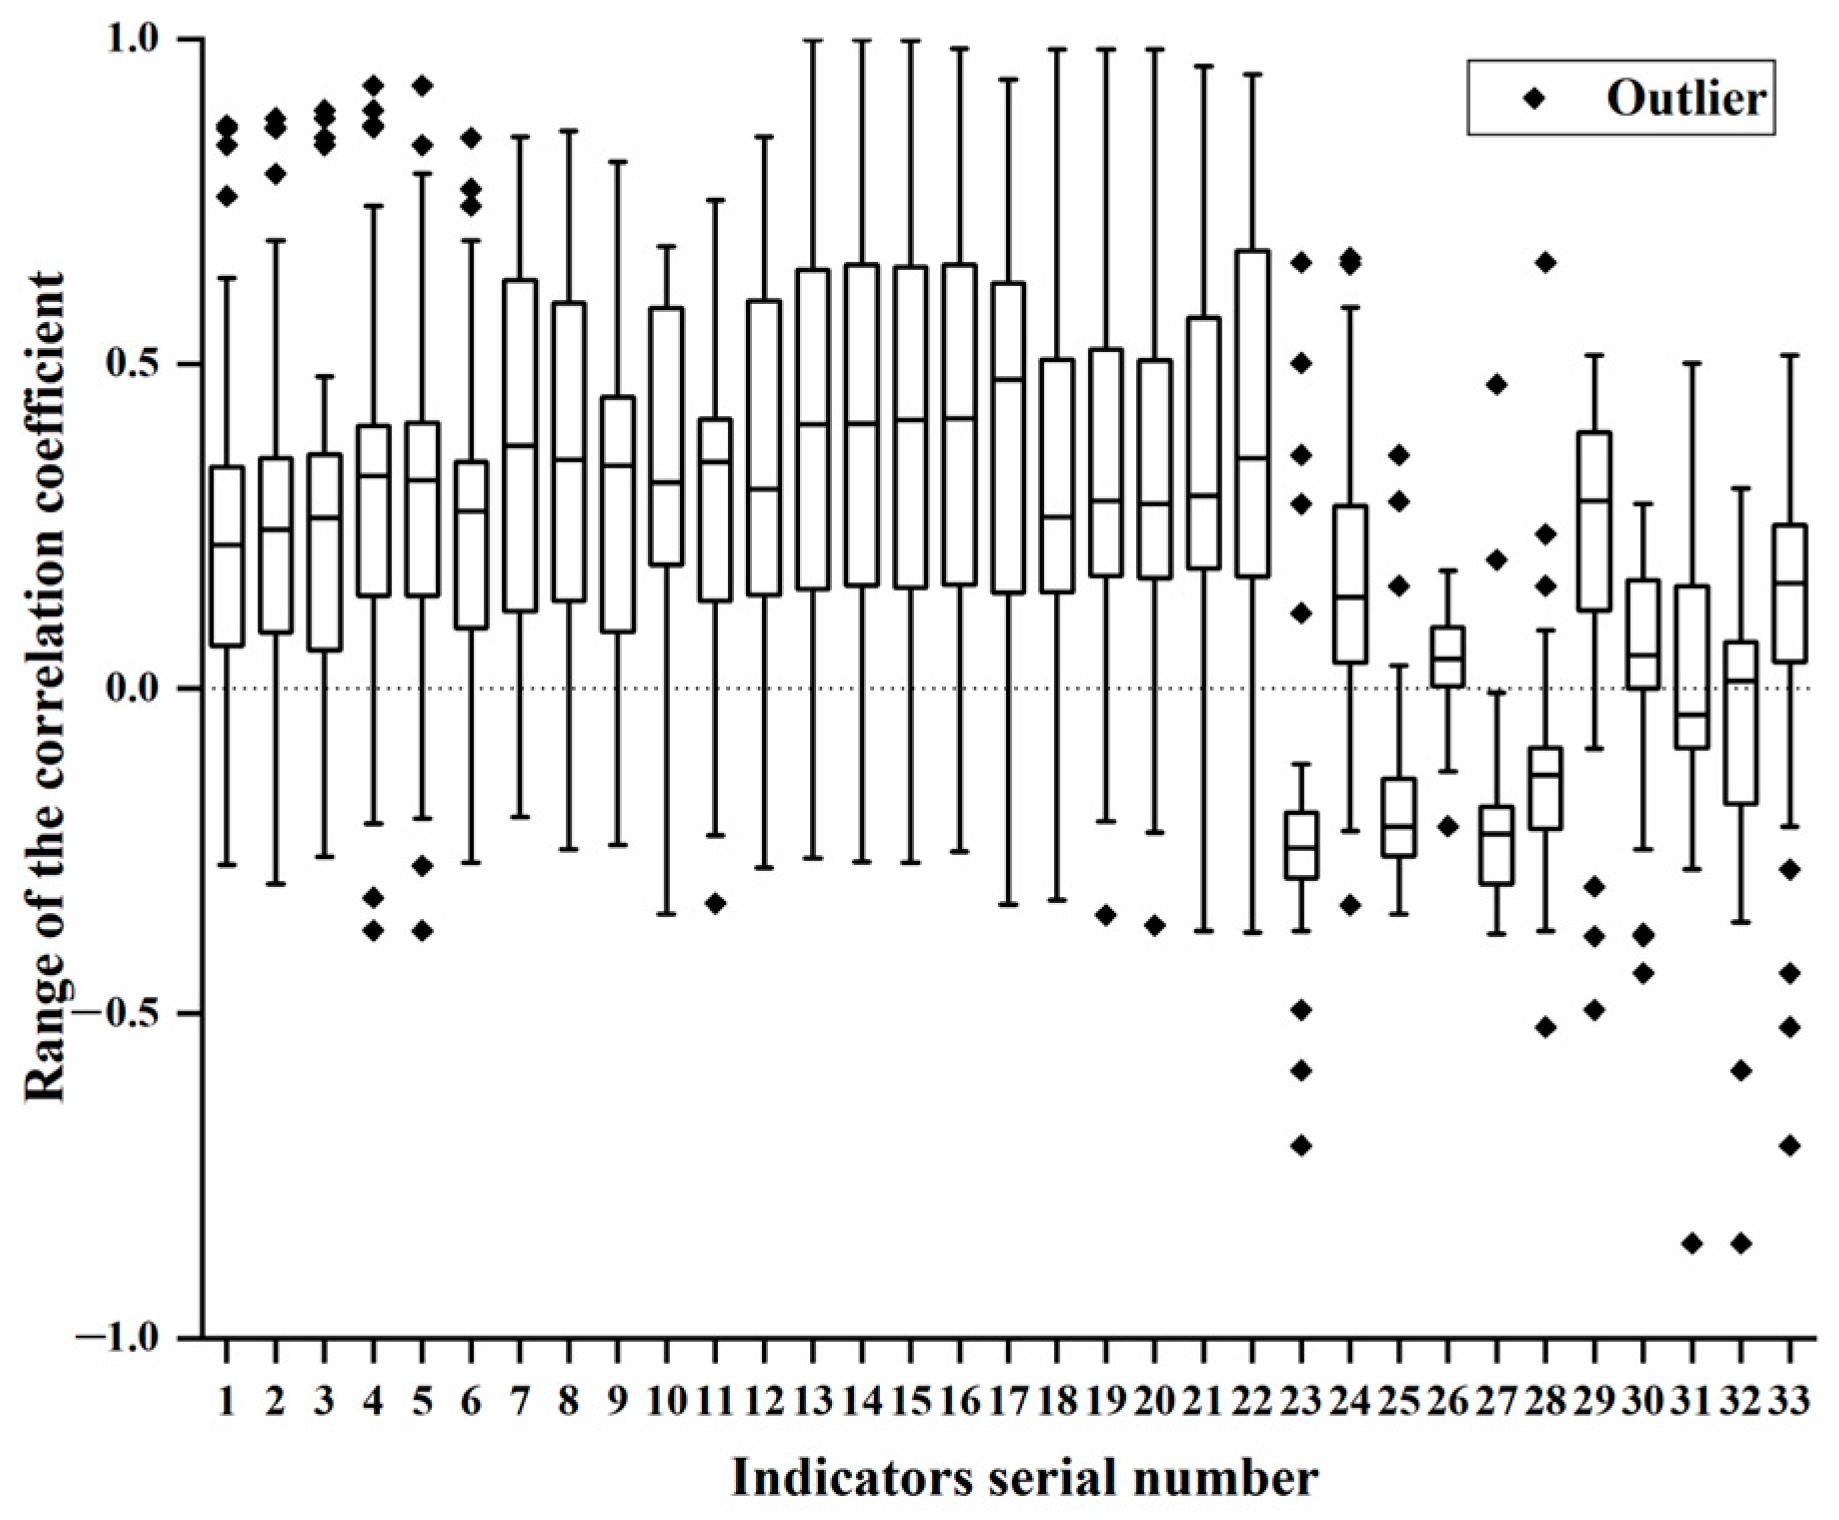
3.2.1. Degree of Hydrological Change of Dawen River
- (1)
- Hydrological indicator selection
- (2)
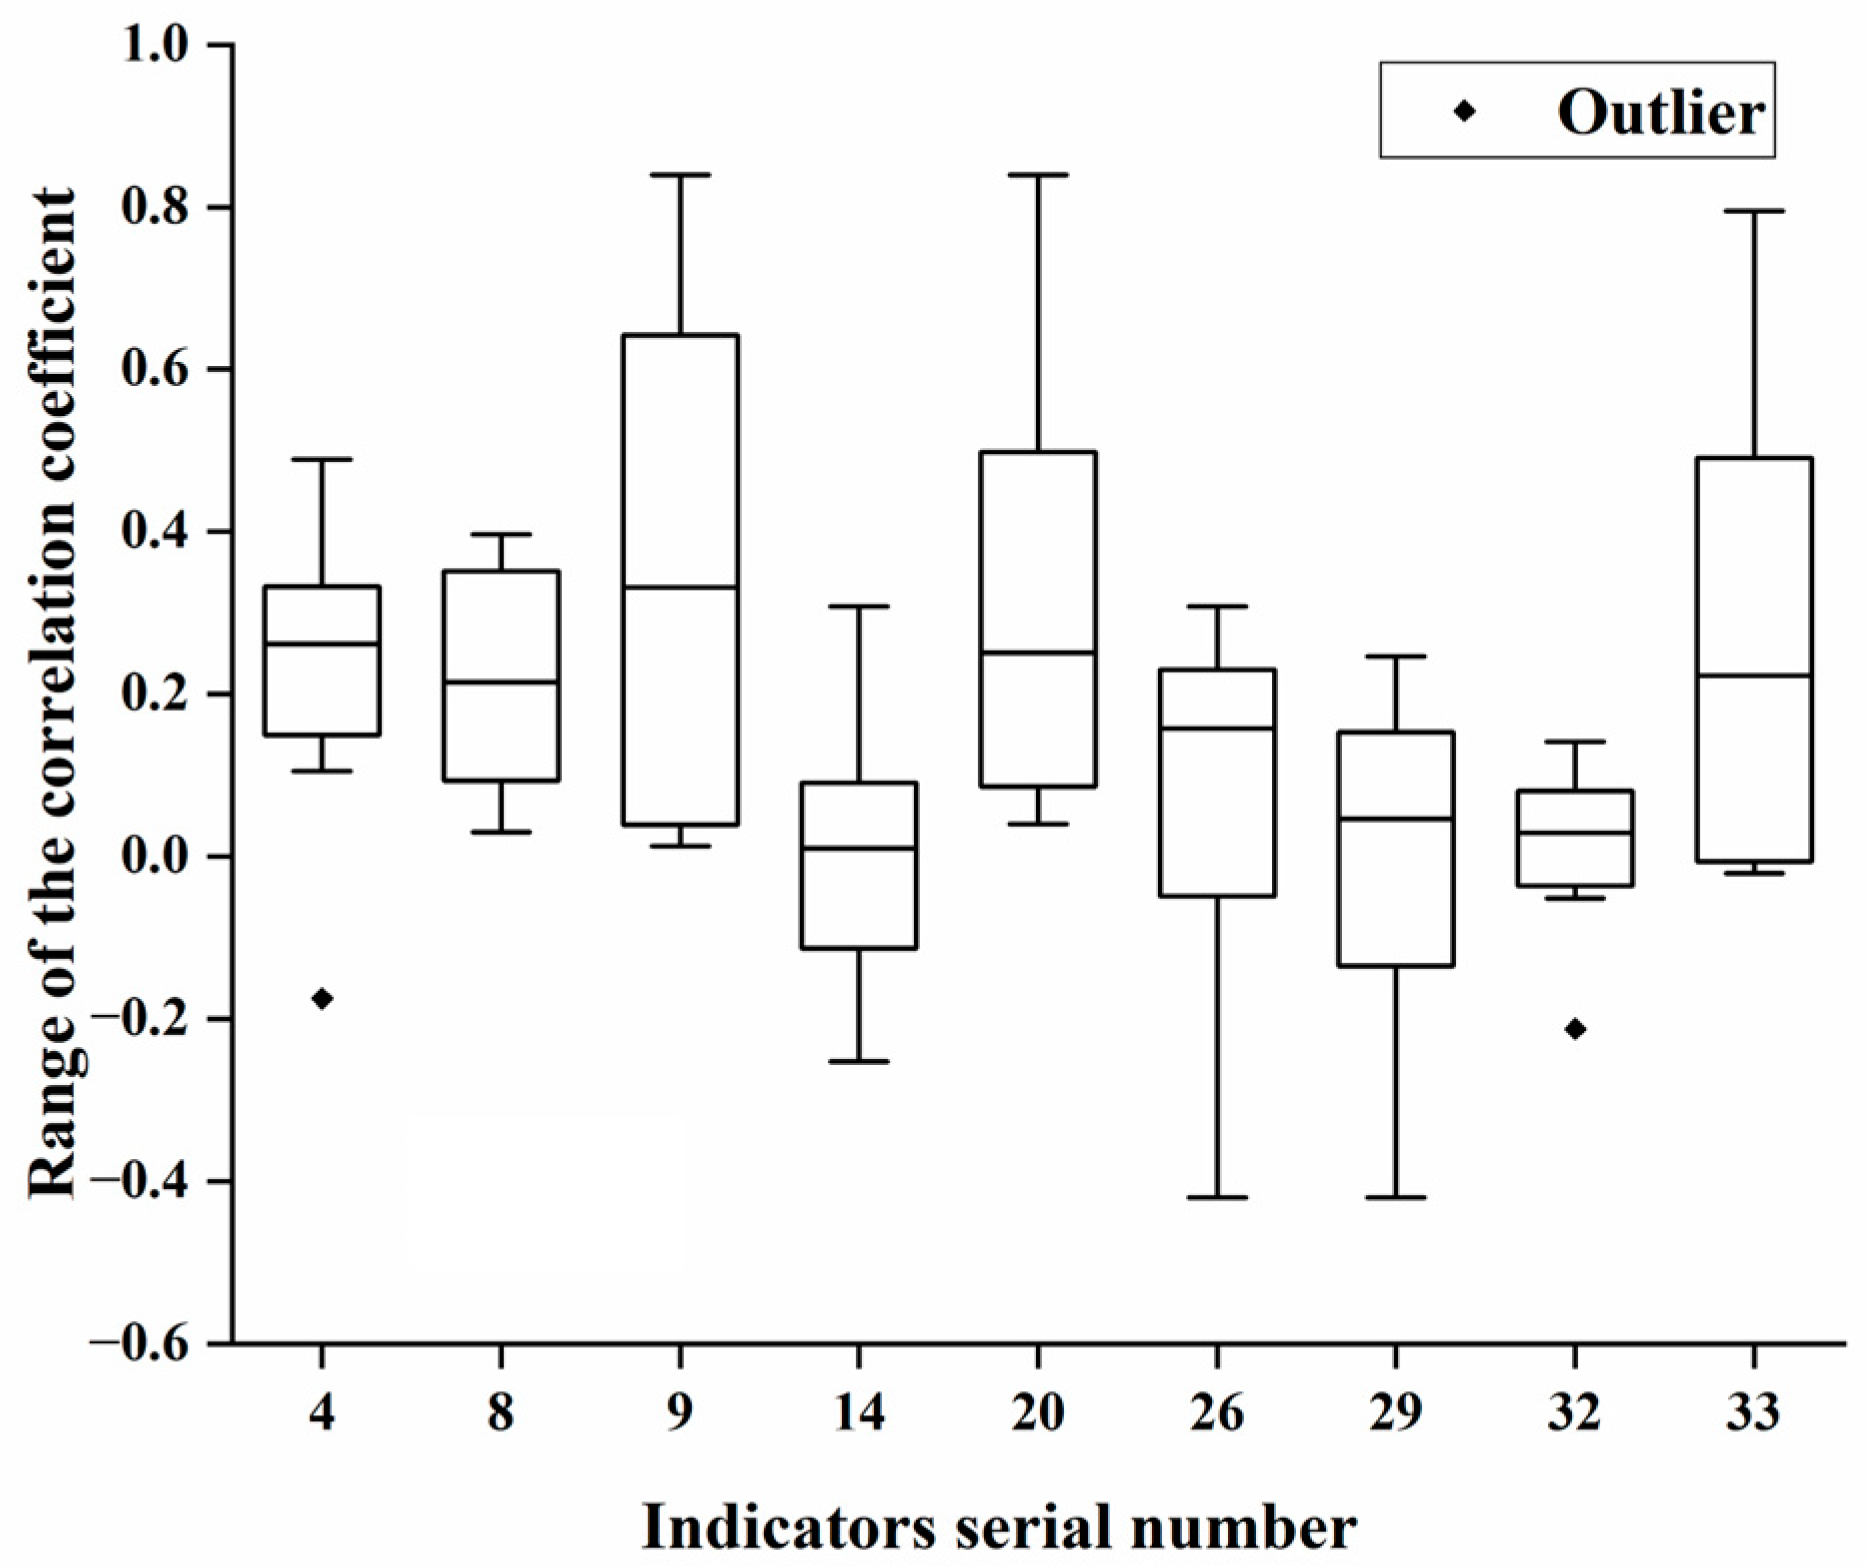
- Rationality analysis of preferred indicator
3.2.2. Analysis of Hydrological Regime Change
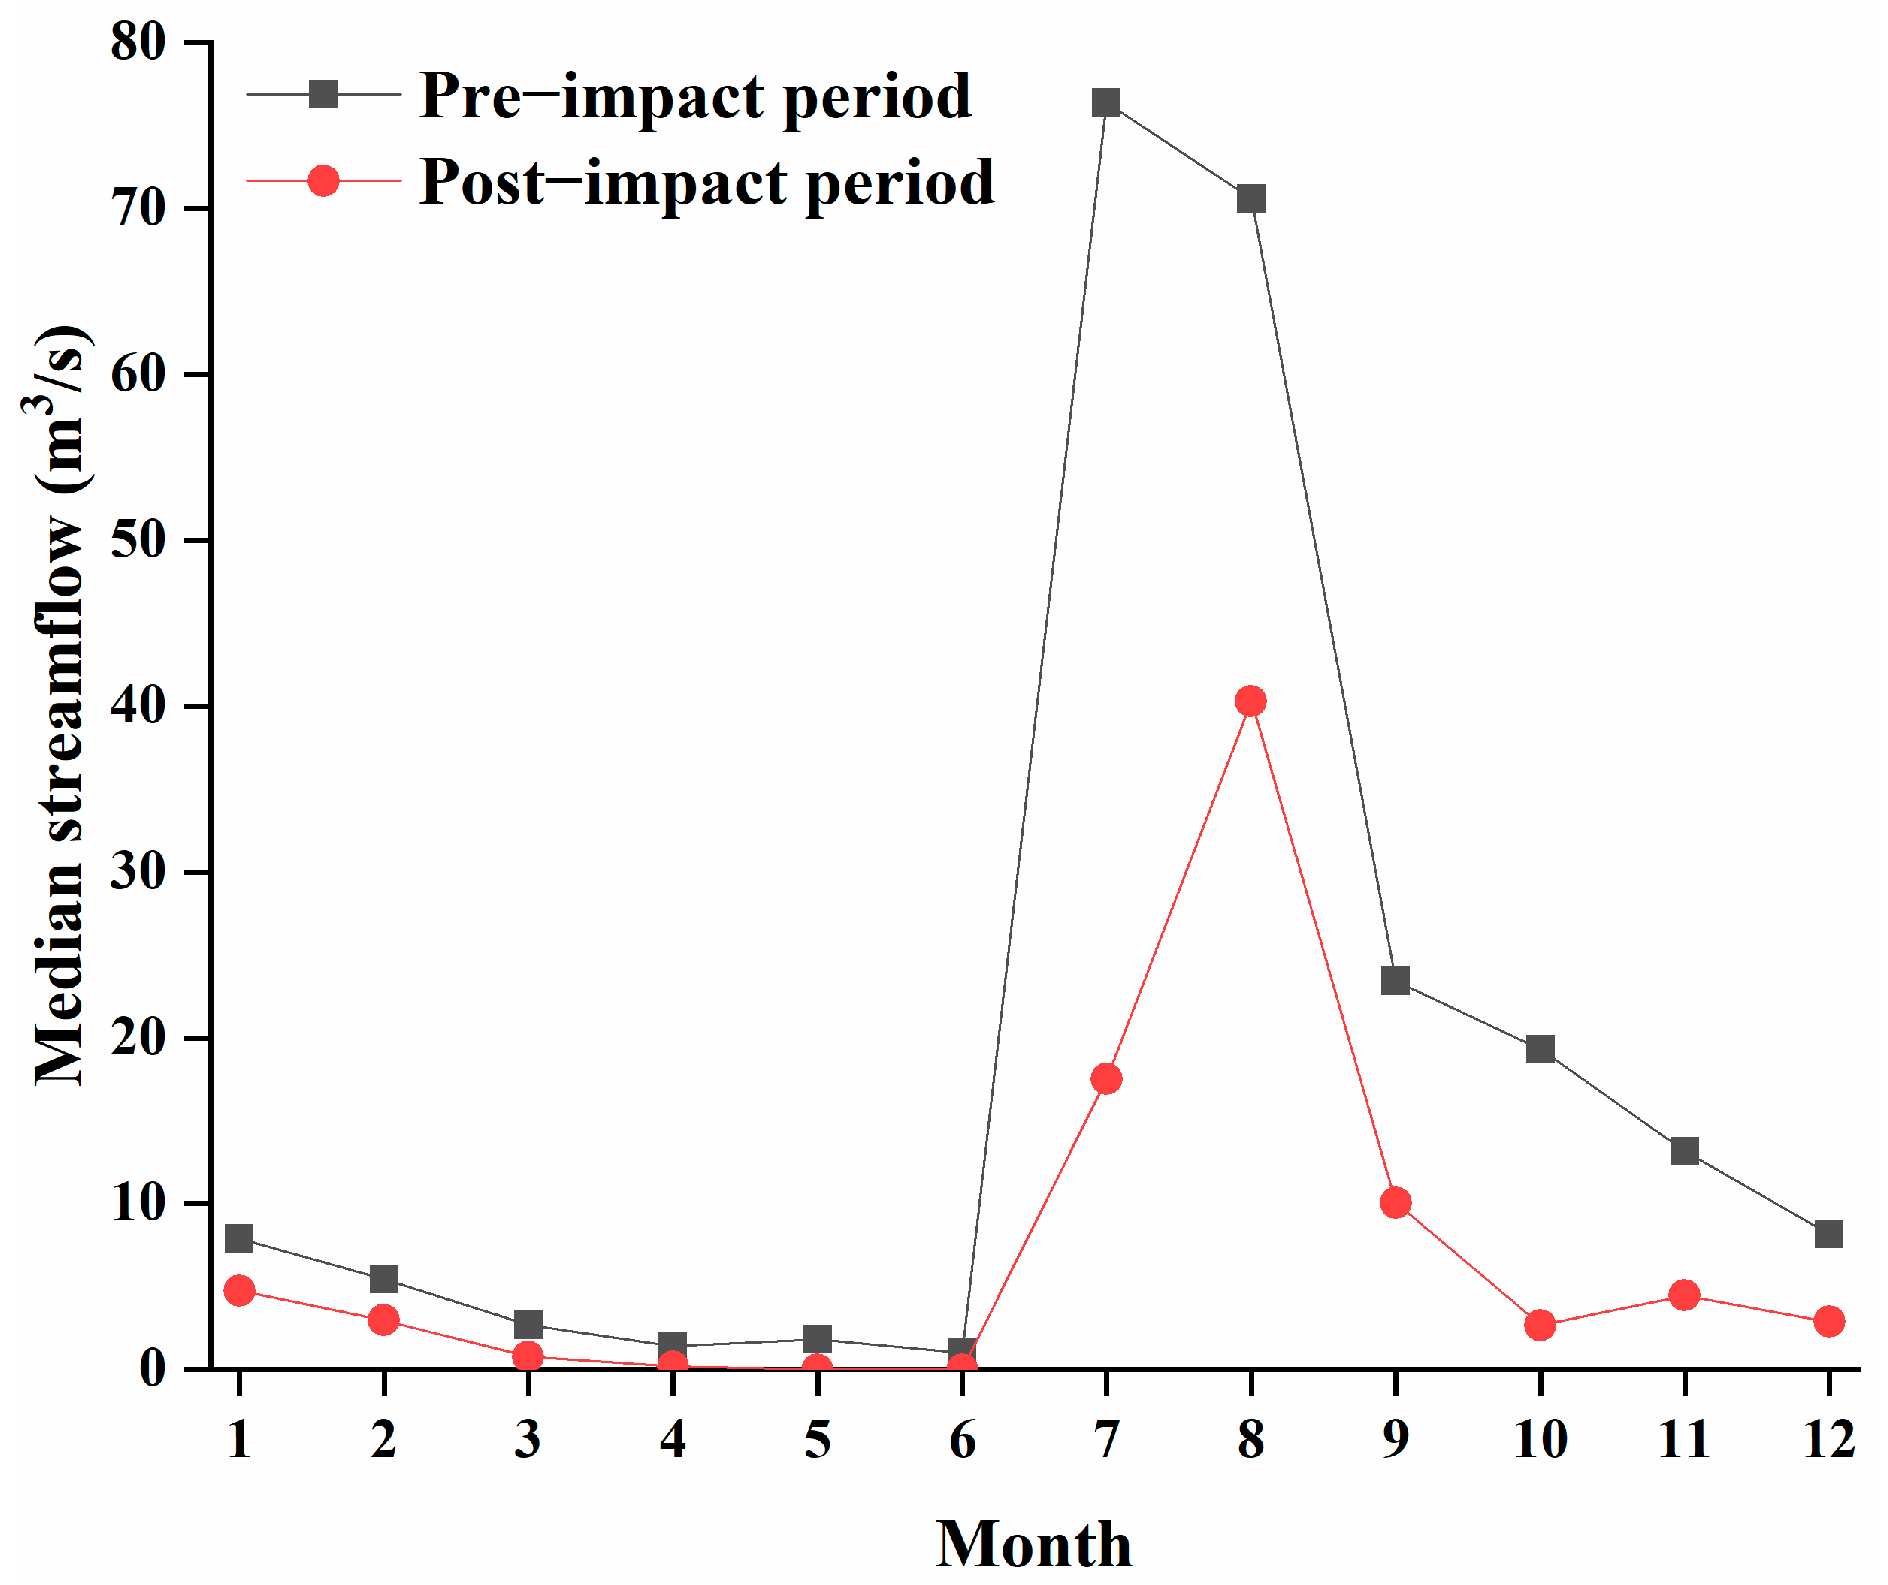
- (1)
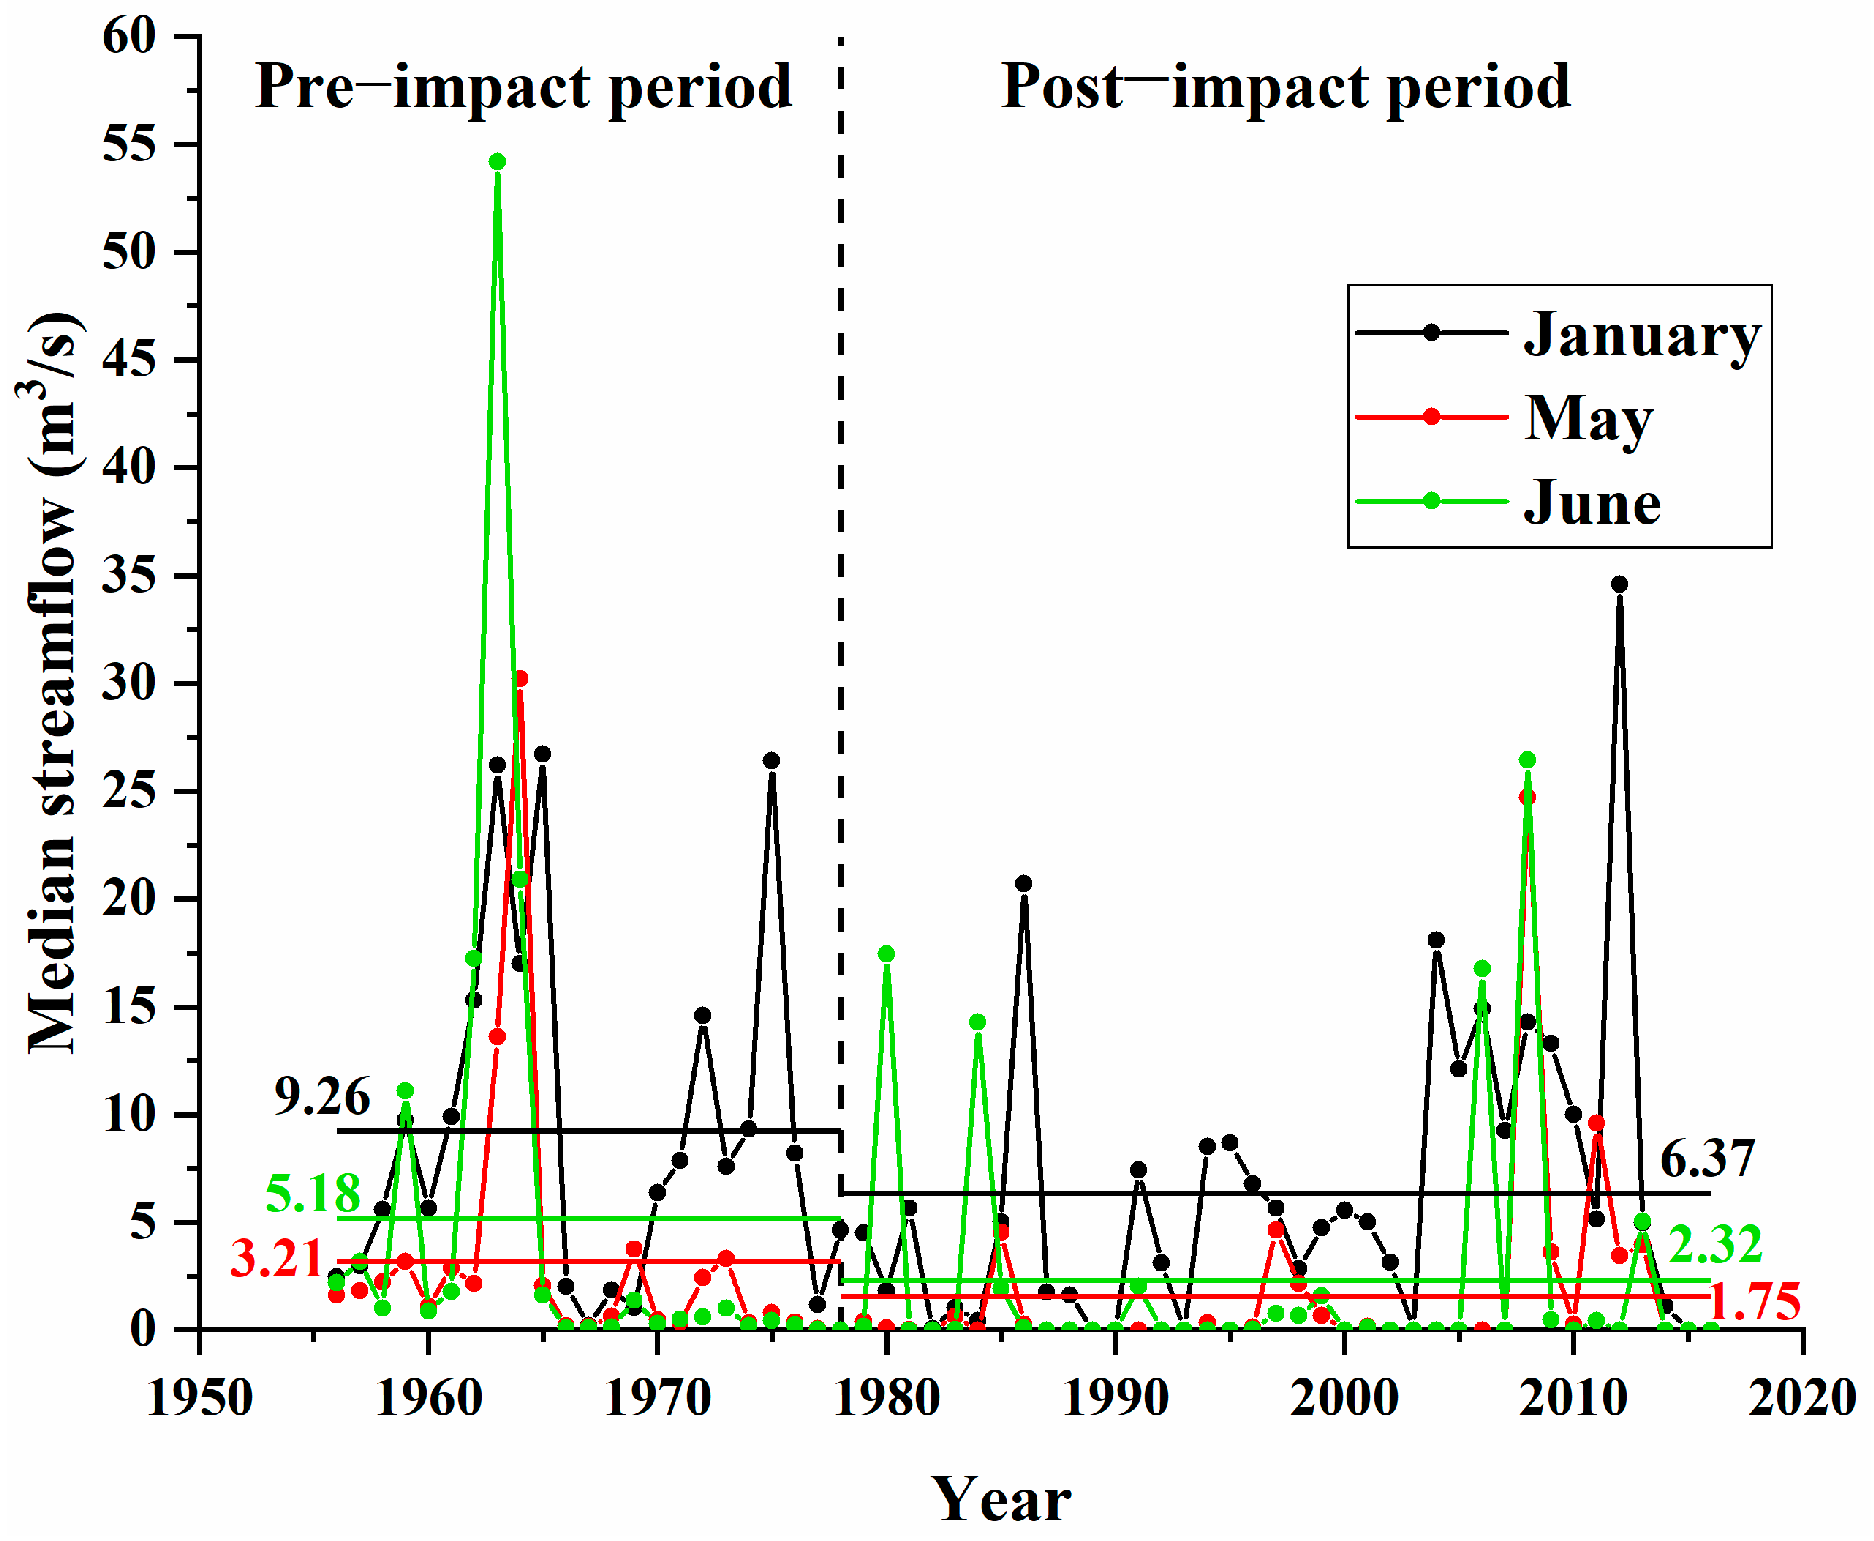
- Magnitude of monthly water conditions (Group 1)
- (2)
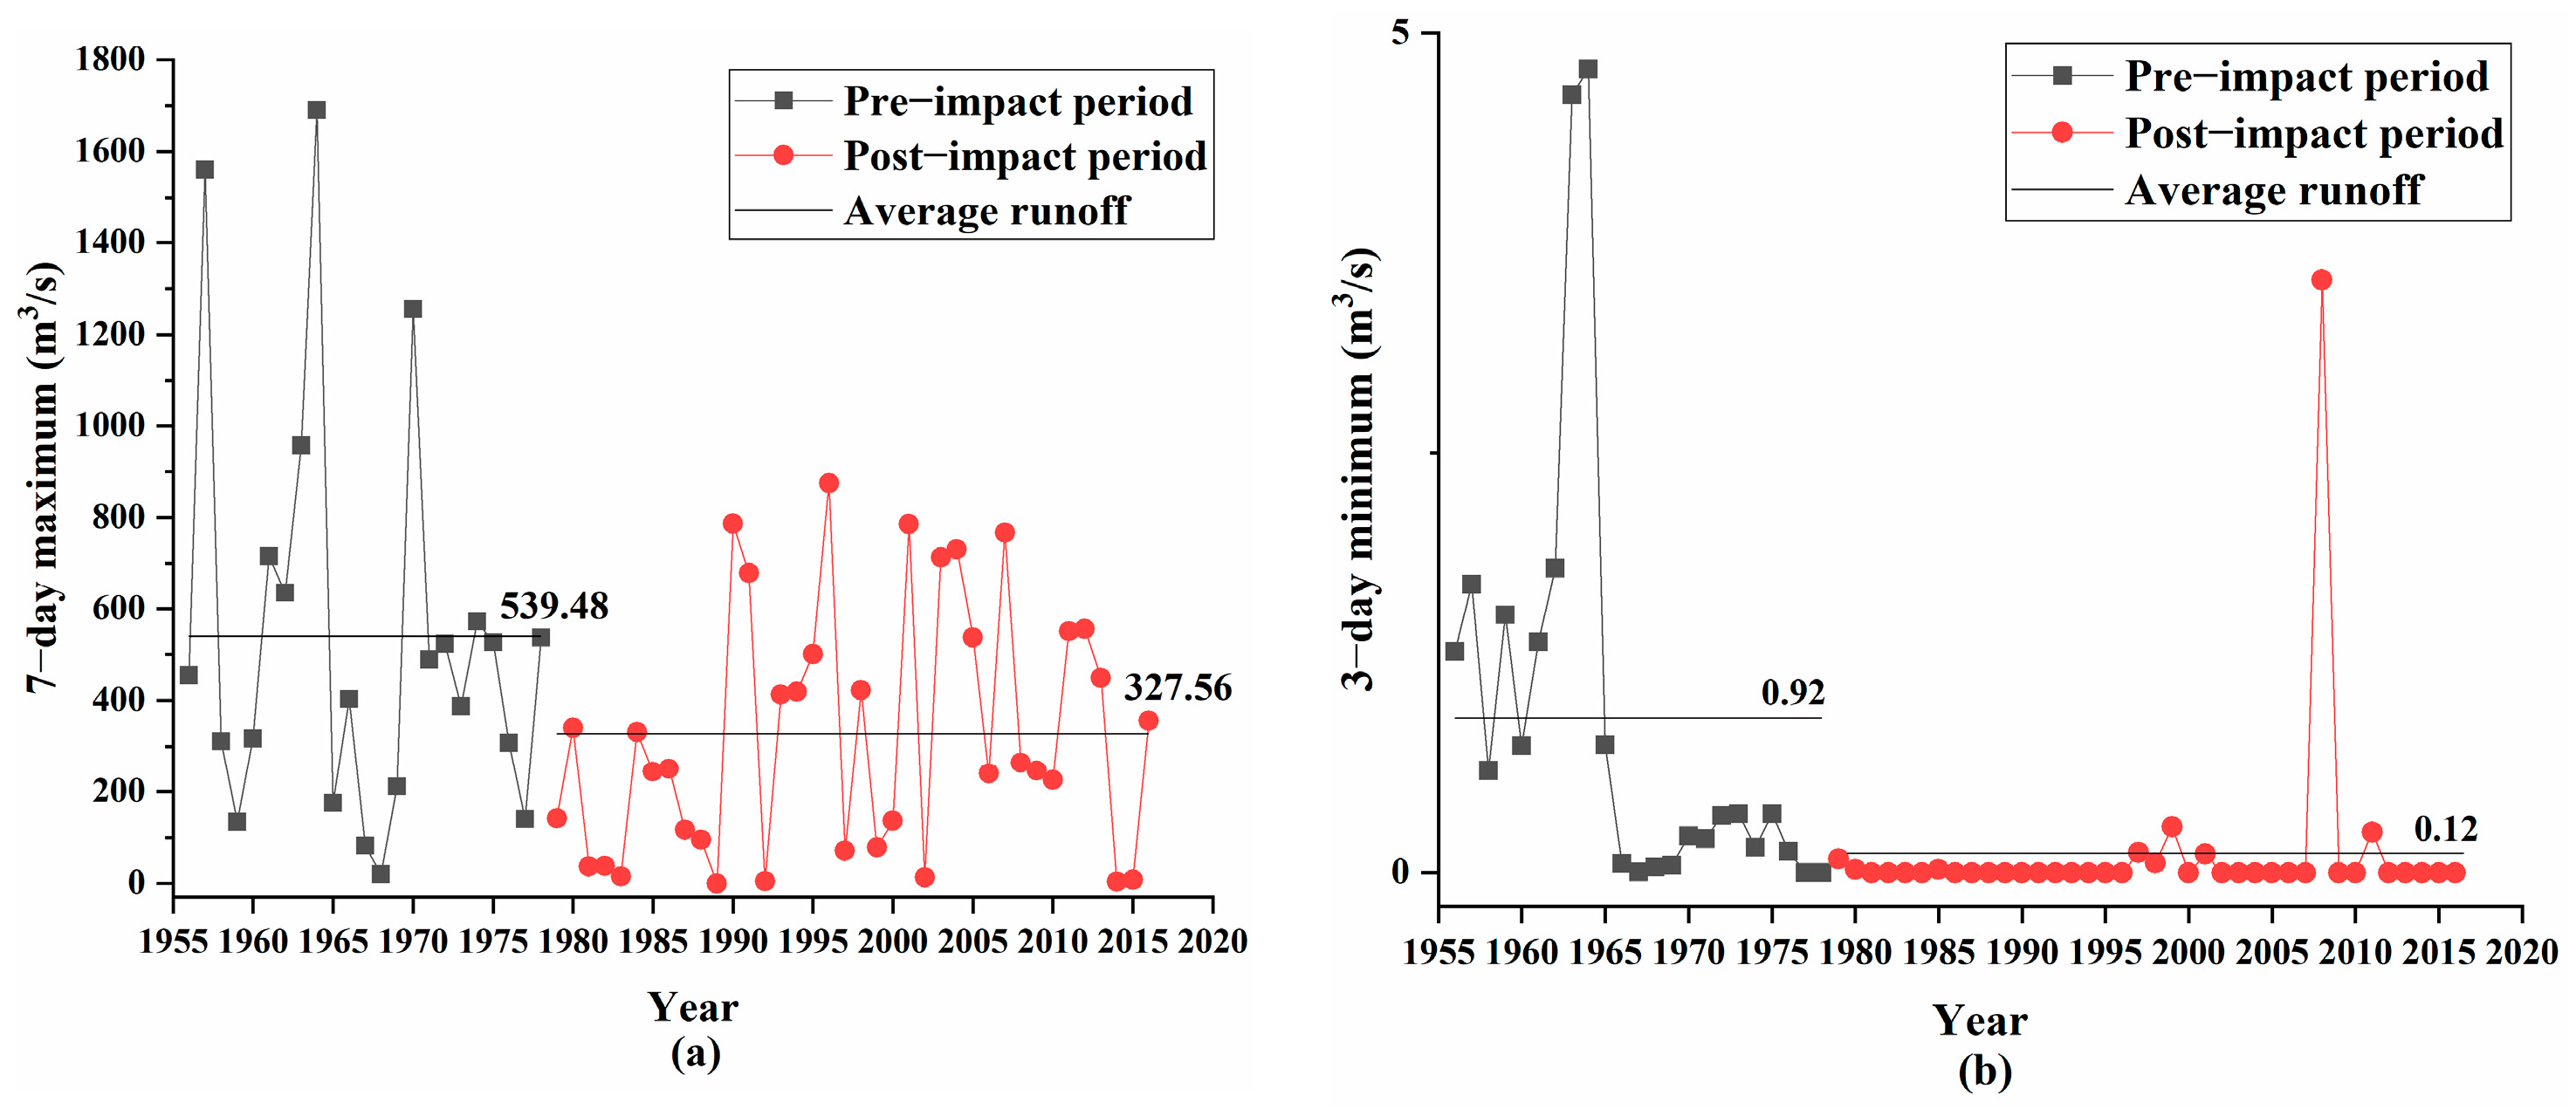
- Magnitude of annual extreme discharge events with different durations (Group 2)
- (3)
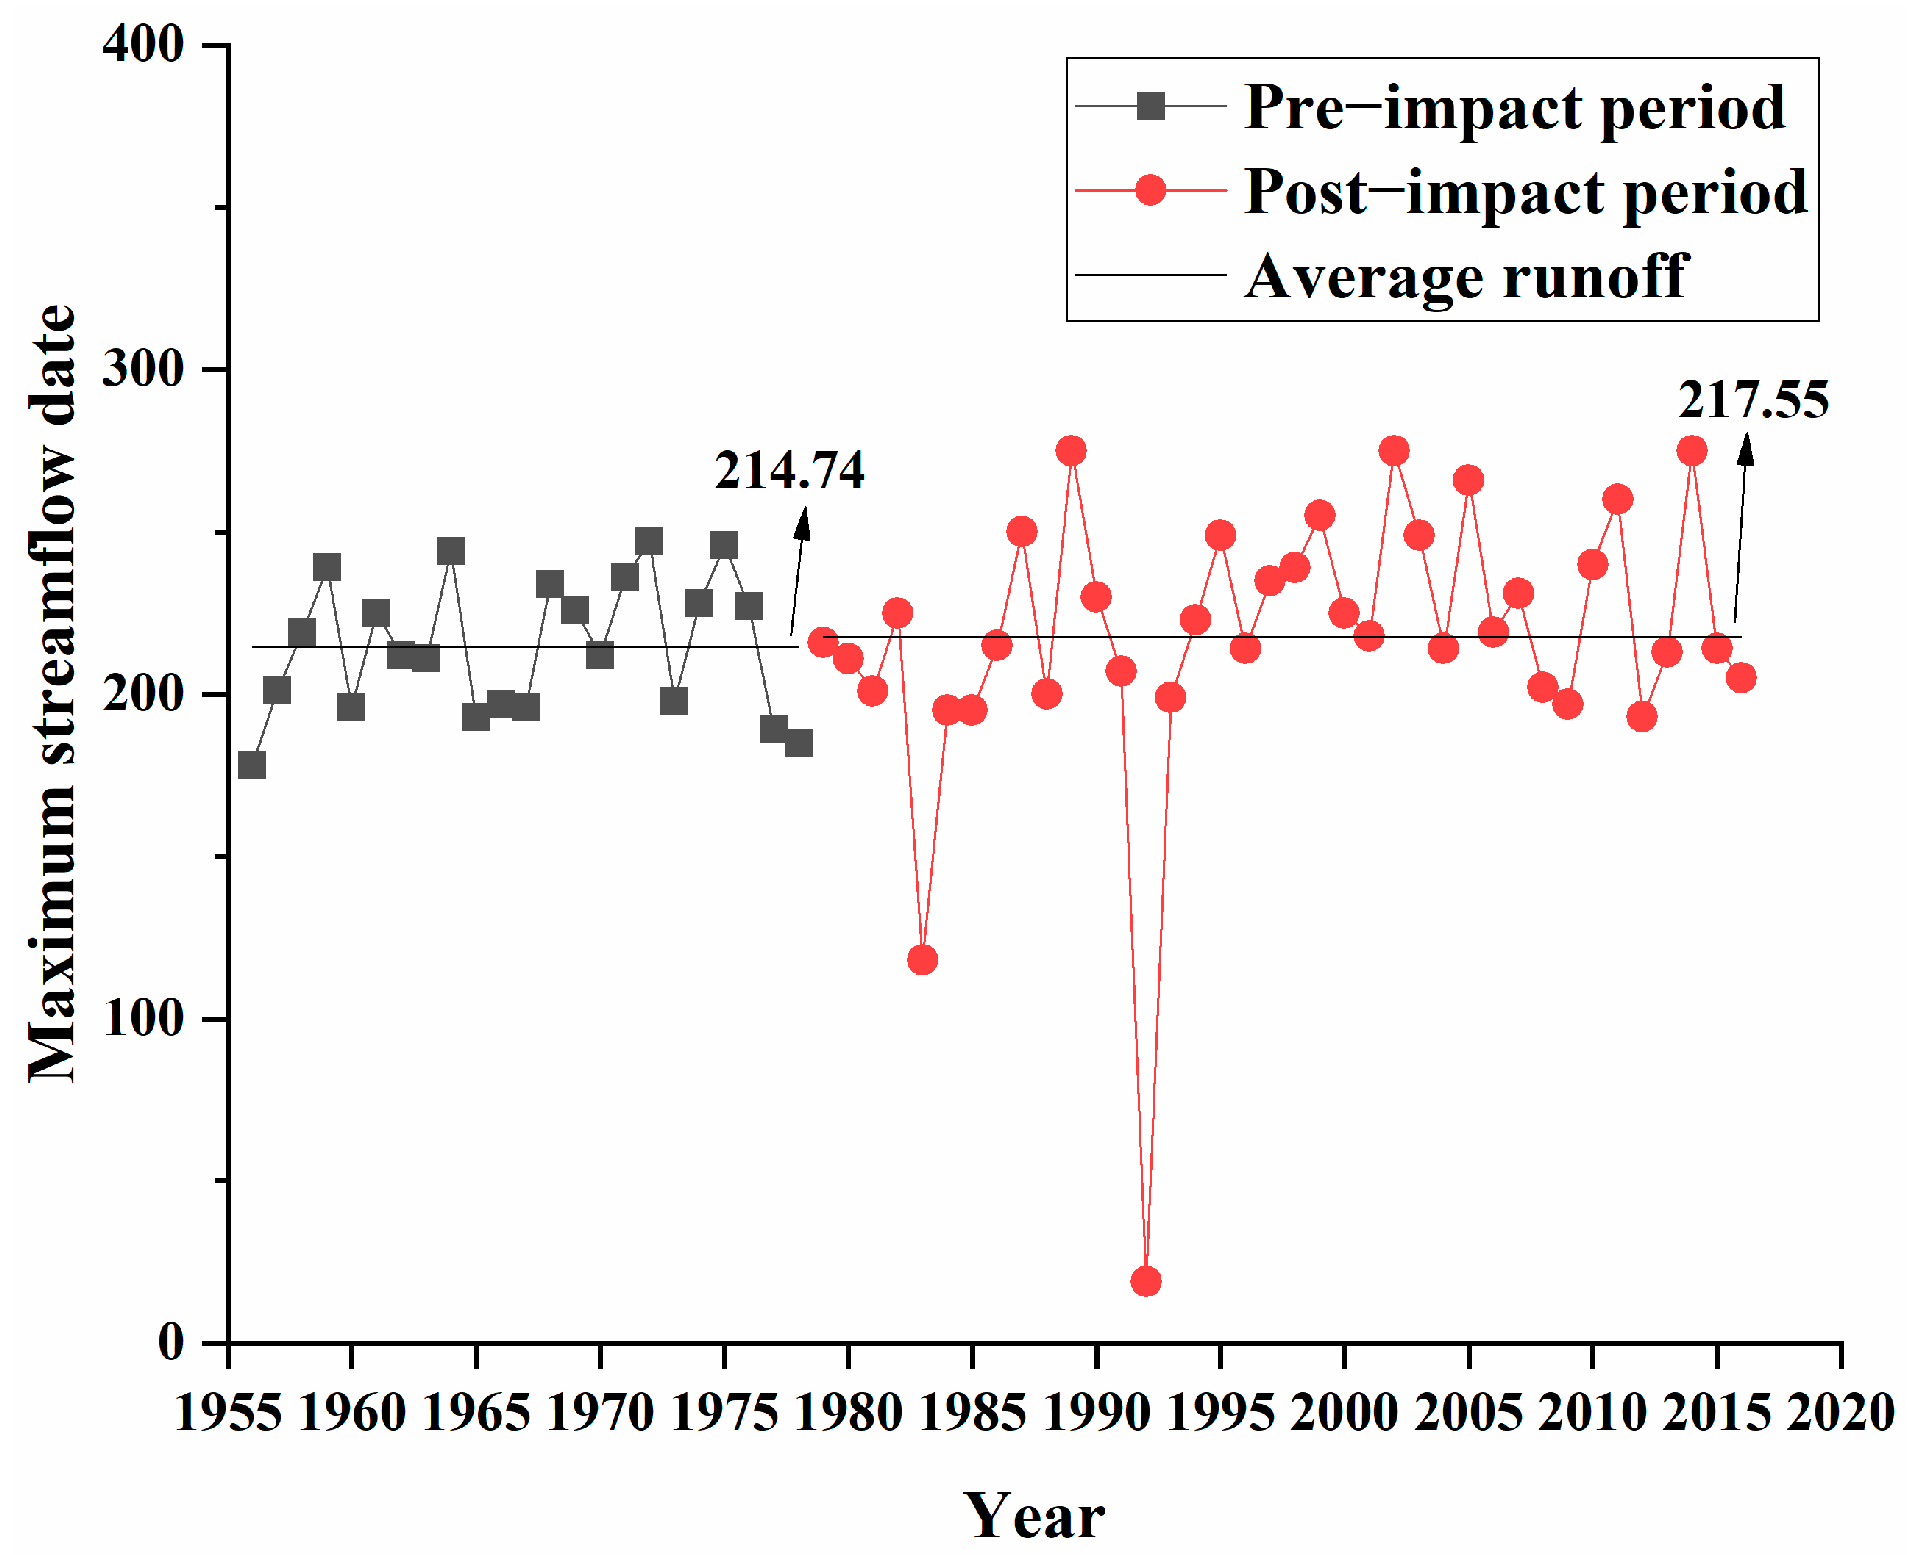
- Timing of annual extreme water conditions (Group 3)
- (4)
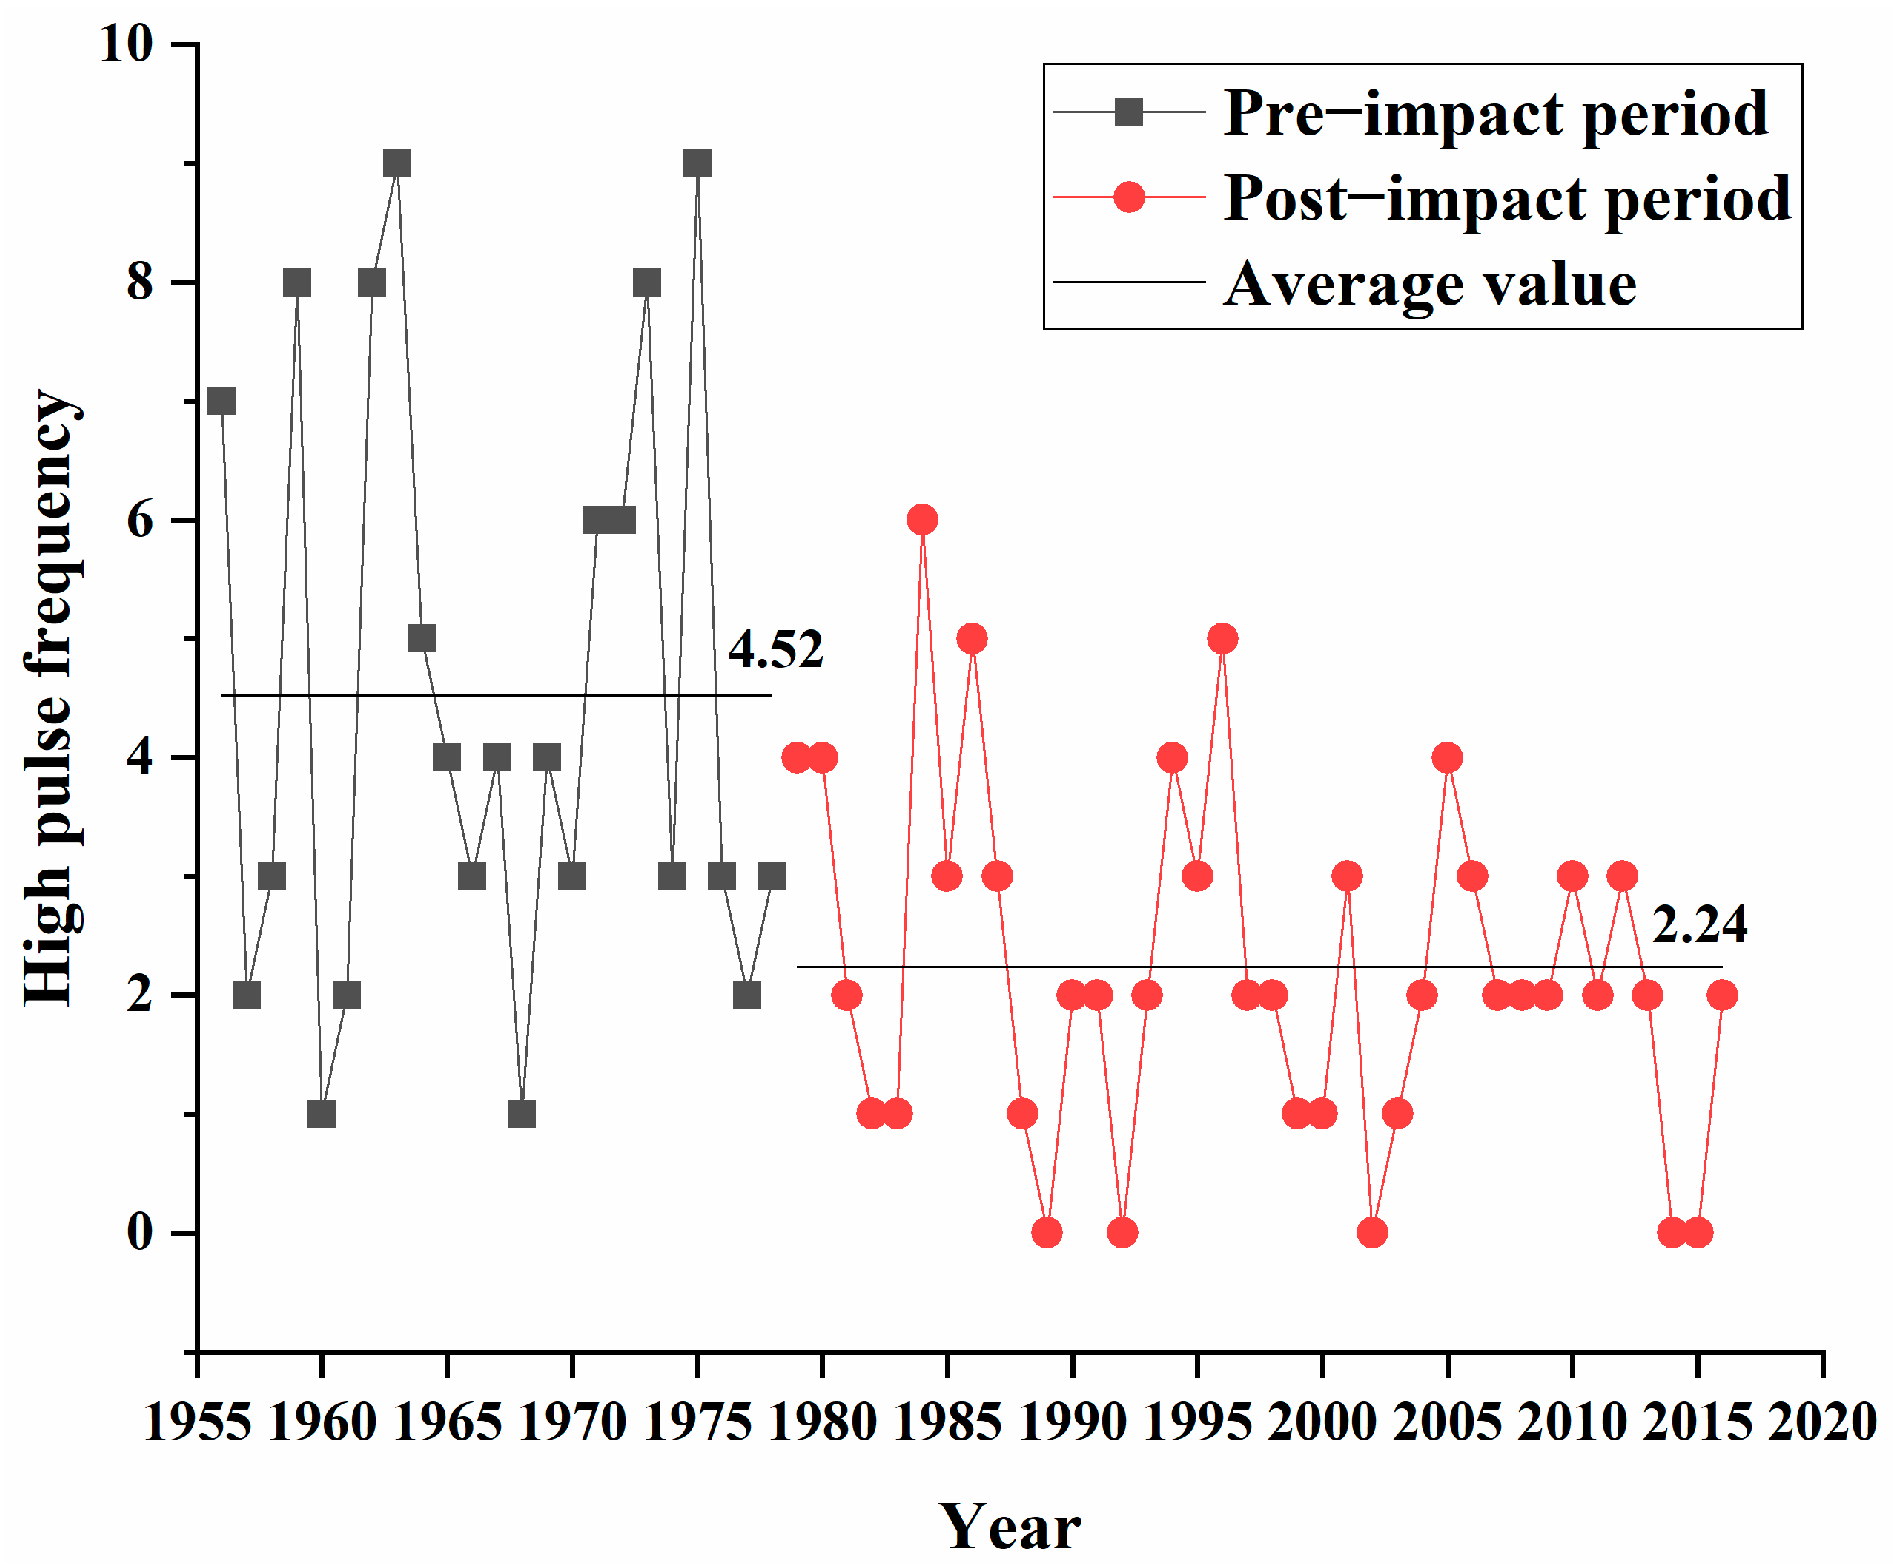
- Frequency and duration of high and low pulses (Group 4)
- (5)
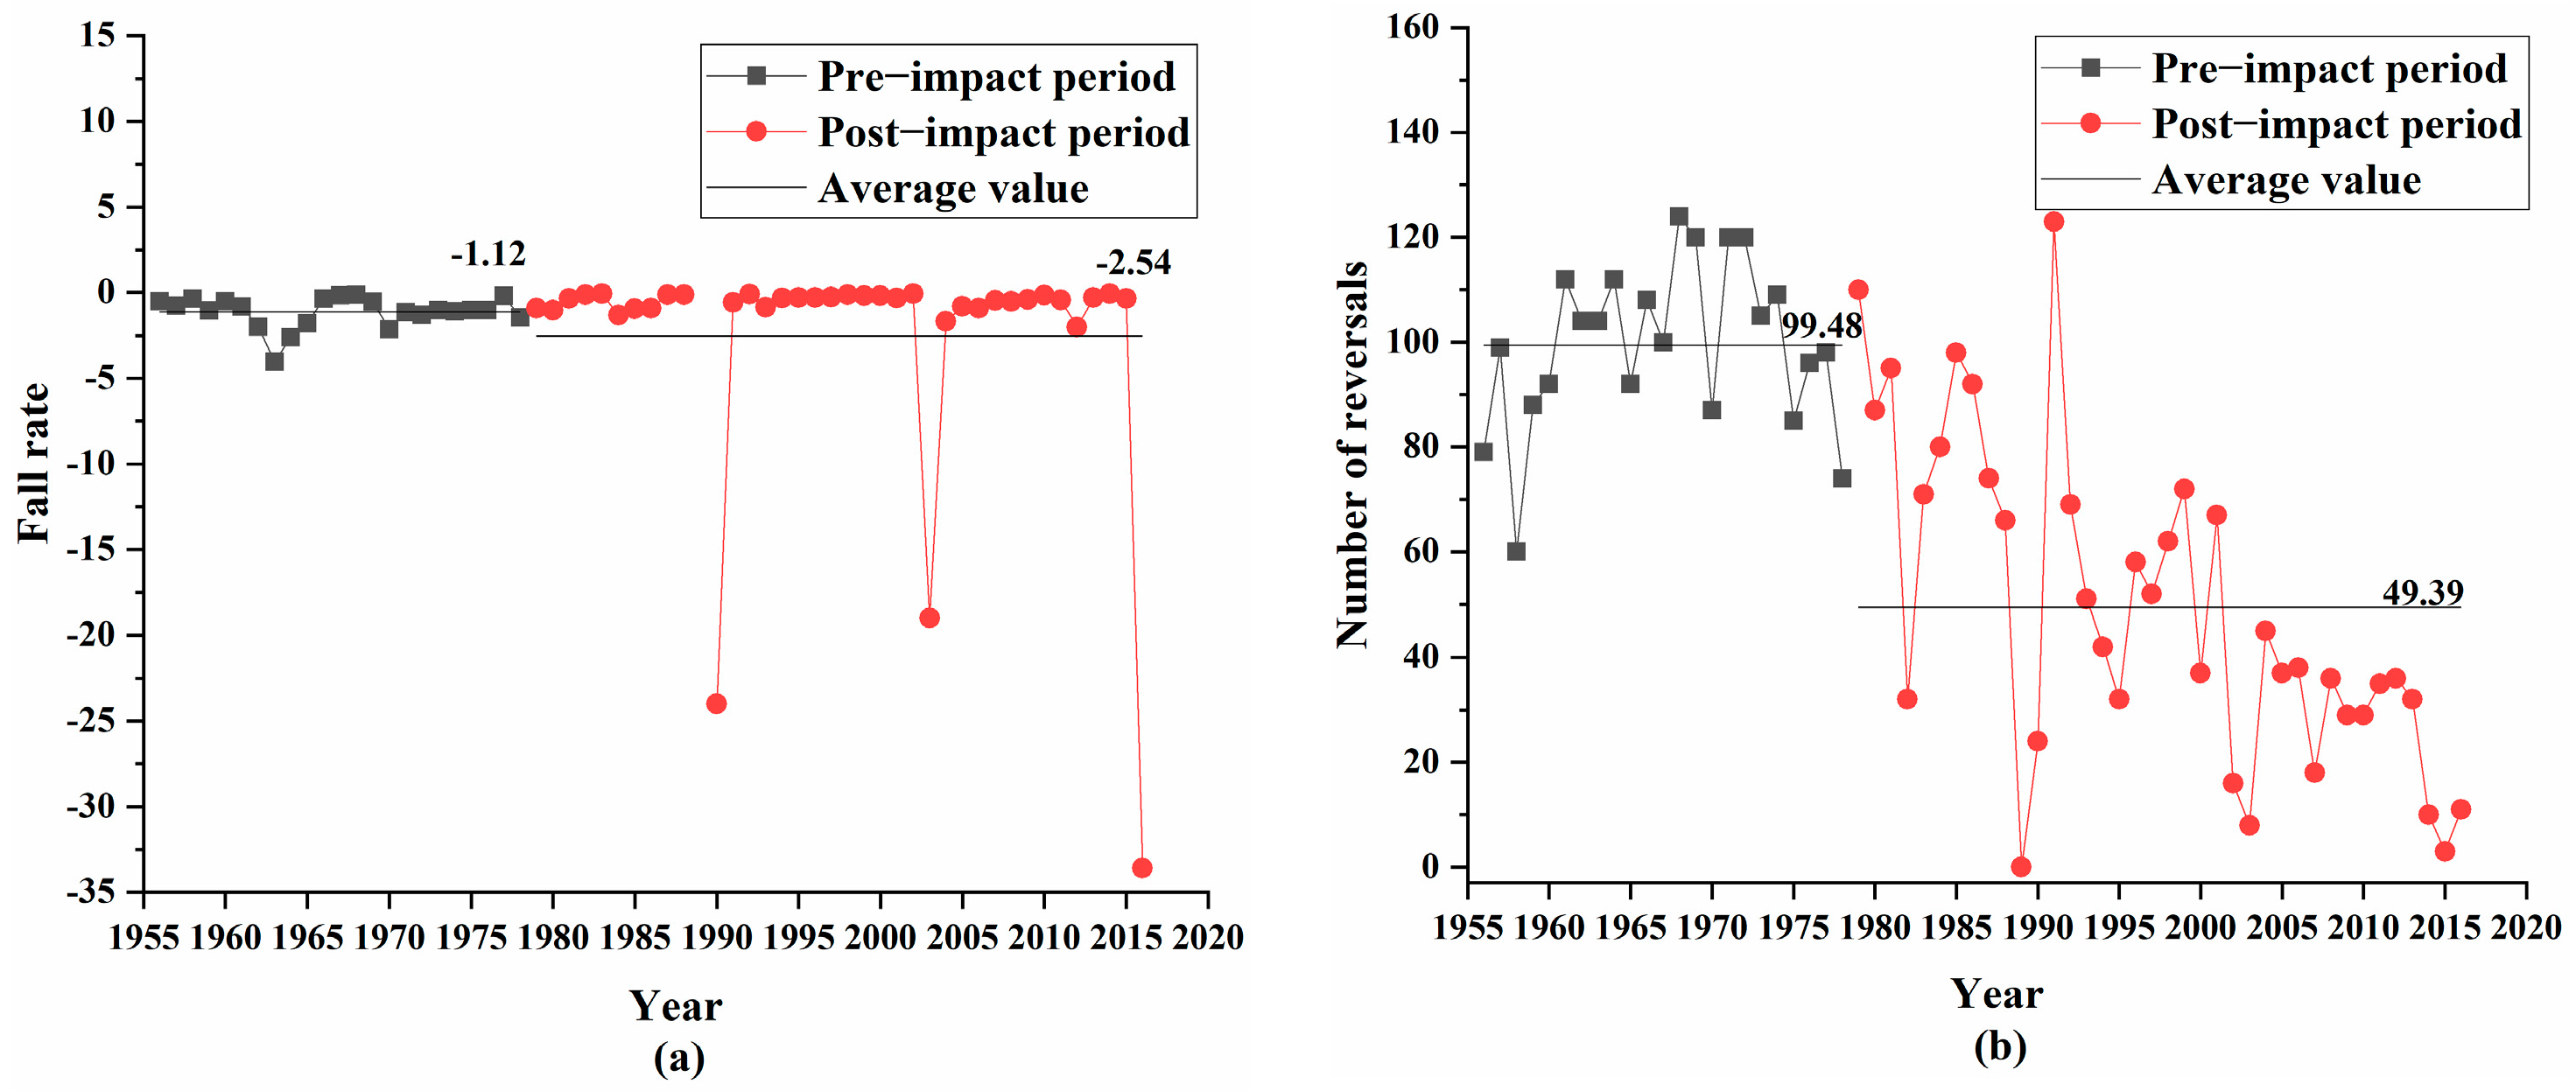
- Rate and frequency of water condition changes (Group 5)
4. Discussion
5. Conclusions
Author Contributions
Funding
Institutional Review Board Statement
Informed Consent Statement
Data Availability Statement
Conflicts of Interest
References
- Arrieta-Castro, M.; Donado-Rodríguez, A.; Acuña, G.J.; Canales, F.A.; Teegavarapu, R.S.V.; Kaźmierczak, B. Analysis of streamflow variability and trends in the meta river, Colombia. Water 2020, 12, 1451. [Google Scholar] [CrossRef]
- Liu, W.; Shi, C.; Zhou, Y. Trends and attribution of runoff changes in the upper and middle reaches of the yellow river in China. J. Hydro-Environ. Res. 2021, 37, 57–66. [Google Scholar] [CrossRef]
- Wang, S.; McVicar, T.R.; Zhang, Z.; Brunner, T.; Strauss, P. Globally partitioning the simultaneous impacts of climate-induced and human-induced changes on catchment streamflow: A review and meta-analysis. J. Hydrol. 2020, 590, 125387. [Google Scholar] [CrossRef]
- Su, L.; Miao, C.; Kong, D.; Duan, Q.; Lei, X.; Hou, Q.; Li, H. Long-term trends in global river flow and the causal relationships between river flow and ocean signals. J. Hydrol. 2018, 563, 818–833. [Google Scholar] [CrossRef]
- Gudmundsson, L.; Seneviratne, S.I.; Zhang, X. Anthropogenic climate change detected in European renewable freshwater resources. Nat. Clim. Chang. 2017, 7, 813–816. [Google Scholar] [CrossRef]
- Leal Filho, W.; Totin, E.; Franke, J.A.; Andrew, S.M.; Abubakar, I.R.; Azadi, H.; Nunn, P.D.; Ouweneel, B.; Williams, P.A.; Simpson, N.P. Understanding responses to climate-related water scarcity in Africa. Sci. Total Environ. 2022, 806, 150420. [Google Scholar] [CrossRef]
- Chauluka, F.; Singh, S.; Kumar, R. Rainfall and streamflow trends of thuchila river, southern Malawi. Mater. Today Proc. 2021, 34, 846–855. [Google Scholar] [CrossRef]
- Kakkar, A.; Rai, P.K.; Mishra, V.N.; Singh, P. Decadal trend analysis of rainfall patterns of past 115 years & its impact on Sikkim, India. Remote Sens. Environ. 2022, 26, 100738. [Google Scholar] [CrossRef]
- Anthony, M.; Cook, A. Non-Traditional Security in Asia: Issues, Challenges and Framework for Action; Institute of Southeast Asian Studies: Singapore, 2013. [Google Scholar]
- Li, H.; Song, W. Characteristics of climate change in the Lancang-Mekong sub-region. Climate 2020, 8, 115. [Google Scholar] [CrossRef]
- Wu, W.P.; Zhu, Y.F.; Zeng, W.K.; Wang, M.; Yang, D.X.; Chen, W. Green efficiency of water resources in northwest China: Spatial-temporal heterogeneity and convergence trends. J. Clean. Prod. 2021, 320, 128651. [Google Scholar] [CrossRef]
- Yang, L.; Zhao, G.; Tian, P.; Mu, X.; Tian, X.; Feng, J.; Bai, Y. Runoff changes in the major river basins of China and their responses to potential driving forces. J. Hydrol. 2022, 607, 127536. [Google Scholar] [CrossRef]
- Tian, X.; Zhao, G.; Mu, X.; Zhang, P.; Tian, P.; Gao, P.; Sun, W. Hydrologic alteration and possible underlying causes in the Wuding River, China. Sci. Total Environ. 2019, 693, 133556. [Google Scholar] [CrossRef] [PubMed]
- Xu, M.; Wang, G.; Wang, Z.; Hu, H.; Kumar Singh, D.; Tian, S. Temporal and spatial hydrological variations of the yellow river in the past 60 years. J. Hydrol. 2022, 609, 127750. [Google Scholar] [CrossRef]
- Richter, B.D.; Baumgartner, J.V.; Powell, J.; Braun, D.P. A method for assessing hydrologic alteration within ecosystems. Conserv. Biol. 1996, 10, 1163–1174. [Google Scholar] [CrossRef] [Green Version]
- Richter, B.D.; Baumgartner, J.V.; Braun, D.P.; Powell, J. A spatial assessment of hydrologic alteration within a river network. Regul. Rivers Res. Manag. 1998, 14, 329–340. [Google Scholar] [CrossRef]
- Richter, B.; Baumgartner, J.; Wigington, R.; Braun, D. How much water does a river need? Freshw. Biol. 1997, 37, 231–249. [Google Scholar] [CrossRef] [Green Version]
- Fantin-Cruz, I.; Pedrollo, O.; Girard, P.; Zeilhofer, P.; Hamilton, S.K. Effects of a diversion hydropower facility on the hydrological regime of the Correntes River, a tributary to the Pantanal floodplain, Brazil. J. Hydrol. 2015, 531, 810–820. [Google Scholar] [CrossRef]
- Mwedzi, T.; Katiyo, L.; Mugabe, F.T.; Bere, T.; Bangira, C.; Mangadze, T.; Kupika, O.L. A spatial assessment of stream-flow characteristics and hydrologic alterations, post dam construction in the Manyame catchment, Zimbabwe. Water SA 2016, 42, 194–202. [Google Scholar] [CrossRef] [Green Version]
- Smakhtin, V.U.; Shilpakar, R.L.; Hughes, D.A. Hydrology-based assessment of environmental flows: An example from Nepal. Hydrol. Sci. J. 2010, 51, 207–222. [Google Scholar] [CrossRef] [Green Version]
- Poff, N.; Zimmerman, J. Ecological responses to altered flow regimes: A literature review to inform the science and management of environmental flows. Freshw. Biol. 2010, 55, 194–205. [Google Scholar] [CrossRef]
- Suen, J.P. Ecologically Based Methods for Multi-Objective Water Resources Management in Taiwan. Ph.D. Thesis, University of Illinois, Urbana, IL, USA, 2005. [Google Scholar]
- Olden, J.D.; Poff, N.L. Redundancy and the choice of hydrologic indices for characterizing streamflow regimes. River Res. Appl. 2003, 19, 101–121. [Google Scholar] [CrossRef]
- Yang, T.; Zhang, Q.; Chen, Y.D.; Tao, X.; Xu, C.-Y.; Chen, X. A spatial assessment of hydrologic alteration caused by dam construction in the middle and lower yellow river, China. Hydrol. Process. 2008, 22, 3829–3843. [Google Scholar] [CrossRef]
- Gao, Y.; Vogel, R.M.; Kroll, C.N.; Poff, N.L.; Olden, J.D. Development of representative indicators of hydrologic alteration. J. Hydrol. 2009, 374, 136–147. [Google Scholar] [CrossRef]
- Yang, Y.-C.E.; Cai, X.; Herricks, E.E. Identification of hydrologic indicators related to fish diversity and abundance: A data mining approach for fish community analysis. Water Resour. Res. 2008, 44, W04412. [Google Scholar] [CrossRef]
- Xu, F.; Jia, Y.; Niu, C.; Liu, J.; Hao, C. Changes in annual, seasonal and monthly climate and its impacts on runoff in the Hutuo River basin, China. Water 2018, 10, 278. [Google Scholar] [CrossRef] [Green Version]
- Liu, Y.G.; Yuan, F.H.; Wang, A.Z.; Wu, J.B.; Zheng, X.B.; Yin, H.; Guan, X. Characteristics of climate change in changbai mountain ecological functional area, northeast China. Ying Yong Sheng Tai Xue Bao/J. Appl. Ecol. 2019, 30, 1503–1512. [Google Scholar] [CrossRef]
- Musa, I.H.; Musa, J.J.; Otache, M.Y.; Odofin, A.J.; Odofin, A.J.; Otuaro, E.A. Spatiotemporal variation of land use pattern and land cover changes in gidan kwano watershed area in north central Nigeria. Open J. Ecol. 2022, 12, 271–286. [Google Scholar] [CrossRef]
- Alifujiang, Y.; Abuduwaili, J.; Groll, M.; Issanova, G.; Maihemuti, B. Changes in intra-annual runoff and its response to climate variability and anthropogenic activity in the lake Issyk-Kul Basin, Kyrgyzstan. Catena 2021, 198, 104974. [Google Scholar] [CrossRef]
- Mohammed, A.; Tommaso, C.; Andrzej, W.; Nir, K.; Tarek, H. Analysis of the spatiotemporal annual rainfall variability in the Wadi Cheliff Basin (Algeria) over the period 1970 to 2018. Water 2021, 13, 1477. [Google Scholar] [CrossRef]
- Xie, Z.; Mu, X.; Gao, P.; Wu, C.; Qiu, D. Impacts of climate and anthropogenic activities on streamflow regimes in the Beiluo river, China. Water 2021, 13, 2892. [Google Scholar] [CrossRef]
- Yao, R.; Zhang, W.; Zhang, D. Period division-based markov models for short-term traffic flow prediction. IEEE Access 2020, 8, 178345–178359. [Google Scholar] [CrossRef]
- Lei, Y.X.; Jiang, X.H.; Geng, W.J.; Zhang, J.Y.; Zhao, H.; Ren, L.Q. The variation characteristics and influencing factors of base flow of the Hexi inland rivers. Atmosphere 2021, 12, 356. [Google Scholar] [CrossRef]
- Sohrab, K.; Ali, S.; Amirpouya, S. Spatio-temporal variations of discharge and sediment in rivers flowing into the anzali lagoon. Sustainability 2022, 14, 507. [Google Scholar] [CrossRef]
- He, Y.; Hu, Y.; Song, J.; Jiang, X. Variation of runoff between southern and northern China and their attribution in the Qinling mountains, China. Ecol. Eng. 2021, 171, 106374. [Google Scholar] [CrossRef]
- Sharifi, A.; Mirabbasi, R.; Ali Nasr-Esfahani, M.; Torabi Haghighi, A.; Fatahi Nafchi, R. Quantifying the impacts of anthropogenic changes and climate variability on runoff changes in central plateau of Iran using nine methods. J. Hydrol. 2021, 603, 127045. [Google Scholar] [CrossRef]
- Malede, D.A.; Agumassie, T.A.; Kosgei, J.R.; Linh, N.T.T.; Andualem, T.G. Analysis of rainfall and streamflow trend and variability over birr river watershed, Abbay basin, Ethiopia. Environ. Chall. 2022, 7, 100528. [Google Scholar] [CrossRef]
- Chen, L.; Wang, Y.; Touati, B.; Guan, H.; Leng, G.; Liu, W.; Lv, S.; Huang, S.; Pan, Z. Temporal characteristics detection and attribution analysis of hydrological time-series variation in the seagoing river of southern China under environmental change. Acta Geophysica. 2018, 66, 1151–1170. [Google Scholar] [CrossRef]
- Lei, X.; Gao, L.; Wei, J.; Ma, M.; Xu, L.; Fan, H.; Li, X.; Gao, J.; Dang, H.; Chen, X.; et al. Contributions of climate change and human activities to runoff variations in the Poyang Lake basin of China. Phys. Chem. Earth Parts A/B/C 2021, 123, 103019. [Google Scholar] [CrossRef]
- Wang, X.; Engel, B.; Yuan, X.; Yuan, P. Variation analysis of streamflows from 1956 to 2016 along the yellow river, China. Water 2018, 10, 1231. [Google Scholar] [CrossRef] [Green Version]
- Wu, L.; Wang, S.J.; Bai, X.Y.; Luo, W.J.; Tian, Y.C.; Zeng, C.; Luo, G.J.; He, S.Y. Quantitative assessment of the impacts of climate change and human activities on runoff change in a typical karst watershed, SW China. Sci. Total Environ. 2017, 601–602, 1449–1465. [Google Scholar] [CrossRef]
- Fu, J.; Gong, Y.; Zheng, W.; Zou, J.; Zhang, M.; Zhang, Z.; Qin, J.; Liu, J.; Quan, B. Spatial-temporal variations of terrestrial evapotranspiration across China from 2000 to 2019. Sci. Total Environ. 2022, 825, 153951. [Google Scholar] [CrossRef] [PubMed]
- Hekmatzadeh, A.A.; Kaboli, S.; Torabi Haghighi, A. New indices for assessing changes in seasons and in timing characteristics of air temperature. Theor. Appl. Climatol. 2020, 140, 1247–1261. [Google Scholar] [CrossRef] [Green Version]
- Kakaei Lafdani, E.; Saarela, T.; Laurén, A.; Pumpanen, J.; Palviainen, M. Purification of forest clear-cut runoff water using biochar: A meso-scale laboratory column experiment. Water 2020, 12, 478. [Google Scholar] [CrossRef] [Green Version]
- Liang, W.; Bai, D.; Wang, F.; Fu, B.; Yan, J.; Wang, S.; Yang, Y.; Long, D.; Feng, M. Quantifying the impacts of climate change and ecological restoration on streamflow changes based on a Budyko hydrological model in China’s loess plateau. Water Resour. Res. 2015, 51, 6500–6519. [Google Scholar] [CrossRef]
- Sattari, M.T.; Mirabbasi, R.; Jarhan, S.; Sureh, F.S.; Ahmad, S. Trend and abrupt change analysis in water quality of Urmia Lake in comparison with changes in lake water level. Environ. Monit. Assess. 2020, 192, 623. [Google Scholar] [CrossRef] [PubMed]
- Niu, B.; Li, X.; Li, F.; Wang, Y.; Hu, X. Vegetation dynamics and its linkage with climatic and anthropogenic factors in the Dawen river watershed of China from 1999 through 2018. Environ. Sci. Pollut. Res. 2021, 28, 52887–52900. [Google Scholar] [CrossRef]
- Mann, H.B. Nonparametric tests against trend. Econometrica 1945, 13, 245–259. [Google Scholar] [CrossRef]
- Kendall, M.G. Rank Correlation Methods; Griffin: New York, NY, USA, 1948. [Google Scholar]
- He, Y.; Tian, P.; Mu, X.; Gao, P.; Zhao, G.; Wang, F.; Li, P. Changes in daily and monthly rainfall in the middle yellow river, China. Theor. Appl. Climatol. 2017, 129, 139–148. [Google Scholar] [CrossRef]
- Lv, X.; Zuo, Z.; Ni, Y.; Sun, J.; Wang, H. The effects of climate and catchment characteristic change on streamflow in a typical tributary of the yellow river. Sci. Rep. 2019, 9, 14535. [Google Scholar] [CrossRef] [Green Version]
- Berger, W.H.; Labeyrie, L.D. Abrupt Climatic Change: Evidence and Implications; Springer Science & Business Media: Berlin/Heidelberg, Germany, 1987. [Google Scholar]
- Wang, S.; Yan, Y.; Yan, M.; Zhao, X. Quantitative estimation of the impact of precipitation and human activities on runoff change of the Huangfuchuan River Basin. J. Geogr. Sci. 2012, 22, 906–918. [Google Scholar] [CrossRef]
- Shah, S.A.; Jehanzaib, M.; Lee, J.H.; Kim, T.W. Exploring the factors affecting streamflow conditions in the Han River basin from a regional perspective. KSCE J. Civ. Eng. 2021, 25, 4931–4941. [Google Scholar] [CrossRef]
- Mathews, R.; Richter, B. Application of the indicators of hydrologic alteration software in environment flow setting. J. Am. Water Resour. As. 2007, 43, 1400–1413. [Google Scholar] [CrossRef]
- Mohd Salleh, N.A.; Hassan, M.S. Discrimination of lard and other edible fats after heating treatments using partial least square regression (plsr), principal component regression (pcr) and linear support vector machine regression (svmr). J. Phys. Conf. Ser. 2019, 1366, 012114. [Google Scholar] [CrossRef]
- Yang, T.; Cui, T.; Xu, C.-Y.; Ciais, P.; Shi, P. Development of a new IHA method for impact assessment of climate change on flow regime. Glob. Planet Chang. 2017, 156, 68–79. [Google Scholar] [CrossRef]
- Zhong, D.; Dong, Z.; Fu, G.; Bian, J.; Kong, F.; Wang, W.; Zhao, Y. Trend and change points of streamflow in the yellow river and their attributions. J. Water Clim. Chang. 2021, 12, 136–151. [Google Scholar] [CrossRef]
- Zhang, R.; Duan, Z.; Wang, W.; Li, J. Analysis on the changing trend and influence of water resources in Dawen river under changing environment. Yellow River 2015, 37, 67–69. [Google Scholar] [CrossRef]
- Sun, R.; Sun, X.L.; Gong, X.L.; Lu, C.X. Runoff series consistency test of Daicun dam in Dawen river. Water Resour. Power 2017, 35, 17–21. [Google Scholar]
- Jie, X.; Xu, G. A brief discussion on the characteristics and countermeasures of flood disaster in Dawen river basin. J. Econ. Water Resour. 2003, 21, 59–62. [Google Scholar] [CrossRef]
- Guo, K.; Xu, Y. Study on health status and control measures in Dawen river basin. Res. Soil Water Conserv. 2007, 14, 336–337, 340. [Google Scholar] [CrossRef]
- Zhang, X. Effects of soil and water conservation on water resources and water environment. Henan Water Resour. South-North Water Divers. 2020, 49, 6–17. [Google Scholar] [CrossRef]
- Shen, Z.T.; Zhao, Q.; Li, X. Analysis of rainfall-runoff variation characteristics and influencing factors in the Dawen river basin in the past 50 years. IOP Conf. Ser. Earth Environ. Sci. 2020, 619, 012091. [Google Scholar] [CrossRef]
- Guan, X.; Zhang, J.; Bao, Z.; Liu, C.; Jin, J.; Wang, G. Past variations and future projection of runoff in typical basins in 10 water zones, China. Sci. Total Environ. 2021, 798, 149277. [Google Scholar] [CrossRef] [PubMed]
- Li, L.J.; Zhang, L.; Wang, H.; Wang, J.; Yang, J.W.; Jiang, D.J.; Li, J.Y.; Qin, D.Y. Assessing the impact of climate variability and human activities on streamflow from the Wuding river basin in China. Hydrol. Processes 2007, 21, 3485–3491. [Google Scholar] [CrossRef]
- Zhao, G.; Tian, P.; Mu, X.; Jiao, J.; Wang, F.; Gao, P. Quantifying the impact of climate variability and human activities on streamflow in the middle reaches of the yellow river basin, China. J. Hydrol. 2014, 519, 387–398. [Google Scholar] [CrossRef]


| IHA Parameter Group | Hydrologic Parameters | Ecosystem Influences |
|---|---|---|
| Group 1 Magnitude of monthly water conditions | Median streamflow for each month (Subtotal 12 parameters) |
|
| Group 2 Magnitude of annual extreme discharge events with different durations | 1-day minimum 3-day minimum 7-day minimum 30-day minimum 90-day minimum 1-day maximum 3-day maximum 7-day maximum 30-day maximum 90-day maximum Zero streamflow days Base streamflow index (Subtotal 12 parameters) |
|
| Group 3 Timing of annual extreme water conditions | Minimum streamflow date Maximum streamflow date (Subtotal 2 parameters) |
|
| Group 4 Frequency and duration of high and low pulses | Low pulse count Low pulse duration High pulse count High pulse duration (Subtotal 4 parameters) |
|
| Group 5 Rate and frequency of water condition changes | Rise rate Fall rate Number of reversals (Subtotal 3 parameters) |
|
| Hydrologic Station | Mutation Year | Variation Point | ||
|---|---|---|---|---|
| Mann–Kendall Test | Cumulative Anomaly Method | Moving t Test | ||
| Daicun Dam | 1964, 1968, 1978, 1993 | 1964, 1978 | 1964, 1969, 1975, 1978, 2002 | 1978 |
| Group | Serial Number | IHA Indicators | Pre-Impact Period | Post-Impact Period | RVA Boundaries | Hydrologic Alteration | ||
|---|---|---|---|---|---|---|---|---|
| Low | High | Numerical Value (%) | Degree of Change | |||||
| Group 1 | 1 | Median streamflow in October | 12.3 | 2.87 | 2.78 | 21.4 | −28% | L |
| 2 | Median streamflow in November | 13.2 | 4.47 | 7.78 | 18.1 | −54% | M | |
| 3 | Median streamflow in December | 8.16 | 2.87 | 5.18 | 12.6 | −61% | M | |
| 4 | Median streamflow in January | 7.62 | 5.00 | 4.51 | 9.76 | −8% | L | |
| 5 | Median streamflow in February | 4.23 | 3.32 | 2.69 | 8.30 | 5% | L | |
| 6 | Median streamflow in March | 2.32 | 1.41 | 1.11 | 3.31 | −48% | M | |
| 7 | Median streamflow in April | 1.15 | 0.221 | 0.627 | 1.98 | −61% | M | |
| 8 | Median streamflow in May | 1.63 | 0.000 | 0.454 | 2.24 | −80% | H | |
| 9 | Median streamflow in June | 0.881 | 0.000 | 0.294 | 1.63 | −67% | H | |
| 10 | Median streamflow in July | 76.4 | 11.5 | 32.1 | 118 | −15% | L | |
| 11 | Median streamflow in August | 61.8 | 40.3 | 32.9 | 104 | −8% | L | |
| 12 | Median streamflow in September | 23.4 | 10.1 | 15.7 | 60.4 | −41% | M | |
| Group 2 | 13 | 1-day minimum | 0.322 | 0.000 | 0.146 | 0.689 | −87% | H |
| 14 | 3-day minimum | 0.352 | 0.000 | 0.148 | 0.803 | −87% | H | |
| 15 | 7-day minimum | 0.373 | 0.000 | 0.221 | 1.14 | −87% | H | |
| 16 | 30-day minimum | 0.614 | 0.000 | 0.296 | 1.42 | −87% | H | |
| 17 | 90-day minimum | 1.28 | 0.245 | 0.582 | 2.15 | −54% | M | |
| 18 | 1-day maximum | 963 | 416 | 603 | 1254 | −28% | L | |
| 19 | 3-day maximum | 669 | 328 | 414 | 801 | −34% | M | |
| 20 | 7-day maximum | 455 | 251 | 311 | 539 | −41% | M | |
| 21 | 30-day maximum | 207 | 141 | 161 | 295 | −28% | L | |
| 22 | 90-day maximum | 101 | 77.5 | 71.6 | 156 | 18% | L | |
| 23 | Zero streamflow days | 0.000 | 59.0 | 0.000 | 0.000 | −73% | H | |
| 24 | Base streamflow index | 0.022 | 0.000 | 0.08 | 0.028 | −93% | H | |
| Group 3 | 25 | Minimum streamflow date | 152 | 151 | 128 | 174 | −28% | L |
| 26 | Maximum streamflow date | 212 | 218 | 198 | 227 | 18% | L | |
| Group 4 | 27 | Low pulse count | 3.00 | 2.00 | 1.92 | 6.00 | 6% | L |
| 28 | Low pulse duration | 6.25 | 25.0 | 5.00 | 15.6 | −41% | M | |
| 29 | High pulse count | 4.00 | 2.00 | 3.00 | 6.00 | −31% | L | |
| 30 | High pulse duration | 7.00 | 17.0 | 5.46 | 14.4 | −54% | M | |
| Group 5 | 31 | Rise rate | 0.662 | 0.382 | 0.447 | 0.991 | −54% | M |
| 32 | Fall rate | −1.00 | −0.355 | −1.16 | −0.532 | −48% | M | |
| 33 | Number of reversals | 100 | 38.0 | 92.0 | 108 | −82% | H | |
| Hydrologic Change Degree of Each Group (%) | Degree of Overall Hydrologic Change (%) | ||||
|---|---|---|---|---|---|
| Group 1 | Group 2 | Group 3 | Group 4 | Group 5 | |
| 47 (M) | 66 (M) | 24 (L) | 37 (M) | 63 (M) | 54 (M) |
| IHA Indicators | Principal Component | ||||||||
|---|---|---|---|---|---|---|---|---|---|
| PC1 | PC2 | PC3 | PC4 | PC5 | PC6 | PC7 | PC8 | PC9 | |
| Median streamflow in October | 0.045 | 0.897 | 0.011 | −0.027 | −0.063 | 0.006 | 0.131 | 0.001 | 0.126 |
| Median streamflow in November | 0.126 | 0.906 | −0.069 | −0.101 | −0.051 | 0.019 | 0.176 | 0.101 | 0.008 |
| Median streamflow in December | 0.082 | 0.936 | −0.052 | −0.047 | 0.134 | −0.079 | 0.013 | 0.133 | −0.036 |
| Median streamflow in January | 0.124 | 0.941 * | 0.064 | −0.117 | 0.099 | 0.023 | 0.018 | −0.056 | 0.035 |
| Median streamflow in February | 0.097 | 0.876 | 0.068 | −0.105 | 0.222 | 0.007 | −0.057 | −0.167 | −0.001 |
| Median streamflow in March | 0.051 | 0.772 | −0.050 | −0.053 | 0.402 | −0.121 | −0.092 | 0.094 | −0.199 |
| Median streamflow in April | 0.036 | 0.456 | −0.009 | −0.114 | 0.716 | −0.188 | −0.099 | 0.151 | −0.192 |
| Median streamflow in May | −0.072 | 0.041 | 0.191 | −0.031 | 0.872 * | 0.081 | 0.156 | −0.095 | 0.067 |
| Median streamflow in June | −0.084 | −0.061 | −0.036 | −0.108 | −0.041 | −0.109 | 0.036 | 0.094 | 0.861 * |
| Median streamflow in July | 0.211 | 0.182 | 0.148 | −0.005 | 0.209 | 0.093 | 0.291 | 0.733 | 0.123 |
| Median streamflow in August | 0.612 | 0.144 | −0.130 | −0.022 | −0.139 | 0.035 | 0.415 | −0.084 | 0.006 |
| Median streamflow in September | 0.399 | 0.234 | −0.054 | 0.019 | 0.044 | −0.012 | 0.709 | −0.221 | 0.169 |
| 1-day minimum | 0.111 | −0.027 | 0.971 | −0.076 | 0.093 | 0.006 | −0.034 | 0.074 | 0.023 |
| 3-day minimum | 0.092 | −0.001 | 0.977 * | −0.070 | 0.083 | 0.017 | −0.022 | 0.078 | 0.016 |
| 7-day minimum | 0.058 | 0.037 | 0.975 | −0.045 | 0.084 | 0.075 | −0.003 | 0.088 | 0.018 |
| 30-day minimum | 0.025 | 0.022 | 0.952 | −0.048 | 0.164 | 0.151 | 0.053 | 0.065 | 0.042 |
| 90-day minimum | 0.018 | 0.275 | 0.349 | −0.132 | 0.821 | 0.031 | 0.073 | 0.085 | −0.004 |
| 1-day maximum | 0.929 | 0.050 | 0.100 | 0.103 | −0.005 | −0.073 | −0.075 | −0.073 | −0.021 |
| 3-day maximum | 0.953 | 0.093 | −0.013 | 0.087 | 0.022 | −0.121 | −0.012 | −0.032 | −0.033 |
| 7-day maximum | 0.959 * | 0.055 | 0.041 | 0.042 | 0.047 | −0.147 | 0.029 | 0.003 | −0.053 |
| 30-day maximum | 0.939 | 0.065 | 0.023 | 0.104 | −0.015 | −0.073 | 0.157 | 0.062 | −0.034 |
| 90-day maximum | 0.859 | 0.158 | 0.051 | 0.093 | −0.004 | −0.001 | 0.371 | 0.097 | 0.131 |
| Zero streamflow days | −0.019 | −0.143 | −0.241 | 0.689 | −0.237 | −0.476 | 0.132 | −0.045 | −0.118 |
| Base streamflow index | −0.162 | −0.052 | 0.871 | −0.098 | 0.036 | 0.066 | −0.048 | −0.057 | −0.058 |
| Minimum streamflow date | −0.021 | −0.309 | −0.161 | 0.576 | 0.268 | 0.169 | −0.12 | −0.066 | −0.246 |
| Maximum streamflow date | 0.184 | 0.042 | −0.107 | 0.003 | 0.092 | −0.012 | 0.287 | −0.792 * | −0.011 |
| Low pulse count | −0.403 | −0.112 | −0.049 | −0.022 | −0.086 | 0.757 | −0.121 | 0.012 | −0.105 |
| Low pulse duration | −0.215 | −0.029 | −0.169 | 0.392 | −0.232 | −0.569 | −0.067 | 0.064 | 0.147 |
| High pulse count | 0.282 | 0.234 | 0.309 | −0.043 | 0.027 | 0.332 | −0.448 | −0.075 | 0.491 |
| High pulse duration | 0.288 | 0.009 | 0.056 | 0.124 | 0.212 | −0.317 | 0.729 * | 0.088 | −0.126 |
| Rise rate | 0.212 | −0.084 | −0.052 | 0.853 | −0.091 | −0.092 | 0.048 | 0.052 | −0.004 |
| Fall rate | −0.144 | 0.093 | 0.039 | −0.897 * | 0.098 | 0.243 | −0.068 | 0.019 | 0.007 |
| Number of reversals | −0.053 | −0.099 | 0.256 | −0.288 | −0.097 | 0.761 * | −0.178 | 0.151 | 0.068 |
| Serial Number | IHA Indicators | Hydrologic Alteration (%) |
|---|---|---|
| 4 | Median streamflow in January | 8% |
| 8 | Median streamflow in May | 80% |
| 9 | Median streamflow in June | 67% |
| 14 | 3-day minimum | 87% |
| 20 | 7-day maximum | 41% |
| 26 | Maximum streamflow date | 18% |
| 29 | High pulse count | 31% |
| 32 | Rise rate | 48% |
| 33 | Number of reversals | 82% |
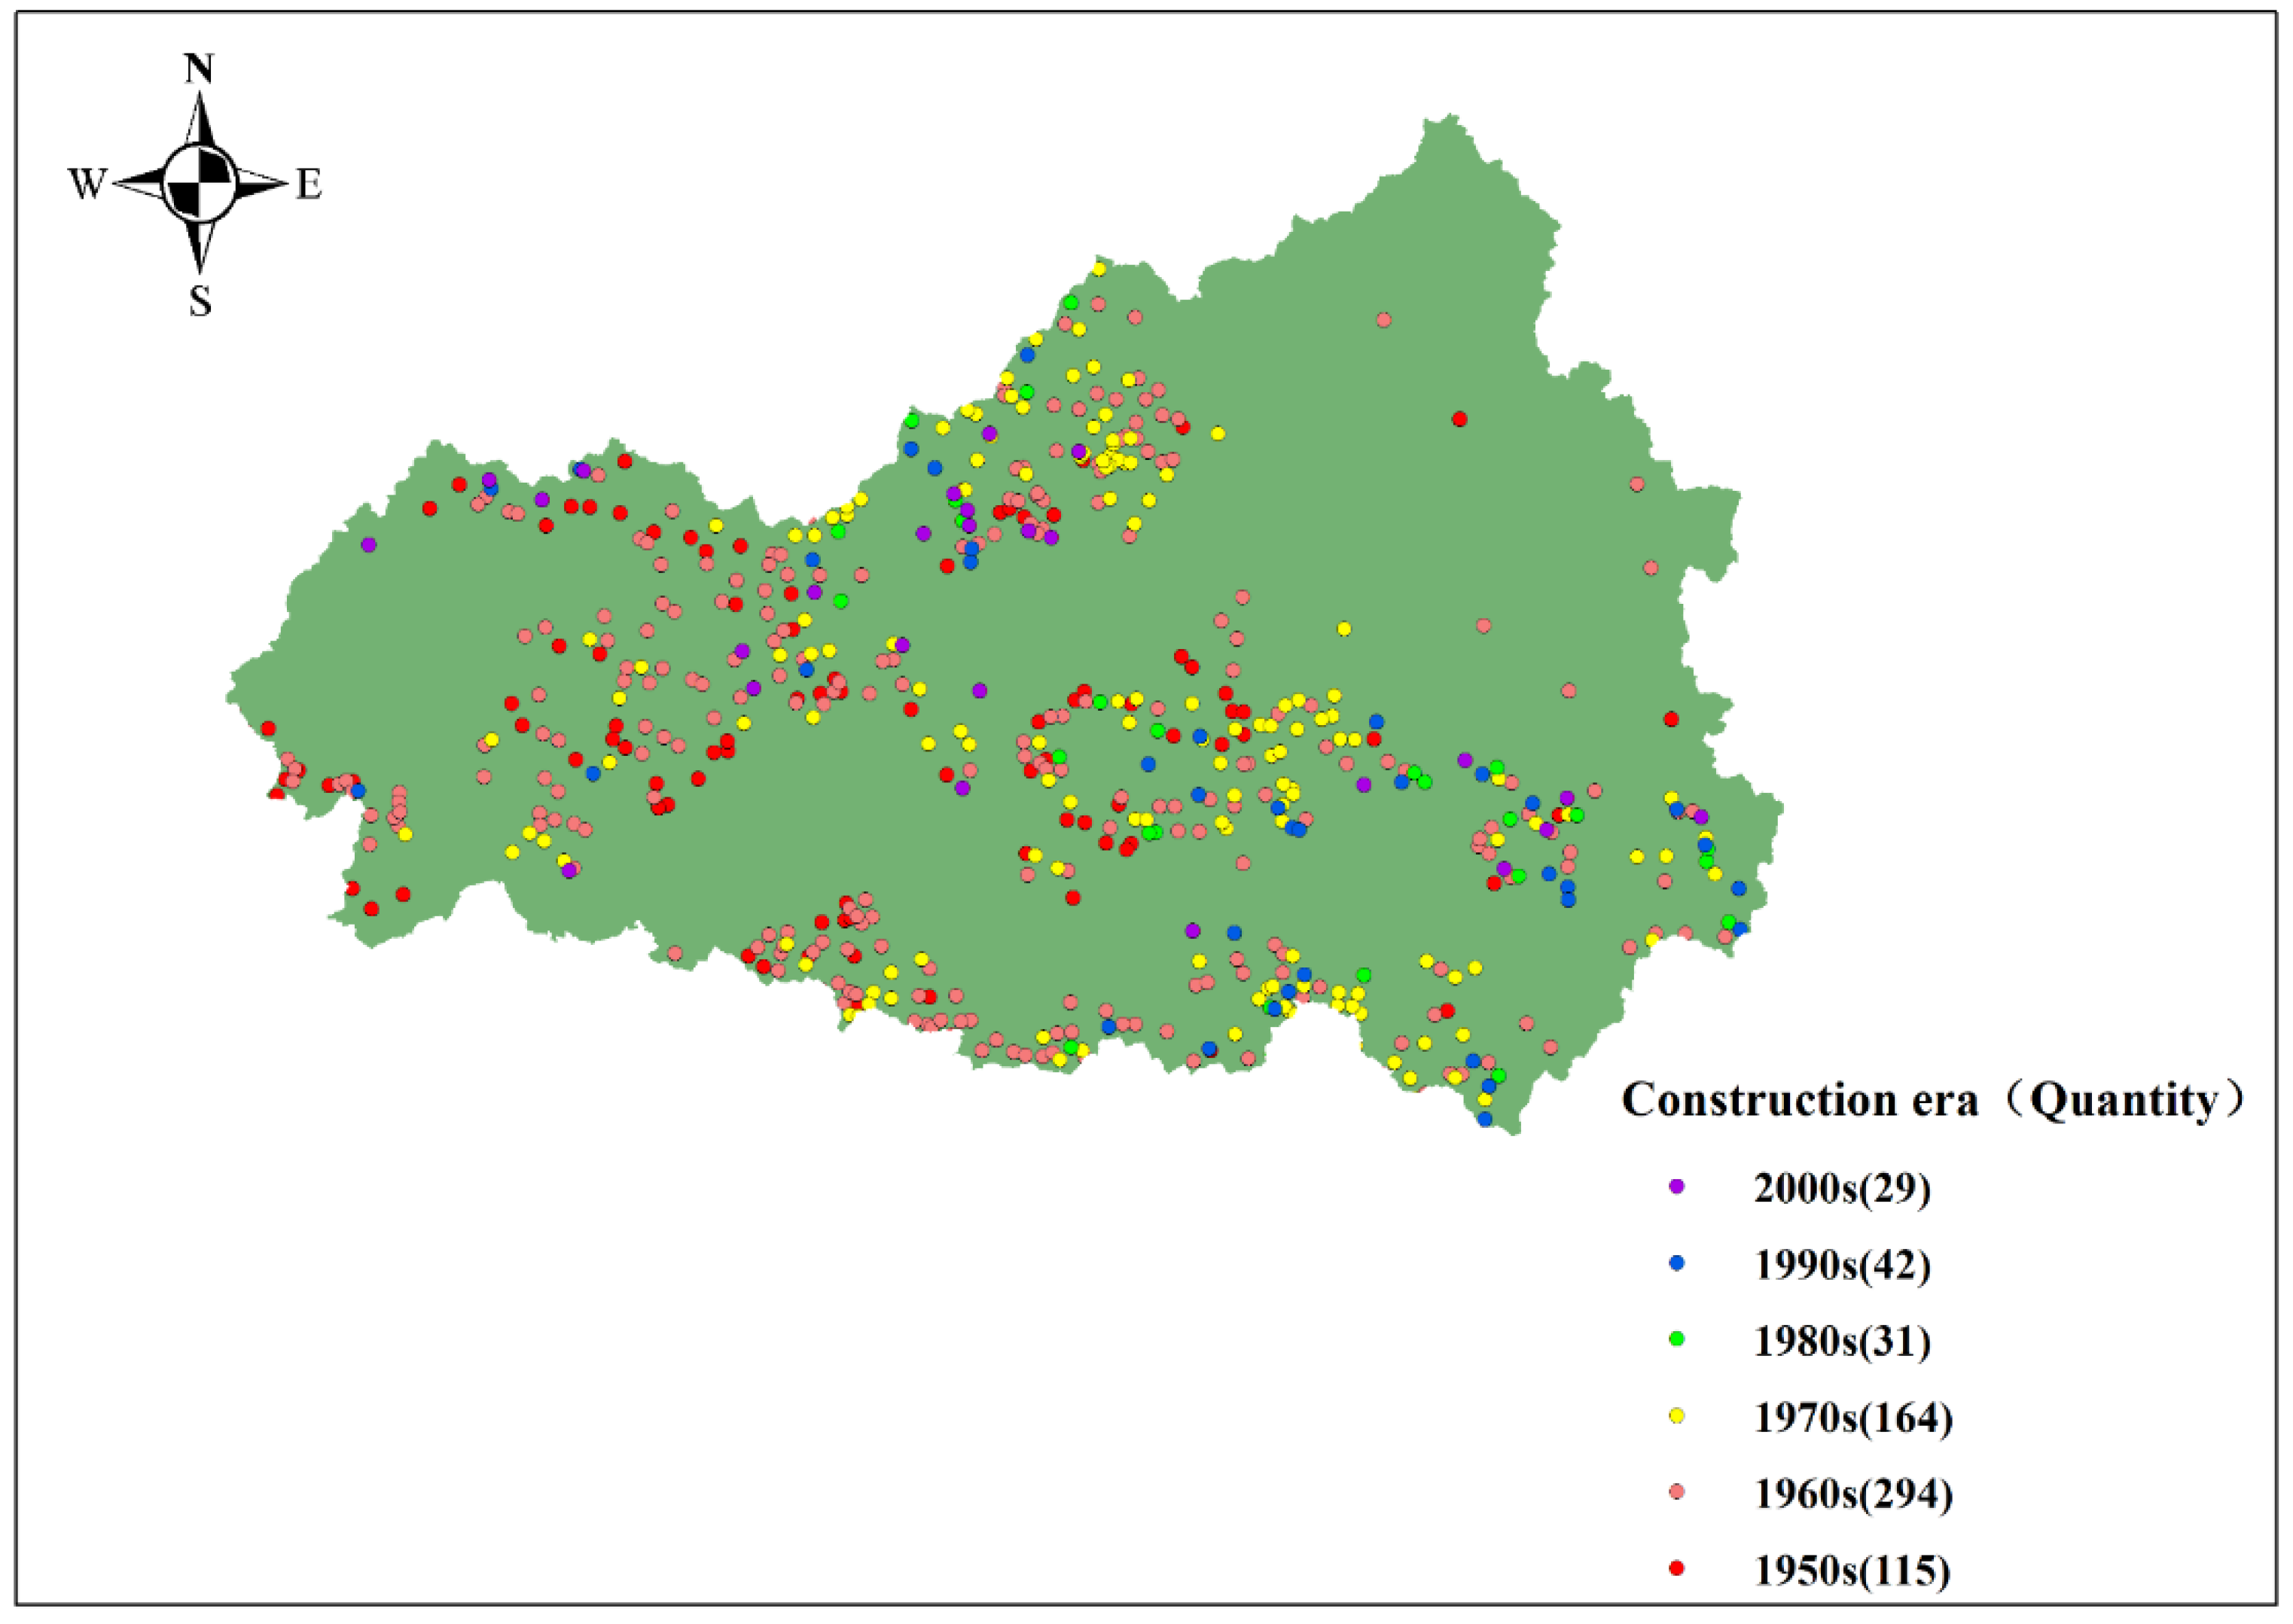
| New Construction from 1956 to 1978 | New Construction from 1979 to 2016 | |
|---|---|---|
| Large reservoirs | 2 | 0 |
| Medium reservoirs | 18 | 3 |
| Small reservoirs | 542 | 110 |
| Total storage capacity (104 m3) | 114,183.17 | 14,253.78 |
Publisher’s Note: MDPI stays neutral with regard to jurisdictional claims in published maps and institutional affiliations. |
© 2022 by the authors. Licensee MDPI, Basel, Switzerland. This article is an open access article distributed under the terms and conditions of the Creative Commons Attribution (CC BY) license (https://creativecommons.org/licenses/by/4.0/).
Share and Cite
Li, Y.; Zhao, L.; Zhang, Z.; Li, J.; Hou, L.; Liu, J.; Wang, Y. Research on the Hydrological Variation Law of the Dawen River, a Tributary of the Lower Yellow River. Agronomy 2022, 12, 1719. https://doi.org/10.3390/agronomy12071719
Li Y, Zhao L, Zhang Z, Li J, Hou L, Liu J, Wang Y. Research on the Hydrological Variation Law of the Dawen River, a Tributary of the Lower Yellow River. Agronomy. 2022; 12(7):1719. https://doi.org/10.3390/agronomy12071719
Chicago/Turabian StyleLi, Yan, Long Zhao, Zhe Zhang, Jianxin Li, Lei Hou, Jingqiang Liu, and Yibing Wang. 2022. "Research on the Hydrological Variation Law of the Dawen River, a Tributary of the Lower Yellow River" Agronomy 12, no. 7: 1719. https://doi.org/10.3390/agronomy12071719