Article

Are Traditional Lima Bean (Phaseolus lunatus L.) Landraces Valuable to Cope with Climate Change? Effects of Drought on Growth and Biochemical Stress Markers

by
M. Isabel Martínez-Nieto
1,2,
Sara González-Orenga
3,
Pilar Soriano
1,
Josefa Prieto-Mossi
1,
Elena Larrea
4,
Antonio Doménech-Carbó
4,
Ana Maria Tofei
3,5,
Oscar Vicente
3 and
Olga Mayoral
1,6,*
1
Jardí Botànic-ICBiBE, Universitat de València, Quart 80, 46008 Valencia, Spain
2
Department of Agroforest Ecosystems, Higher Polytechnic School of Gandia, Universitat Politècnica de València, Paranimf, 46730 Gandia, Spain
3
Institute for the Conservation and Improvement of Valencian Agrodiversity (COMAV, UPV), Universitat Politècnica de València, Camino de Vera s/n, 46022 Valencia, Spain
4
Department of Analytical Chemistry, University of Valencia, Dr. Moliner, Burjassot, 46100 Valencia, Spain
5
Faculty of Agriculture, The Banat University of Agricultural Sciences and Veterinary Medicine, “King Mihai I of Romania” Timisoara, 113 Aradului Avenue, 300645 Timisoara, Romania
6
Department of Experimental and Social Sciences Education, Universitat de València, Avda. Tarongers, 46022 Valencia, Spain
*
Author to whom correspondence should be addressed.
Agronomy 2022, 12(7), 1715; https://doi.org/10.3390/agronomy12071715
Submission received: 21 June 2022 / Revised: 15 July 2022 / Accepted: 18 July 2022 / Published: 20 July 2022

Abstract

:
Agrobiodiversity and adaptability to environmental changes derived from global warming are challenges for the future of agriculture. In this sense, landraces often have high levels of genetic variation, tightly connected with the changing environmental conditions of a territory. The genus Phaseolus, with five domesticated species, is one of the most important sources of proteins, carbohydrates and micronutrients in various countries. This study aimed to compare the adaptation capacity to drought, in the vegetative growth phase, of a commercial cultivar and two landraces traditionally cultivated in the Mediterranean basin of Phaseolus lunatus (Lima bean). Growth and biochemical responses of the analysed genotypes to different water-deficit treatments were evaluated and compared. In addition, the effectiveness of the voltammetric method for evaluating stress levels in cultivated plants was tested. The studied parameters revealed that P. lunatus is a drought-tolerant species, showing similar results for the three cultivars. However, contrary to what was expected from the germination phase results, the commercial variety Peru showed some better responses under water stress conditions. Finally, the voltammetric method proved to be a good and fast tool for assessing oxidative stress in cultivated plants, showing results in agreement with total phenolic compounds and total flavonoid fluctuations.

1. Introduction

This work aims to respond to the numerous requests from international institutions and organisations in relation to sustainable agricultural development [1,2] since the publication of the Brundtland Report in 1987 [3]. It is framed within the 2030 Agenda for Sustainable Development, the roadmap that humanity has set out to address the current situation of planetary crisis. This initiative, through 17 Sustainable Development Goals (SDG) and 169 targets, marks the commitments needed to reverse a situation of unsustainability at environmental, economic and social levels. Several SDGs address issues related to the sustainability of agriculture, in particular SDG 2 (Zero hunger), with targets 2.3, 2.4, 2.5, 2.A addressing conservation of agricultural biodiversity and local and traditional varieties [4].
These targets, intimately related to other goals and targets of the same Agenda, need intense research and innovation to promote smart, resilient and sustainable agriculture practices [5]. This paper is linked to the necessary efforts to produce indigenous, biodiverse crops that can also be useful to cope with climate change.
Some changes in environmental parameters, as a consequence of global warming, may be advantageous for agriculture in northern countries, expanding the limits of specific crops and increasing agrodiversity. However, on a global scale, the negative effects are far more relevant as crops in many territories are threatened and vulnerable to climate change impacts. The stress derived from water deficit is currently one of the most important problems in agriculture, affecting more than half of the agricultural land of our planet, particularly the most productive areas, those cultivated under irrigation in arid and semi-arid regions [6]. The increasing scarcity of good-quality water for irrigation, mainly because of climate change, will cause more significant yield losses in the near future, especially affecting subsistence agriculture in developing countries [7]. Consequently, many countries have promoted the implementation of different initiatives to adapt cropping systems to the new environmental conditions. Nevertheless, this adaptation represents a big challenge because of the combination of many factors related to economic and social aspects, environmental benefits and farmer acceptance [8,9]. Local varieties of our major crops can provide the adaptations required to overcome the environmental variations derived from climate change. These changes include increasing temperatures, longer, more intense and frequent drought periods and unpredictable, extreme meteorological phenomena such as heavy rains, strong winds, out-of-season frost or cold spells. Therefore, these landraces can significantly contribute to facing the challenges of global warming [10], and, indeed, many have been used as a source of drought tolerance traits, for example, in chickpea [11], maize [12] or sorghum [13]. In the case of the Mediterranean region, local cultivars traditionally grown by farmers over the years should be expected to show better adaptability to the climate change effects, as they are already adapted to the hot and dry summers characteristic of the Mediterranean climate.
Drought negatively affects many aspects of plant growth, development and productivity, through a wide array of morphological, cellular, physiological, biochemical and molecular changes [14]. Even moderate degrees of water deficit can lead, in most crops, to a 50–70% reduction in average yields, compared with registered record yields [15,16]. Therefore, to select drought-tolerant crop varieties, it is important to understand the physiological and biochemical plants’ stress response mechanisms under water deficit conditions at different phases of their life cycle.
Drought decreases the rate of photosynthesis through different mechanisms [17]. Water-stressed plants show a lower stomatal conductance to limit evapotranspiration and conserve water. Consequently, CO2 fixation is reduced, and photosynthetic activity decreases, resulting in less assimilate production for growth rate and yield of plants. Diffusive resistance of the stomata to CO2 entry is probably the main factor limiting photosynthesis under drought [18]. Severe drought stress also inhibits the photosynthesis of plants by causing changes in chlorophyll content, affecting chlorophyll components and damaging the photosynthetic apparatus [19,20]. The decrease in chlorophyll under drought stress is mainly the result of damage to chloroplasts caused by ROS (reactive oxygen species) [21]. ROS accumulation reflects the generation of oxidative stress as a secondary effect of drought and other abiotic stressors. Malondialdehyde (MDA), a lipid peroxidation product, is a reliable biochemical marker that can be used to evaluate the extent of oxidative stress affecting plants [22]. Plants activate antioxidant systems in response to increased ROS production, both antioxidant enzyme activities and the synthesis of non-enzymatic antioxidants, including phenolic compounds, especially the subclass of flavonoids [23,24].
On the other hand, water deficit, like many other abiotic stress conditions, causes cellular dehydration in plants, which can partly protect themselves against drought stress by accumulating organic and inorganic osmolytes. Proline (Pro) is one of the most common plant osmolytes [25,26]. A significant increase in Pro contents in response to water deficit, high salinity or other stressful conditions has been detected in many plant species, including beans [27,28,29,30].
Apart from the use of suitable physiological and biochemical markers, water stress can also be monitored using solid-state electrochemistry, directly inspired by the voltammetry of immobilised particles, a methodology developed by Scholz et al. [31]. This approach has been revealed as an effective method for determining stress levels in wild plants [32]. The analysis exploits the possibility of an in situ electrochemical generation of ROS in air-saturated electrolytes, showing the plant’s capacity to respond to ROS [33,34,35]. This method can be used to indirectly measure the adaptation to the oxidative stress derived from other stresses such as salinity or drought.
The genus Phaseolus, which includes five domesticated species, is one of the most important sources of dietary proteins, carbohydrates and micronutrients for people globally [36]. The present study represents an extension of previous research on the adaptation to stress of landraces and commercial cultivars of one of the five cultivated Phaseolus species, P. lunatus (Lima bean), at the seed germination stage, one of the most sensitive phases of its life cycle. The results of a previous study evidenced a better germination response for local varieties in comparison to a commercial cultivar [37]. However, there is no information on the responses to drought of this species during vegetative growth. According to the information above, these responses should be expected to include the inhibition of growth, a reduction of photosynthetic pigments, the accumulation of solutes for osmotic balance and the activation of antioxidant mechanisms.
To continue the studies on drought adaptation of P. lunatus varieties in other developmental phases, two Lima bean landraces (Pintat and Ull de Perdiu) and a commercial cultivar (Peru) were selected and grown under controlled greenhouse conditions. Different water deficit treatments were applied to evaluate and compare the growth and biochemical responses of the three genotypes: photosynthetic pigments, ions (Na+, Cl, K+ and Ca2+), osmolytes (proline), oxidative stress markers (malondialdehyde) and non-enzymatic antioxidants (total phenolic compounds and flavonoids). Furthermore, electrochemical analyses were conducted to test the plants’ responses to ROS under water deficit conditions.
To better understand the mechanisms of drought tolerance in this species, the following questions were addressed: (i) considering the results of the germination experiments, is the drought response similar in the next stage (i.e., vegetative growth) of this plant? (ii) is water stress tolerance in that phase enhanced in commercial varieties by plant breeding, or rather in local landraces through years of cultivation? (iii) is the voltammetric method a good tool for evaluating the stress level in cultivated plants? (iv) how relevant is the oxidative stress generated as a consequence of drought in Lima bean? and (iv) what are the key morphological and biochemical parameters for evaluating the water stress responses in this crop?

2. Materials and Methods

2.1. Plant Material

Three cultivars of P. lunatus were tested, two from local Valencian traditional crops (Pintat and Ull de Perdiu) and a commercial cultivar imported from Peru (hereinafter referred to as Peru). The traditional landraces seeds were provided by the Estación Experimental Agraria (EEA) from Carcaixent (Valencia, Spain), and the commercial seeds were bought specifically for this study.

2.2. Plant Growth and Water Stress Treatments

The plants were obtained by seed germination on 14 cm diameter Petri dishes with wetted paper filters, kept in climate-controlled cabinets illuminated by daylight fluorescent tubes with 12 h photoperiod and mean irradiance of 100 μmol·m−2·s−1. Germinated seeds were transferred first to 9 cm-diameter and afterwards to 15 cm-diameter pots, each with 1 kg of a mixed substrate of peat, coconut fibre and fine gravel (1–2 mm) in 3:2:1 proportion. Five plants were used per cultivar and treatment.
Four soil moisture ranges were set for the water stress treatment: 5–20%, 20–40%, 40–60% and 60–80%. Soil moisture was controlled with a WE.T. soil water sensor kit (Delta-T Devices Ltd., Cambridge, UK), measuring directly within the root zone. Irrigation was performed when necessary, using tap water. These conditions were maintained until plants subjected to the strongest water deficit showed visible signs of deterioration, 18 days after the beginning of the treatments, when the experiment was concluded, and all plants were harvested. Environmental temperature and humidity were measured with a graphic EL-USB-2 thermohygrometer (Lascar Electronics CO, Whiteparish, UK).

2.3. Plant Sampling and Growth Parameters

At the conclusion of the experiment, plant materials (roots, stems and leaves) were sampled separately. The following growth parameters were determined: root and stem length, basal stem diameter, number of leaves and fresh weight of roots, stems and leaves. Part of the harvested leaf material from each sample was weighed (FW), dried in an oven at 65 °C for 48–72 h until constant weight and then reweighed (DW) to calculate the water content, in percentage, of each sample using the following formula:
WC = [(FW − DW)/FW] × 100
Plant samples used for the determination of biochemical parameters were stored frozen at −80 °C.

2.4. Photosynthetic Pigments

Photosynthetic pigments, including chlorophyll a (Chl a), chlorophyll b (Chl b) and carotenoids (Caro), were quantified using 100 mg of fresh leaf material ground in 30 mL ice-cold 80% aqueous acetone. The sample was centrifuged for 10 min at 12,000 rpm, the absorbance of the supernatant was measured at 663, 646 and 470 nm and pigment concentrations were calculated according to Lichtenthaler et al. [38]:
Chl a (μg mL−1) = 12.21 (A663) − 2.81 (A646)
Chl b (μg mL−1) = 20.13 (A646) − 5.03 (A663)
Caro (μg mL1) = (1000A470 − 3.27 [chl a] − 104 [chl b])/227
Final values were expressed in mg g−1 DW.

2.5. Ion Concentration Measurements

Samples were extracted by incubating 0.05–0.1 g of ground dry leaf material in one mL of water for one hour at 95 °C in a water bath, and ion concentrations were determined according to Weimberg [39]. Sodium, calcium and potassium were measured in an FP 410 flame photometer (Jenway Inc., Burlington, VT, USA), and chloride content was measured using a 926 Mkii Chloride Analyser (Sherwood Scientific Ltd., Cambridge, UK).

2.6. Osmolyte Quantification

Proline (Pro) determination was performed following the classical method described by Bates et al. [40], with slight modifications [41]. First, fresh leaf material was extracted in a 3% (w/v) sulphosalicylic acid solution, then mixed with acid ninhydrin, incubated for one hour at 95 °C, cooled on ice and extracted with two volumes of toluene. After collecting the upper organic phase, its absorbance was read at 520 nm, with toluene used as a blank.

2.7. Oxidative Stress Markers and Non-Enzymatic Antioxidants

Malondialdehyde (MDA), total phenolic compounds (TPC) and total flavonoids (TF) were quantified in the same 80% methanol extracts prepared from 0.1 g of ground fresh leaf material.
MDA was determined according to a previously described method [42], with some modifications [43]. The extracts were mixed with 0.5% thiobarbituric acid (TBA) prepared in 20% trichloroacetic acid (TCA) (or with 20% TCA without TBA for the controls) and then incubated at 95 °C for 20 min. After subtracting the non-specific absorbance at 440 and 600 nm, MDA contents were calculated using the equation included in Taulavuori et al. (2001) [43], based on the extinction coefficient at 532 nm of the MDA–TBA adduct (155 mM−1 cm−1). The MDA concentration was finally expressed as nmol g−1 DW.
TPC were quantified, according to Blainski et al. [44], by reaction with the Folin–Ciocalteu reagent. The methanol extracts were mixed with sodium bicarbonate and the reagent incubated at room temperature in the dark for 90 min, and the absorbance was recorded at 765 nm. Gallic acid (GA) was used as standard, and the measured TPC concentrations were expressed as GA equivalents (mg eq. GA g−1 DW).
Total ‘antioxidant flavonoids’ (TF) were determined by a previously described method [45], based on the nitration of aromatic rings containing a catechol group, by incubation with NaNO2, followed by reaction with AlCl3 at alkaline pH. After the reaction, the absorbance of the samples was determined at 510 nm, and TF contents were expressed as equivalents of the catechin standard (mg eq. C g−1 DW).

2.8. Statistical Analysis

The programme Statgraphics Centurion XVI (Statpoint Technologies, Warrenton, VA, USA) was used for the statistical analysis of the generated data. Before variance analysis, the validity of the normality assumption was checked by the Shapiro–Wilk test and the homogeneity of variance using the Levene test. Once it was established that ANOVA (Analysis of Variance) requirements were fulfilled, one-way ANOVA, followed by post-hoc Tukey HSD (honestly significant difference) test, was applied to analyse the effect of water stress within each variety and the effect of each treatment through varieties. All results were expressed as means (n = 5) followed by standard errors (SEs), and ANOVA was performed at the 95% confidence level. A two-way analysis of variance (ANOVA) was also performed for all determined traits to check the effects of the ‘cultivar’ and ‘treatment’ factors and the interaction between them.

2.9. Electrochemical Experiments

Electrochemical experiments were performed at 298 ± 1 K in a conventional three-electrode cell using a CH I660 potentiostat (Cambria Scientific, Wales, UK). Air-saturated 0.25 M aqueous acetic acid/sodium acetate buffer at pH 4.75 was employed as a supporting electrolyte. The electrodes consisted of a sample-modified glassy carbon working electrode (GCE) of geometrical area 0.071 cm2 (BAS MF2012, Bioanalytical Systems, West Lafayette, IN, USA), a platinum-wire auxiliary electrode and an Ag/AgCl (3 M NaCl) reference electrode. To ensure repeatability, a voltammogram at the bare electrode after mechanical cleaning in a polishing clot with alumina slurry was intercalated between successive voltammograms at the sample-modified electrode.
For electrode preparation, 3–4 seeds were crashed with an agate mortar and pestle adding 0.5 mL of ethanol (HPLC grade, Carlo Erba reagents, Sabadell, Spain) for 1 min. Then, 50 μL of the resulting suspension was dropped onto the GCE surface, and the solvent was allowed to evaporate in the air. Subsequently, the modified electrode was inserted into the electrochemical cell, and voltammetric measurements were performed. Cyclic voltammetry was used as a detection mode, and semi-derivative convolution of data was carried out to increase signal resolution. The series of anodic peaks (AE) between 0.0 and 1.2 V were considered since such peaks define a voltammetric profile characteristic of the species, the variety and the phenological and stress stages of the plant (Figure 1). In this sense, the AE region exhibits new peaks in the second anodic scan due to the response to the reactive oxygen species (ROS) produced during the analysis in the cathodic wave (Cox) process that precedes that anodic scan. ROS react with organic components of plant extracts generating new electroactive products. These components, such as phenolic compounds, are characteristic traits of the species and its stage.

3. Results

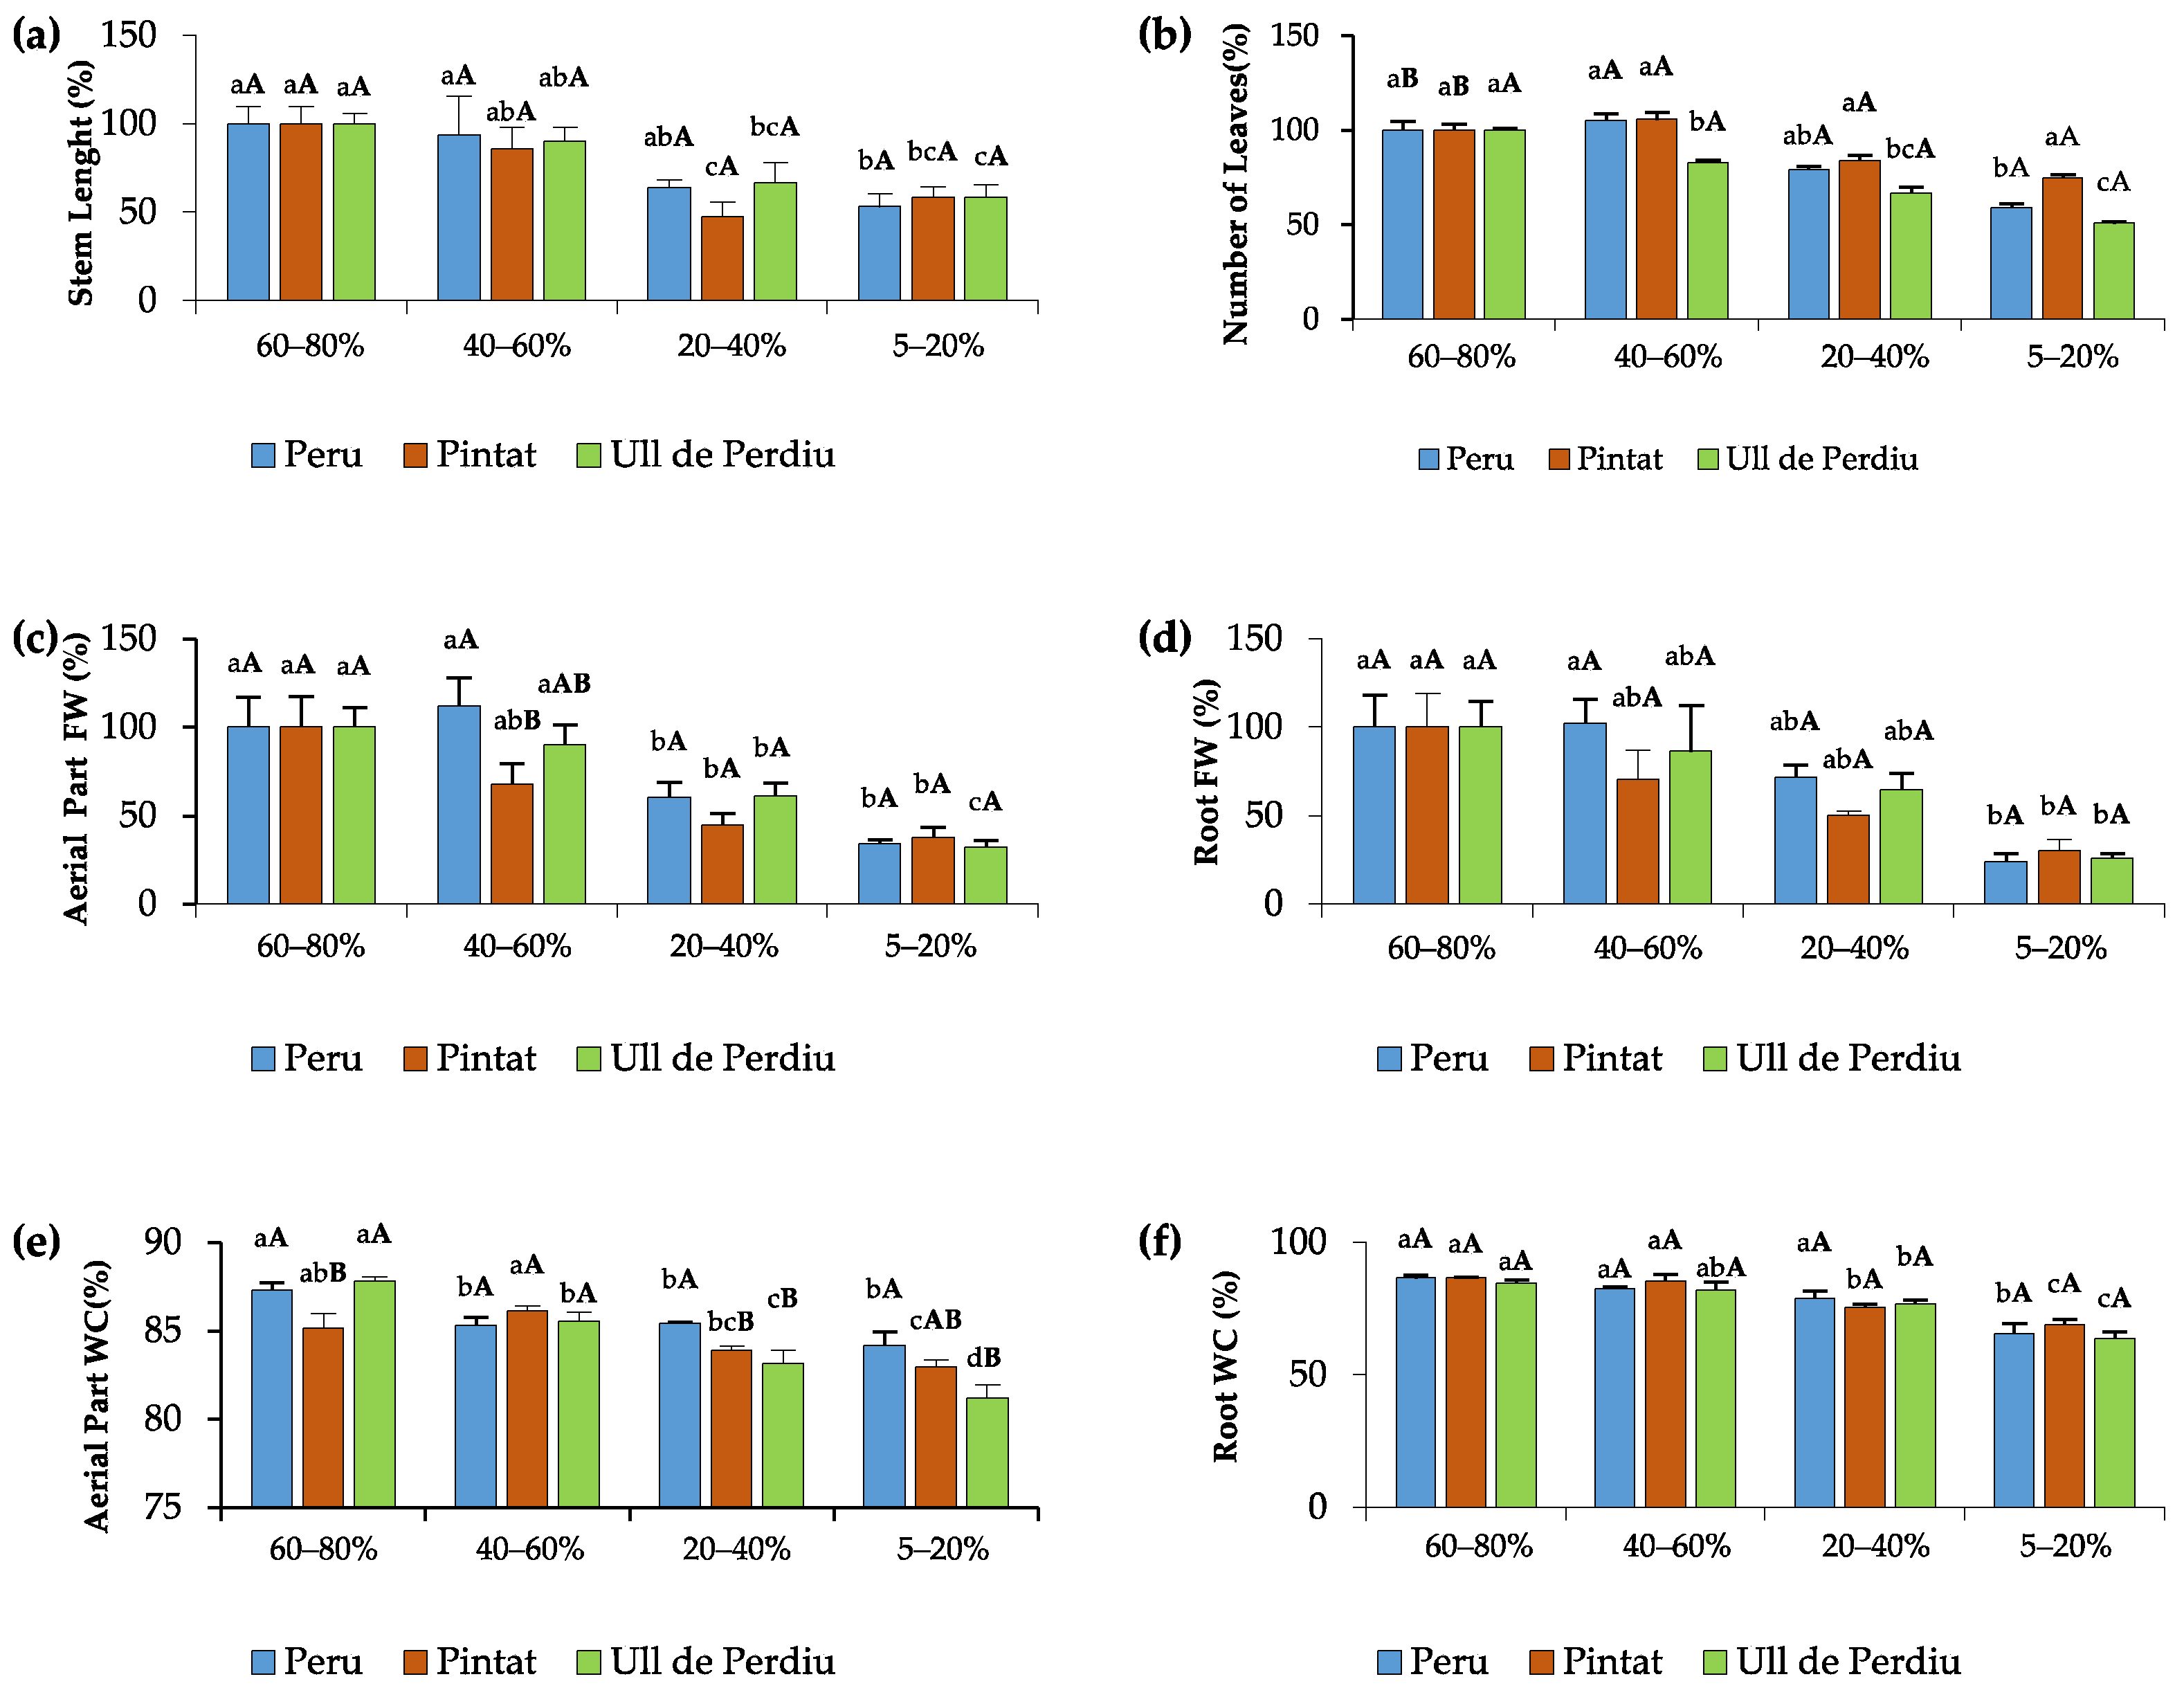
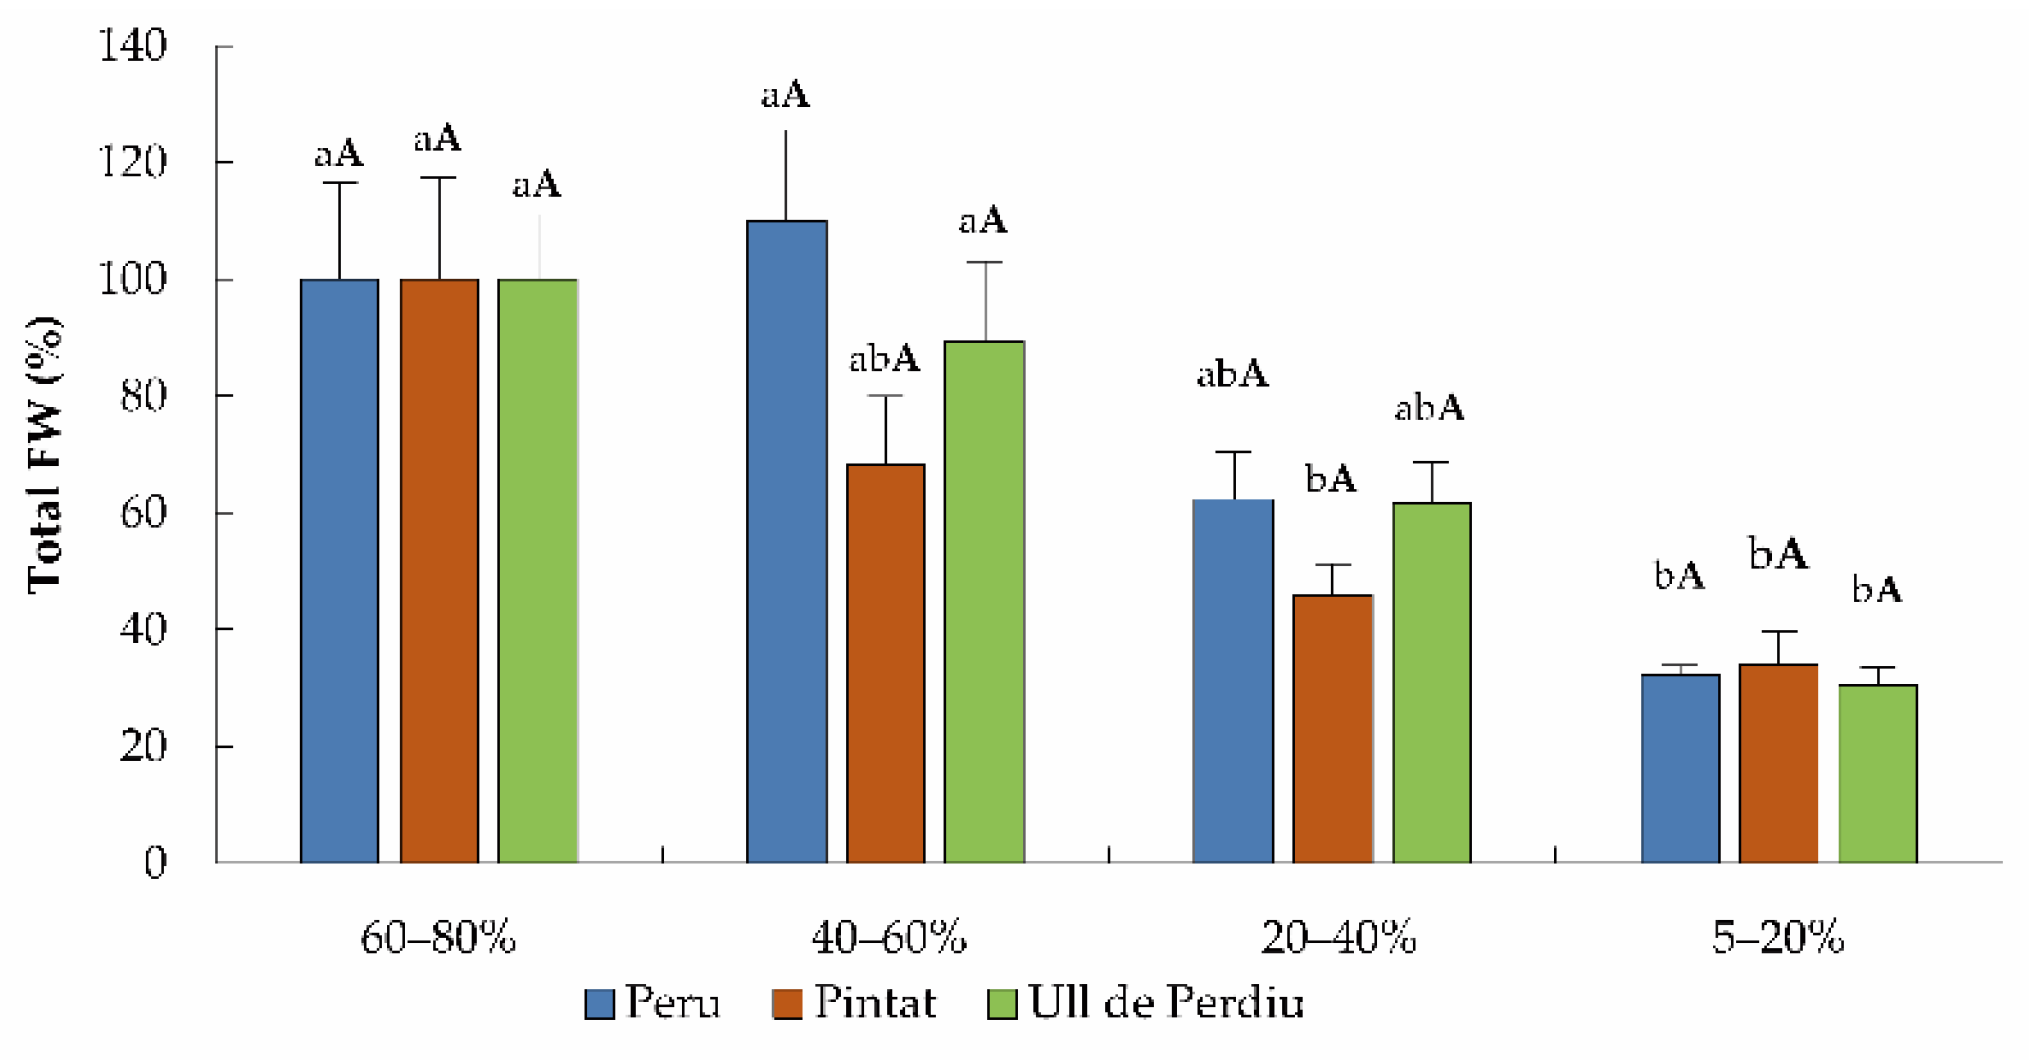
3.1. Plant Growth Analyses

After 18 days of the water stress treatments, some significant differences in growth were found, most of them between treatments within each cultivar, i.e., due to the differences in the soil moisture levels. The most relevant growth parameters are shown in Figure 2. To better compare the effects of drought on plant growth between the selected genotypes, with plants differing in size, the values of some parameters–stem length (Figure 2a) and the fresh weight of the aerial part (Figure 2c) and the roots (Figure 2d)—were expressed as percentages of the control values, those of well-irrigated plants, grown at 60–80% soil moisture level. The three cultivars showed a general trend of decreasing growth with increasing intensity of water deficit, although mild drought conditions (40–60% soil moisture) did not result in a significant reduction in the measured growth parameters. Growth inhibition was mostly reflected in the reduction of fresh weight of the aerial part (Figure 2c) and the roots (Figure 2d) of the plants. When comparing the three cultivars under water deficit conditions, some growth parameters showed average values lower for the traditional cultivars, Pintat and Ull de Perdiu, than for the commercial cultivar, Peru. However, in most cases, the differences were not statistically significant, with a few exceptions, such as the aerial part fresh weight of Pintat plants at 40–60% soil moisture (Figure 2c) or the aerial part water content of both local cultivars at 20–40% soil moisture (Figure 2e).
The above data were confirmed representing the drought-induced changes in the total fresh weight of the plants—roots plus the aerial part—that can be considered a suitable criterium to assess the relative tolerance of the three genotypes (Figure 3). In all cases, plant growth was significantly inhibited under strong water stress conditions. Comparing plants of the three cultivars, the total FW of the Pintat landrace was lower than that of the Ull de Perdiu or the commercial Peru variety under mild and moderate drought conditions: 40–60% and 20–40% soil moisture, respectively. However, these differences were not statistically significant (Figure 3). Therefore, it can be concluded that the commercial cultivar Peru is at least as tolerant to water deficit as the landraces and probably slightly more tolerant than the local cultivar Pintat.

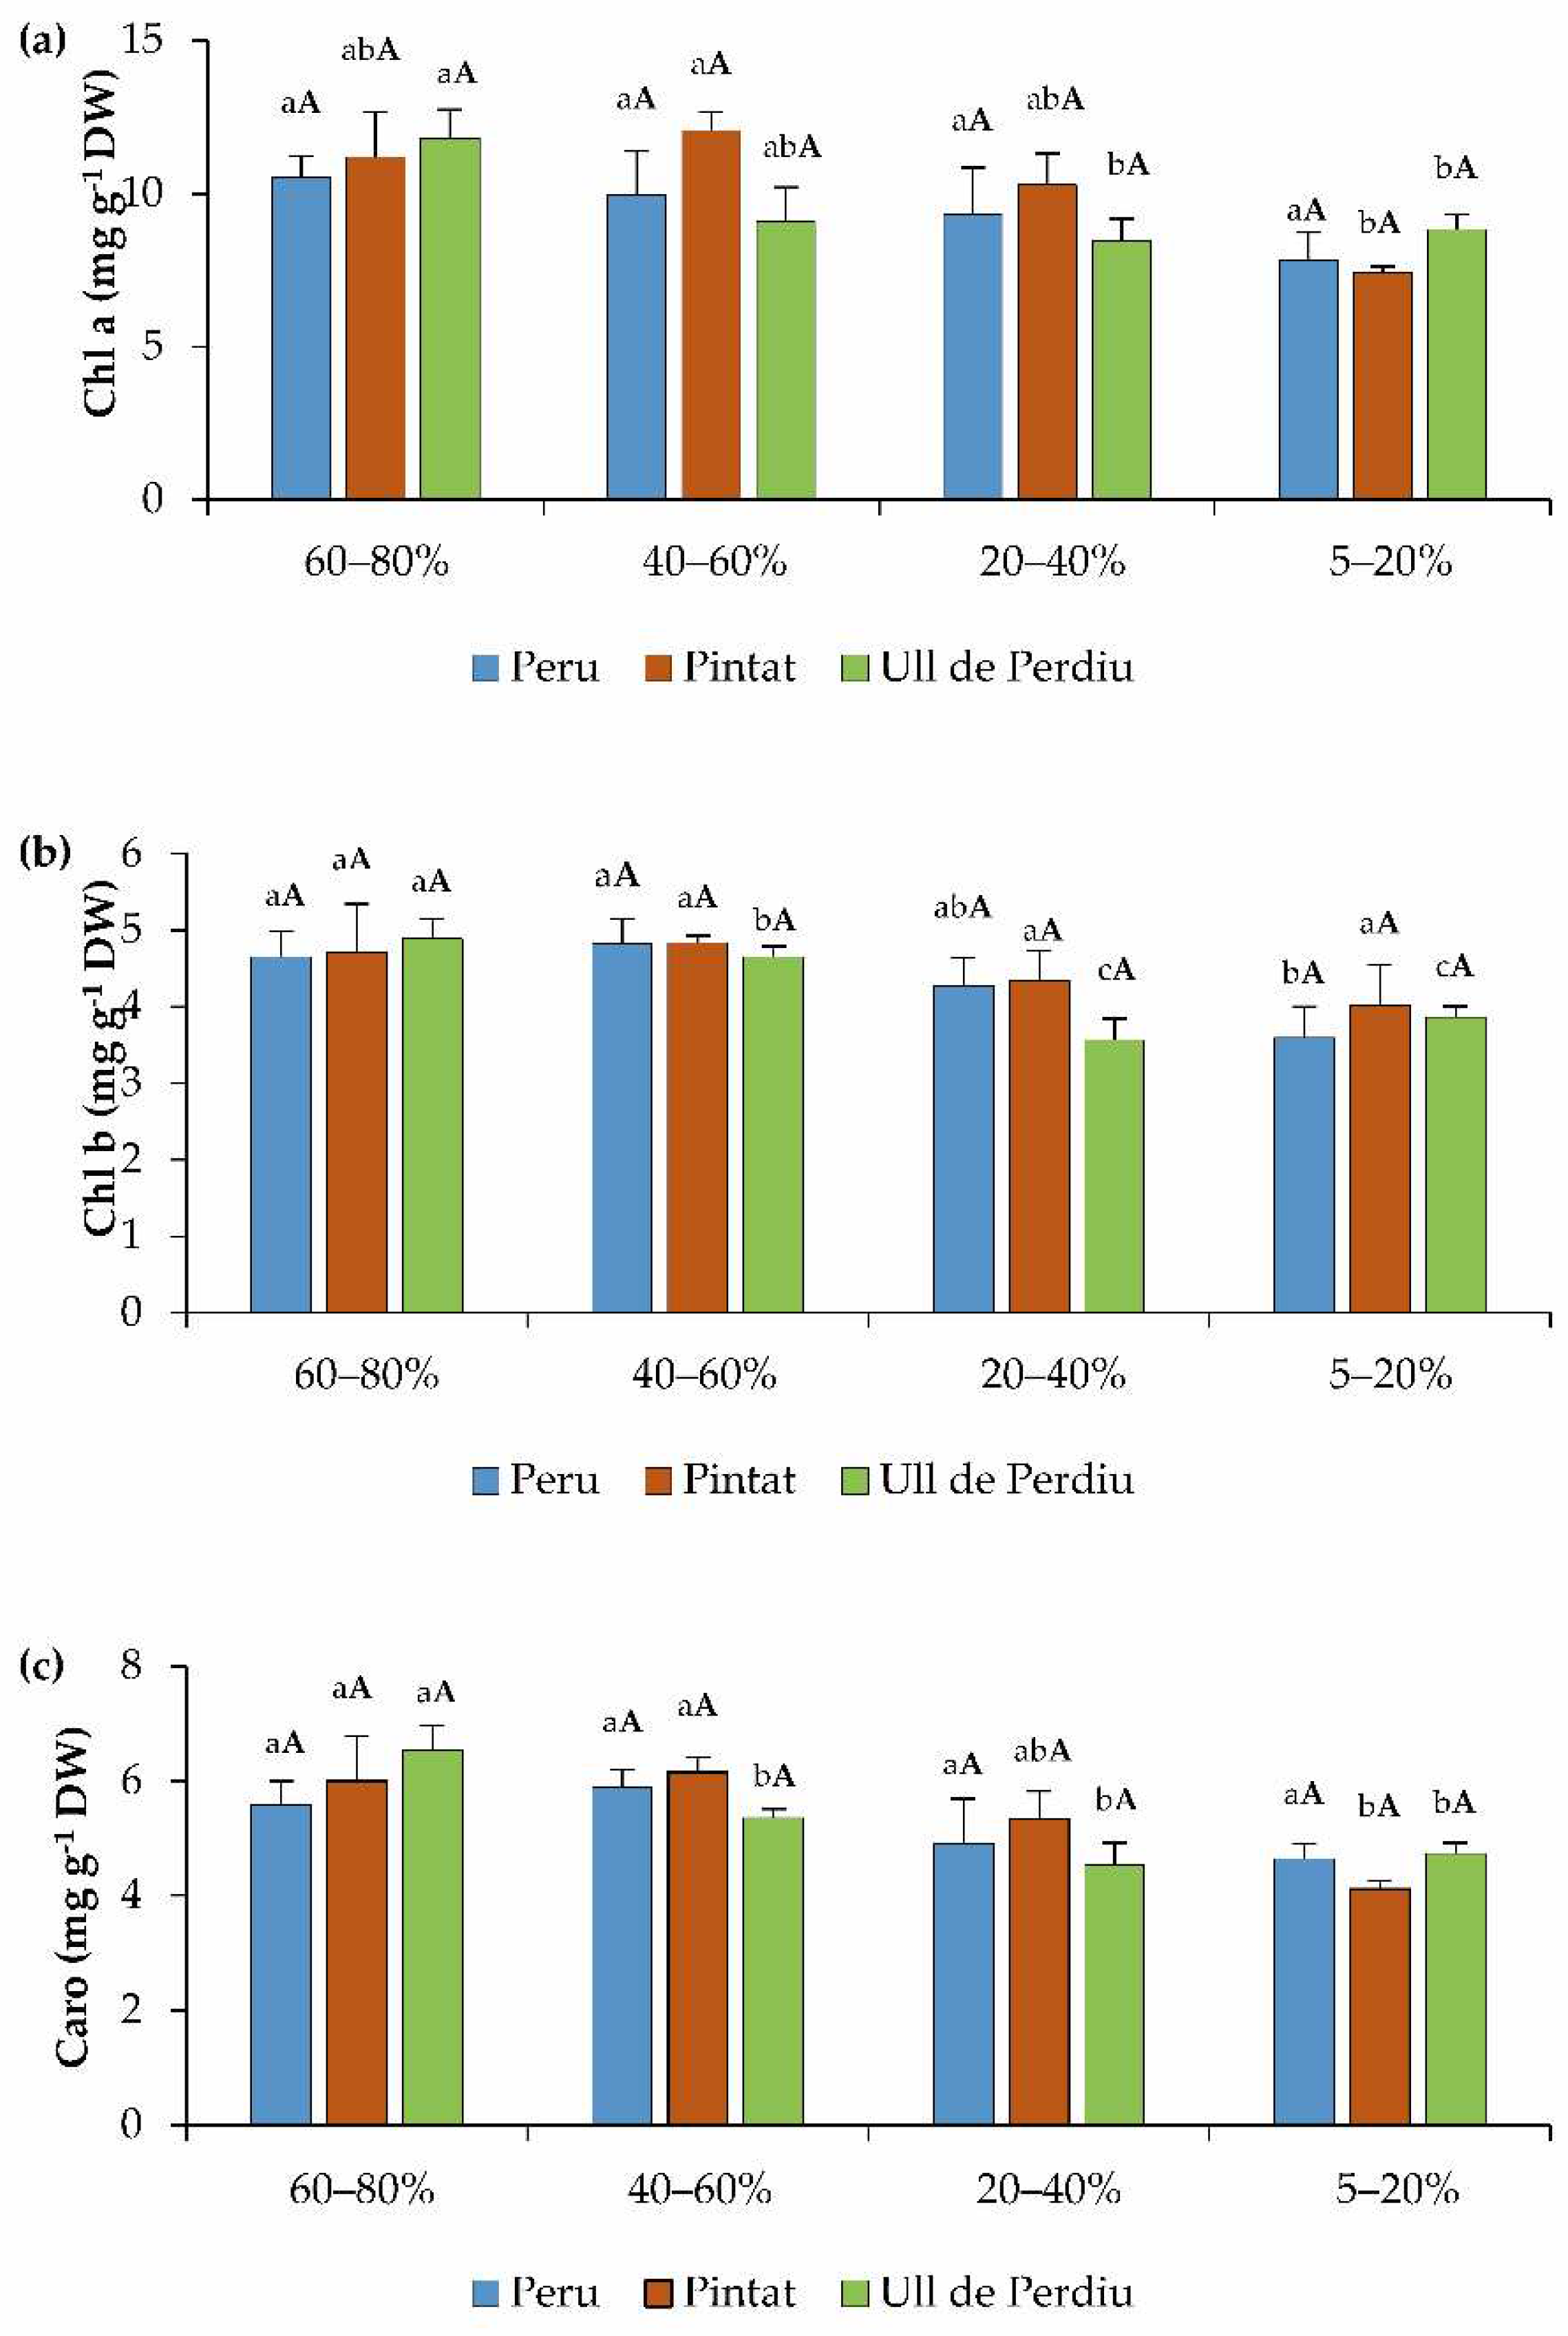
3.2. Photosynthetic Pigments

No significant differences in photosynthetic pigment contents were found between cultivars within each treatment (Figure 4), as observed in terms of growth. Water stress caused, in general, a slight reduction in pigment concentrations, particularly under the most intense drought conditions tested, but with differences between cultivars. Thus, the commercial cultivar (Peru) seemed to be the most drought-tolerant, only showing a significant reduction of Chl b at 5–20% soil moisture (Figure 4b). In Pintat plants, both Chl a and carotenoid levels decreased with respect to the control under the strongest water deficit (Figure 4a,c). The local cultivar Ull de Perdiu appears to be more sensitive to drought as the concentrations of the three pigments decreased significantly in response even to mild or moderate water deficit (Figure 4).

3.3. Ions Accumulation

Ion (Na+, Cl, K+ and Ca2+) contents were measured in the roots and leaves of the plants subjected to water stress since they may contribute to cellular osmotic balance and could therefore be involved in the drought response of this species (Table 1). In Peru and Pintat cultivars, Na+ and Cl root contents showed an increasing trend in parallel to increasing water deficit—although decreasing again at 5–20% soil moisture in the case of Cl. Plants of the Ull de Perdiu cultivar showed a different pattern, with decreasing Na+ and maintained Cl contents in response to increasing drought conditions; however, it should be mentioned that the concentrations of both ions in control plants (at 60–80% soil water content) were significantly higher than in the other two cultivars. Regarding Na+ and Cl leaf levels, no significant differences were found, in general, between the different treatments in any of the three genotypes. Moreover, there were no differences between root and leaf contents in plants subjected to the same treatment, with the only exception being Cl in Peru plants under mild and moderate drought conditions (40–60% and 20–40% soil moisture, respectively), which were significantly higher in roots than in leaves (Table 1). Root and leaf K+ contents also increased in response to water stress (with some quantitative differences between cultivars), except for K+ levels in leaves of Ull de Perdiu plants, which showed an opposite trend. Here again, in plants subjected to the same stress treatment, in most cases, no significant differences were found in roots or leaves between cultivars or between roots and leaves within the same cultivar. However, it should be mentioned that K+ concentrations in the leaves of control plants of the Pintat and, especially, the Ull de Perdiu cultivars were significantly higher than in Peru plants (Table 1).
Finally, Ca2+ concentrations did not show consistent patterns of variation in response to the water deficit treatments, neither in roots nor in leaves, when comparing different treatments for each cultivar or plants of the three cultivars subjected to the same treatment. Ca2+ levels were substantially higher in leaves than in roots, with significant differences observed for all treatments and the three cultivars (Table 1).

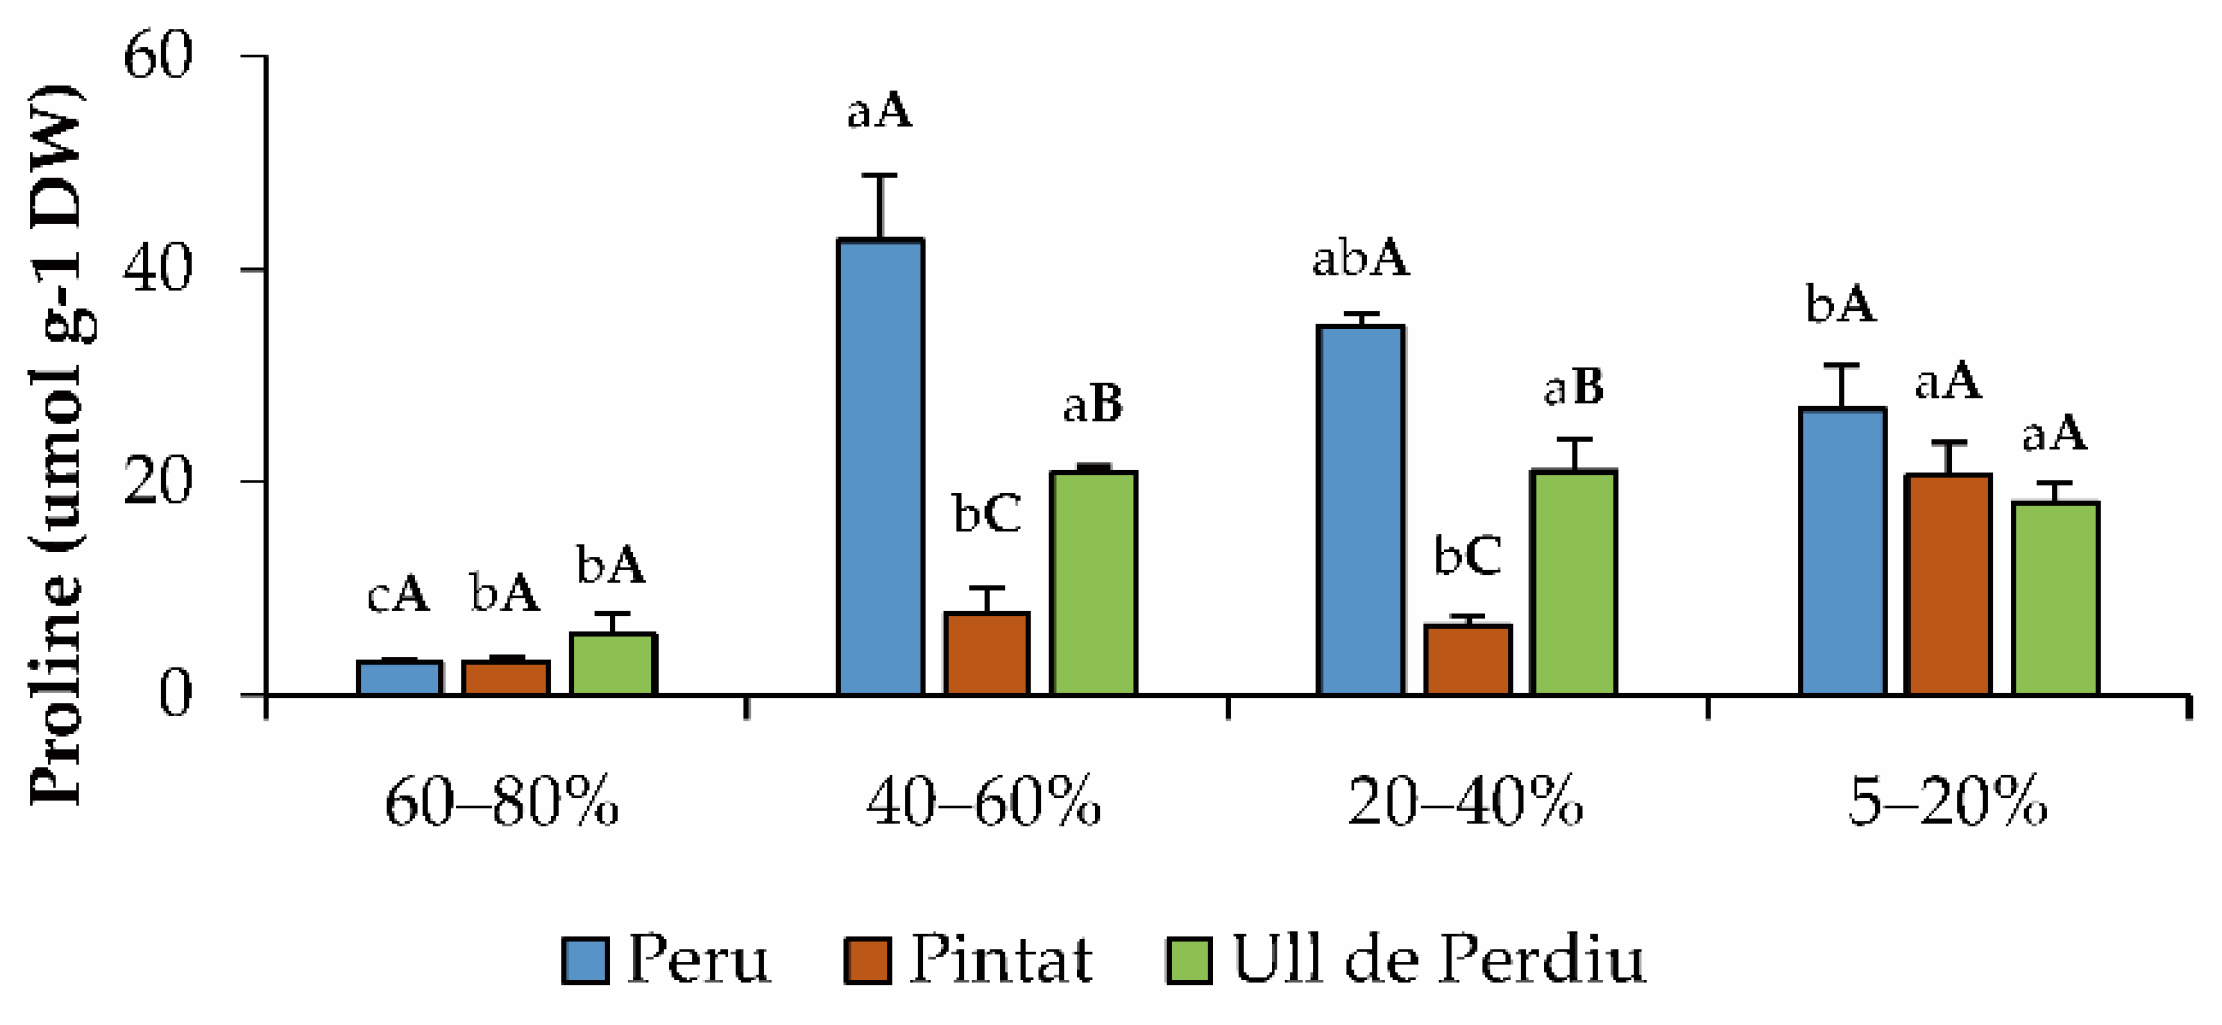
3.4. Osmolyte Quantification

Proline (Pro) leaf contents were relatively low (3 to ca. 6 μmol g−1 DW) for the three selected cultivars under control conditions and increased significantly in response to water stress, but with different patterns depending on the cultivar. In Peru plants, the maximum Pro concentration (43 μmol g−1 DW, representing a 14-fold increase over the control) was observed for the mild water stress treatment (40–60% soil moisture) to decrease progressively under stronger drought conditions. Pintat plants showed a significant increase in Pro levels, up to ca. 20 μmol g−1 DW (about 6.5-fold higher than in the control), only under the strongest water deficit conditions tested (5–20% soil water content). Finally, in the Ull de Perdiu cultivar, all water-stressed plants increased Pro contents 3.5-fold, approximately, with respect to non-stressed controls (Figure 5).

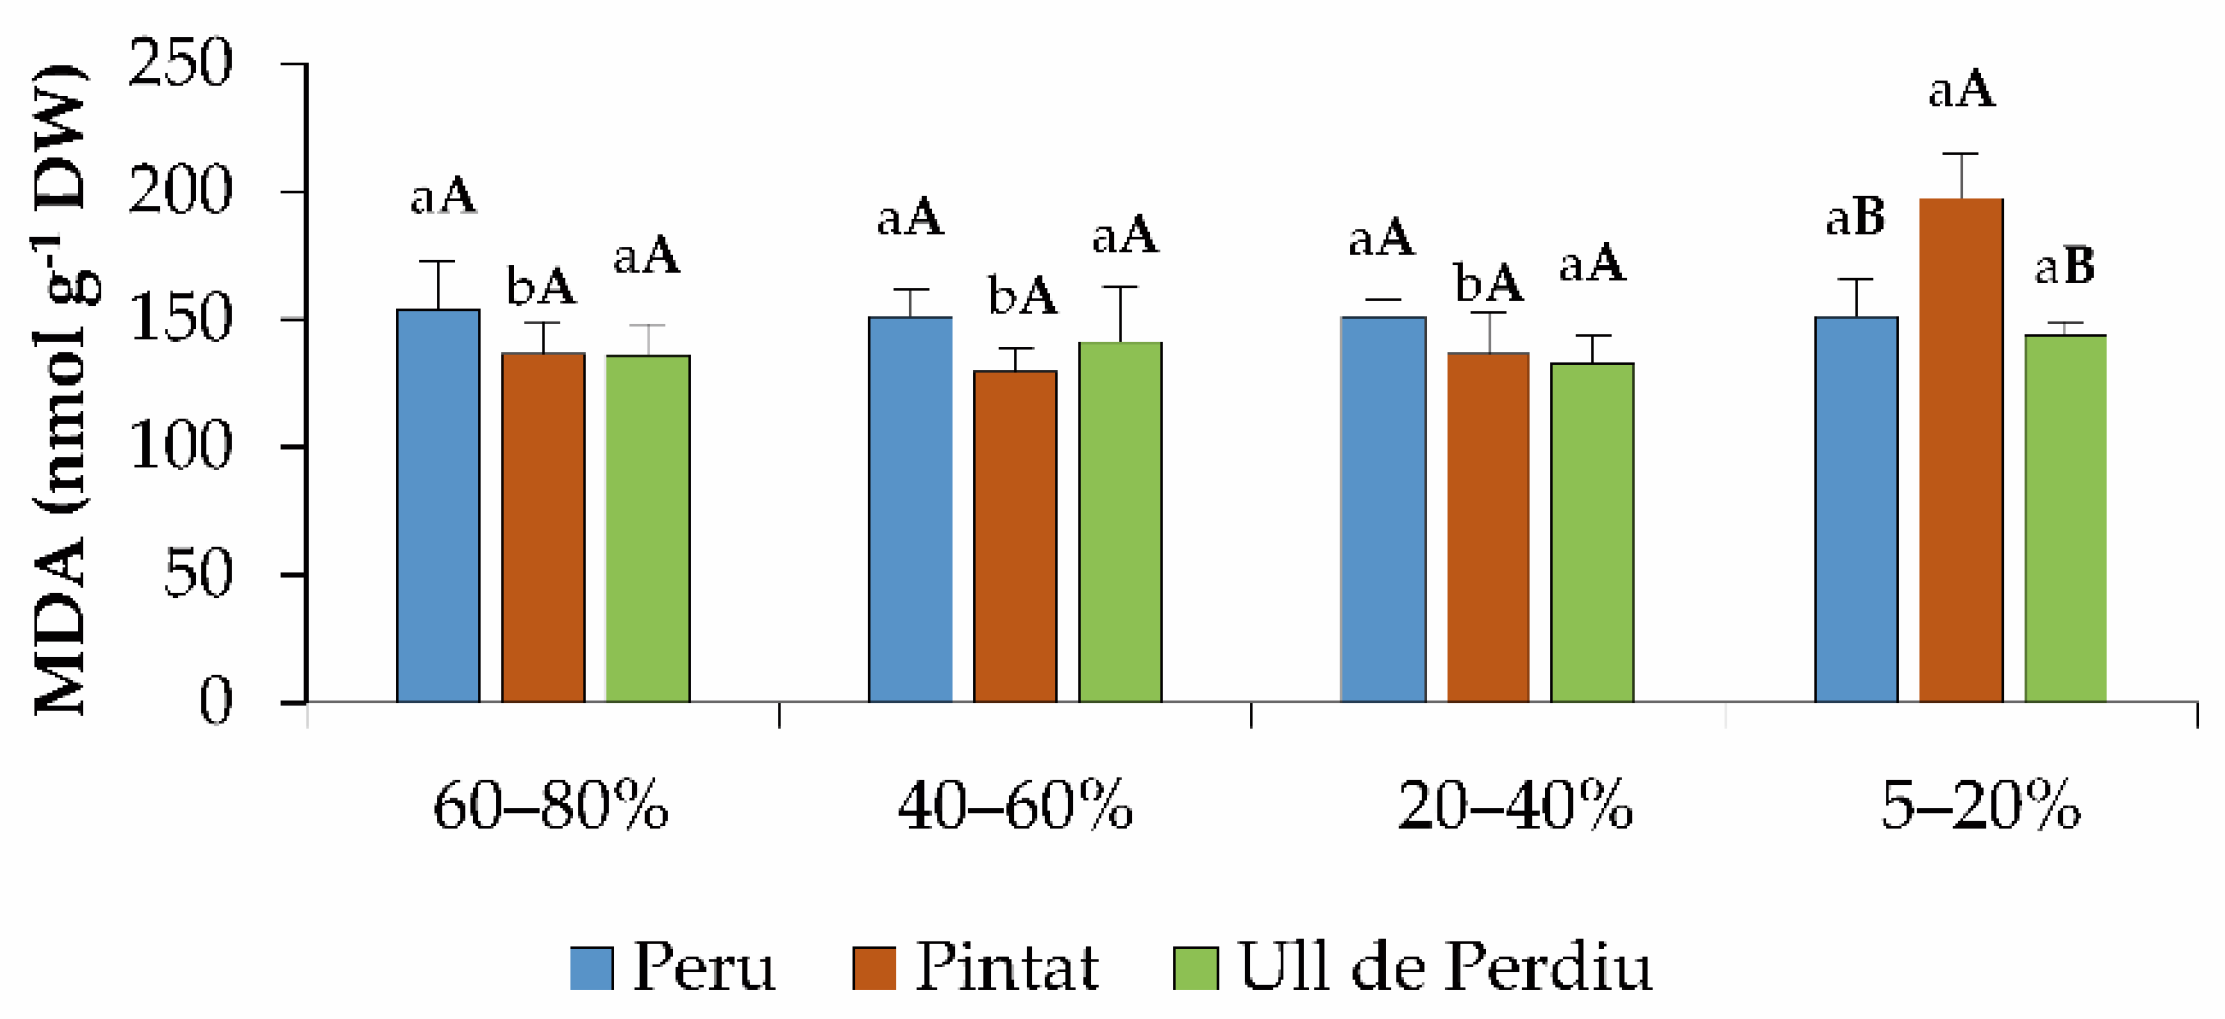
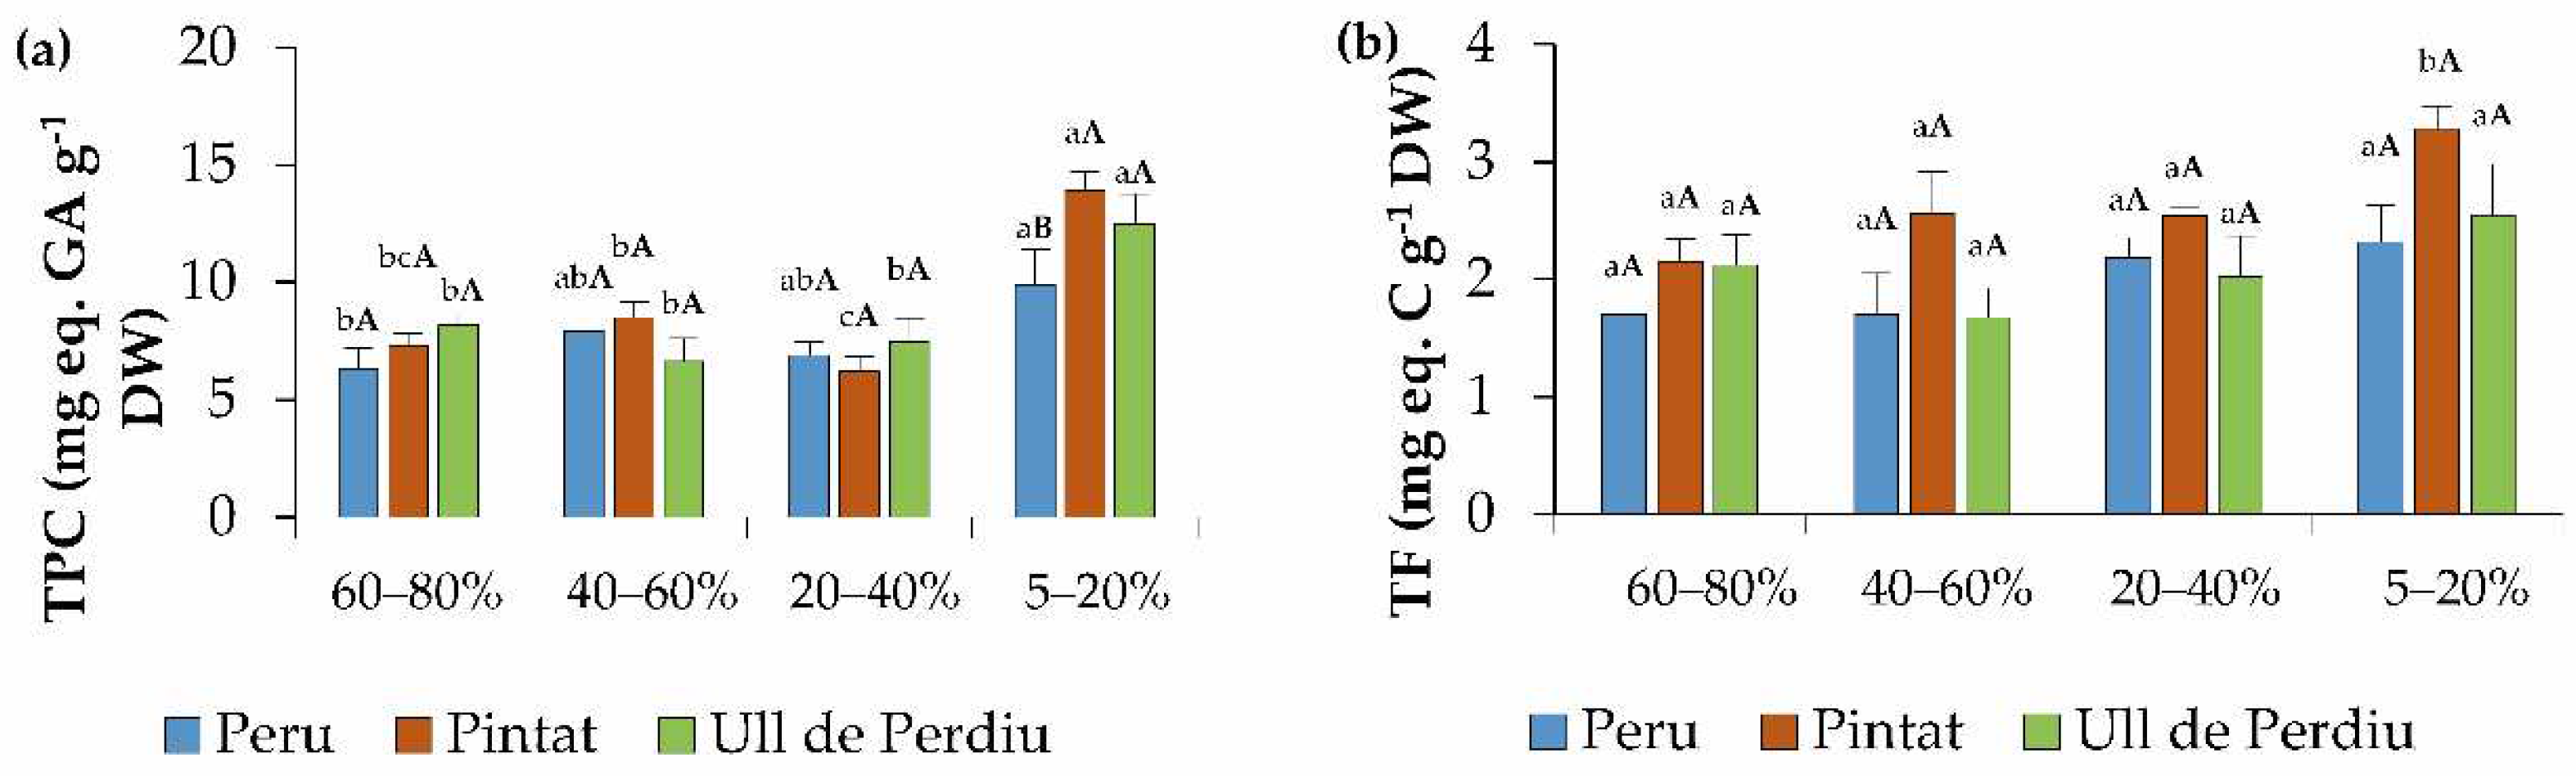
3.5. Oxidative Stress Markers and Non-Enzymatic Antioxidants

The drought treatments did not induce any changes in the leaf levels of the oxidative stress marker malondialdehyde (MDA) when comparing the three cultivars and in relation to the corresponding controls, except for the cultivar Pintat under extreme water deficit conditions (5–20% soil moisture), where slightly but significantly higher levels of this compound were observed (Figure 6).
Leaf contents of total phenolic compounds (TPC) and total flavonoids (TF), representative examples of non-enzymatic antioxidants, were measured in control and stressed plants of the three selected cultivars (Figure 7). TPC levels increased significantly, in all cultivars, only in response to the lowest soil moisture (5–20%); under these conditions, values in Pintat and Ull de Perdiu were higher than in Peru; otherwise, no significant differences were found, neither between treatments nor between genotypes (Figure 7a). Regarding TF contents, no significant differences were observed between cultivars for any drought treatment, and only ‘Pintat’ plants at 5–20% soil moisture showed a higher concentration than the control (Figure 7b).

3.6. Effects of the Studied Parameters in Water Stress Response of P. lunatus

The three cultivars apparently revealed a considerable resistance to drought stress, although showing a particular response in some variables. Therefore, to assess a general view of the hydric stress of the selected cultivars, a two-way ANOVA was performed, considering the effect on each parameter of cultivar and treatment and their interaction (Table 2).
For most analysed variables, the effect of cultivar was not significant; only stem length presented a certain level of significance related to morphological traits. The concentration of ion Ca2+, proline and flavonoids were the biochemical variables whose response depended on the genotype. On the contrary, the treatment effect was significant for most variables except for the percentage of water content in leaves and the morphological traits and some related to ions concentration: K+ in leaves. Curiously, the interaction between factors only showed a significant effect on proline, flavonoids and some ions concentrations (K+ in leaves and stem and Ca2+ in leaves and roots).

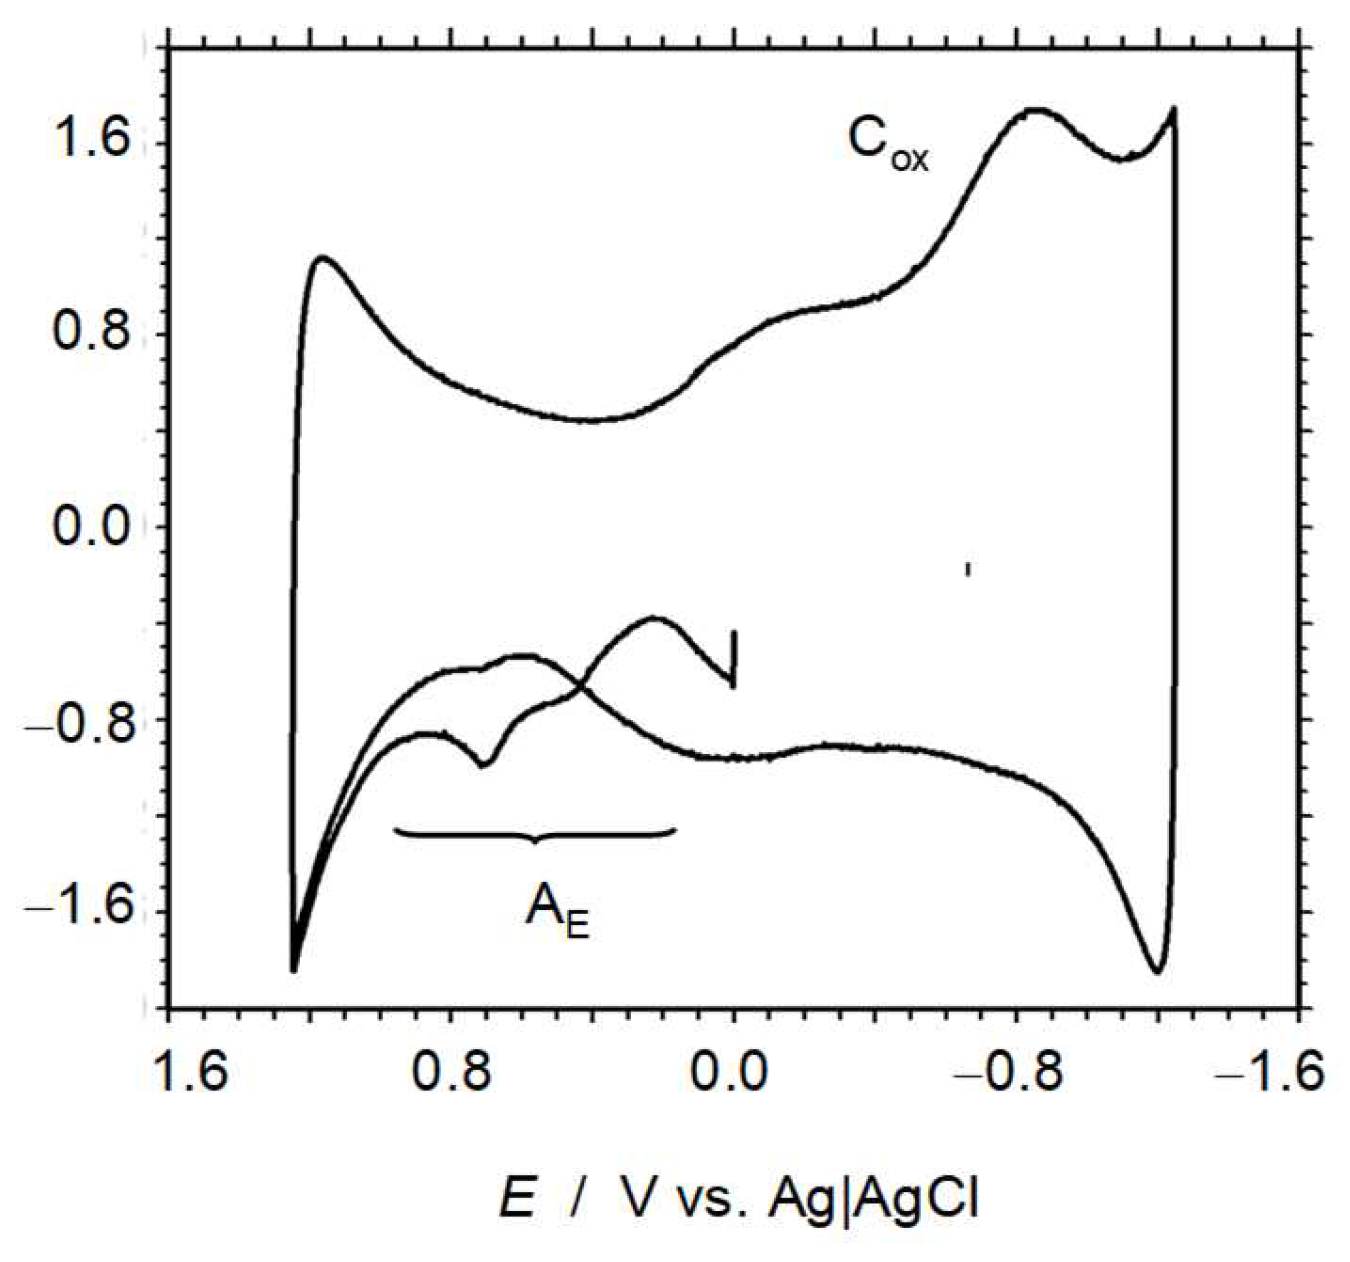
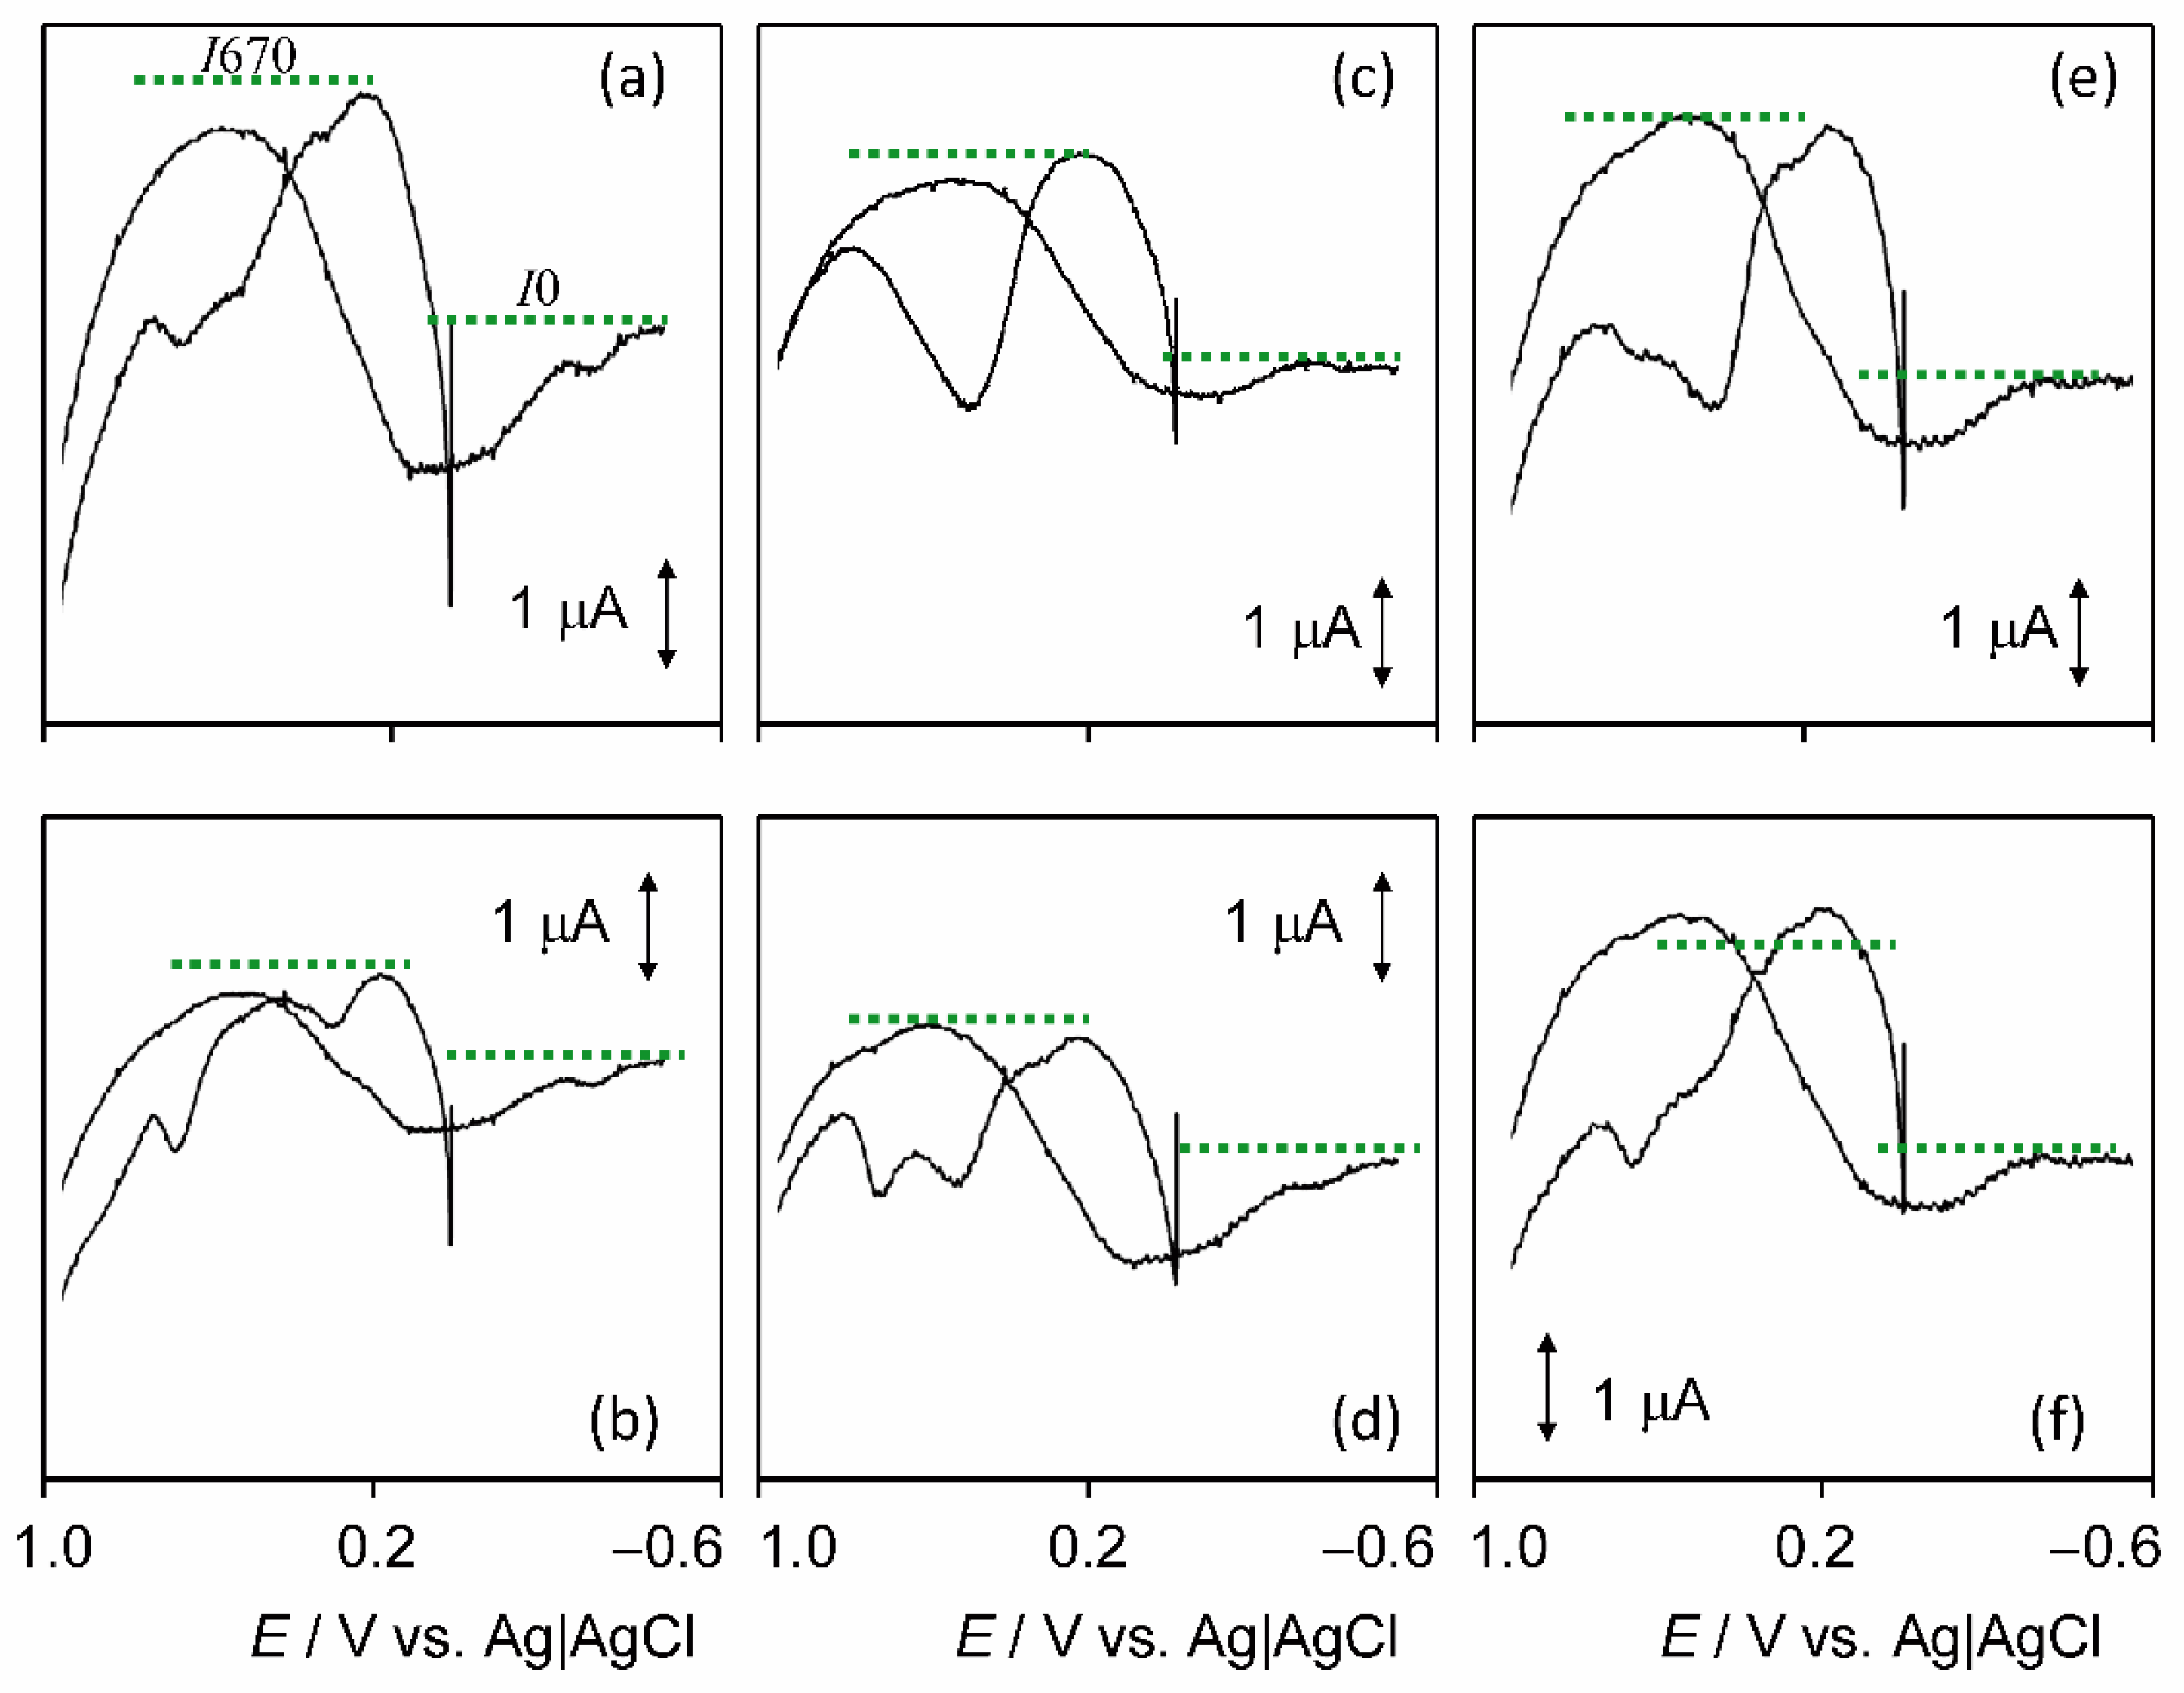
3.7. Electrochemical Experiments

All varieties show a main anodic wave at ca. 0.0 V that looks like several superimposed signals between −0.4 and 0.4 V. This signal is accompanied in the initial anodic scan by peaks at 0.27, 0.52 and 0.67 V, with their relative height varying significantly between the different cultivars (Figure 8). The signals at 0.0 and 0.27 V are maintained or even increased in the second anodic scan, whereas the signals at 0.52 and 0.67 V almost entirely disappear. These features denote that these two last signals correspond to the oxidation of polyphenolic species, which rapidly react with the ROS electrochemically generated in the process Cox that precedes the second anodic scan.
Accordingly, the signals at 0.52 and 0.67 V can be considered as representative of the ROS scavenging capacity of the plant extract. However, since there is no possibility of controlling the exact amount of plant extract transferred onto the electrode surface, only relative intensities can be used quantitatively.
Taking the baselines depicted in Figure 8 to measure peak currents, it can be observed that the intensity of the peak at 0.67 V (I670) relative to the wave at 0.0 V (I0) provides information on the ROS scavenging capacity of the cultivar when comparing control and water-stressed plants. Therefore, as the difference in the I670/I0 ratio between control and stressed plants increases, a higher capacity can be deduced due to a higher enzymatic mobilisation under stress conditions. This difference decreases from the Peru genotype to Pintat and Ull de Perdiu, these two being essentially identical; i.e., (I670/I0)Peru < (I670/I0)Pintat ≈ (I670/I0)Ull de Perdiu.
The samples undergoing water stress display similar voltammetric features, but on increasing this stress, the peak at 0.67 V increases relative to the peak at 0.52 V in all cases. This suggests that the I520/I670 peak current ratio can be used as a marker of water stress. Figure 9 presents the variation of the I520/I670 peak current ratio determined from 3–5 replicate voltammograms such as in Figure 9 with the percentage of water stress for the studied Phaseolus lunatus cultivars. The I520/I670 ratio slightly decreases on increasing the hydric stress until a more abrupt decrease appears at high hydric stress values. This last effect is more pronounced for Ull the Perdiu.

4. Discussion

Changes in environmental factors are a challenge in the selection of varieties and practices in order to minimise impacts and reduce costs in agriculture [46]. In this sense, maintaining local landraces could be an effective strategy for ensuring agrodiversity and adapting to climate change. Landraces have been used for many years in different environmental conditions and low-input farming systems as they are significantly adapted to local conditions [10]. Indeed, several authors have proven the better response in germination and growth phases of landraces versus commercial varieties [47], although commercial varieties sometimes have higher yield potential, at least in favourable seasons. Commercial cultivars are expected to be less suited to grow in suboptimal environments and, thus, will be less competitive under these conditions, where landraces are likely to have an adaptive advantage [48,49]. Our previous results on the germination stage in Phaseolus lunatus have shown higher temperature competitiveness and drought tolerance in landraces than in commercial cultivars [37]. Conversely, the data reported here on growth and biochemical responses in adult plants of the same cultivars are not as straightforward as the results in the germinative phase.
Similarly, Mabhaudhi [50] could not conclude that maize landraces would perform better than commercial hybrids under field conditions. Growth parameters showed a similar response under water stress conditions in traditional and commercial maize varieties, except for the emergence of more leaves in landraces. Similar responses in growth and some biochemical parameters in conditions of decreasing water availability were also observed in Lagenaria siceraria cultivars [51].
Consistent with these results, our findings do not confirm the observed trend in germination in terms of growth parameters in Phaseolus lunatus adult plants subjected to different levels of water stress. Peru’s commercial cultivar proved to be as tolerant as the local varieties and somewhat more tolerant than the local cultivar Pintat in the growth phase. Some growth parameters showed lower average values in the traditional cultivars than in the commercial one, although, in most cases, the differences were not statistically significant. In general, growth only decreased in plants subjected to high water deficits, and this reduction was mainly observed in the fresh weight of aerial parts and roots. Similarly, Widuri et al. [52] observed this reduction effect in Phaseolus lunatus only after a prolonged water deficit period. In this sense, other authors demonstrated that root length was positively correlated with drought resistance [52,53,54]. Khalil et al. [55] proved the role of soil texture on tolerance to water stress related to the decrease in fresh weight in roots and shoots. Similar results have been reported on other growth parameters, such as the reduction in vegetative growth or the number of leaves in Phaseolus vulgaris [56,57]. Emam et al. [58] investigated the impact of water stress on the growth and development of two common bean cultivars and concluded that all growth parameters were significantly reduced with moisture deficit.
In general, no changes in ion content are expected in plants affected by water stress. Accordingly, only minor changes were found in P. vulgaris compared to those reported in salt stress treatments [59]. However, some reports detected significant ion content variations attributed to two main causes. One was a decrease in some nutrients due to difficulties in nutrient uptake under drought conditions [60,61]. The other, an increase in ion contents in leaves as a consequence of active transport from roots to contribute to cellular osmotic adjustment [61,62]. In the three studied varieties of Lima bean, some significant fluctuations in ion concentration were found due to water stress, but without a specific or common pattern in most cases. These ion-level oscillations do not seem to be related to difficulties in nutrient uptake since there are increases in ions in some treatments, especially in the case of K+ (in roots and leaves, except in Ull de Perdiu). The involvement of this ion in salt tolerance mechanisms in P. lunatus was raised previously [63], with the most tolerant cultivars presenting high K+ contents even in non-stress treatments. In this study, the local landraces, particularly Ull de Perdiu, showed high K+ contents in plants from control, although water stress reduced its content in Ull de Perdiu, maintained it in Pintat and increased it in Peru. Therefore, the three cultivars appear to follow different strategies related to K+ to cope with drought, resulting in a similar tolerant response, even higher in the commercial variety, just contrary to the germinative phase. In addition, a higher level of Ca2+ in leaves than in roots under water stress conditions was found in the three cultivars. This divalent cation participates in multiple stress signalling pathways [64,65] and could also be involved in drought tolerance mechanisms by active transport from the roots, as it has been previously found in other crops [61].
The reduction in pigment content has been considered a typical symptom of the oxidative stress produced by water deficit [21]. In fact, a decrease in chlorophyll and carotenoid concentration has been observed in Phaseolus and other legume species under water stress conditions [66,67,68,69]. In this sense, Lima bean presented only some slight decreases due to water stress depending on the cultivar, although significant in some cases, except for Peru. This circumstance probably contributes to some mechanism of the species that confers higher resistance to osmotic stress compared to other legume species, irrespective of the cultivar assessed. This is also consistent with the absence of significant changes in chlorophyll concentrations under salt stress conditions [63]. However, similar results were found in Lagernaria siceraria, the bottle gourd, but the local varieties revealed enhanced stomatal regulation indicating better acclimation to water stress [51], so this parameter should be analysed in future trials.
Drought causes free radical formation in plants that produces oxidative stress, leading to irreversible damage to lipids and proteins [70], thus affecting the photosynthetic apparatus and the pigment contents [21]. However, P. lunatus was hardly affected in this respect. MDA is considered a suitable biomarker for directly evaluating cellular oxidative stress as it is a reactive aldehyde generated by increased free-radical production [22]; no significant increase in MDA was found in most cases, only for the Pintat landrace in the maximum water stress condition. Conversely, common bean revealed an augment of MDA levels under water stress even in tolerant genotypes [24,29,67,71,72]. These results confirm that Lima bean does not undergo oxidative stress in the same way as other closely related species and suggest its ability to activate efficient ROS scavenging mechanisms.
Polyphenols represent a large family of plant secondary metabolites induced by environmental stresses that act as antioxidants to protect against oxidative stress [24]. In this regard, a higher increase in phenolic compounds and total flavonoids was observed in the most tolerant varieties of P. vulgaris, related to lower increases in MDA [24,29,67,71,72]. However, of the analysed genotypes of P. lunatus, only the Pintat landrace showed higher levels of polyphenols. Moreover, only the extreme water stress triggered a significant increase in these metabolites. According to Fini et al. [23], antioxidant phenols and flavonoids belong to the secondary ROS scavenging systems that are activated only when the activity of the antioxidant enzymes declines under severe stress. Thus, P. lunatus appears to possess a potent enzymatic machinery that avoids oxidative stress, probably related to the ROS scavenging processes mentioned above, not shared with other Phaseolus species.
As an indirect measure of oxidative stress, voltammetric techniques have already been used to provide information about the oxidation of polyphenolic compounds in different phases of the plant’s cycle [32,73]. In the case of Phaseolus lunatus cultivars, the I520/I670 peak current ratio also might be associated with plant abiotic stress mediated by oxidative stress. Indeed, on comparing the variations of the I520/I670 ratio data with those corresponding to TPC and TF, these chemical species only increase significantly at high water stress, thus in parallel with the decrease of the I520/I670 ratio. This is consistent with the ascription of the AE voltammetric signals to the oxidation of polyphenolic components of plants, as indicated above.
The last biomarker of stress analysed was proline (Pro), a common osmolyte in plants, which accumulates in response to different types of abiotic stress, including drought, in a large number and variety of species [25,74]. Many studies reported significant increases in Pro contents in Phaseolus plants subjected to water stress [27,28,29,30,56], in which this osmolyte seems to be involved in the stress response but not in the tolerance mechanism. In the case of Lima bean, Arteaga et al. [63] found higher Pro concentration in the cultivars more tolerant to salt stress, concluding that it could play an important role in their stress tolerance. The present study revealed Pro accumulation as a common response to water stress in the three Lima bean cultivars analysed, in agreement with previously published results. However, the pattern of Pro increase was different in the three cultivars. Under mild stress conditions, the Peru cultivar showed the highest concentration, followed by Ull de Perdiu and Pintat, but all three varieties accumulated Pro to similar concentrations in response to the most stressful treatment. The commercial cultivar seems to react sooner to drought, and only under extreme conditions do the two local landraces appear to activate the tolerance mechanism in the same manner as the Peru variety.
Although the performance of local landraces was similar or even worse in some aspects than that of the commercial variety, other considerations should be made. Some improved commercial crops sometimes have other drawbacks, such as high requirements for fertilisers, pesticides and water, which raise production costs and limit their benefits [47]. In addition, in several species, the better results in the germination phase of traditional cultivars compared to commercial ones have been sufficiently demonstrated. On the other hand, the use of landraces is important for maintaining natural diversity as a cultural heritage and as a source of local adaptations. Within the framework of the 2030 Agenda, the adoption of ancient varieties and landraces promotes the valorisation of marginal areas and allows entrepreneurs to obtain higher incomes than with conventional ones, as consumers are increasingly willing to pay a higher price for local products. Finally, it should be noted that local ecotypes not only provide excellent physicochemical and sensory attributes but also contribute to sustainability as a result of the short supply chain [75].

5. Conclusions

As a corollary, P. lunatus, considering the three analysed cultivars, has proved to be a relatively water stress-tolerant species, as revealed by the slight or non-significant variations in the morphologic and biochemical markers. Subsequently, overall low levels of oxidative stress were found. Notwithstanding, just contrary to the germination phase, the commercial variety appears to be the less stressed, taking into account the global results: lower decreases in growth parameters, unaffected pigment contents, the highest increase of K+, a non-significant increase of MDA, low augment of polyphenol compounds or an earlier response of Pro. The breeders’ selective efforts are especially aimed at improving this phase, so the results presented here are probably a consequence of this selective pressure. Moreover, most of the biochemical parameters evaluated contributed to unravelling the water stress response of Lima bean, except for ions, where only K+ and Ca2+ leaves/roots ratio generated valuable information. Finally, the voltammetric method was demonstrated to be a good and quick tool for evaluating oxidative stress and, therefore, water stress in cultivated plants. The I520/I670 ratio measured in the four humidity conditions showed concordant results with those related to TPC and TF, antioxidant compounds that react with ROS species.

Author Contributions

Conceptualization, M.I.M.-N., P.S., S.G.-O. and O.M.; methodology, M.I.M.-N., P.S., S.G.-O. and O.V.; formal analysis, M.I.M.-N., P.S. and S.G.-O.; investigation, M.I.M.-N., P.S., S.G.-O., J.P.-M., A.D.-C., E.L. and A.M.T.; resources, P.S., A.D.-C. and O.V.; data curation, M.I.M.-N., P.S. and S.G.-O.; writing—original draft preparation, M.I.M.-N., P.S. and S.G.-O.; writing—review and editing, M.I.M.-N., P.S., S.G.-O. and O.M.; supervision, O.V. and O.M.; project administration, M.I.M.-N., P.S. and O.M. All authors have read and agreed to the published version of the manuscript.

Funding

This research received no external funding.

Institutional Review Board Statement

Not applicable.

Informed Consent Statement

Not applicable.

Data Availability Statement

Not applicable.

Acknowledgments

We would like to express our gratitude to Elena Estrelles, curator of the Germplasm Bank of the Jardí Botànic-ICBiBE (Universitat de València) for her engagement in the research of Lima Bean (Phaseolus lunatus L.) landraces since the beginning of seed work.

Conflicts of Interest

The authors declare no conflict of interest.

References

  1. FAO. Food and Agriculture: Key to Achieving the 2030 Agenda for Sustainable Development; Job No. I5499; Food and Agriculture Organization of the United Nations: Rome, Italy, 2016; p. 23. [Google Scholar]
  2. FAO. Transforming Our World: The 2030 Agenda for Sustainable Development. Food and Agriculture Organization of the United Nations. Available online: http://www.fao.org/ (accessed on 27 May 2022).
  3. Brundtland, G.H. What is sustainable development. In Our Common Future; Oxford University Press: New York, NY, USA, 1987. [Google Scholar]
  4. UN. Transforming Our World: The 2030 Agenda for Sustainable Development. UN General Assembly, 25 September 2015. Available online: http://www.un.org/ga/search/view_doc.asp?symbol=A/70/L.1&referer=https://www.google.es/&Lang=E.2015 (accessed on 1 May 2022).
  5. Omilola, B.; Robele, S. The Central Position of Agriculture within the 2030 Agenda for Sustainable Development; International Food Policy Research Institute: Washington, DC, USA, 2017; Volume 1683. [Google Scholar]
  6. Fita, A.; Rodríguez-Burruezo, A.; Boscaiu, M.; Prohens, J.; Vicente, O. Breeding and domesticating crops adapted to drought and salinity: A new paradigm for increasing food production. Front. Plant Sci. 2015, 6, 978. [Google Scholar] [CrossRef] [Green Version]
  7. Morton, J.F. The impact of climate change on smallholder and subsistence agriculture. Proc. Natl. Acad. Sci. USA 2007, 104, 19680–19685. [Google Scholar] [CrossRef] [Green Version]
  8. Yang, X.; Chen, F.; Lin, X.; Liu, Z.; Zhang, H.; Zhao, J.; Kenan, L.; Ye, Q.; Li, Y.; Lv, S.; et al. Potential benefits of climate change for crop productivity in China. Agric. For. Meteorol. 2015, 208, 76–84. [Google Scholar] [CrossRef]
  9. Singh, S.; Vikram, P.; Sehgal, D.; Burgueño, J.; Sharma, A.; Singh, S.K.; Sansaloni, C.P.; Joynson, R.; Brabbs, T.; Ortiz, C.; et al. Harnessing genetic potential of wheat germplasm banks through impact-oriented-prebreeding for future food and nutritional security. Sci. Rep. 2018, 8, 12527. [Google Scholar] [CrossRef] [Green Version]
  10. Gharib, M.A.A.H.; Qabil, N.; Salem, A.H.; Ali, M.M.A.; Awaad, H.A.; Mansour, E. Characterization of wheat landraces and commercial cultivars based on morpho-phenological and agronomic traits. Cereal Res. Commun. 2021, 49, 149–159. [Google Scholar] [CrossRef]
  11. Tapan, K.; Bharadwaj, C.; Rizvi, A.H.; Ashutosh, S.; Shailesh, T.; Afroz, A.; Chauhan, S.K. Chickpea landraces: A valuable and divergent source for drought tolerance. Int. J. Trop. Agric. 2015, 33, 633–638. [Google Scholar]
  12. Nelimor, C.; Badu-Apraku, B.; Tetteh, A.Y.; Garcia-Oliveira, A.L.; N’guetta, A.S.P. Assessing the potential of extra-early maturing landraces for improving tolerance to drought, heat, and both combined stresses in maize. Agronomy 2020, 10, 318. [Google Scholar] [CrossRef] [Green Version]
  13. Ochieng, G.; Ngugi, K.; Wamalwa, L.N.; Manyasa, E.; Muchira, N.; Nyamongo, D.; Odeny, D.A. Novel sources of drought tolerance from landraces and wild sorghum relatives. Crop Sci. 2021, 61, 104–118. [Google Scholar] [CrossRef]
  14. Li, X.; Liu, F. Drought stress memory and drought stress tolerance in plants: Biochemical and molecular basis. In Drought Stress Tolerance in Plants; Hossain, M., Wani, S., Bhattacharjee, S., Burritt, D., Tran, L.S., Eds.; Springer: Cham, Switzerland, 2016; Volume 1, pp. 17–44. [Google Scholar]
  15. Mantri, N.; Patade, V.; Penna, S.; Ford, R.; Pang, E. Abiotic stress responses in plants: Present and future. In Abiotic Stress Responses in Plants: Metabolism, Productivity and Sustainability; Ahmad, P., Prasad, M.N.V., Eds.; Springer: New York, NY, USA, 2012; pp. 1–19. [Google Scholar]
  16. Osakabe, Y.; Osakabe, K.; Shinozaki, K.; Tran, L. Response of plants to water stress. Front. Plant Sci. 2014, 5, 86. [Google Scholar] [CrossRef] [Green Version]
  17. Kawamitsu, Y.; Driscoll, T.; Boyer, J.S. Photosynthesis during desiccation in an intertidal alga and a land plant. Plant. Cell Physiol. 2000, 41, 344–353. [Google Scholar] [CrossRef] [Green Version]
  18. Boyer, J.S. Differing sensitivity of photosynthesis to low leaf water potentials in corn and soybean. Plant physiol. 1970, 46, 236–239. [Google Scholar] [CrossRef] [PubMed] [Green Version]
  19. Iturbe-Ormaetxe, I.; Escuredo, P.R.; Arrese-Igor, C.; Becana, M. Oxidative damage in pea plants exposed to water deficit or paraquat. Plant physiol. 1998, 116, 173–181. [Google Scholar] [CrossRef] [Green Version]
  20. Manivannan, P.; Jaleel, C.A.; Sankar, B.; Kishorekumar, A.; Somasundaram, R.; Lakshmanan, G.A.; Panneerselvam, R. Growth, biochemical modifications and proline metabolism in Helianthus annuus L. as induced by drought stress. Colloids Surf. B Biointerfaces 2007, 59, 141–149. [Google Scholar] [CrossRef]
  21. Smirnoff, N. The role of active oxygen in the response of plants to water deficit and desiccation. New Phytol. 1993, 125, 27–58. [Google Scholar] [CrossRef] [PubMed]
  22. Del Río, D.; Stewart, A.J.; Pellegrini, N. A review of recent studies on malondialdehyde as toxic molecule and biological marker of oxidative stress. Nutr. Metab. Cardiovasc. Dis. 2005, 15, 316–328. [Google Scholar] [CrossRef]
  23. Fini, A.; Brunetti, C.; Di Ferdinando, M.; Ferrini, F.; Tattini, M. Stress-induced flavonoid biosynthesis and the antioxidant machinery of plants. Plant Signal. Behav. 2011, 6, 709–711. [Google Scholar] [CrossRef]
  24. Mansori, M.; Chernane, H.; Latique, S.; Benaliat, A.; Hsissou, D.; El Kaoua, M. Seaweed extract effect on water deficit and antioxidative mechanisms in bean plants (Phaseolus vulgaris L.). J. Appl. Phycol. 2015, 27, 1689–1698. [Google Scholar] [CrossRef]
  25. Szabados, L.; Savouré, A. Proline: A multifunctional amino acid. Trends Plant Sci. 2010, 15, 89–97. [Google Scholar] [CrossRef]
  26. Verslues, P.E.; Sharma, S. Proline metabolism and its implications for plant-environment interaction. In Arabidopsis Book; American Society of Plant Biologists: Washington, DC, USA, 2010; p. 8e0140. [Google Scholar] [CrossRef] [Green Version]
  27. Ashraf, M.; Iram, A. Drought stress induced changes in some organic substances in nodules and other plant parts of two potential legumes differing in salt tolerance. Flora 2005, 200, 535–546. [Google Scholar] [CrossRef]
  28. Svetleva, D.; Krastev, V.; Dimova, D.; Mitrovska, Z.; Miteva, D.; Parvanova, P.; Chankova, S. Drought tolerance of Bulgarian common bean genotypes, characterised by some biochemical markers for oxidative stress. Cent. Eur. Agric. J. 2012, 13, 349–361. [Google Scholar] [CrossRef] [Green Version]
  29. Rosales, M.A.; Ocampo, O.; Rodríguez-Valentín, R.; Olvera-Carrillo, Y.; Acosta-Gallegos, J.; Covarrubias, A. Physiological analysis of common bean (Phaseolus vulgaris L.) cultivars uncovers characteristics related to terminal drought resistance. Plant Physiol. Biochem. 2012, 56, 24–34. [Google Scholar] [CrossRef]
  30. Morosan, M.; Al Hassan, M.; Naranjo, M.; Lopez-Gresa, M.P.; Vicente, O. Comparative analysis of drough stress responses in Phaseolus vulgaris (common bean) and P. coccineus (runner bean) cultivar. EuroBiotech. J. 2017, 1, 247–252. [Google Scholar] [CrossRef] [Green Version]
  31. Scholz, F.; Schröder, U.; Gulaboski, R.; Doménech-Carbó, A. Electrochemistry of Immobilized Particles and Droplets, 2nd ed.; Springer: Berlin/Heidelberg, Germany, 2015. [Google Scholar]
  32. Doménech-Carbó, A.; Montoya, N.; Soriano, P.; Estrelles, E. An electrochemical analysis suggests role of gynodioecy in adaptation to stress in Cortaderia selloana. Curr. Plant Biol. 2018, 16, 9–14. [Google Scholar] [CrossRef]
  33. Marselli, B.; Garcia-Gomez, J.; Michaud, P.A.; Rodrigo, M.A.; Comninellis, C. Electrogeneration of hydroxyl radicals on boron-doped diamond electrodes. J. Electrochem. Soc. 2003, 150, D79. [Google Scholar] [CrossRef]
  34. Enache, T.A.; Chiorcea-Paquim, A.M.; Fatibello-Filho, O.; Oliveira-Brett, A.M. Hydroxyl radicals electrochemically generated in situ on a boron-doped diamond electrode. Electrochem. Commun. 2009, 11, 1342–1345. [Google Scholar] [CrossRef]
  35. Kapałka, A.; Fóti, G.; Comninellis, C. The importance of electrode material in environmental electrochemistry: Formation and reactivity of free hydroxyl radicals on boron-doped diamond electrodes. Electrochim. Acta 2009, 54, 2018–2023. [Google Scholar] [CrossRef]
  36. Bellucci, E.; Bitocchi, E.; Rau, D.; Rodriguez, M.; Biagetti, E.; Giardini, A.; Attene, G.; Nanni, L.; Papa, R. Genomics of origin, domestication and evolution of Phaseolus vulgaris. In Genomics of Plant Genetic Resources; Tuberosa, R., Graner, A., Frison, E., Eds.; Springer: Dordrecht, The Netherlands, 2014; pp. 483–507. [Google Scholar]
  37. Martínez-Nieto, M.I.; Estrelles, E.; Prieto-Mossi, J.; Roselló, J.; Soriano, P. Resilience capacity assessment of the traditional Lima Bean (Phaseolus lunatus L.) landraces facing climate change. Agronomy 2020, 10, 758. [Google Scholar] [CrossRef]
  38. Lichtenthaler, H.K.; Wellburn, A.R. Determinations of total carotenoids and chlorophylls a and b of leaf extracts in different solvents. Biochem. Soc. Trans. 1983, 11, 591–592. [Google Scholar] [CrossRef] [Green Version]
  39. Weimberg, R. Solute adjustments in leaves of two species of wheat at two different stages of growth in response to salinity. Physiol. Plant. 1987, 70, 381–388. [Google Scholar]
  40. Bates, L.S.; Waldren, R.P.; Teare, I.D. Rapid determination of free proline for water stress studies. Plant Soil. 1973, 39, 205–207. [Google Scholar] [CrossRef]
  41. Gil, R.; Bautista, I.; Boscaiu, M.; Lidón, A.; Wankhade, S.; Sánchez, H.; Lilinares, J.; Vicente, O. Responses of five Mediterranean halophytes to seasonal changes in environmental conditions. AoB Plants 2014, 6, plu049. [Google Scholar] [CrossRef] [PubMed]
  42. Hodges, D.M.; DeLong, J.M.; Forney, C.F.; Prange, R.K. Improving the thiobarbituric acid-reactive-substances assay for estimating lipid peroxidation in plant tissues containing anthocyanin and other interfering compounds. Planta 1999, 207, 604–611. [Google Scholar] [CrossRef]
  43. Taulavuori, E.; Hellström, E.K.; Taulavuori, K.; Laine, K. Comparison of two methods used to analyse lipid peroxidation from Vaccinium myrtillus (L.) during snow removal, reacclimation and cold acclimation. J. Exp. Bot. 2001, 52, 2375–2380. [Google Scholar] [CrossRef] [PubMed] [Green Version]
  44. Blainski, A.; Lopes, G.C.; De Mello, J.C.P. Application and analysis of the folin ciocalteu method for the determination of the total phenolic content from Limonium brasiliense L. Molecules 2013, 18, 6852–6865. [Google Scholar] [CrossRef] [PubMed] [Green Version]
  45. Zhishen, J.; Mengcheng, T.; Jianming, W. The determination of flavonoid contents in mulberry and their scavenging effects on superoxide radicals. Food chem. 1999, 64, 555–559. [Google Scholar] [CrossRef]
  46. Grothmann, T.; Patt, A. Adaptive capacity and human cognition: The process of individual adaptation to climate change. Glob. Environ. Change. 2005, 15, 199–213. [Google Scholar] [CrossRef]
  47. Aguilar-Benítez, G.; Peña-Valdivia, C.B.; Vega, J.R.; Castro-Rivera, R.; Ramírez-Tobías, H.M. Seed germination and early root growth in common bean and maize landraces and improved cultivars at different water stress levels. Int. J. Appl. Sci. Technol. 2014, 4, 118–127. [Google Scholar]
  48. Azeez, M.A.; Adubi, A.O.; Durodola, F.A. Landraces and crop genetic improvement. In Rediscovery of Landraces as a Resource for the Future; Grillo, O., Ed.; IntechOpen: London, UK, 2018; pp. 1–20. [Google Scholar]
  49. Petropoulos, S.A.; Barros, L.; Ferreira, I.C. Rediscovering local landraces: Shaping horticulture for the future. Front. Plant Sci. 2019, 10, 126. [Google Scholar] [CrossRef] [Green Version]
  50. Mabhaudhi, T. Responses of Maize (Zea mays L.) Landraces to Water Stress Compared with Commercial Hybrids. Ph.D. Dissertation, University of KwaZulu-Natal, Pietermaritzburg, South Africa, January 2009. [Google Scholar]
  51. Sithole, N.; Modi, A.T. Responses of selected bottle gourd [Lagenaria siceraria (Molina Standly)] landraces to water stress. Acta Agric. Scand. Sect. B Soil Plant Sci. 2015, 65, 350–356. [Google Scholar] [CrossRef]
  52. Widuri, L.I.; Lakitan, B.; Sodikin, E.; Hasmeda, M.; Meihana, M.; Kartika, K.; Siaga, E. Shoot and root growth in common bean (Phaseolus vulgaris L.) exposed to gradual drought stress. AGRIVITA J. Agric. Sci. 2018, 40, 442–452. [Google Scholar] [CrossRef]
  53. IIaque, M.E.; Chang, T.T.; Tepora, N.; Loresto, G.C. Root characters as selection indices for drought resistance in rice. Philipp. J. Crop. Sci. 1989, 14, 7–9. [Google Scholar]
  54. Midaoui, E.M.; Serieys, H.; Griveau, Y.; Benbella, M.; Talouizte, A.; Bervillé, A.; Kaan, F. Effects of osmotic and water stresses on root and shoot morphology and seed yield in sunflower (Helianthus annuus L.) genotypes bred for Morocco or issued from introgression with H. argophyllus T. & G. Helia 2003, 26, 1–15. [Google Scholar]
  55. Khalil, A.M.; Murchie, E.H.; Mooney, S.J. Quantifying the influence of water deficit on root and shoot growth in wheat using X-ray Computed Tomography. AoB Plants 2020, 12, plaa036. [Google Scholar] [CrossRef] [PubMed]
  56. Arteaga, S.; Yabor, L.; Díez, M.J.; Prohens, J.; Boscaiu, M.; Vicente, O. The use of proline in screening for tolerance to drought and salinity in common bean (Phaseolus vulgaris L.) genotypes. Agronomy 2020, 10, 817. [Google Scholar] [CrossRef]
  57. Thinley, J.; Dorji, C. Screening of beans (Phaseolus vulgaris L.) genotypes for drought tolerance. BioRxiv 2021, 1–30. [Google Scholar] [CrossRef]
  58. Emam, Y.; Shekoofa, A.; Salehi, F.; Jalali, A.H. Water stress effects on two common bean cultivars with contrasting growth habits. Am. Eurasian J. Agric. Environ Sci. 2010, 9, 495–499. [Google Scholar]
  59. Boshkovski, B.; Tzerakis, C.; Doupis, G.; Zapolska, A.; Kalaitzidis, C.; Koubouris, G. Relationships of spectral reflectance with plant tissue mineral elements of common bean (Phaseolus vulgaris L.) under drought and salinity stresses. Commun. Soil Sci. Plant Anal. 2020, 51, 675–686. [Google Scholar] [CrossRef]
  60. Doğan, N.; Akinci, Ş. Effects of water stress on the uptake of nutrients by bean seedlings (Phaseolus vulgaris L.). Fresenius Environ. Bull. 2011, 20, 2163–2173. [Google Scholar]
  61. Pacheco, J.; Plazas, M.; Pettinari, I.; Landa-Faz, A.; González-Orenga, S.; Boscaiu, M.; Soler, S.; Prohens, J.; Vicente, O.; Gramazio, P. Moderate and severe water stress effects on morphological and biochemical traits in a set of pepino (Solanum muricatum) cultivars. Sci. Hortic. 2021, 284, 110143. [Google Scholar] [CrossRef]
  62. Xi, J.J.; Chen, H.Y.; Bai, W.P.; Yang, R.C.; Yang, P.Z.; Chen, R.J.; Tian-Ming Hu & Wang, S.M. Sodium-related adaptations to drought: New insights from the xerophyte plant Zygophyllum xanthoxylum. Front. Plant Sci. 2018, 9, 1678. [Google Scholar] [CrossRef]
  63. Arteaga, S.; Al Hassan, M.; Chaminda Bandara, W.M.; Yabor, L.; Llinares, J.V.; Boscaiu, M.; Vicente, O. Screening for salt tolerance in four local varieties of Phaseolus lunatus from Spain. Agriculture 2018, 8, 201. [Google Scholar] [CrossRef] [Green Version]
  64. Tuteja, N.; Mahajan, S. Calcium signaling network in plants: An overview. Plant Signal. Behav. 2007, 2, 79–85. [Google Scholar] [CrossRef] [Green Version]
  65. Bose, J.; Pottosin, I.I.; Shabala, S.S.; Palmgren, M.G.; Shabala, S. Calcium efflux systems in stress signaling and adaptation in plants. Front. Plant Sci. 2011, 2, 85. [Google Scholar] [CrossRef] [PubMed] [Green Version]
  66. Darkwa, K.; Ambachew, D.; Mohammed, H.; Asfaw, A.; Blair, M.W. Evaluation of common bean (Phaseolus vulgaris L.) genotypes for drought stress adaptation in Ethiopia. Crop J. 2016, 4, 367–376. [Google Scholar] [CrossRef] [Green Version]
  67. Kusvuran, S.; Dasgan, H.Y. Effects of drought stress on physiological and biochemical changes in Phaseolus vulgaris L. Legume Res. 2017, 40, 55–62. [Google Scholar]
  68. Mafakheri, A.; Siosemardeh, A.F.; Bahramnejad, B.; Struik, P.C.; Sohrabi, Y. Effect of drought stress on yield, proline and chlorophyll contents in three chickpea cultivars. Aust. J. Crop Sci. 2010, 8, 580–585. [Google Scholar]
  69. Singer, S.M.; Helmy, Y.I.; Karas, A.N.; Abou-Hadid, A.F. Influences of different water-stress treatments on growth, development and production of snap bean (Phaseolus vulgaris. L.). Acta Hortic. 2003, 614, 605–611. [Google Scholar] [CrossRef]
  70. Dolatabadian, A.; Sanavy, S.M.; Chashmi, N.A. The effects of foliar application of ascorbic acid (vitamin C) on antioxidant enzymes activities, lipid peroxidation and proline accumulation of canola (Brassica napus L.) under conditions of salt stress. J. Agron. Crop Sci. 2008, 194, 206–213. [Google Scholar] [CrossRef]
  71. Kusvuran, A. The effects of salt stress on the germination and antioxidative enzyme activity of Hungarian vetch (Vicia pannonica Crantz.) varieties. Legume Res. 2015, 38, 51–59. [Google Scholar] [CrossRef]
  72. Li, Z.; Peng, Y.; Ma, X. Different response on drought tolerance and post-drought recovery between the small-leafed and the large-leafed white clover (Trifolium repens L.) associated with antioxidative enzyme protection and lignin metabolism. Acta Physiol. Plant. 2013, 35, 213–222. [Google Scholar] [CrossRef]
  73. Doménech-Carbó, A.; Cervelló-Bulls, P.; González, J.M.; Soriano, P.; Estrelles, E.; Montoya, N. Electrochemical monitoring of ROS influence on seedlings and germination response to salinity stress of three species of the tribe Inuleae. RSC Adv. 2019, 9, 17856–17867. [Google Scholar] [CrossRef] [PubMed] [Green Version]
  74. Verbruggen, N.; Hermans, C. Proline accumulation in plants: A review. Amino Acids 2008, 35, 753–759. [Google Scholar] [CrossRef] [PubMed]
  75. Varia, F.; Macaluso, D.; Vaccaro, A.; Caruso, P.; Guccione, G.D. The Adoption of Landraces of Durum Wheat in Sicilian Organic Cereal Farming Analysed Using a System Dynamics Approach. Agronomy 2021, 11, 319. [Google Scholar] [CrossRef]
Figure 1. Cyclic voltammogram after semi-derivative convolution of a microparticulate deposit of the ethanolic extract of sample A−5 on GCE in contact with air-saturated 0.25 M HAc/NaAc aqueous buffer at pH 4.75. Potentials can initiate at 0.0 V vs. Ag/AgCl in the positive direction; potential scan rate 50 mV s−1.
Agronomy 12 01715 g001
Figure 2. Effect of water stress on plant growth parameters of the three Phaseolus lunatus cultivars expressed as percentage reduction with respect to their respective control (60–80% of soil moisture), where FW is ‘fresh weight’ and WC ‘water content’: stem length (a), number of leaves (b), aerial part FW (c), root FW (d), aerial part WC (e) and root WC (f). Absolute values stem length, Peru: 5.55 cm, Pintat: 5.82 cm and Ull de Perdiu: 5.51 cm. Absolute values number of leaves: Peru: 24.8, Pintat 26 and Ull de Perdiu: 36.4. Absolute values FW aerial part: Peru: 52.45 gr, Pintat: 67.23 gr and Ull de Perdiu: 60.33 gr. Absolute values FW roots: Peru: 11.40 gr, Pintat: 17.21 gr and Ull de Perdiu: 12.71 gr. Lowercase letters indicate significant differences within each cultivar and uppercase letters (in bold) between cultivars, but within treatments, according to Tukey’s test (α = 0.05). p values according to one-way ANOVA.
Agronomy 12 01715 g002
Figure 3. Effect of water stress on total fresh weight for the three Phaseolus lunatus cultivars expressed as percentage reduction with respect to their respective control (60–80% soil moisture). Absolute values of total FW: Peru: 63.84 gr, Pintat: 84.44 gr and Ull de Perdiu: 73.05 gr. Lowercase letters indicate significant differences within each cultivar and uppercase letters (in bold) between cultivars, but within treatments, according to Tukey’s test (α = 0.05). p values according to one-way ANOVA.
Agronomy 12 01715 g003
Figure 4. Chlorophyll a (Chl a) (a) chlorophyll b (Chl b) (b) and carotenoid (Caro) (c) contents in leaves of the three Phaseolus lunatus cultivars. Lowercase letters indicate significant differences within each cultivar and uppercase letters (in bold) between cultivars, but within treatments, according to Tukey’s test (α = 0.05). p values according to one-way ANOVA.
Agronomy 12 01715 g004
Figure 5. Leaf content of proline in the three Phaseolus lunatus cultivars. Lowercase letters indicate significant differences within each cultivar and uppercase letters (in bold) between cultivars, but within treatments, according to Tukey’s test (α = 0.05). p values according to one-way ANOVA.
Agronomy 12 01715 g005
Figure 6. Leaf content of malondialdehyde in the three Phaseolus lunatus cultivars. Lowercase letters indicate significant differences within each cultivar and uppercase letters (in bold) between cultivars, but within treatments, according to Tukey’s test (α = 0.05). p values according to one-way ANOVA.
Agronomy 12 01715 g006
Figure 7. Leaf contents of total phenolic compounds (TPC) (a) and total flavonoids (TF) (b) in the three Phaseolus lunatus cultivars. Lowercase letters indicate significant differences within each cultivar and uppercase letters (in bold) between cultivars, but within treatments, according to Tukey’s test (α = 0.05). p values according to one-way ANOVA.
Agronomy 12 01715 g007
Figure 8. Detail of the region between −0.6 and 1.0 V vs. Ag/AgCl in cyclic voltammograms, after semi-derivative convolution, of microparticulate deposits of ethanolic extracts of samples from Peru (a,b), Pintat (c,d) and Ull de Perdiu (e,f) cultivars, in control (a,c,e) and maximum drought stress (b,d,f). From voltammograms such as in Figure 1. The dotted lines mark the baselines used to measure the intensity of 0.67 V (I670) and 0.0 V (I0) peak currents, which provide information on the differences between cultivars in relation to ROS scavenging capacity. A higher difference between the ratios I670/I0 of control and stressed plants denotes a higher capacity and, therefore, lower oxidative damage under maximum drought conditions.
Agronomy 12 01715 g008
Figure 9. Variation of the I520/I670 peak current ratio determined in voltammograms such as in Figure 2 (from 3–5 replicate measurements) with the percentage of water stress for Peru (circles), Pintat (solid circles) and Ull the Perdiu (triangles).
Agronomy 12 01715 g009
Table 1. Root and leaf contents of sodium (Na+), chloride (Cl), potassium (K+) and calcium (Ca2+) in plants of the three Phaseolus lunatus cultivars. Lowercase letters indicate significant differences within each cultivar, uppercase letters (in bold) between cultivars within treatments and asterisk (*) between roots and leaves within treatments and cultivars according to Tukey’s test (α = 0.05). p values according to one-way ANOVA.
Soil MoisturePeruPintatUll de Perdiu
Na+ Root
(μmol g−1 DW)
60–80%295.91 ± 34.86 bB321.65 ± 36.32 bB503.79 ± 34.02 aA
40–60%499.80 ± 38.87 aA381.07 ± 74.26 abA487.52 ± 73.23 abA
20–40%393.37 ± 58.19 abA364.51 ± 17.94 abA390.07 ± 34.04 abA
5–20%380.12 ± 53.63 abA540.28 ± 90.49 aB343.88 ± 48.53 bA
Na+ Leaves
(μmol g−1 DW)
60–80%308.23 ± 34.86 aA250.67 ± 41.36 bA269.13 ± 50.06 aA
40–60%302.71 ± 33.89 aA326.87 ± 15.10 aA269.02 ± 24.02 aA
20–40%301.17 ± 32.76 aA313.45 ± 6.95 abA276.01 ± 17.49 aA
5–20%263.03 ± 09.65 aB330.62 ± 11.14 aA356.82 ± 30.56 aA
Cl Root
(μmol g−1 DW)
60–80%227.38 ± 25.72 bcAB177.69 ± 19.95 aB301.86 ± 33.22 aA
40–60%338.73 ± 48.57 abA *239.55 ± 38.95 aA281.08 ± 40.04 aA
20–40%439.60 ± 56.82 aA *287.40 ± 57.14 aA305.70 ± 25.62 aA
5–20%178.87 ± 19.91 cA178.45 ± 48.00 aA245.98 ± 31.55 aA
Cl Leaves
(μmol g−1 DW)
60–80%181.65 ± 41.12 aB356.60 ± 68.63 aA204.14 ± 25.19 aAB
40–60%152.74 ± 18.00 aA180.40 ± 37.73 bA217.15 ± 58.82 aA
20–40%204.76 ± 22.70 aA222.01 ± 42.04 abA262.92 ± 29.17 aA
5–20%186.88 ± 21.27 aA230.95 ± 56.43 abA257.46 ± 4.31 aA
K+ Root
(μmol g−1 DW)
60–80%467.11 ± 67.33 bA353.13 ± 95.19 cA424.67 ± 94.20 bA
40–60 %618.32 ± 58.03 abA460.17 ± 42.41 bcA488.54 ± 76.55 bA
20–40%707.85 ± 58.46 aA572.51 ± 47.04 bAB473.84 ± 29.83 bB
5–20%791.67 ± 26.97 aA798.49 ± 33.52 aA774.64 ± 66.95 aA*
K+ Leaves
(μmol g−1 DW)
60–80%288.55 ± 67.07 bC640.44 ± 63.90 aB*957.82 ± 91.66 aA*
40–60%662.42 ± 109.57 abA561.75 ± 82.32 aA615.66 ± 106.76 bA
20–40%799.27 ± 193.30 aA493.82 ± 47.53 aA513.25 ± 53.76 abA
5–20%671.87 ± 132.63 abA679.04 ± 155.30 aA294.61 ± 51.19 cB
Ca2+ Root
(μmol g−1 DW)
60–80%9.44 ± 2.58 bA21.36 ± 8.41 bA22.07 ± 12.36 aA
40–60%21.09 ± 7.25 bA17.88 ± 0.77 bA19.22 ± 5.71 aA
20–40%69.45 ± 9.18 aA42.24 ± 3.36 aA16.45 ± 2.47 aB
5–20%27.28 ± 6.69 bA11.49 ± 2.48 bB8.77 ± 0.23 aB
Ca2+ Leaves
(μmol g−1 DW)
60–80%145.22 ± 25.83 bB *309.39 ± 24.20 aA *178.85 ± 9.84 bcB *
40–60%258.61 ± 18.42 aAB *272.98 ± 31.37 aA *149.92 ± 47.92 cB *
20–40%323.95 ± 40.42 aA *301.53 ± 23.55 aA *278.91 ± 38.99 aA *
5–20%139.14 ± 20.58 bB *178.59 ± 29.76 bB *259.60 ± 15.33 abA *
Table 2. Two-way analysis of variance (ANOVA) testing the effect of cultivar and treatment (percentage interval of humidity) and their interactions for all morphological and biochemical traits analysed. Numbers represent F values. Asterisks indicate the degree of significance: * p < 0.05, ** p < 0.01; *** p < 0.001, n.s. = not significant.
TraitCultivarTreatmentInteractionResidual
Stem Length (cm)9.48 *42.09 ***2.27 n.s.46.16
Leaves Fresh Weight0.30 n.s.59.54 ***3.64 n.s.36.51
Leaves: % Water0.03 n.s.12.67 n.s.3.55 n.s.83.79
Root Fresh Weight2.18 n.s.50.75 ***2.93 n.s.44.15
Root: % water1.13 n.s.69.03 ***2.15 n.s.25.23
Leaves_Na+0.77 n.s.4.92 n.s.16.47 n.s.77.84
Leaves_K+0.04 n.s.1.18 n.s.41.24 ***57.55
Leaves_Ca2+6.74 *22.62 ***28.98 ***43.63
Leaves_Cl8.51 n.s.6.26 n.s.14.11 n.s.69.38
Root_Na+1.60 n.s.6.25 n.s.25.73 *66.43
Root_K+6.19 n.s.48.76 ***4.61 n.s.40.08
Root_Ca2+9.44 *28.76 ***25.93 **36.70
Root_Cl9.49 *25.83 **12.22 n.s.53.62
Proline17.37 ***23.28 ***30.71 ***30.29
Chl a0.97 n.s.17.64 *10.10 n.s.71.94
Chl b0.60 n.s.31.55 ***8.75 n.s.59.09
Carotenoids1.98 n.s.22.38 *5.33 n.s.70.95
Flavonoids16.43 **17.99 **4.97 n.s.60.62
Phenols2.99 n.s.48.92 ***8.56 n.s.39.53
MDA0.01 n.s.16.56 *12.03 n.s.71.32
Publisher’s Note: MDPI stays neutral with regard to jurisdictional claims in published maps and institutional affiliations.

