
Effect of Harvesting Time on the Chemical Composition of Cynara cardunculus L. var. altilis Blades

 ,
,  , ,
, ,  and
and
Abstract
:1. Introduction
2. Materials and Methods
2.1. Plant Material
2.2. Analysis of Chemical Composition
2.2.1. Fatty Acids
2.2.2. Tocopherols
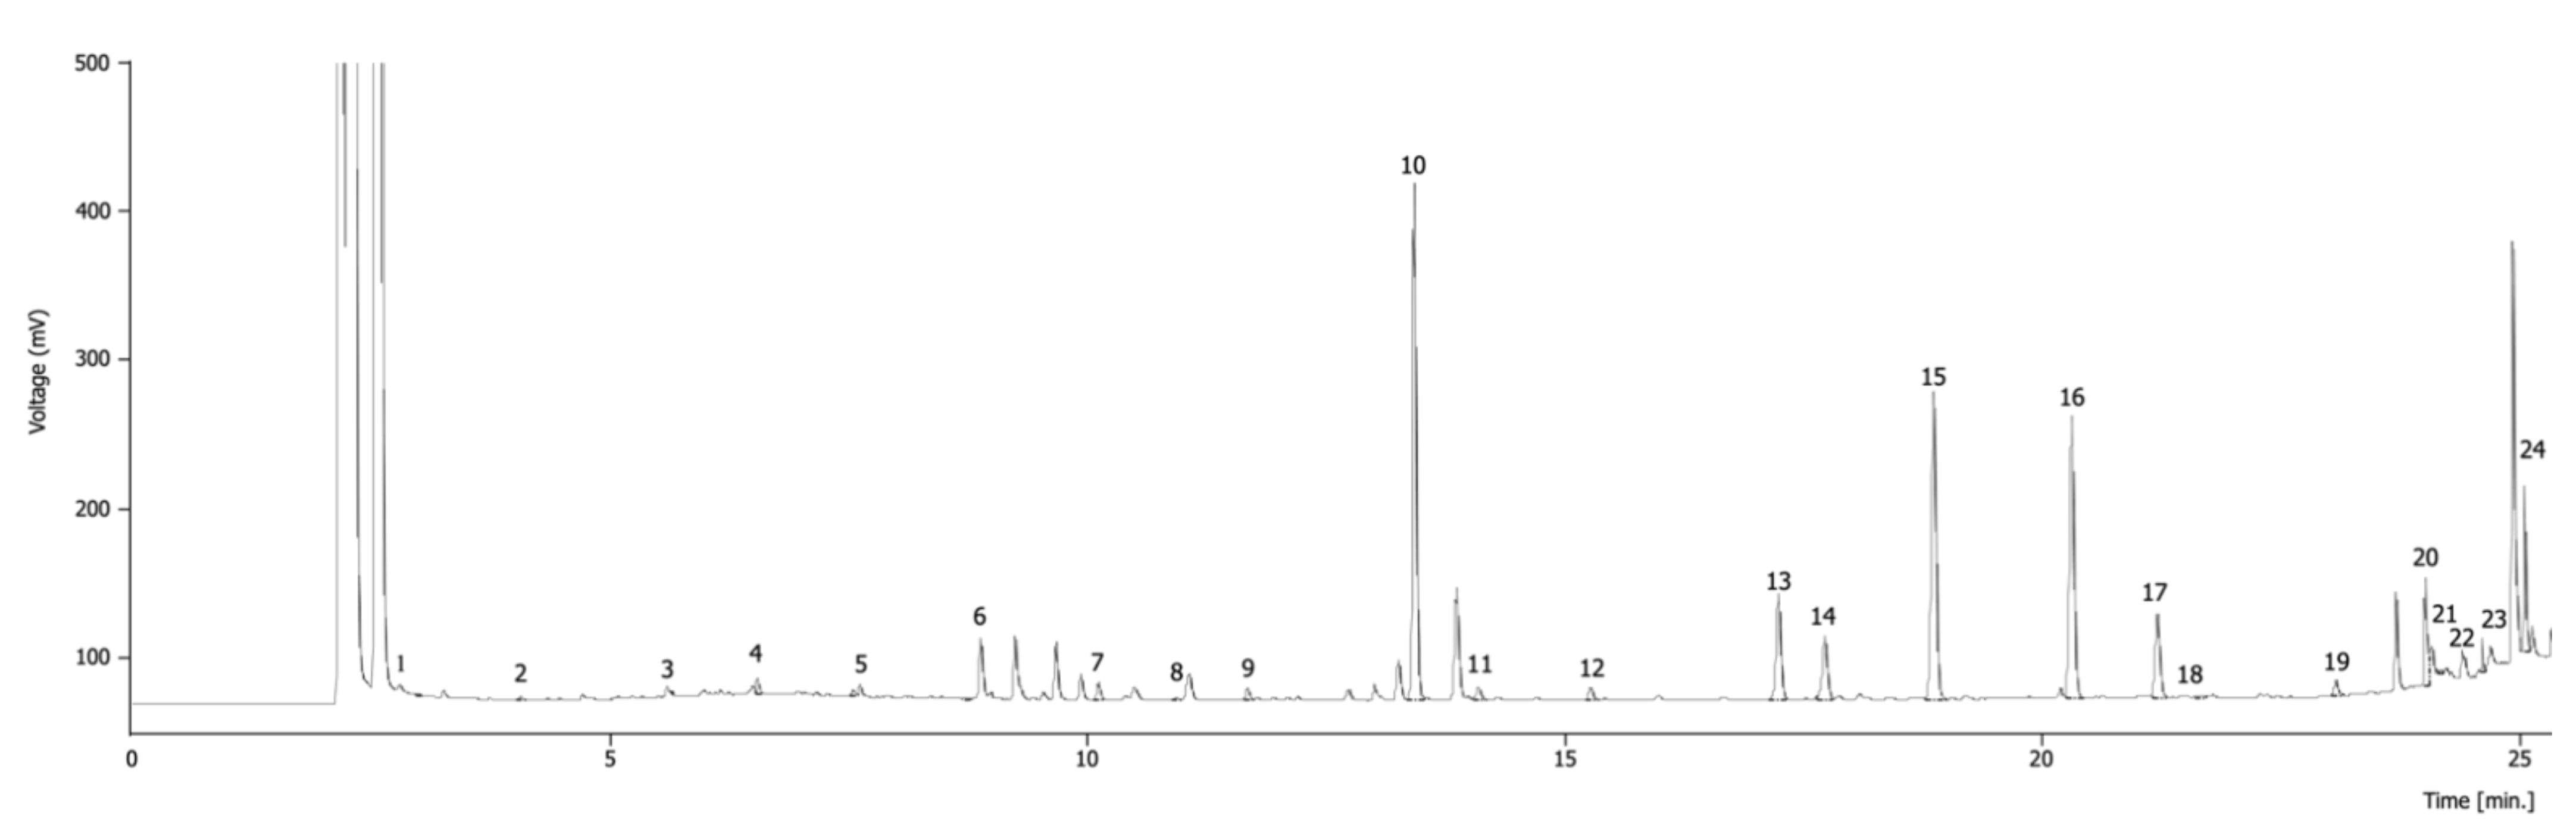
2.2.3. Free Sugars
2.2.4. Organic Acids
2.3. Statistical Analysis
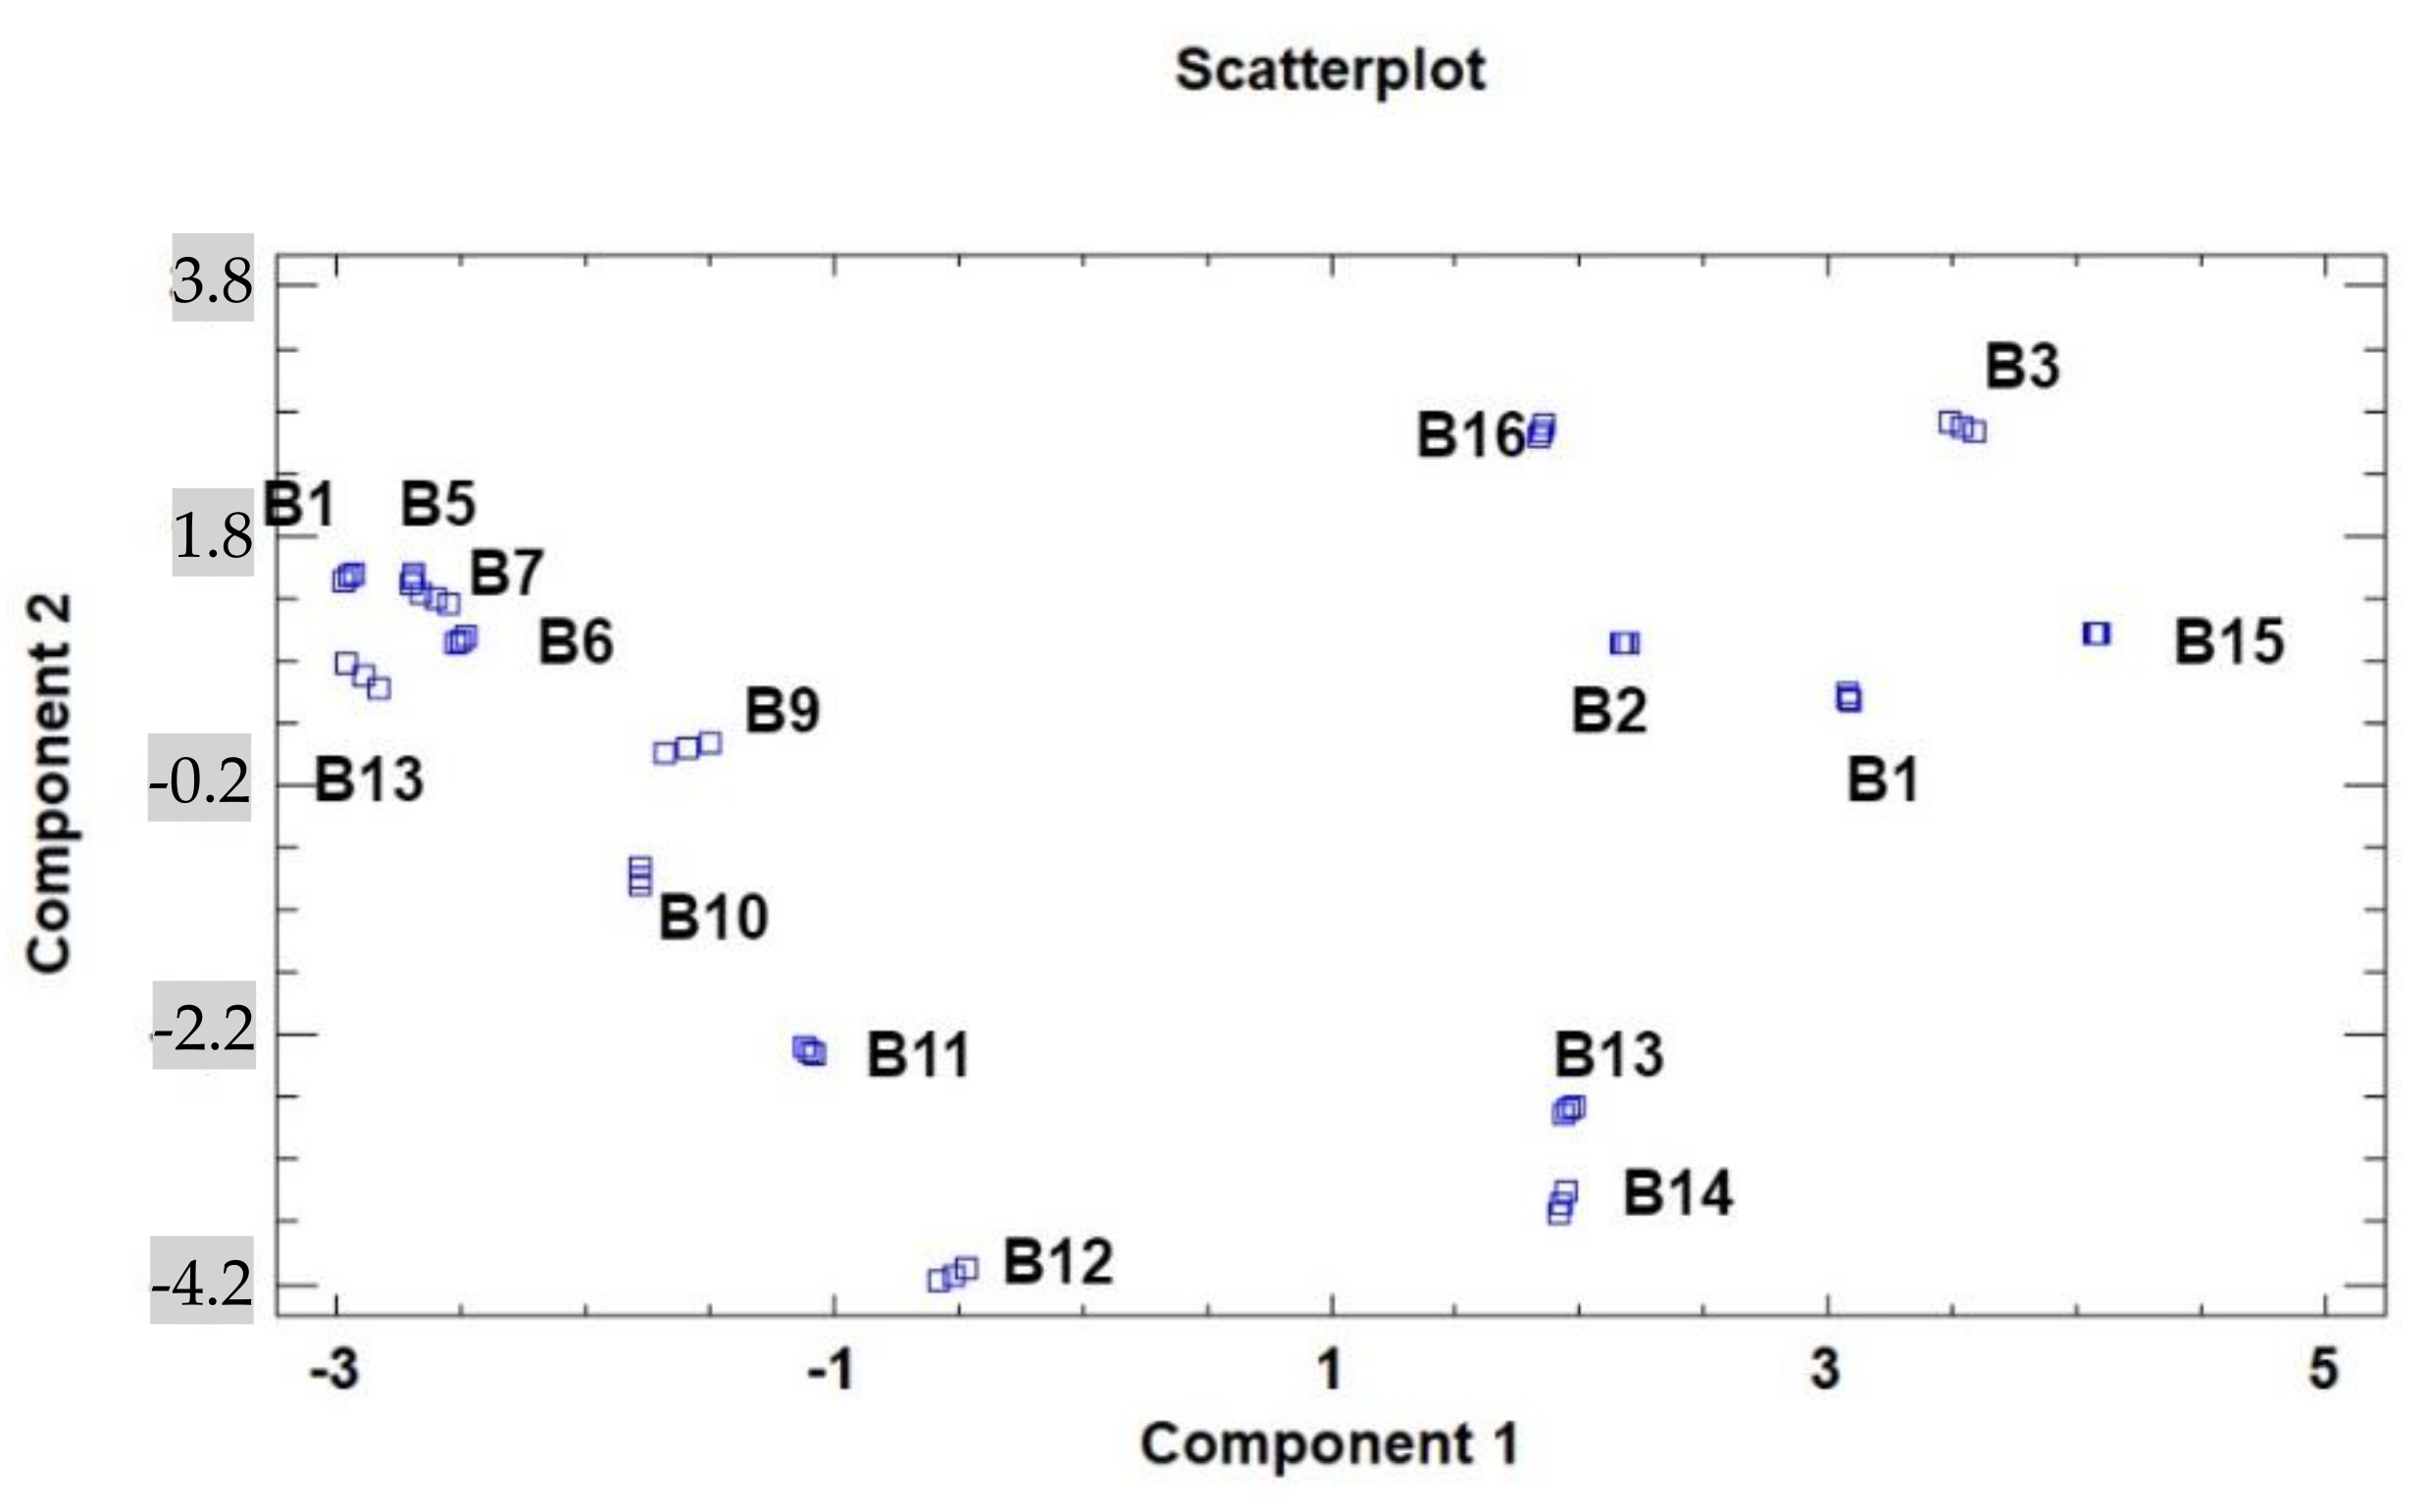
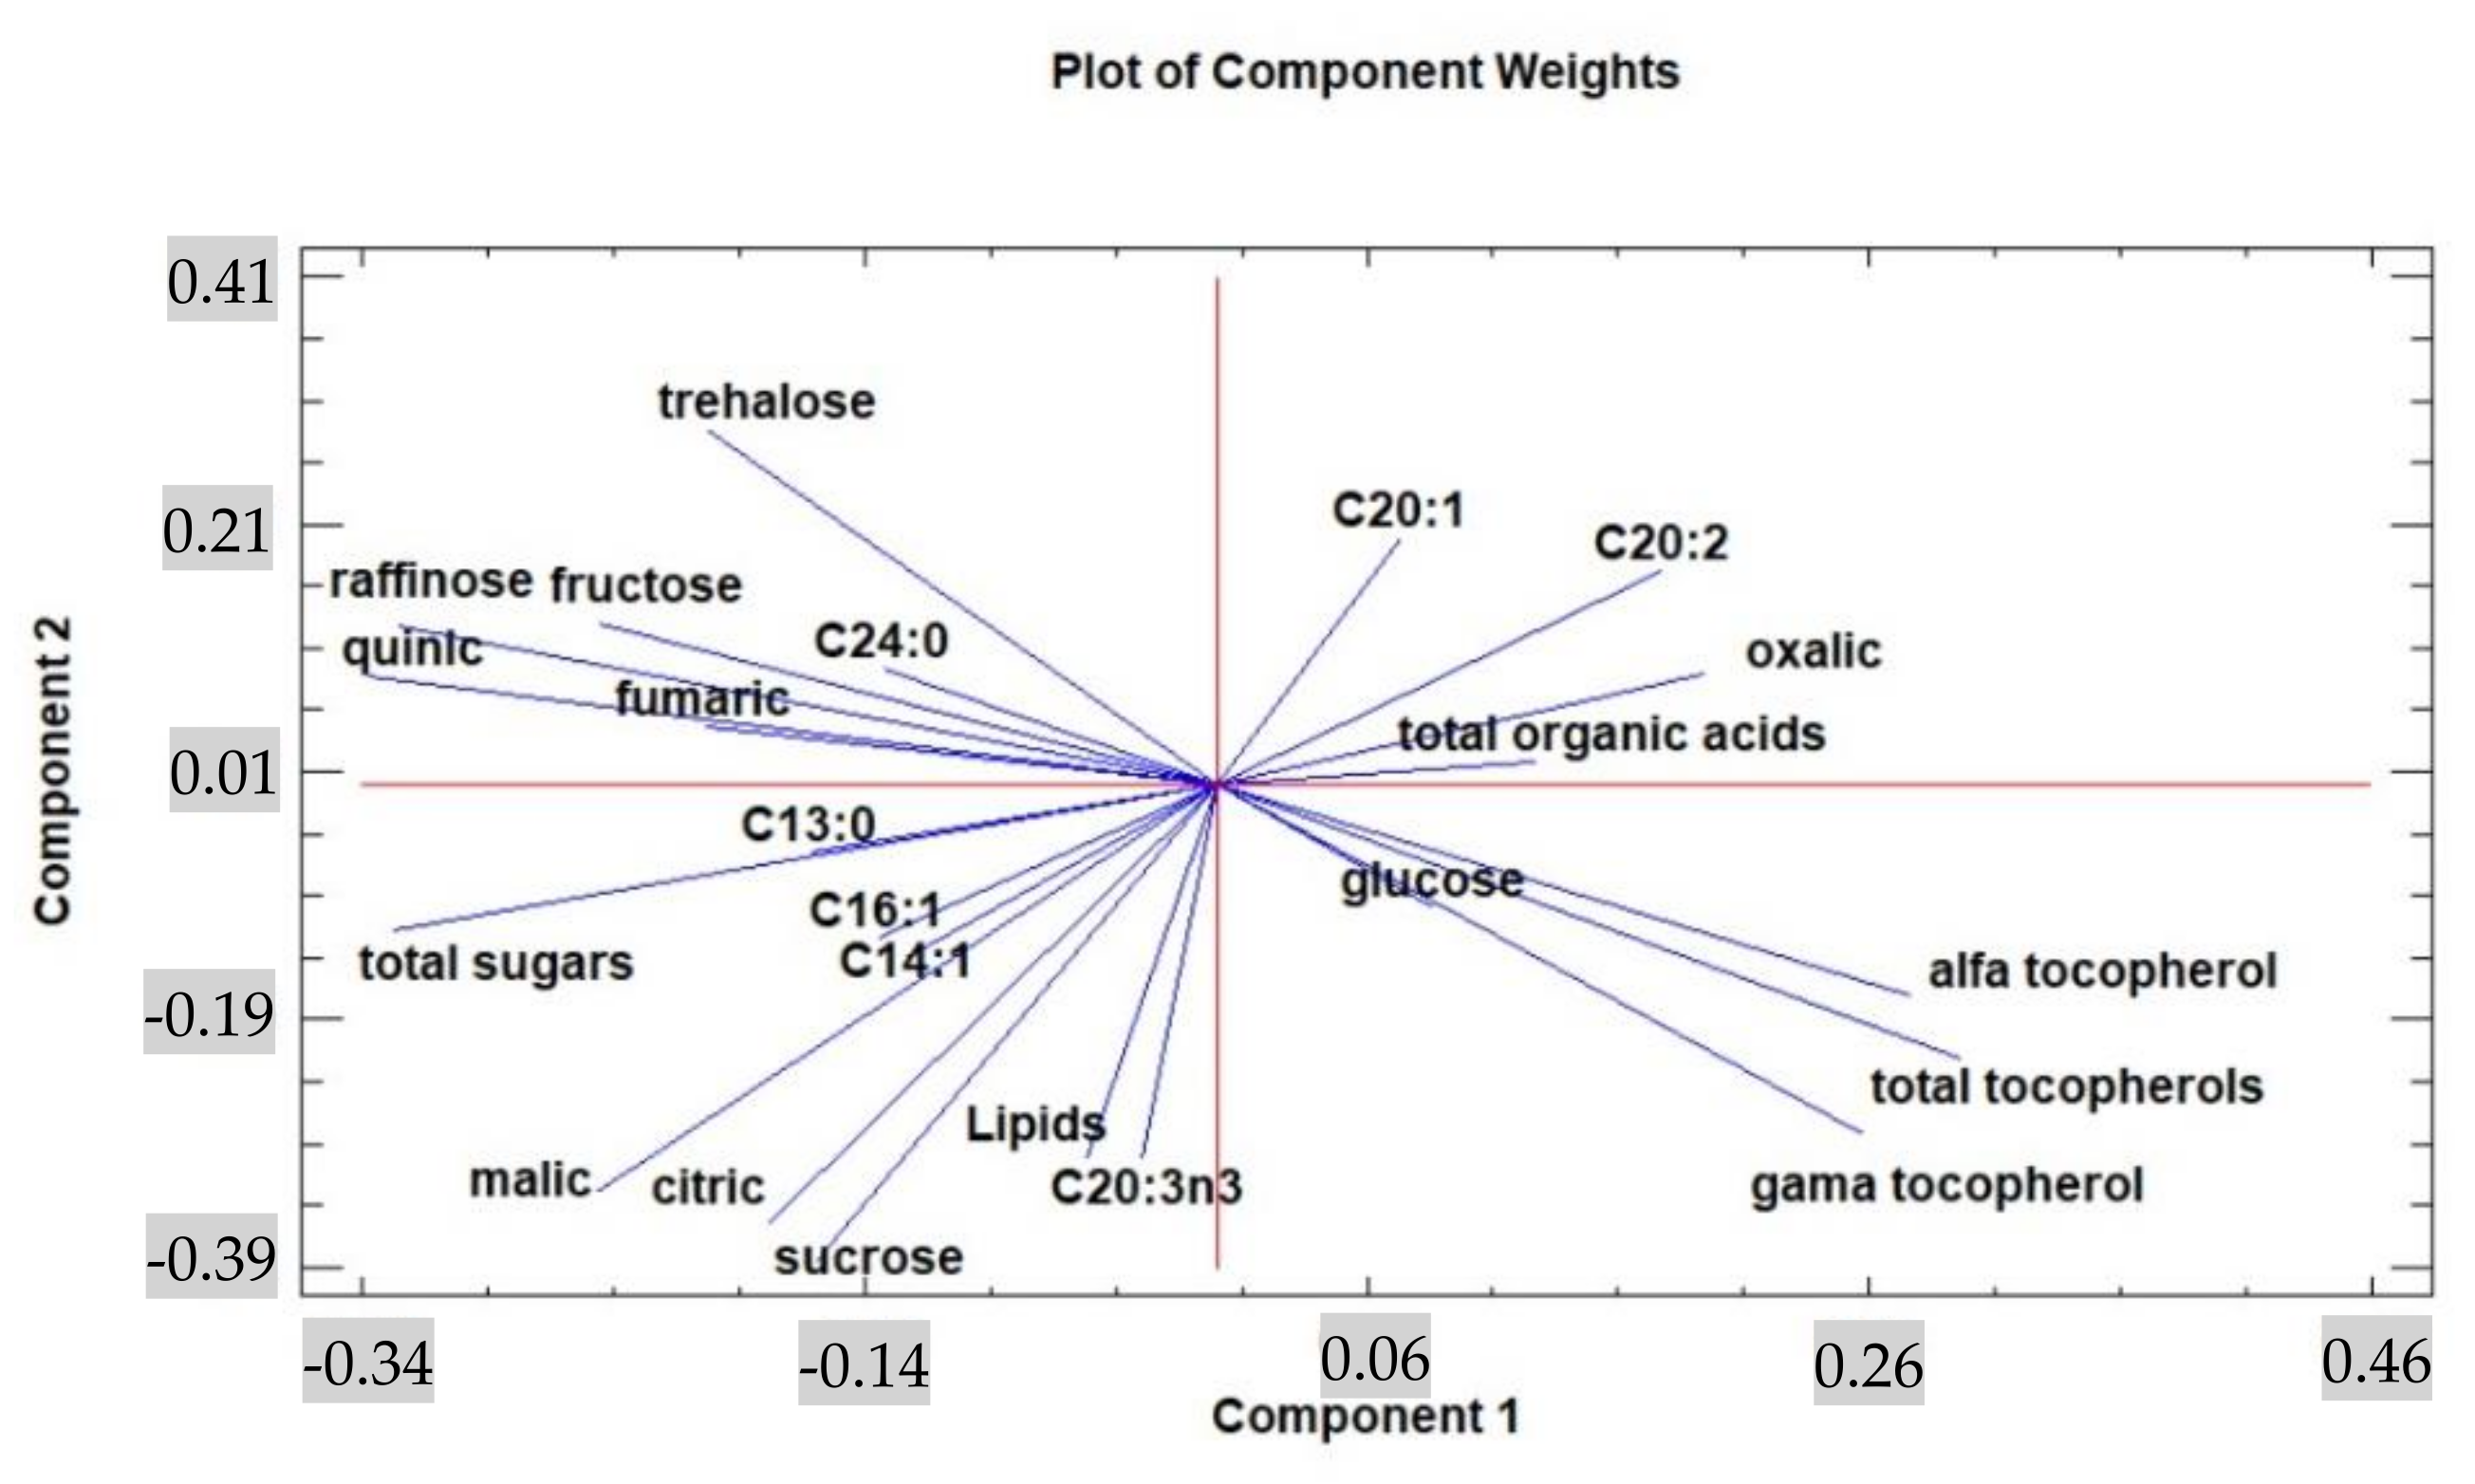
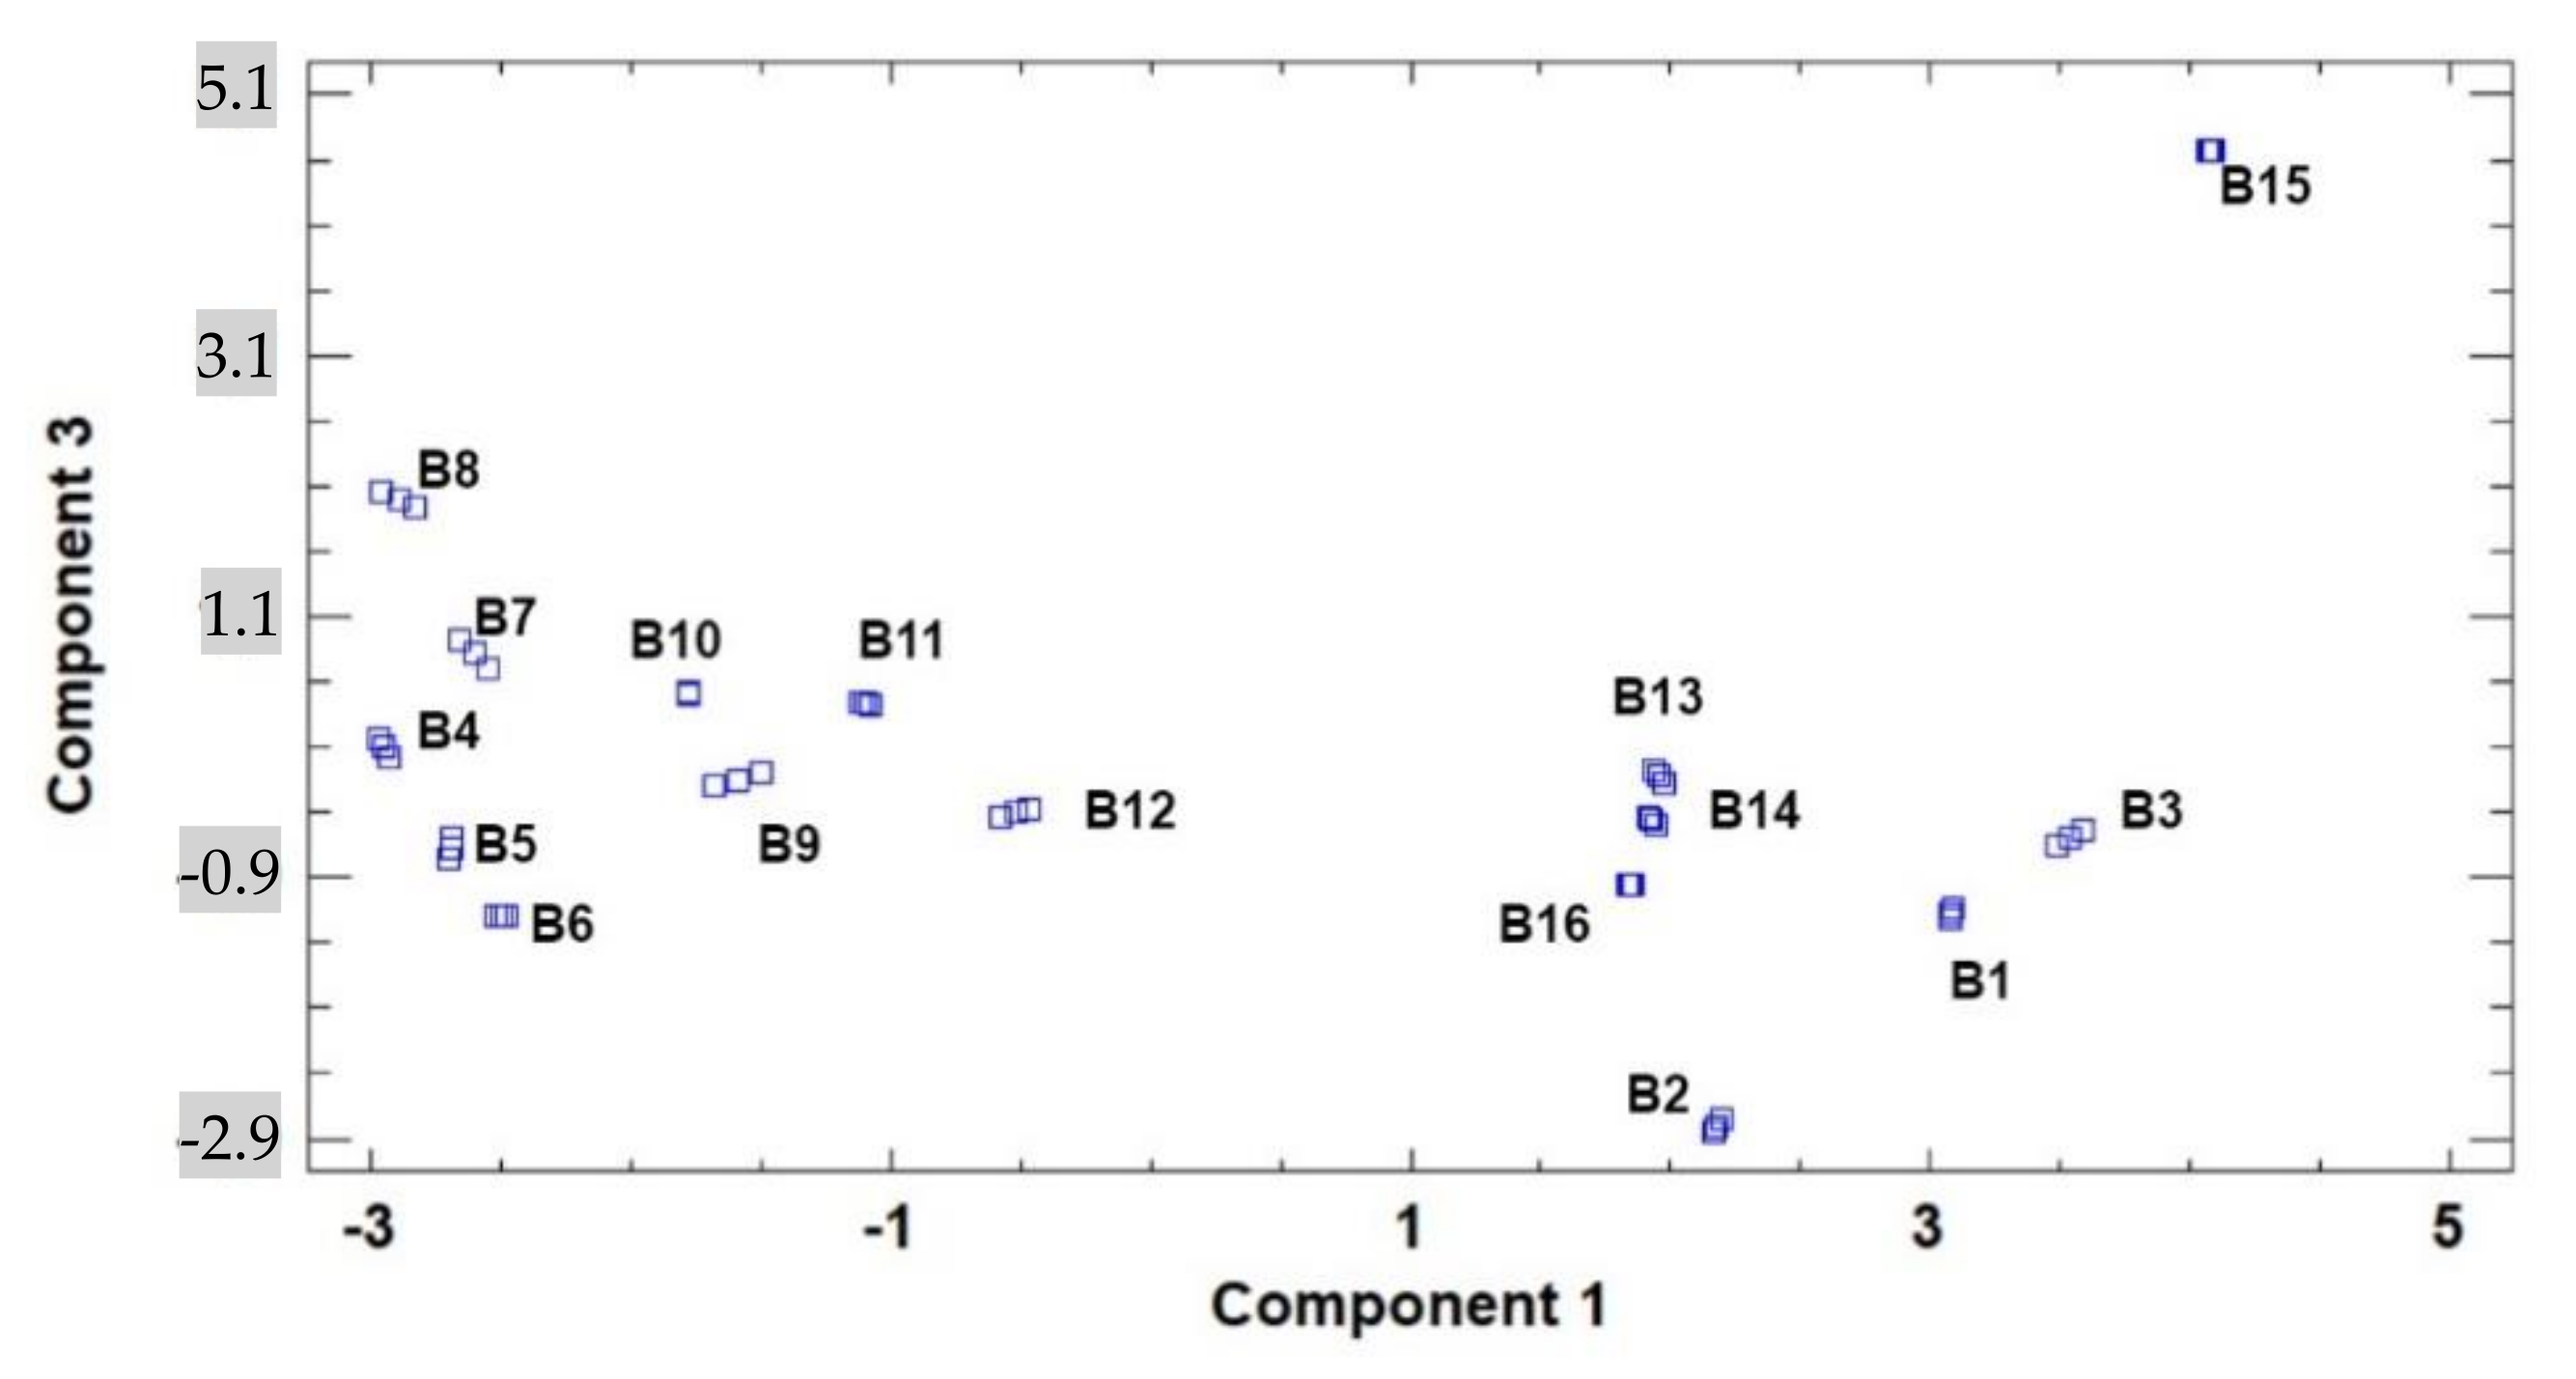
3. Results and Discussion
3.1. Lipidic Fraction and Fatty Acids’ Composition
3.2. Tocopherols, Free Sugars, and Organic Acid Content
4. Conclusions
Author Contributions
Funding
Institutional Review Board Statement
Informed Consent Statement
Data Availability Statement
Conflicts of Interest
References
- de Falco, B.; Incerti, G.; Amato, M.; Lanzotti, V. Artichoke: Botanical, agronomical, phytochemical, and pharmacological overview. Phytochem. Rev. 2015, 14, 993–1018. [Google Scholar] [CrossRef]
- Gominho, J.; Curt, M.D.; Lourenço, A.; Fernández, J.; Pereira, H. Cynara cardunculus L. as a biomass and multi-purpose crop: A review of 30 years of research. Biomass Bioenergy 2018, 109, 257–275. [Google Scholar] [CrossRef]
- Conceição, C.; Martins, P.; Alvarenga, N.; Dias, J.; Lamy, E.; Garrido, L.; Gomes, S.; Freiras, S.; Belo, A.; Brás, T.; et al. Cynara cardunculus: Use in cheesemaking and pharmaceutical applications. In Technological Approaches for Novel Applications in Dairy Processing; Books on Demand GmbH: Norderstedt, Germany, 2018; Volume 1, pp. 73–107. [Google Scholar]
- Zayed, A.; Serag, A.; Farag, M.A. Cynara cardunculus L.: Outgoing and potential trends of phytochemical, industrial, nutritive and medicinal merits. J. Funct. Foods 2020, 69, 103937. [Google Scholar] [CrossRef]
- Silva, L.; Jacinto, T.; Coutinho, P. Bioactive Compounds from Cardoon as Health Promoters in Metabolic Disorders. Foods 2022, 11, 336. [Google Scholar] [CrossRef] [PubMed]
- Petropoulos, S.A.; Pereira, C.; Tzortzakis, N.; Barros, L.; Ferreira, I.C.F.R. Nutritional value and bioactive compounds characterization of plant parts from Cynara cardunculus L. (Asteraceae) cultivated in central Greece. Front. Plant Sci. 2018, 9, 459. [Google Scholar] [CrossRef] [PubMed] [Green Version]
- Chihoub, W.; Dias, M.I.; Barros, L.; Calhelha, R.C.; Alves, M.J.; Harzallah-Skhiri, F.; Ferreira, I.C.F.R. Valorisation of the green waste parts from turnip, radish and wild cardoon: Nutritional value, phenolic profile and bioactivity evaluation. Food Res. Int. 2019, 126, 108651. [Google Scholar] [CrossRef] [Green Version]
- Mandim, F.; Petropoulos, S.A.; Dias, M.I.; Pinela, J.; Kostić, M.; Soković, M.; Santos-Buelga, C.; Ferreira, I.C.F.R.; Barros, L. Phenolic composition and biological properties of Cynara cardunculus L. var. altilis petioles: Influence of the maturity stage. Antioxidants 2021, 10, 1907. [Google Scholar] [CrossRef]
- Rolnik, A.; Olas, B. The plants of the Asteraceae family as agents in the protection of human health. Int. J. Mol. Sci. 2021, 22, 3009. [Google Scholar] [CrossRef]
- Scavo, A.; Rial, C.; Varela, R.M.; Molinillo, J.M.G.; Mauromicale, G.; Macias, F.A. Influence of Genotype and Harvest Time on the Cynara cardunculus L. Sesquiterpene Lactone Profile. J. Agric. Food Chem. 2019, 67, 6487–6496. [Google Scholar] [CrossRef]
- Dias, M.I.; Barros, L.; Barreira, J.C.M.; Alves, M.J.; Barracosa, P.; Ferreira, I.C.F.R. Phenolic profile and bioactivity of cardoon (Cynara cardunculus L.) inflorescence parts: Selecting the best genotype for food applications. Food Chem. 2018, 268, 196–202. [Google Scholar] [CrossRef] [Green Version]
- Mandim, F.; Petropoulos, S.A.; Pinela, J.; Dias, M.I.; Giannoulis, K.D.; Kostić, M.; Soković, M.; Queijo, B.; Santos-Buelga, C.; Ferreira, I.C.F.R.; et al. Chemical composition and biological activity of cardoon (Cynara cardunculus L. var. altilis) seeds harvested at different maturity stages. Food Chem. 2022, 369, 130875. [Google Scholar] [CrossRef]
- Mandim, F.; Petropoulos, S.A.; Fernandes, Â.; Santos-Buelga, C.; Ferreira, I.C.F.R.; Barros, L. Chemical composition of Cynara cardunculus L. var. altilis heads: The impact of harvesting time. Agronomy 2020, 10, 1088. [Google Scholar] [CrossRef]
- Mandim, F.; Petropoulos, S.A.; Santos-buelga, C.; Ferreira, I.C.F.R.; Barros, L. Chemical composition of cardoon (Cynara cardunculus L. var. altilis) petioles as affected by plant growth stage. Food Res. Int. 2022, 156, 111330. [Google Scholar] [CrossRef] [PubMed]
- Mandim, F.; Petropoulos, S.A.; Pinela, J.; Dias, M.I.; Kostic, M.; Soković, M.; Ferreira, I.C.F.R.; Santos-Buelga, C.; Barros, L. Phenolic Composition and Antioxidant, Anti-Inflammatory, Cytotoxic, and Antimicrobial Activities of Cardoon Blades at Different Growth Stages. Biology 2022, 11, 699. [Google Scholar] [CrossRef] [PubMed]
- AOAC. Official Methods of Analysis of Association of Official Analytical Chemists International; Horwitz, W., Latimer, G., Eds.; AOAC International: Gaithersburg, MD, USA, 2016; ISBN 0935584773. [Google Scholar]
- Dias, M.I.; Barros, L.; Morales, P.; Sánchez-Mata, M.C.; Oliveira, M.B.P.P.; Ferreira, I.C.F.R. Nutritional parameters of infusions and decoctions obtained from Fragaria vesca L. roots and vegetative parts. LWT Food Sci. Technol. 2015, 62, 32–38. [Google Scholar] [CrossRef] [Green Version]
- Ayache, S.B.; Reis, F.S.; Dias, M.I.; Pereira, C.; Glamočlija, J.; Soković, M.; Saafi, E.B.; Ferreira, I.C.F.R.; Barros, L.; Achour, L. Chemical characterization of carob seeds (Ceratonia siliqua L.) and use of different extraction techniques to promote its bioactivity. Food Chem. 2021, 351, 129263. [Google Scholar] [CrossRef]
- Pires, T.C.S.P.; Dias, M.I.; Calhelha, R.C.; Alves, M.O.; Santos-Buelga, C.; Ferreira, I.C.F.R.; Barros, L. Development of new bilberry (Vaccinium myrtillus L.) based snacks: Nutritional, chemical and bioactive features. Food Chem. 2021, 334, 127511. [Google Scholar] [CrossRef]
- Mandim, F.; Petropoulos, S.A.; Giannoulis, K.D.; Santos-Buelga, C.; Ferreira, I.C.F.R.; Barros, L. Chemical composition of Cynara cardunculus L. var. altilis bracts cultivated in central Greece: The impact of harvesting time. Agronomy 2020, 10, 1976. [Google Scholar] [CrossRef]
- Curt, M.D.; Sánchez, G.; Fernández, J. The potential of Cynara cardunculus L. for seed oil production in a perennial cultivation system. Biomass Bioenergy 2002, 23, 33–46. [Google Scholar] [CrossRef]
- Ashrafi, E.; Razmjoo, K. Effect of Irrigation Regimes on Oil Content and Composition of Safflower (Carthamus tinctorius L.) Cultivars. J. Am. Oil Chem. Soc. 2010, 87, 499–506. [Google Scholar] [CrossRef]
- Zemour, K.; Adda, A.; Labdelli, A.; Dellal, A.; Cerny, M.; Merah, O. Effects of genotype and climatic conditions on the oil content and its fatty acids composition of Carthamus tinctorius L. seeds. Agronomy 2021, 11, 2048. [Google Scholar] [CrossRef]
- Sanyal, A.; Linder, C. Plasticity and constraints on fatty acid composition in the phospholipids and triacylglycerols of Arabidopsis accessions grown at different temperatures. Plant Biol. 2013, 13, 63. [Google Scholar] [CrossRef] [PubMed] [Green Version]
- Yu, S.; Du, S.; Yuan, J.; Hu, Y. Fatty acid profile in the seeds and seed tissues of Paeonia L. species as new oil plant resources. Sci. Rep. 2016, 6, 26944. [Google Scholar] [CrossRef] [PubMed] [Green Version]
- Kaliora, A.C.; Batzaki, C.; Christea, M.G.; Kalogeropoulos, N. LWT—Food Science and Technology Nutritional evaluation and functional properties of traditional composite salad dishes. LWT Food Sci. Technol. 2015, 62, 775–782. [Google Scholar] [CrossRef]
- Linder, C.R. Adaptive Evolution of Seed Oils in Plants: Accounting for the Biogeographic Distribution of Saturated and Unsaturated Fatty Acids in Seed Oils. Am. Nat. 2000, 156, 442–458. [Google Scholar] [CrossRef]
- Upchurch, R.G. Fatty acid unsaturation, mobilization, and regulation in the response of plants to stress. Biotechnol. Lett. 2008, 30, 967–977. [Google Scholar] [CrossRef]
- Havaux, M.; Porfirova, S.; Rey, P.; Do, P.; Eymery, F.; Porfirova, S.; Rey, P.; Dörmann, P. Vitamin E protects against photoinhibition and photooxidative stress in Arabidopsis thaliana. Plant Cell 2005, 17, 3451–3469. [Google Scholar] [CrossRef] [Green Version]
- Sadiq, M.; Aisha, N.; Muhammad, A.; Al, F.; Parvaiz, Q. Alpha-Tocopherol-Induced Regulation of Growth and Metabolism in Plants under Non-stress and Stress Conditions. J. Plant Growth Regul. 2019, 38, 1325–1340. [Google Scholar] [CrossRef]
- Ali, E.; Hussain, S.; Hussain, N.; Ullah, K.; Jawad, K.; Shah, M. Tocopherol as plant protector: An overview of Tocopherol biosynthesis enzymes and their role as antioxidant and signaling molecules. Acta Physiol. Plant. 2022, 44, 20. [Google Scholar] [CrossRef]
- Maeda, H.; Song, W.; Sage, T.L.; Dellapenna, D. Tocopherols Play a Crucial Role in Low-Temperature Adaptation and Phloem Loading in Arabidopsis. Plant Cell 2006, 18, 2710–2732. [Google Scholar] [CrossRef] [Green Version]
- Izumi, M.; Ishida, H. The changes of leaf carbohydrate contents as a regulator of autophagic degradation of chloroplasts via rubisco-containing bodies during leaf senescence. Plant Signal. Behav. 2011, 6, 685–687. [Google Scholar] [CrossRef] [PubMed] [Green Version]
- Batista-Silva, W.; Nascimento, V.L.; Medeiros, D.B.; Nunes-Nesi, A.; Ribeiro, D.; Zsögön, A.; Araújo, W. Modifications in Organic Acid Profiles During Fruit Development and Ripening: Correlation or Causation? Front. Plant Sci. 2018, 9, 1689. [Google Scholar] [CrossRef] [PubMed]
- Tarasov, D.; Leitch, M.; Fatehi, P. Lignin-carbohydrate complexes: Properties, applications, analyses, and methods of extraction: A review. Biotechnol. Biofuels 2018, 11, 269. [Google Scholar] [CrossRef] [PubMed] [Green Version]
- Petropoulos, S.A.; Pereira, C.; Ntatsi, G.; Danalatos, N.; Barros, L.; Ferreira, I.C.F.R. Nutritional value and chemical composition of Greek artichoke genotypes. Food Chem. 2017, 267, 296–302. [Google Scholar] [CrossRef]
- Pereira, E.; Barros, L.; Calhelha, R.C.; Dueñas, M.; Carvalho, A.M.; Santos-Buelga, C.; Ferreira, I.C.F.R. Bioactivity and phytochemical characterization of Arenaria montana L. Food Funct. 2014, 5, 1848–1855. [Google Scholar] [CrossRef] [Green Version]
- El-Nakhel, C.; Petropoulos, S.A.; Pannico, A.; Kyriacou, M.C.; Giordano, M.; Colla, G.; Troise, A.D.; Vitaglione, P.; De Pascale, S.; Rouphael, Y. The bioactive profile of lettuce produced in a closed soilless system as configured by combinatorial effects of genotype and macrocation supply composition. Food Chem. 2020, 309, 125713. [Google Scholar] [CrossRef]


| B1 | B2 | B3 | B4 | B5 | B6 | B7 | B8 | B9 | B10 | B11 | B12 | B13 | B14 | B15 | B16 | |
|---|---|---|---|---|---|---|---|---|---|---|---|---|---|---|---|---|
| Lipidic fraction (g/100 g dw) | 3.0 ± 0.2 g | 3.0 ± 0.3 g | 2.4 ± 0.1 h | 1.78 ± 0.02 h | 3.66 ± 0.01 g | 5.6 ± 0.5 e | 3.7 ± 0.2 g | 8.7 ± 0.2 c | 10.2 ± 0.4 b | 10.6 ± 0.1 b | 3.7 ± 0.2 g | 8.3 ± 0.2 c | 7.04 ± 0.04 d | 15 ± 1 a | 3.2 ± 0.2 g | 4.7 ± 0.4 f |
| Fatty acids (relative percentage %) | ||||||||||||||||
| C6:0 | 1.151 ± 0.002 c | 0.46 ± 0.04 h | 0.48 ± 0.03 h | 0.30 ± 0.01 i | 0.431 ± 0.001 h | 0.74 ± 0.01 g | 1.43 ± 0.01 b | 1.1 ± 0.1 c | 0.83 ± 0.03 f | 0.98 ± 0.03 e | 0.156 ± 0.002 j | 0.32 ± 0.03 i | 0.250 ± 0.001 i | 1.7 ± 0.1 a | 1.1 ± 0.1 d | 0.83 ± 0.04 f |
| C8:0 | 0.217 ± 0.005 i | 0.15 ± 0.01 j | 0.284 ± 0.001 gh | 0.35 ± 0.01 de | 0.15 ± 0.01 j | 0.325 ± 0.001 ef | 0.44 ± 0.01 c | 0.366 ± 0.03 d | 0.31 ± 0.01 fg | 0.26 ± 0.02 h | 0.144 ± 0.004 j | 0.621 ± 0.005 b | 0.3 ± 0.1 h | 0.799 ± 0.001 a | 0.20 ± 0.02 i | 0.6 ± 0.1 b |
| C10:0 | 0.36 ± 0.01 e | 0.18 ± 0.01 j | 0.378 ± 0.001 e | 0.098 ± 0.001 k | 0.172 ± 0.002 j | 0.150 ± 0.001 j | 0.54 ± 0.01 c | 0.26 ± 0.02 hi | 0.30 ± 0.01 g | 0.29 ± 0.01 gh | 0.59 ± 0.04 b | 0.33 ± 0.02 f | 0.411 ± 0.004 d | 0.63 ± 0.03 a | 0.31 ± 0.03 fg | 0.25 ± 0.02 i |
| C11:0 | 0.79 ± 0.02 h | 0.314 ± 0.004 j | 0.009 ± 0.001 l | 0.98 ± 0.05 g | 1.86± 0.02 b | 1.61 ± 0.05 cd | 1.19 ± 0.02 f | 1.354 ± 0.02 e | 1.51 ± 0.02 d | 1.7 ± 0.1 c | 0.5 ± 0.2 i | 0.35 ± 0.01 j | 0.278 ± 0.002 j | 3.8 ± 0.2 a | 0.131 ± 0.005 k | 0.32 ± 0.03 j |
| C12:0 | 0.025 ± 0.002 k | 0.19 ± 0.01 i | 0.306 ± 0.003 h | 0.393 ± 0.001 g | 0.27 ± 0.02 h | 1.84 ± 0.01 a | 1.34 ± 0.01 b | 1.801 ± 0.1 a | 0.71 ± 0.04 f | 0.78 ± 0.03 e | 0.45 ± 0.02 g | 0.84 ± 0.01 d | 0.41 ± 0.03 g | 1.06 ± 0.03 c | 0.18 ± 0.01 ij | 0.12 ± 0.01 j |
| C13:0 | n.d. | n.d. | n.d. | 0.10 ± 0.01 e | 0.088 ± 0.001 e | 0.10 ± 0.01 e | 1.98 ± 0.01 a | 1.543 ± 0.04 c | n.d. | n.d. | 1.9 ± 0.1 b | n.d. | n.d. | 0.61 ± 0.01 d | n.d. | n.d. |
| C14:0 | 2.1 ± 0.1 b | 2 ± 1 b | 0.86 ± 0.04 fg | 1.06 ± 0.01 e | 1.2 ± 0.1 d | 1.3 ± 0.1 d | 2.4 ± 0.2 a | 1.6 ± 0.1 c | 1.64 ± 0.05 c | 0.86 ± 0.02 fg | 0.74 ± 0.03 gh | 1.31 ± 0.01 d | 0.78 ± 0.03 gh | 1.29 ± 0.05 d | 0.96 ± 0.01 ef | 0.7 ± 0.1 h |
| C14:1 | n.d. | n.d. | n.d. | 0.15 ± 0.01 a | n.d. | n.d. | n.d. | n.d. | n.d. | n.d. | 0.063 ± 0.002 c | 0.13 ± 0.01 b | n.d. | n.d. | n.d. | n.d. |
| C15:0 | 0.504 ± 0.002 d | 0.415 ± 0.005 f | 0.591 ± 0.001 c | 0.72 ± 0.01 a | 0.66 ± 0.02 b | 0.53 ± 0.03 d | 0.597 ± 0.004 c | 0.472 ± 0.02 e | 0.299 ± 0.002 g | 0.51 ± 0.01 d | 0.127 ± 0.001 i | n.d. | 0.41 ± 0.02 f | 0.53 ± 0.01 d | 0.51 ± 0.05 d | 0.26 ± 0.03 h |
| C16:0 | 31.71 ± 0.01 ef | 29 ± 1 h | 30.76 ± 0.05 efg | 32.97 ± 0.03 cd | 34 ± 2 c | 30.5 ± 0.2 fg | 31.3 ± 0.3 ef | 25.578 ± 0.1 i | 19.9 ± 0.2 j | 32.0 ± 0.3 de | 29 ± 1 h | 40.13 ± 0.05 b | 24.8 ± 0.2 i | 30.0 ± 0.3 gh | 43 ± 1 a | 25.2 ± 0.4 i |
| C16:1 | n.d. | 2.2 ± 0.1 a | 0.147 ± 0.004 h | 0.860 ± 0.003 e | 0.97 ± 0.04 cd | 2.12 ± 0.05 a | 0.5 ± 0.05 f | 0.612 ± 0.02 f | 0.6 ± 0.1 f | 1.0 ± 0.1 c | 1.4 ± 0.1 b | 1.05 ± 0.01 c | 0.90 ± 0.02 de | 0.835 ± 0.001 e | 0.39 ± 0.03 g | n.d. |
| C17:0 | 0.78 ± 0.01 d | 0.60 ± 0.03 f | 0.828 ± 0.004 c | 0.77 ± 0.03 d | 0.59 ± 0.03 f | 0.61 ± 0.03 f | 0.62 ± 0.01 f | 0.601 ± 0.02 f | 0.30 ± 0.01 i | 0.45 ± 0.01 h | 0.52 ± 0.02 g | 1.099 ± 0.002 a | 0.77 ± 0.03 d | 1.005 ± 0.004 b | 0.7 ± 0.1 e | 0.54 ± 0.01 g |
| C18:0 | 6.825 ± 0.001 e | 6.2 ± 0.5 f | 7.69 ± 0.04 cd | 6.56 ± 0.05 ef | 9 ± 1 b | 8.84 ± 0.02 b | 9.01 ± 0.01 b | 11.1 ± 0.1 a | 6.89 ± 0.05 e | 8.0 ± 0.1 c | 3.9 ± 0.4 h | 7.392 ± 0.005 d | 5.3 ± 0.3 g | 7.7 ± 0.1 cd | 8.1 ± 0.3 c | 6.4 ± 0.1 f |
| C18:1n9c | 3.951 ± 0.003 jk | 2.71 ± 0.04 m | 3.13 ± 0.01 l | 4.5 ± 0.5 hi | 2.2 ± 0.1 n | 6.9 ± 0.1 e | 13.28 ± 0.02 c | 5.3 ± 0.1 f | 19.1 ± 0.2 b | 2.3 ± 0.2 n | 3.8 ± 0.4 k | 7.30 ± 0.01 d | 4.3 ± 0.4 ij | 4.8 ± 0.1 gh | 4.99 ± 0.02 fg | 23.0 ± 0.3 a |
| C18:2n6c | 15.60 ± 0.05 f | 14 ± 1 h | 17.56 ± 0.02 e | 19.8 ± 0.5 d | 19.9 ± 0.4 d | 17.4 ± 0.1 e | 17.2 ± 0.1 e | 10.8 ± 0.1 j | 34.8 ± 0.2 a | 13.3 ± 0.1 i | 14.7 ± 0.1 g | 21.75 ± 0.03 c | 14.0 ± 0.1 h | 17.15 ± 0.04 e | 9 ± 1 k | 27.5 ± 0.4 b |
| C18:3n3c | 22.89 ± 0.03 c | 33 ± 1 a | 23.68 ± 0.03 c | 17.4 ± 0.5 f | 22 ± 1 d | 21.2 ± 0.3 d | 7.29 ± 0.04 i | 15.5 ± 0.1 g | 6.39 ± 0.05 j | 25.17 ± 0.02 c | 33.2 ± 0.2 a | n.d. | 20.3 ± 0.3 e | 13.4 ± 0.2 h | 16 ± 1 g | 6.8 ± 0.1 ij |
| C20:0 | 4.17 ± 0.04 d | 3.6 ± 0.2 e | 5.90 ± 0.01 a | 5.0 ± 0.1 c | 2.52 ± 0.02 g | 1.96 ± 0.04 h | 1.9 ± 0.1 h | 5.821 ± 0.3 a | 1.23 ± 0.01 i | 2.52 ± 0.02 g | 2.8 ± 0.1 f | 5.488 ± 0.004 b | 5.9 ± 0.2 a | 2.4 ± 0.1 g | 5.3 ± 0.2 b | 1.83 ± 0.03 h |
| C20:1 | n.d. | 0.08 ± 0.01 e | 0.115 ± 0.001 d | 0.128 ± 0.004 c | 0.088 ± 0.004 e | n.d. | n.d. | n.d. | 0.16 ± 0.02 b | n.d. | n.d. | n.d. | 0.11 ± 0.01 d | n.d. | n.d. | 0.70 ± 0.02 a |
| C20:2 | n.d. | 0.162 ± 0.001 b | 0.264 ± 0.002 a | n.d. | n.d. | n.d. | n.d. | n.d. | n.d. | n.d. | n.d. | n.d. | n.d. | n.d. | n.d. | n.d. |
| C21:0 | 0.54 ± 0.02 f | 0.56 ± 0.02 f | 1.05 ± 0.04 a | 0.8 ± 0.1 d | 0.34 ± 0.03 h | 0.345 ± 0.004 h | 0.253 ± 0.004 i | 0.688 ± 0.02 e | 0.09 ± 0.01 j | 0.43 ± 0.04 g | 0.323 ± 0.003 h | 0.81 ± 0.01 c | 0.6 ± 0.1 f | n.d. | 0.862 ± 0.004 b | 0.26 ± 0.02 i |
| C20:3n3 | n.d. | n.d. | n.d. | n.d. | n.d. | n.d. | 1.3 ± 0.1 c | 1.389 ± 0.05 c | 0.34 ± 0.01 d | n.d. | 1.4 ± 0.1 c | 3.13 ± 0.04 b | 3.8 ± 0.2 a | n.d. | n.d. | n.d. |
| C22:0 | 4.9 ± 0.1 c | 3.4 ± 0.3 g | 4.53 ± 0.05 d | 3.8 ± 0.1 f | 2.51 ± 0.04 i | 1.19 ± 0.03 l | 3.2 ± 0.1 g | 4.199 ± 0.03 e | 1.74 ± 0.01 k | 2.20 ± 0.01 j | 2.8 ± 0.1 h | 5.27 ± 0.01 b | 6.8 ± 0.1 a | 3.4 ± 0.1 g | 4.9 ± 0.4 c | 2.1 ± 0.1 j |
| C22:1 | 0.52 ± 0.02 f | 0.28 ± 0.03 g | 0.105 ± 0.003 i | 0.096 ± 0.001 i | 0.22 ± 0.01 gh | 0.18 ± 0.02 hi | 0.26 ± 0.02 gh | 0.221 ± 0.01 gh | 0.9 ± 0.1 e | 1.53 ± 0.02 c | 0.13 ± 0.01 i | 0.53 ± 0.02 f | 6.9 ± 0.1 a | 5.5 ± 0.1 b | n.d. | 1.2 ± 0.1 d |
| C20:5n3 | 0.604 ± 0.001 c | 0.16 ± 0.01 fg | 0.29 ± 0.02 de | 0.051 ± 0.003 gh | 0.21 ± 0.01 ef | 0.27 ± 0.03 def | 0.791 ± 0.005 b | 0.34 ± 0.02 d | 0.375 ± 0.02 d | 0.63 ± 0.04 c | 0.15 ± 0.01 fg | 0.30 ± 0.03 de | 2.6 ± 0.3 a | 0.77 ± 0.05 b | n.d. | 0.060 ± 0.001 gh |
| C23:0 | 0.62 ± 0.01 j | 0.182 ± 0.001 l | 0.929 ± 0.003 gh | 0.9 ± 0.1 hi | 0.273 ± 0.002 k | 0.84 ± 0.03 i | 1.8 ± 0.1 c | 7.0 ± 0.1 a | 1.06 ± 0.04 ef | 2.8 ± 0.1 b | 0.63 ± 0.01 j | 1.37 ± 0.05 d | 0.260 ± 0.001 kl | 1.10 ± 0.01 e | 0.99 ± 0.04 fg | 0.245 ± 0.003 kl |
| C24:0 | 1.76 ± 0.01 d | 0.09 ± 0.01 m | 0.11 ± 0.01 lm | 2.221 ± 0.004 c | 1.04 ± 0.03 h | 0.94 ± 0.02 i | 1.3 ± 0.1 f | 2.454 ± 0.005 a | 0.59 ± 0.04 j | 2.31 ± 0.01 b | 0.166 ± 0.001 l | 0.52 ± 0.02 k | n.d. | 1.5 ± 0.1 e | 1.48 ± 0.02 e | 1.19 ± 0.03 g |
| SFA | 56.44 ± 0.04 de | 47.6 ± 2 h | 54.70 ± 0.05 f | 56.92 ± 0.05 de | 55 ± 1 f | 51.8 ± 0.1 g | 59.35 ± 0.2 c | 65.9 ± 0.1 b | 37.5 ± 0.1 k | 56.0 ± 0.1 e | 45.2 ± 0.3 i | 65.84 ± 0.03 b | 47 ± 1 h | 57.5 ± 0.3 d | 69 ± 1 a | 41 ± 1 j |
| MUFA | 4.47 ± 0.02 k | 5.2 ± 0.1 i | 3.50 ± 0.01 l | 5.76 ± 0.05 h | 3.5 ± 0.1 l | 9.2 ± 0.1 f | 14.1 ± 0.1 c | 6.1 ± 0.1 g | 20.7 ± 0.2 b | 4.9 ± 0.2 j | 5.4 ± 0.2 i | 8.997 ± 0.004 f | 12.2 ± 0.3 d | 11.16 ± 0.05 e | 5.4 ± 0.1 i | 24.9 ± 0.2 a |
| PUFA | 39.09 ± 0.02 d | 47 ± 2 b | 41.8 ± 0.1 c | 37.32 ± 0.01 e | 41.9 ± 0.6 c | 38.9 ± 0.2 d | 26.6 ± 0.1 i | 27.9 ± 0.1 h | 41.9 ± 0.2 c | 39.1 ± 0.1 d | 49.46 ± 0.01 a | 25.17 ± 0.03 j | 41 ± 1 c | 31.3 ± 0.2 g | 25 ± 1 j | 34.3 ± 0.4 f |
| Tocopherols (µg per 100 g dw) | |||
|---|---|---|---|
| α-Tocopherol | γ-Tocopherol | Total | |
| B1 | 6637 ± 45 b | 1715 ± 96 c | 8352 ± 142 b |
| B2 | 5145 ± 38 c | n.d. | 5145 ± 38 d |
| B3 | 2254 ± 24 e | 1174 ± 47 f | 3428 ± 72 g |
| B4 | 146 ± 4 h | n.d. | 146 ± 1 l |
| B5 | 129 ± 2 h | n.d. | 129 ± 2 l |
| B6 | 145.0 ± 0.5 h | n.d. | 145.0 ± 0.5 l |
| B7 | 115.7 ± 0.4 hi | n.d. | 115.7 ± 0.4 l |
| B8 | 99 ± 1 ij | n.d. | 99 ± 1 l |
| B9 | 80.0 ± 2 j | 399 ± 6 h | 478.8 ± 4.5 k |
| B10 | 135.5 ± 1.5 h | 554 ± 3 g | 689.5 ± 4.8 j |
| B11 | 420 ± 3 g | 1478 ± 2 e | 1897.5 ± 0.9 h |
| B12 | 1834 ± 2 f | 1675.5 ± 3.0 c | 3509 ± 5 f |
| B13 | 3912 ± 4 d | 2181.3 ± 0.4 b | 6093.7 ± 3.5 c |
| B14 | 8567 ± 4 a | 1630.5 ± 4.5 d | 10,197 ± 1 a |
| B15 | 2256.8 ± 6.5 k | 2002 ± 4 a | 4263 ± 10 e |
| B16 | 966 ± 3 k | n.d. | 966 ± 3 i |
| Free Sugars (g per 100 g dw) | ||||||
|---|---|---|---|---|---|---|
| Fructose | Glucose | Sucrose | Trehalose | Raffinose | Total | |
| B1 | 0.79 ± 0.02 b | 0.61 ± 0.03 a | 2.18 ± 0.02 m | 0.33 ± 0.01 h | n.d. | 3.91 ± 0.02 m |
| B2 | 0.61 ± 0.02 d | 0.38 ± 0.01 b | 3.97 ± 0.01 j | 0.26 ± 0.01 i | n.d. | 5.22 ± 0.03 k |
| B3 | n.d. | 0.25 ± 0.02 de | 1.662 ± 0.004 o | 1.68 ± 0.02 b | n.d. | 3.590 ± 0.001 n |
| B4 | 0.53 ± 0.05 e | 0.06 ± 0.03 j | 6.1 ± 0.1 f | 2.0 ± 0.1 a | 6.799 ± 0.002 b | 15.5 ± 0.1 b |
| B5 | 0.68 ± 0.03 c | 0.18 ± 0.04 fghi | 6.45 ± 0.05 e | 1.64 ± 0.03 b | 7.9 ± 0.1 a | 16.87 ± 0.03 a |
| B6 | 0.85 ± 0.02 a | 0.30 ± 0.01 cd | 5.9 ± 0.1 h | 2.0 ± 0.1 a | 4.3 ± 0.1 c | 13.4 ± 0.1 c |
| B7 | 0.9 ± 0.1 a | 0.23 ± 0.05 ef | 4.1 ± 0.1 i | 1.3 ± 0.1 c | 3.17 ± 0.01 d | 9.80 ± 0.01 h |
| B8 | 0.58 ± 0.02 d | 0.1 ± 0.1 i | 3.7 ± 0.1 k | 0.8 ± 0.1 d | 2.7 ± 0.1 f | 7.9 ± 0.2 i |
| B9 | 0.76 ± 0.05 b | 0.34 ± 0.03 bc | 6.1 ± 0.2 fg | 0.67 ± 0.02 e | 2.67 ± 0.03 f | 10.5 ± 0.2 g |
| B10 | 0.47 ± 0.01 f | 0.29 ± 0.05 cd | 7.34 ± 0.02 d | 0.82 ± 0.03 d | 2.83 ± 0.01 e | 11.75 ± 0.04 e |
| B11 | 0.51 ± 0.01 ef | 0.19 ± 0.05 efgh | 8.72 ± 0.04 c | 0.42 ± 0.05 g | 1.3 ± 0.1 g | 11.12 ± 0.02 f |
| B12 | 0.25 ± 0.05 g | 0.59 ± 0.01 a | 9.4 ± 0.1 b | 0.57 ± 0.05 f | 1.5 ± 0.1 g | 12.0 ± 0.2 d |
| B13 | 0.17 ± 0.01 h | 0.14 ± 0.03 hi | 6.0 ± 0.1 gh | 0.185 ± 0.003 j | n.d. | 6.45 ± 0.12 j |
| B14 | 0.16 ± 0.01 h | 0.16 ± 0.02 ghi | 10.8 ± 0.1 a | n.d. | n.d. | 11.08 ± 0.05 f |
| B15 | 0.17 ± 0.01 h | 0.168 ± 0.002 fghi | 2.01 ± 0.04 n | 0.585 ± 0.003 f | n.d. | 2.9 ± 0.1 o |
| B16 | 0.27 ± 0.01 g | 0.21 ± 0.01 efg | 2.93 ± 0.01 l | 0.70 ± 0.01 e | n.d. | 4.12 ± 0.03 l |
| Organic Acids (g per 100 g dw) | ||||||
|---|---|---|---|---|---|---|
| Oxalic | Quinic | Malic | Citric | Fumaric | Total | |
| B1 | 0.4 ± 0.1 cd | 0.391 ± 0.003 j | 0.81 ± 0.05 l | n.d. | n.d. | 1.62 ± 0.02 j |
| B2 | 0.86 ± 0.03 c | 0.355 ± 0.004 k | 1.06 ± 0.02 k | n.d. | n.d. | 2.28 ± 0.01 i |
| B3 | 8 ± 1 b | 0.139 ± 0.002 n | tr | n.d. | n.d. | 8 ± 1 c |
| B4 | 0.79 ± 0.02 cd | 1.17 ± 0.01 f | 2.22 ± 0.02 j | 1.1 ± 0.1 e | tr | 5.3 ± 0.1 f |
| B5 | 0.250 ± 0.003 d | 1.29 ± 0.01 d | 2.39 ± 0.04 i | 0.86 ± 0.02 h | tr | 4.8 ± 0.1 g |
| B6 | 0.275 ± 0.003 d | 1.23 ± 0.02 e | 3.03 ± 0.02 g | 0.89 ± 0.04 gh | tr | 5.4 ± 0.1 f |
| B7 | 0.3441 ± 0.0001 cd | 1.73 ± 0.04 b | 2.80 ± 0.01 h | 0.75 ± 0.02 i | 0.011 ± 0.001 b | 5.63 ± 0.05 f |
| B8 | 0.76 ± 0.02 cd | 2.54 ± 0.03 a | 3.5 ± 0.1 d | 1.09 ± 0.03 e | 0.014 ± 0.001 a | 7.9 ± 0.2 cd |
| B9 | 0.53 ± 0.01 cd | 1.4 ± 0.1 c | 3.3 ± 0.2 e | 1.00 ± 0.04 f | 0.0100 ± 0.0004 c | 6.3 ± 0.3 e |
| B10 | 0.55 ± 0.01 cd | 0.95 ± 0.01 g | 4.18 ± 0.02 b | 1.8 ± 0.1 b | 0.0041 ± 0.0002 d | 7.5 ± 0.2 d |
| B11 | 0.490 ± 0.003 cd | 0.64 ± 0.02 h | 3.21 ± 0.03 f | 2.4 ± 0.1 a | tr | 6.8 ± 0.1 e |
| B12 | 0.75 ± 0.01 cd | 0.51 ± 0.01 i | 6.16 ± 0.02 a | 1.88 ± 0.03 b | 0.0016 ± 0.0001 e | 9.31 ± 0.02 b |
| B13 | 0.392 ± 0.001 cd | 0.30 ± 0.01 l | 3.79 ± 0.01 c | 1.25 ± 0.05 d | tr | 5.73 ± 0.03 f |
| B14 | 0.549 ± 0.002 cd | 0.185 ± 0.001 m | 2.231 ± 0.001 j | 1.34 ± 0.04 c | tr | 4.30 ± 0.04 h |
| B15 | 40.8 ± 0.2 a | tr | 0.0209 ± 0.0001 n | 0.95 ± 0.03 fg | tr | 41.8 ± 0.2 a |
| B16 | 0.40 ± 0.02 cd | 0.11 ± 0.01 n | 0.631 ± 0.003 m | n.d. | n.d. | 1.15 ± 0.01 k |
Publisher’s Note: MDPI stays neutral with regard to jurisdictional claims in published maps and institutional affiliations. |
© 2022 by the authors. Licensee MDPI, Basel, Switzerland. This article is an open access article distributed under the terms and conditions of the Creative Commons Attribution (CC BY) license (https://creativecommons.org/licenses/by/4.0/).
Share and Cite
Mandim, F.; Petropoulos, S.A.; Santos-Buelga, C.; Ferreira, I.C.F.R.; Barros, L. Effect of Harvesting Time on the Chemical Composition of Cynara cardunculus L. var. altilis Blades. Agronomy 2022, 12, 1705. https://doi.org/10.3390/agronomy12071705
Mandim F, Petropoulos SA, Santos-Buelga C, Ferreira ICFR, Barros L. Effect of Harvesting Time on the Chemical Composition of Cynara cardunculus L. var. altilis Blades. Agronomy. 2022; 12(7):1705. https://doi.org/10.3390/agronomy12071705
Chicago/Turabian StyleMandim, Filipa, Spyridon A. Petropoulos, Celestino Santos-Buelga, Isabel C. F. R. Ferreira, and Lillian Barros. 2022. "Effect of Harvesting Time on the Chemical Composition of Cynara cardunculus L. var. altilis Blades" Agronomy 12, no. 7: 1705. https://doi.org/10.3390/agronomy12071705