
Kānuka Trees Facilitate Pasture Production Increases in New Zealand Hill Country


Abstract
:1. Introduction
2. Methods
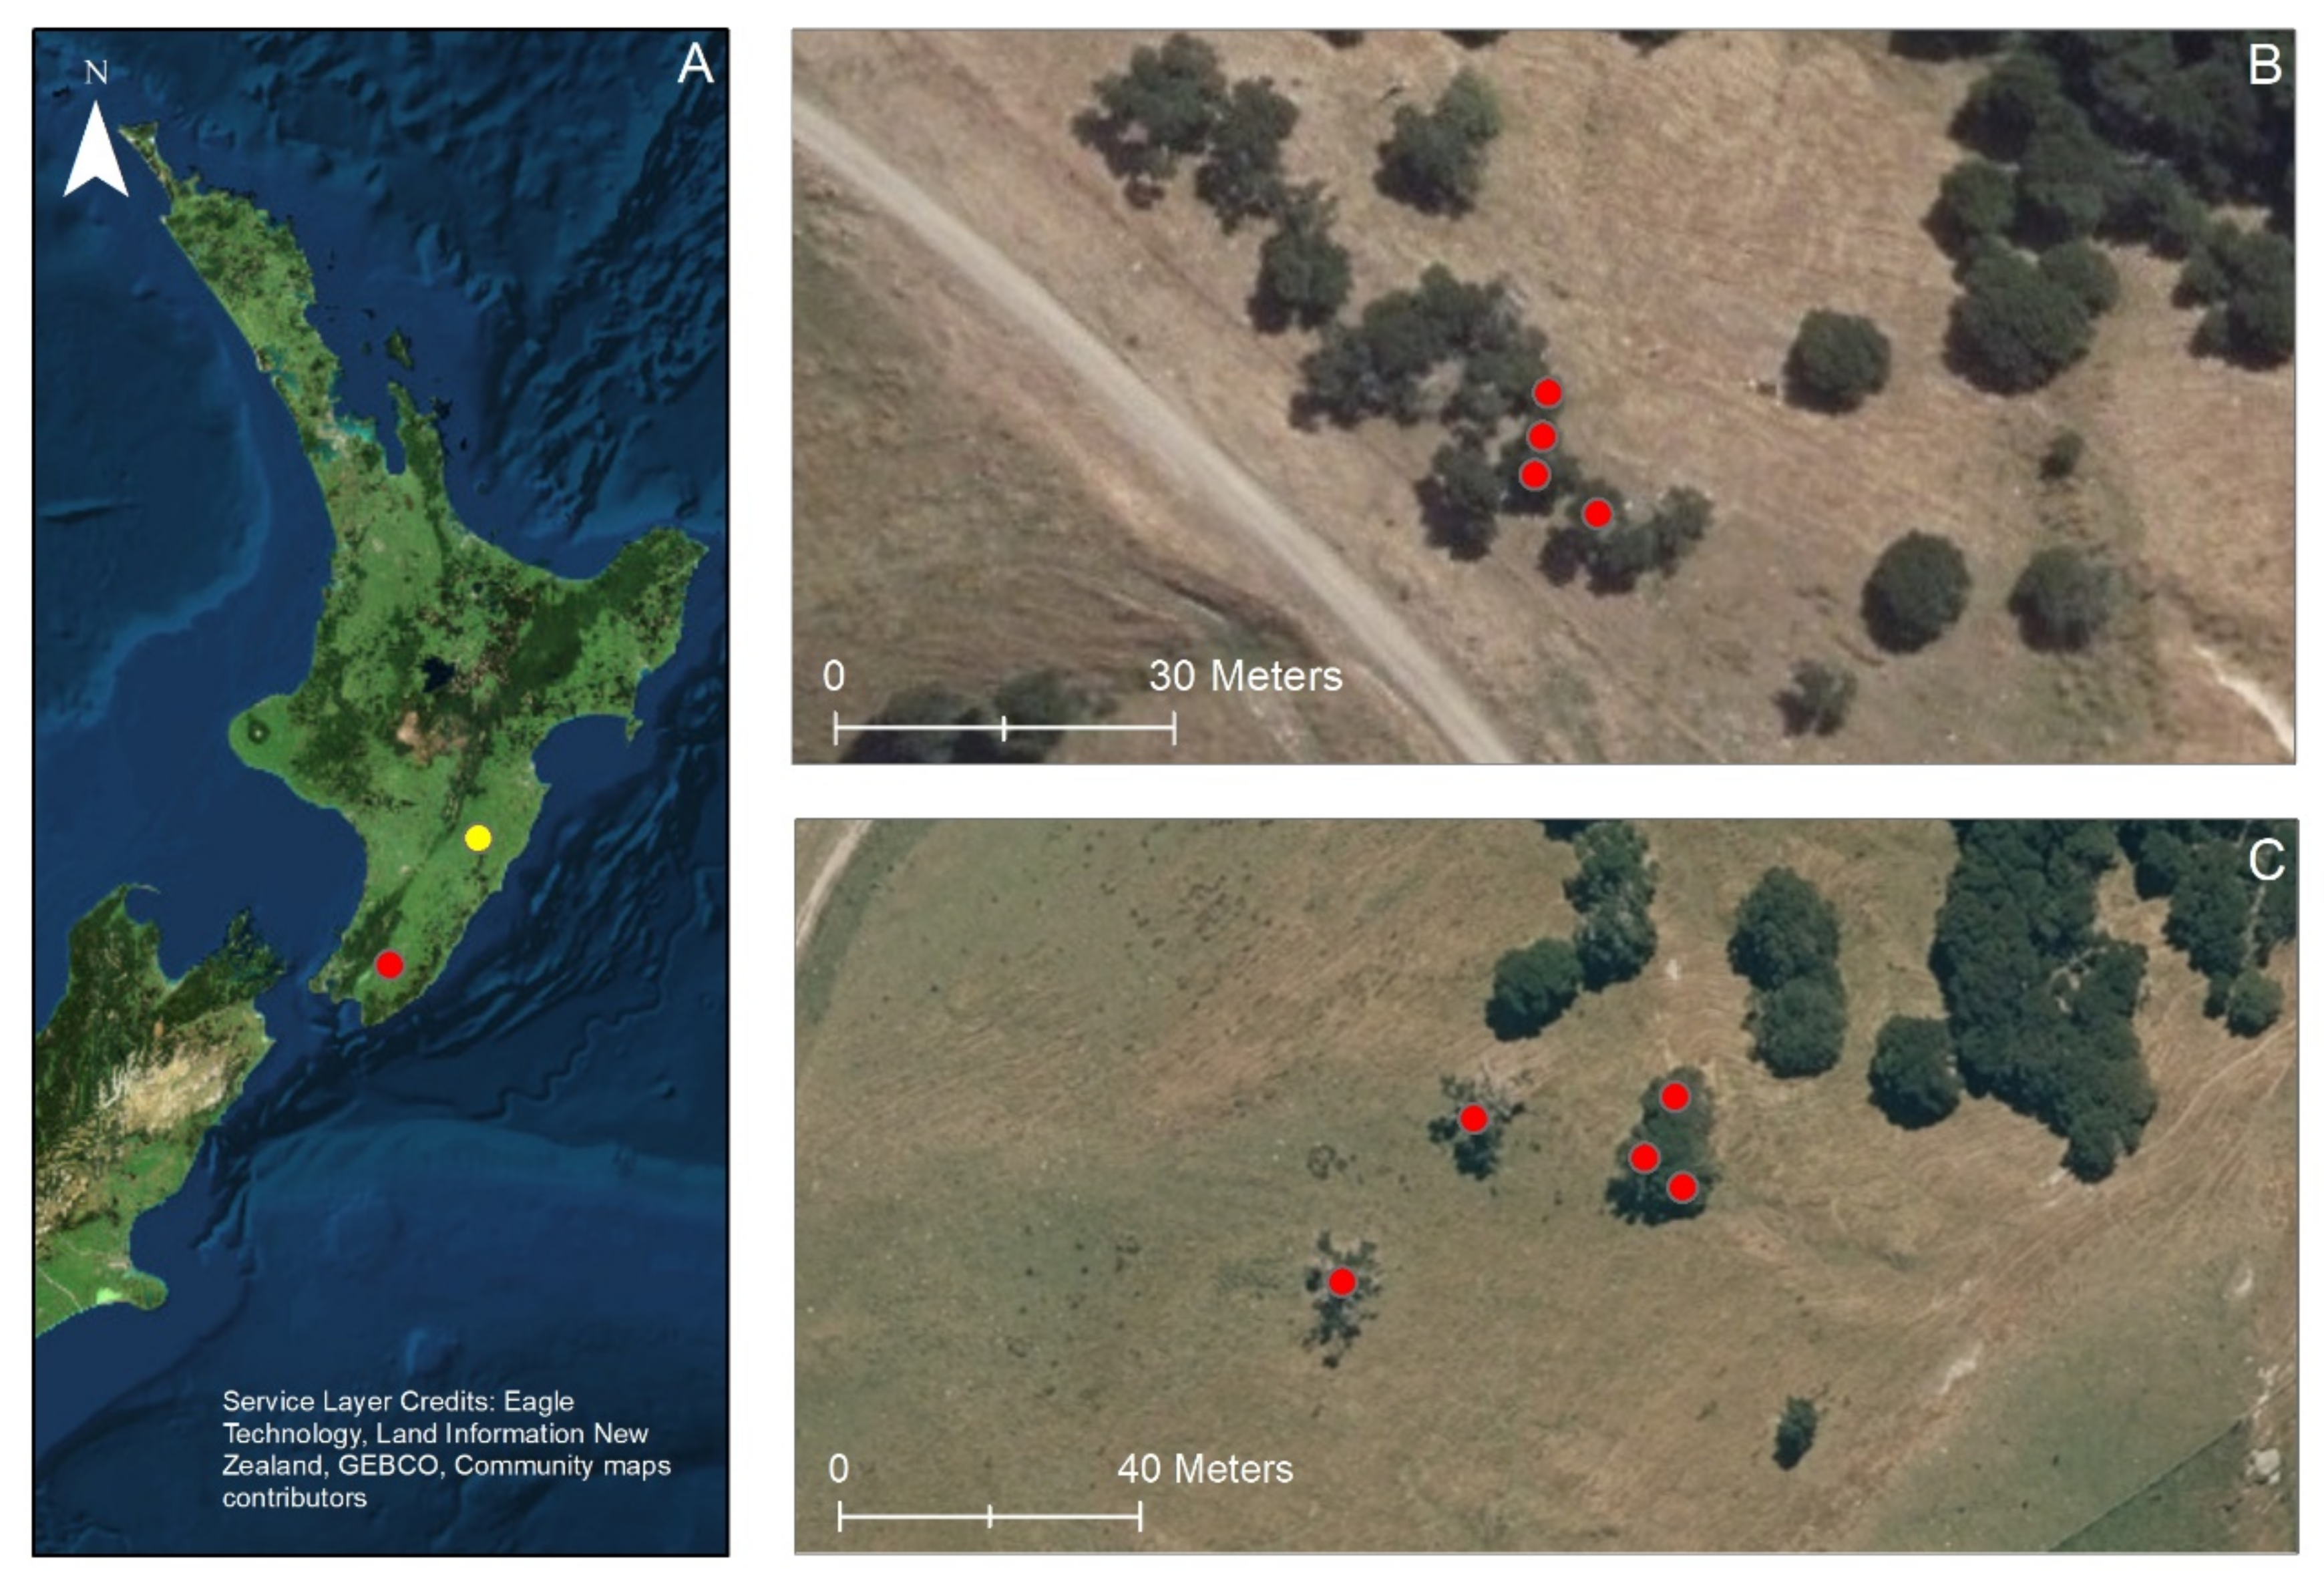
2.1. Study Areas
2.2. Study Design and Measurements
2.3. Statistical Analysis
3. Results
3.1. Pasture Production
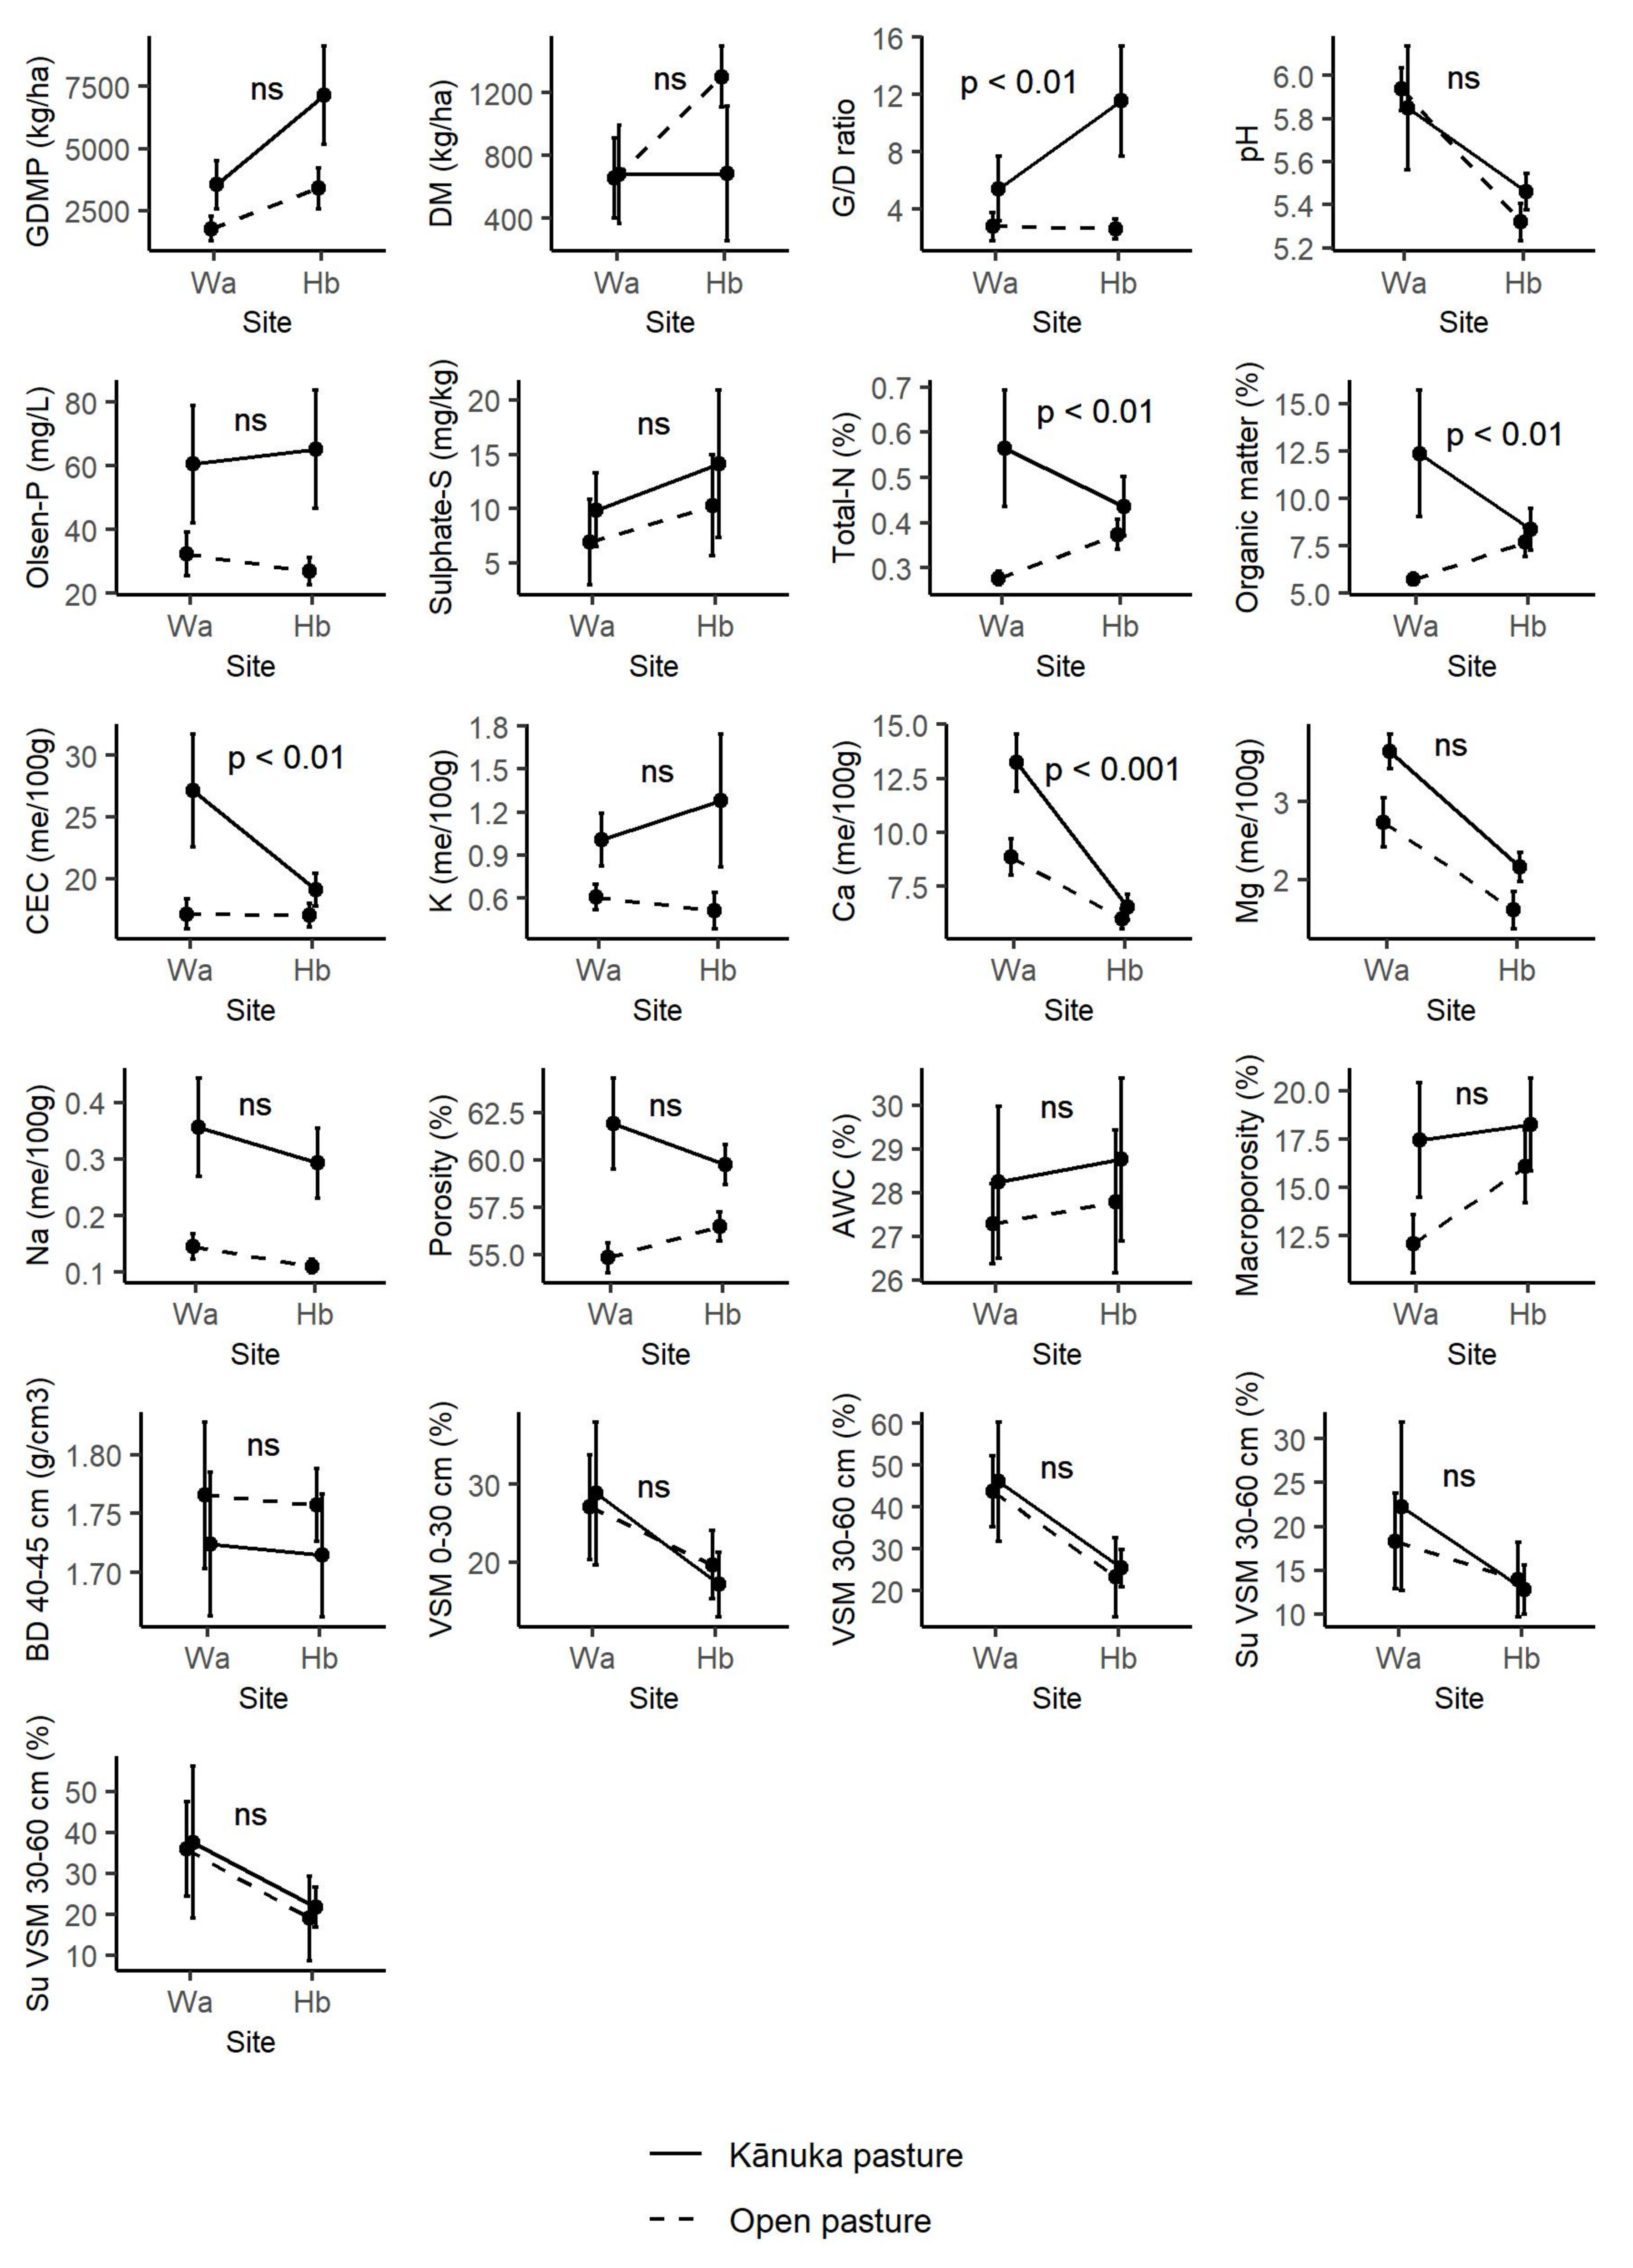
3.2. Factors Influencing Pasture Production
3.3. Canonical Variate Analysis
4. Discussion
4.1. Soil Nutrients
4.2. Soil Water and Structure
4.3. Tree Bio-Physical Attributes
4.4. Limitations
5. Conclusions
Author Contributions
Funding
Institutional Review Board Statement
Informed Consent Statement
Data Availability Statement
Acknowledgments
Conflicts of Interest
References
- Gallardo, A. Effect of Tree Canopy on the Spatial Distribution of Soil Nutrients in a Mediterranean Dehesa. Pedobiologia 2003, 47, 117–125. [Google Scholar] [CrossRef]
- Marañón, T.; Pugnaire, F.I.; Callaway, R.M. Mediterranean-Climate Oak Savannas: The Interplay between Abiotic Environment and Species Interactions. Web Ecol. 2009, 9, 30–43. [Google Scholar] [CrossRef] [Green Version]
- Rossetti, I.; Bagella, S.; Cappai, C.; Caria, M.C.; Lai, R.; Roggero, P.P.; Martins da Silva, P.; Sousa, J.P.; Querner, P.; Seddaiu, G. Isolated Cork Oak Trees Affect Soil Properties and Biodiversity in a Mediterranean Wooded Grassland. Agric. Ecosyst. Environ. 2015, 202, 203–216. [Google Scholar] [CrossRef]
- Howlett, D.S.; Moreno, G.; Mosquera Losada, M.R.; Nair, P.K.R.; Nair, V.D. Soil Carbon Storage as Influenced by Tree Cover in the Dehesa Cork Oak Silvopasture of Central-Western Spain. J. Environ. Monit. 2011, 13, 1897. [Google Scholar] [CrossRef] [Green Version]
- Moreno Marcos, G.; Obrador, J.J.; García, E.; Cubera, E.; Montero, M.J.; Pulido, F.J.; Dupraz, C. Driving Competitive and Facilitative Interactions in Oak Dehesas through Management Practices. Agroforest Syst. 2007, 70, 25–40. [Google Scholar] [CrossRef]
- Joffre, R.; Rambal, S. Soil Water Improvement by Trees in the Rangelands of Southern Spain. Acta Oecologica 1988, 9, 405–422. [Google Scholar]
- Peri, P.L. Patagonia Sur. Sistemas Silvopastoriles en Ñirantales. IDIA XXI For. 2005, 5, 245–249. [Google Scholar]
- Belsky, A.J.; Mwonga, S.M.; Amundson, R.G.; Duxbury, J.M.; Ali, A.R. Comparative Effects of Isolated Trees on Their Undercanopy Environments in High- and Low-Rainfall Savannas. J. Appl. Ecol. 1993, 30, 143. [Google Scholar] [CrossRef]
- Fernández-Moya, J.; San Miguel-Ayanz, A.; Cañellas, I.; Gea-Izquierdo, G. Variability in Mediterranean Annual Grassland Diversity Driven by Small-Scale Changes in Fertility and Radiation. Plant Ecol. 2011, 212, 865–877. [Google Scholar] [CrossRef]
- Aryal, D.R.; Gómez-González, R.R.; Hernández-Nuriasmú, R.; Morales-Ruiz, D.E. Carbon Stocks and Tree Diversity in Scattered Tree Silvopastoral Systems in Chiapas, Mexico. Agrofor. Syst. 2019, 93, 213–227. [Google Scholar] [CrossRef]
- Seddaiu, G.; Bagella, S.; Pulina, A.; Cappai, C.; Salis, L.; Rossetti, I.; Lai, R.; Roggero, P.P. Mediterranean Cork Oak Wooded Grasslands: Synergies and Trade-Offs between Plant Diversity, Pasture Production and Soil Carbon. Agrofor. Syst. 2018, 92, 893–908. [Google Scholar] [CrossRef]
- Bahamonde, H.A.; Peri, P.L.; Martínez Pastur, G.; Lecinas, M.V. Variaciones Microclimaticas En Bosques Primarios y Bajo Uso Silvopastoril de Nothofagus Antarctica en Dos Clases de Sitio en Patagonia Sur. In Proceedings of the the 1st National Congress of Silvopastoral Systems; INTA Editions: Misiones, Argentina, 2009; pp. 14–16. [Google Scholar]
- Betteridge, K.; Costall, D.; Martin, S.; Reidy, B.; Stead, A.; Millner, I. Impact of Shade Trees on Angus Cow Behaviour and Physiology in Summer Dry Hill Country: Grazing Activity, Skin Temperature and Nutrient Transfer Issues. In Advanced Nutrient Management: Gains from the Past—Goals for the Future; Currie, L.D., Christensen, C.L., Eds.; Fertiliser and Lime Research Centre, Massey University New Zealand: Palmerston North, New Zealand, 2012; p. 10. [Google Scholar]
- Blackshaw, J.K.; Blackshaw, A.W. Heat Stress in Cattle and the Effect of Shade on Production and Behaviour: A Review. Aust. J. Exp. Agric. 1994, 34, 285–295. [Google Scholar] [CrossRef]
- Soares, A.B.; Sartor, L.R.; Adami, P.F.; Varella, A.C.; Fonseca, L.; Mezzalira, J.C. Influência da luminosidade no comportamento de onze espécies forrageiras perenes de verão. R. Bras. Zootec. 2009, 38, 443–451. [Google Scholar] [CrossRef] [Green Version]
- McAdam, J.H.; McEvoy, P.M. The Potential for Silvopastoralism to Enhance Biodiversity on Grassland Farms in Ireland. In Agroforestry in Europe: Current Status and Future Prospects; Rigueiro-Rodríguez, A., McAdam, J.H., Mosquera-Losada, M.R., Eds.; Springer: Cham, Switzerland, 2009; pp. 343–358. [Google Scholar]
- Pulido, F.J.; Díaz, M. Relaciones Entre La Estructura de La Vegetación y Las Comunidades de Aves Nidificantes En Las Dehesas: Influencia Del Manejo Humano. Ardeola 1992, 39, 63–72. [Google Scholar]
- Rodríguez-Rojo, M.P.; Roig, S.; López-Carrasco, C.; Redondo García, M.M.; Sánchez-Mata, D. Which Factors Favour Biodiversity in Iberian Dehesas? Sustainability 2022, 14, 2345. [Google Scholar] [CrossRef]
- Dodd, M.B.; Mcdowell, R.W.; Quinn, J.M. A Review of Contaminant Losses to Water from Pastoral Hill Lands and Mitigation Options. NZGA Res. Pract. Ser. 2016, 16, 137–147. [Google Scholar] [CrossRef]
- Basher, L. Erosion Processes and Their Control in New Zealand. In Ecosystem Services in New Zealand—Conditions and Trends; Dymond, J., Ed.; Manaaki Whenua Press: Palmerston North, New Zealand, 2013; pp. 363–374. [Google Scholar]
- Douglas, G.B.; Mcivor, I.R.; Manderson, A.K.; Koolaard, J.P.; Todd, M.; Braaksma, S.; Gray, R.A.J. Reducing Shallow Landslide Occurrence in Pastoral Hill Country Using Wide-Spaced Trees. Land Degrad. Develop. 2013, 24, 103–114. [Google Scholar] [CrossRef]
- McIvor, I.R.; Clarke, K.; Douglas, G. Effectiveness of Conservation Trees in Reducing Erosion Following a Storm Event. In Proceedings of the 28th Annual Fertiliser and Lime Research Centre Workshop ‘Moving Farm Systems to Improved Attenuation’; Occasional Report 28; Massey University: Palmerston North, New Zealand, 2015; pp. 1–12. [Google Scholar]
- Wilkinson, A.G. Poplars and Willows for Soil Erosion Control in New Zealand. Biomass Bioenergy 1999, 16, 263–274. [Google Scholar] [CrossRef]
- Benavides, R.; Douglas, G.B.; Osoro, K. Silvopastoralism in New Zealand: Review of Effects of Evergreen and Deciduous Trees on Pasture Dynamics. Agrofor. Syst. 2009, 76, 327–350. [Google Scholar] [CrossRef]
- Hicks, D.H.; Anthony, T. Soil Conservation Technical Handbook; Ministry for the Environment: Wellington, New Zealand, 2001; pp. 1–75. [Google Scholar]
- Kemp, P.D.; Hawke, M.; Knowles, R. Temperate Agroforestry Systems in New Zealand. In Temperate Agroforestry Systems; Gordon, A.W., Newman, S.M., Coleman, B.R.W., Eds.; CAB International: Oxfordshire, UK, 2018; pp. 224–236. [Google Scholar]
- Marden, M.; Phillips, C. Survival and Growth of Poplar and Willow Pole Plantings on East Coast Hill Country: A Pilot Study; Landcare Research: Gisborne, New Zealand, 2013; pp. 1–26. [Google Scholar]
- McIvor, I.R.; Hedderley, D.I.; Hurst, S.E.; Fung, L.E. Survival and Growth to Age 8 of Four Populus Maximowiczii × P. Nigra Clones in Field Trials on Pastoral Hill Slopes in Six Climatic Zones of New Zealand. N. Z. J. For. Sci. 2011, 41, 151–163. [Google Scholar]
- McIvor, I.R.; Douglas, G.B.; Hurst, S.E.; Hussain, Z.; Foote, A.G. Structural Root Growth of Young Veronese Poplars on Erodible Slopes in the Southern North Island, New Zealand. Agrofor. Syst. 2008, 72, 75–86. [Google Scholar] [CrossRef]
- Phillips, C.; Marden, M.; Suzanne, S.M. Observations of Root Growth of Young Poplar and Willow Planting Types. N. Z. J. For. Sci. 2014, 44, 15. [Google Scholar] [CrossRef] [Green Version]
- Guevara-Escobar, A.; Edwards, W.R.N.; Morton, R.H.; Kemp, P.D.; Mackay, A.D. Tree Water Use and Rainfall Partitioning in a Mature Poplar-Pasture System. Tree Physiol. 2000, 20, 97–106. [Google Scholar] [CrossRef] [PubMed] [Green Version]
- Wullschleger, S.D.; Meinzer, F.C.; Vertessy, R.A. A Review of Whole-Plant Water Use Studies in Trees. Tree Physiol. 1998, 18, 499–512. [Google Scholar] [CrossRef] [Green Version]
- Devkota, N.R.; Wall, A.J.; Kemp, P.D.; Hodgson, J. Relationship between Canopy Closure and Pasture Production in Deciduous Tree Based Temperate Silvopastoral Systems. In Proceedings of the XVIII International Grasslands Conference, Winnipeg, MB, Canada; Saskatoon, SK, Canada, 8–17 June 1997; pp. 652–653. [Google Scholar]
- Douglas, G.B.; Walcroft, A.S.; Wills, B.J.; Hurst, S.E.; Foote, A.G.; Trainor, K.D.; Fung, L.E. Resident Pasture Growth and the Micro-Environment beneath Young, Widespaced Poplars in New Zealand. Proc. N. Z. Grassl. Assoc. 2001, 63, 131–138. [Google Scholar] [CrossRef]
- Gilchrist, A.N.; Hall, J.R.D.; Foote, A.G.; Bulloch, B.T. Pasture Growth around Trees Planted for Grassland Stability. In Proceedings of the XVII Grassland Congress, Rockhampton, QL, Australia, 8–21 February 1993; pp. 2062–2206. [Google Scholar]
- Guevara-Escobar, A.; Kemp, P.D.; Mackay, A.D.; Hodgson, J. Pasture Production and Composition under Poplar in a Hill Environment in New Zealand. Agrofor. Syst. 2007, 69, 199–213. [Google Scholar] [CrossRef]
- Wall, A.J.; Kemp, P.D.; Mackay, A.D. Predicting Pasture Production under Poplars Using Canopy Closure Images. Proc. N. Z. Grassl. Assoc. 2006, 68, 325–330. [Google Scholar] [CrossRef]
- Callaway, R.M.; Nadkarni, N.M.; Mahall, B.E. Facilitation and Interference of Quercus Douglasii on Understory Productivity in Central California. Ecology 1991, 72, 1484–1499. [Google Scholar] [CrossRef]
- Frost, W.E.; McDougald, N.K. Tree Canopy Effects on Herbaceous Production of Annual Rangeland during Drought. J. Range Manag. 1989, 42, 281–283. [Google Scholar] [CrossRef]
- Moreno, G. Response of Understorey Forage to Multiple Tree Effects in Iberian Dehesas. Agric. Ecosyst. Environ. 2008, 123, 239–244. [Google Scholar] [CrossRef]
- Kolb, T.E. Growth and Biomass Partitioning of Northern Red Oak and Yellow-Poplar Seedlings: Effects of Shading and Grass Root Competition. For. Sci. 1990, 36, 34–44. [Google Scholar]
- Peri, P.L.; Bahamonde, H.A.; Lencinas, M.V.; Gargaglione, V.; Soler, R.; Ormaechea, S.; Pastur, G.M. A Review of Silvopastoral Systems in Native Forests of Nothofagus Antarctica in Southern Patagonia, Argentina. Agrofor. Syst. 2016, 90, 933–960. [Google Scholar] [CrossRef]
- Stockley, G. Trees Farms and the New Zealand Landscape; Northern Southland Farm Forestry Association: Dipton, New Zealand, 1974. [Google Scholar]
- Binkley, D. Understanding the Role of Resource Use Efficiency in Determining the Growth of Trees and Forests. In Forests in Development: A Vital Balance; Schlichter, T., Montes, L., Eds.; Springer: Cham, Switzerland, 2012; pp. 13–26. [Google Scholar]
- Gouveia, A.C.; Freitas, H. Intraspecific Competition and Water Use Efficiency in Quercus Suber: Evidence of an Optimum Tree Density? Trees 2008, 22, 521–530. [Google Scholar] [CrossRef]
- Pulido, F.J.; Díaz, M.; Hidalgo de Trucios, S.J. Size Structure and Regeneration of Spanish Holm Oak Quercus Ilex Forests and Dehesas: Effects of Agroforestry Use on Their Long-Term Sustainability. For. Ecol. Manag. 2001, 146, 1–13. [Google Scholar] [CrossRef]
- Sánchez-González, M.; Tomé, M.; Montero, G. Modelling Height and Diameter Growth of Dominant Cork Oak Trees in Spain. Ann. For. Sci. 2005, 62, 633–643. [Google Scholar] [CrossRef] [Green Version]
- Roig, S.; Evett, R.; Gea-Izquierdo, G.; Cañellas, I.; Sánchez-Palomares, O. Climatic Influence on Oak Landscape Distributions. In Mediterranean Oak Woodland Working Landscapes: Dehesas of Spain and Ranchlands of California; Campos, P., Huntsinger, L., Oviedo, J.L., Starrs, P.F., Díaz, M., Standiford, R.B., Montero, G., Eds.; Landscape Series; Springer: Cham, Switzerland, 2013; Volume 16, pp. 61–89. [Google Scholar]
- Mackay-Smith, T.H.; Burkitt, L.; Reid, J.; López, I.F.; Phillips, C. A Framework for Reviewing Silvopastoralism: A New Zealand Hill Country Case Study. Land 2021, 10, 1386. [Google Scholar] [CrossRef]
- Binkley, D.; Stape, J.L.; Ryan, M.G.; Barnard, H.R.; Fownes, J. Age-Related Decline in Forest Ecosystem Growth: An Individual-Tree, Stand-Structure Hypothesis. Ecosystems 2002, 5, 58–67. [Google Scholar] [CrossRef]
- Otto, M.S.G.; Hubbard, R.M.; Binkley, D.; Stape, J.L. Dominant Clonal Eucalyptus Grandis × Urophylla Trees Use Water More Efficiently. For. Ecol. Manag. 2014, 328, 117–121. [Google Scholar] [CrossRef]
- Plieninger, T.; Pulido, F.J.; Konold, W. Effects of Land-Use History on Size Structure of Holm Oak Stands in Spanish Dehesas: Implications for Conservation and Restoration. Envir. Conserv. 2003, 30, 61–70. [Google Scholar] [CrossRef]
- Ratliff, R.D.; Duncan, D.A.; Westfall, S.E. California Oak-Woodland Overstory Species Affect Herbage Understory: Management Implications. J. Range Manag. 1991, 44, 306. [Google Scholar] [CrossRef]
- Charlton, D.; McIvor, I.R.; Gawith, P.; Douglas, G. Growing Poplar and Willow Trees on Farms—Guidelines for Establishing and Managing Poplar and Willow Trees on Farms; Compiled and Prepared by the National Poplar and Willow Users Group as Part of the Sustainable Farming Fund’s Poplar & Willow Project (Grant No. 04/089): New Zealand; Wiley: Hoboken, NJ, USA, 2007; pp. 1–72. [Google Scholar]
- De Lange, P. A Revision of the New Zealand Kunzea Ericoides (Myrtaceae) Complex. PK 2014, 40, 1–185. [Google Scholar] [CrossRef] [Green Version]
- Bergin, D.O.; Kimberleyt, M.O.; Marden, M. How Soon Does Regenerating Scrub Control Erosion? N. Z. For. 1993, 38, 38–40. [Google Scholar]
- Spiekermann, R.I.; McColl, S.; Fuller, I.; Dymond, J.; Burkitt, L.; Smith, H.G. Quantifying the Influence of Individual Trees on Slope Stability at Landscape Scale. J. Environ. Manag. 2021, 286, 112194. [Google Scholar] [CrossRef]
- Boffa Miskell Limited. The Mānuka and Kānuka Plantation Guide; Boffa Miskell Limited: Tauranga, New Zealand, 2017; pp. 1–86. [Google Scholar]
- Hewitt, A.E. New Zealand Soil Classification; Landcare Research Science Series No. 1; Manaaki Whenua Press: Lincoln, New Zealand, 2010; pp. 1172–1269. ISBN 978-0-478-34710-4. [Google Scholar]
- CliFlo. The National Climate Database. Available online: https://cliflo.niwa.co.nz/ (accessed on 14 September 2021).
- López, I.F.; Valentine, I.; Lambert, M.G.; Hedderley, D.I.; Kemp, P.D. Plant Functional Groups in a Heterogeneous Environment. N. Z. J. Agric. Res. 2006, 49, 439–450. [Google Scholar] [CrossRef]
- Nicholas, P.K. Environmental and Management Factors as Determinants of Pasture Diversity and Production of North Island. Ph.D. Thesis, Institute of Natural Resources, Massey University, Palmerston North, New Zealand, 1999. [Google Scholar]
- Retrolens. Retrolens: Historical Image Resource. Available online: https://retrolens.co.nz/ (accessed on 10 November 2021).
- Radcliffe, J.E.; Dale, W.R.; Viggers, E. Pasture Production Measurements on Hill Country. N. Z. J. Agric. Res. 1968, 11, 685–700. [Google Scholar] [CrossRef]
- López, I.F.; Lambert, M.G.; Mackay, A.D.; Valentine, I. The Influence of Topography and Pasture Management on Soil Characteristics and Herbage Accumulation in Hill Pasture in the North Island of New Zealand. Plant Soil 2003, 255, 421–434. [Google Scholar] [CrossRef]
- Blakemore, L.C.; Searle, P.L.; Daly, B.K. Methods for Chemical Analysis of Soils; NZ Soil Bureau Scientific Report 80; NZ Soil Bureau: Lower Hutt, New Zealand, 1987. [Google Scholar]
- Olsen, S.R.; Cole, C.V.; Watanbe, F.S.; Dean, L.A. Estimation of Available Phosphorus in Soils by Extraction with Sodium Bicarbonate; U.S. Government Printing Office: Washington, DC, USA, 1954. [Google Scholar]
- Nelson, D.W.; Sommers, L.E. Total Carbon, Organic Carbon, and Organic Matter. In Methods of Soil Analysis: Part 3 Chemical Methods; Soil Science Society of America, Inc.: Madison, WI, USA; American Society of Agronomy, Inc.: Madison, WI, USA, 1996; pp. 961–1010. [Google Scholar]
- Searle, P.L. The Determination of Phosphate-extractable Sulphate in Soil with an Anion-exchange Membrane. Commun. Soil Sci. Plant Anal. 1988, 19, 1477–1493. [Google Scholar] [CrossRef]
- Hesse, P.R. A Textbook of Soil Chemical Analysis; John Murray: St. Paul, MI, USA, 1971. [Google Scholar]
- Gradwell, M.W.; Birrell, K.S. Methods for Physical Analysis of Soils; New Zealand Soil Bureau, Department of Scientific and Industrial Research: Wellington, New Zealand, 1979; pp. 1–62. [Google Scholar]
- Dörner, J.; Huertas, J.; Cuevas, J.G.; Leiva, C.; Paulino, L.; Arumí, J.L. Water Content Dynamics in a Volcanic Ash Soil Slope in Southern Chile. J. Plant Nutr. Soil Sci. 2015, 178, 693–702. [Google Scholar] [CrossRef]
- Crawley, M.J. The R Book, 1st ed.; John Wiley & Sons: Chichester, UK, 2013. [Google Scholar]
- Zuur, A.F.; Ieno, E.N.; Walker, N.; Saveliev, A.A.; Smith, G.M. Mixed Effects Models and Extensions in Ecology with R; Statistics for Biology and Health; Springer: New York, NY, USA, 2009; ISBN 978-0-387-87457-9. [Google Scholar]
- Jobson, J.D. Applied Multivariate Data Analysis. Volume II: Categorical and Multivariate Methods; Springer-Verlag: New York, NY, USA, 1996. [Google Scholar]
- Weihs, C. Canonical Discriminant Analysis: Comparison of Resampling Methods and Convex-Hull Approximation. In Recent Advances in Descriptive Multivariate Analysis; Oxford University Press: New York, NY, USA, 1995; pp. 34–50. [Google Scholar]
- McLaren, R.G.; Cameron, K.C. Soil Science: Sustainable Production and Environmental Protection, 2nd ed.; Oxford University Press: Oxford, UK, 1996. [Google Scholar]
- R Core Team. R: A Language and Environment for Statistical Computing; R Foundation for Statistical Computing: Vienna, Austria, 2021. [Google Scholar]
- Bates, D.; Mächler, M.; Bolker, B.; Walker, S. Fitting Linear Mixed-Effects Models Using Lme4. J. Stat. Softw. 2015, 67, 1–48. [Google Scholar] [CrossRef]
- Friendly, M. Package ‘Candisc’; R Package; R Core Team: Vienna, Austria, 2021. [Google Scholar]
- Devkota, N.R.; Kemp, P.D.; Hodgson, J.; Valentine, I.; Jaya, I.K.D. Relationship between Tree Canopy Height and the Production of Pasture Species in a Silvopastoral System Based on Alder Trees. Agrofor. Syst. 2009, 76, 363–374. [Google Scholar] [CrossRef]
- Power, I.L.; Dodd, M.B.; Thorrold, B.S. A Comparison of Pasture and Soil Moisture under Acacia Melanoxylon and Eucalyptus Nitens. Proc. N. Z. Grassl. Assoc. 1999, 61, 203–207. [Google Scholar]
- Dahlgren, R.A.; Singer, M.J.; Huang, X. Oak Tree and Grazing Impacts on Soil Properties and Nutrients in a California Oak Woodland. Biogeochemistry 1997, 39, 45–64. [Google Scholar] [CrossRef]
- Marañón, T.; Bartolome, J.W. Coast Live Oak (Quercus Agrifolia) Effects on Grassland Biomass and Diversity. Madroño 1994, 41, 39–52. [Google Scholar]
- Guevara-Escobar, A.; Kemp, P.D.; Mackay, A.; Hodgson, J. Soil Properties of a Widely Spaced, Planted Poplar (Populus Deltoides)-Pasture System in a Hill Environment. Aust. J. Soil Res. 2002, 40, 873–886. [Google Scholar] [CrossRef]
- Wall, A.J. The Effect of Poplar Stand Density on Hill Country Pastures. Ph.D. Thesis, Institute of Natural Resources, Massey University, Palmerston North, New Zealand, 2006. [Google Scholar]
- Morton, J.D.; Roberts, A.H.C. Fertiliser Use on New Zealand Sheep and Beef Farms: The Principles and Practice of Soil Fertility and Fertiliser Use on New Zealand Sheep and Beef Farms, 5th ed.; Fertiliser Association: Wellington, New Zealand, 2018. [Google Scholar]
- López, I.F.; Hodgson, J.; Hedderley, D.I.; Valentine, I.; Lambert, M.G. Selective Defoliation by Sheep According to Slope and Plant Species in the Hill Country of New Zealand: Selective Grazing by Sheep. Grass Forage Sci. 2003, 58, 339–349. [Google Scholar] [CrossRef]
- Saggar, S.; Mackay, A.D.; Hedley, M.J.; Lambert, M.G.; Clark, D.A. A Nutrient-Transfer Model to Explain the Fate of Phosphorus and Sulphur in a Grazed Hill-Country Pasture. Agric. Ecosyst. Environ. 1990, 30, 295–315. [Google Scholar] [CrossRef]
- Lambie, S.M.; Dando, J. Seasonal Litterfall Composition and Carbon and Nitrogen Returns in New Zealand Shrubland. Aust. J. Bot. 2019, 67, 610–616. [Google Scholar] [CrossRef]
- Catriona, M.O.; Macinnis, N.G.; Flores, E.E.; Müller, H.; Schwendenmann, L. Rainfall Partitioning into Throughfall and Stemflow and Associated Nutrient Fluxes: Land Use Impacts in a Lower Montane Tropical Region of Panama. Biogeochemistry 2012, 111, 661–676. [Google Scholar] [CrossRef]
- Veneklaas, E.J. Nutrient Fluxes in Bulk Precipitation and Throughfall in Two Montane Tropical Rain Forests, Colombia. J. Ecol. 1990, 78, 974. [Google Scholar] [CrossRef]
- He, X.-H.; Critchley, C.; Bledsoe, C. Nitrogen Transfer Within and Between Plants Through Common Mycorrhizal Networks (CMNs). Crit. Rev. Plant Sci. 2003, 22, 531–567. [Google Scholar] [CrossRef]
- Querejeta, J.I.; Egerton-Warburton, L.M.; Allen, M.F. Hydraulic Lift May Buffer Rhizosphere Hyphae against the Negative Effects of Severe Soil Drying in a California Oak Savanna. Soil Biol. Biochem. 2007, 39, 409–417. [Google Scholar] [CrossRef]
- Deng, Y.; Feng, G.; Chen, X.; Zou, C. Arbuscular Mycorrhizal Fungal Colonization Is Considerable at Optimal Olsen-P Levels for Maximized Yields in an Intensive Wheat-Maize Cropping System. Field Crop. Res. 2017, 209, 1–9. [Google Scholar] [CrossRef]
- Kurz-Besson, C.; Otieno, D.; Lobo do Vale, R.; Siegwolf, R.; Schmidt, M.; Herd, A.; Nogueira, C.; David, T.S.; David, J.S.; Tenhunen, J.; et al. Hydraulic Lift in Cork Oak Trees in a Savannah-Type Mediterranean Ecosystem and Its Contribution to the Local Water Balance. Plant Soil 2006, 282, 361–378. [Google Scholar] [CrossRef]
- Ludwig, F.; de Kroon, H.; Berendse, F.; Prins, H.H.T. The Influence of Savanna Trees on Nutrient, Water and Light Availability and the Understorey Vegetation. Plant Ecol. 2004, 170, 93–105. [Google Scholar] [CrossRef]
- Burgess, C.P.; Chapman, R.; Singleton, P.L.; Thom, E.R. Shallow Mechanical Loosening of a Soil under Dairy Cattle Grazing: Effects on Soil and Pasture. N. Z. J. Agric. Res. 2000, 43, 279–290. [Google Scholar] [CrossRef]
- Harrison, D.F.; Cameron, K.C.; McLaren, R.G. Effects of Subsoil Loosening on Soil Physical Properties, Plant Root Growth, and Pasture Yield. N. Z. J. Agric. Res. 1994, 37, 559–567. [Google Scholar] [CrossRef]
- Chapman, R.; Allbrook, R.F. The Effects of Subsoiling Compacted Soils under Grass—A Progress Report. Proc. Agron. Soc. N. Z. 1987, 17, 55–58. [Google Scholar]
- Houlbrooke, D.; Drewry, J.; Hu, W.; Laurenson, S.; Carrick, S. Soil Structure: Its Importance to Resilient Pastures in New Zealand (Review). NZGA Res. Pract. Ser. 2021, 17, 201–212. [Google Scholar] [CrossRef]
- Koppe, E.; Rupollo, C.Z.; de Queiroz, R.; Uteau Puschmann, D.; Peth, S.; Reinert, D. Physical Recovery of an Oxisol Subjected to Four Intensities of Dairy Cattle Grazing. Soil Tillage Res. 2021, 206, 104813. [Google Scholar] [CrossRef]
- Zhang, B.; Beck, R.; Pan, Q.; Zhao, M.; Hao, X. Soil Physical and Chemical Properties in Response to Long-Term Cattle Grazing on Sloped Rough Fescue Grassland in the Foothills of the Rocky Mountains, Alberta. Geoderma 2019, 346, 75–83. [Google Scholar] [CrossRef]
- Douglas, G.B.; Walcroft, A.S.; Hurst, S.E.; Potter, J.F.; Foote, A.G.; Fung, L.E.; Edwards, W.R.N.; van den Dijssel, C. Interactions between Widely Spaced Young Poplars (Populus Spp.) and Introduced Pasture Mixtures. Agrofor. Syst. 2006, 66, 165–178. [Google Scholar] [CrossRef]
- McWilliam, E.L.; Barry, T.N.; Lopez-Villalobos, N.; Cameron, P.N.; Kemp, P.D. The Effect of Different Levels of Poplar (Populus) Supplementation on the Reproductive Performance of Ewes Grazing Low Quality Drought Pasture during Mating. Anim. Feed Sci. Technol. 2004, 115, 1–18. [Google Scholar] [CrossRef]
- Rivest, D.; Paquette, A.; Moreno, G.; Messier, C. A Meta-Analysis Reveals Mostly Neutral Influence of Scattered Trees on Pasture Yield along with Some Contrasted Effects Depending on Functional Groups and Rainfall Conditions. Agric. Ecosyst. Environ. 2013, 165, 74–79. [Google Scholar] [CrossRef]


| Study Site | Wairarapa | Hawkes Bay |
|---|---|---|
| Location | 41°08′41.3″ S, 175°29′58.3″ E | 40°08′25.9″ S, 176°23′39.1″ E |
| Region | Wairarapa, North Island of New Zealand | Hawkes Bay, North Island of New Zealand |
| Elevation (m) | 122 | 288 |
| Basement rock | Sandstone | Mudstone |
| New Zealand soil classification | Mottled Argillic Pallic Soil [59] | Mottled Argillic Pallic Soil [59] |
| US soil classification | Ustalf [59] | Ustalf [59] |
| Topsoil type | Silt loam | Silt loam |
| Subsoil type (B horizon) | Silty clay loam | Silty clay loam |
| Mean 30-year annual rainfall (mm) | 903 (min: 548; max: 1297), station 2631, 6.6 km from the site, elevation: 61 m [60] | 883 (min: 527; max: 1483), station 2523, 5.8 km from the site, elevation: 153 m [60] |
| Mean 10-year annual temperature (°C) | 18.3 (min: 17.5; max: 19.0), station 21938, 15.0 km from the site, elevation: 22 m [60] | 16.7 (min: 15.8; max: 17.5), station 25820, 15.3 km from the site, elevation: 341 m [60] |
| Paddock topography | Moderately to severely steep (15–40°) | Rolling to moderately steep (10–35°) |
| Livestock operation | Sheep and beef | Sheep and beef |
| Aspect | NE | NW |
| Measurement position slope gradient | 20–25° | 20–25° |
| Variable | Kānuka Pasture | Open Pasture | Significance |
|---|---|---|---|
| GDMP (kg ha−1 yr−1) | 5541.0 (747.8) a | 2665.8 (333.8) b | *** |
| Dead matter (kg ha−1 yr−1) | 681.8 (91.2) b | 1014.8 (123.7) a | *** |
| Green:dead matter ratio | 8.8 (1.3) a | 2.7 (0.2) b | *** |
| Variable | Kānuka Pasture | Open Pasture | Significance |
|---|---|---|---|
| pH | 5.6 (0.3) a | 5.6 (0.3) a | ns |
| Olsen-P (mg L−1) | 63.2 (5.6) a | 29.3 (1.7) b | *** |
| Sulphate-S (mg kg−1) | 12.1 (1.7) a | 8.8 (1.4) a | ns |
| Total-N (%) | 0.5 (0.03) a | 0.3 (0.01) a | ns |
| Organic matter (%) | 10.1 (0.8) a | 6.8 (0.3) a | ns |
| CEC (mg 100 g−1) | 22.7 (1.3) a | 17.1 (0.3) a | ns |
| K (mg 100 g−1) | 1.2 (0.1) a | 0.6 (0.04) b | *** |
| Ca (mg 100 g−1) | 9.5 (0.1) a | 7.3 (0.04) a | ns |
| Mg (mg 100 g−1) | 2.8 (0.2) a | 2.1 (0.2) b | ** |
| Na (mg 100 g−1) | 0.3 (0.02) a | 0.1 (0.007) b | *** |
| Porosity 2–5 cm (%) | 60.6 (0.6) a | 55.7 (0.3) b | * |
| Available water capacity 2–5 cm (%) | 28.5 (0.6) a | 27.6 (0.4) a | ns |
| Macroporosity 2–5 cm (%) | 17.9 (0.8) a | 14.3 (0.7) a | ns |
| Bulk density 40–45 cm (g cm−3) | 1.72 (0.02) a | 1.76 (0.02) a | ns |
| Variable | Kānuka Pasture | Open Pasture | Significance |
|---|---|---|---|
| VSM 0–30 cm (%) | 23.0 (2.5) a | 22.3 (1.8) a | ns |
| Summer a VSM 0–30 cm (%) | 17.0 (6.4) a | 15.9 (3.9) a | ns |
| VSM 30–60 cm (%) | 33.2 (4.0) a | 33.5 (4.3) a | ns |
| Summer a VSM 30–60 cm (%) | 27.7 (9.6) a | 27.5 (11.1) a | ns |
Publisher’s Note: MDPI stays neutral with regard to jurisdictional claims in published maps and institutional affiliations. |
© 2022 by the authors. Licensee MDPI, Basel, Switzerland. This article is an open access article distributed under the terms and conditions of the Creative Commons Attribution (CC BY) license (https://creativecommons.org/licenses/by/4.0/).
Share and Cite
Mackay-Smith, T.H.; López, I.F.; Burkitt, L.L.; Reid, J.I. Kānuka Trees Facilitate Pasture Production Increases in New Zealand Hill Country. Agronomy 2022, 12, 1701. https://doi.org/10.3390/agronomy12071701
Mackay-Smith TH, López IF, Burkitt LL, Reid JI. Kānuka Trees Facilitate Pasture Production Increases in New Zealand Hill Country. Agronomy. 2022; 12(7):1701. https://doi.org/10.3390/agronomy12071701
Chicago/Turabian StyleMackay-Smith, Thomas H., Ignacio F. López, Lucy L. Burkitt, and Janet I. Reid. 2022. "Kānuka Trees Facilitate Pasture Production Increases in New Zealand Hill Country" Agronomy 12, no. 7: 1701. https://doi.org/10.3390/agronomy12071701