
Fatal Tractor Accidents in the Agricultural Sector in Spain during the Past Decade

 , ,
, ,
Abstract
:1. Introduction
- −
- To analyse the spatial and spatio-temporal distribution of fatal accidents in Spain, involving an agricultural tractor, in order to identify those areas, at state level, with the highest risk.
- −
- To relate the occurrence of fatal accidents with the characteristics of the tractor fleet in the corresponding provinces, in the period 2010–2019, in Spain.
2. Materials and Methods
2.1. Basic Data
2.2. Statistical Analysis
3. Results
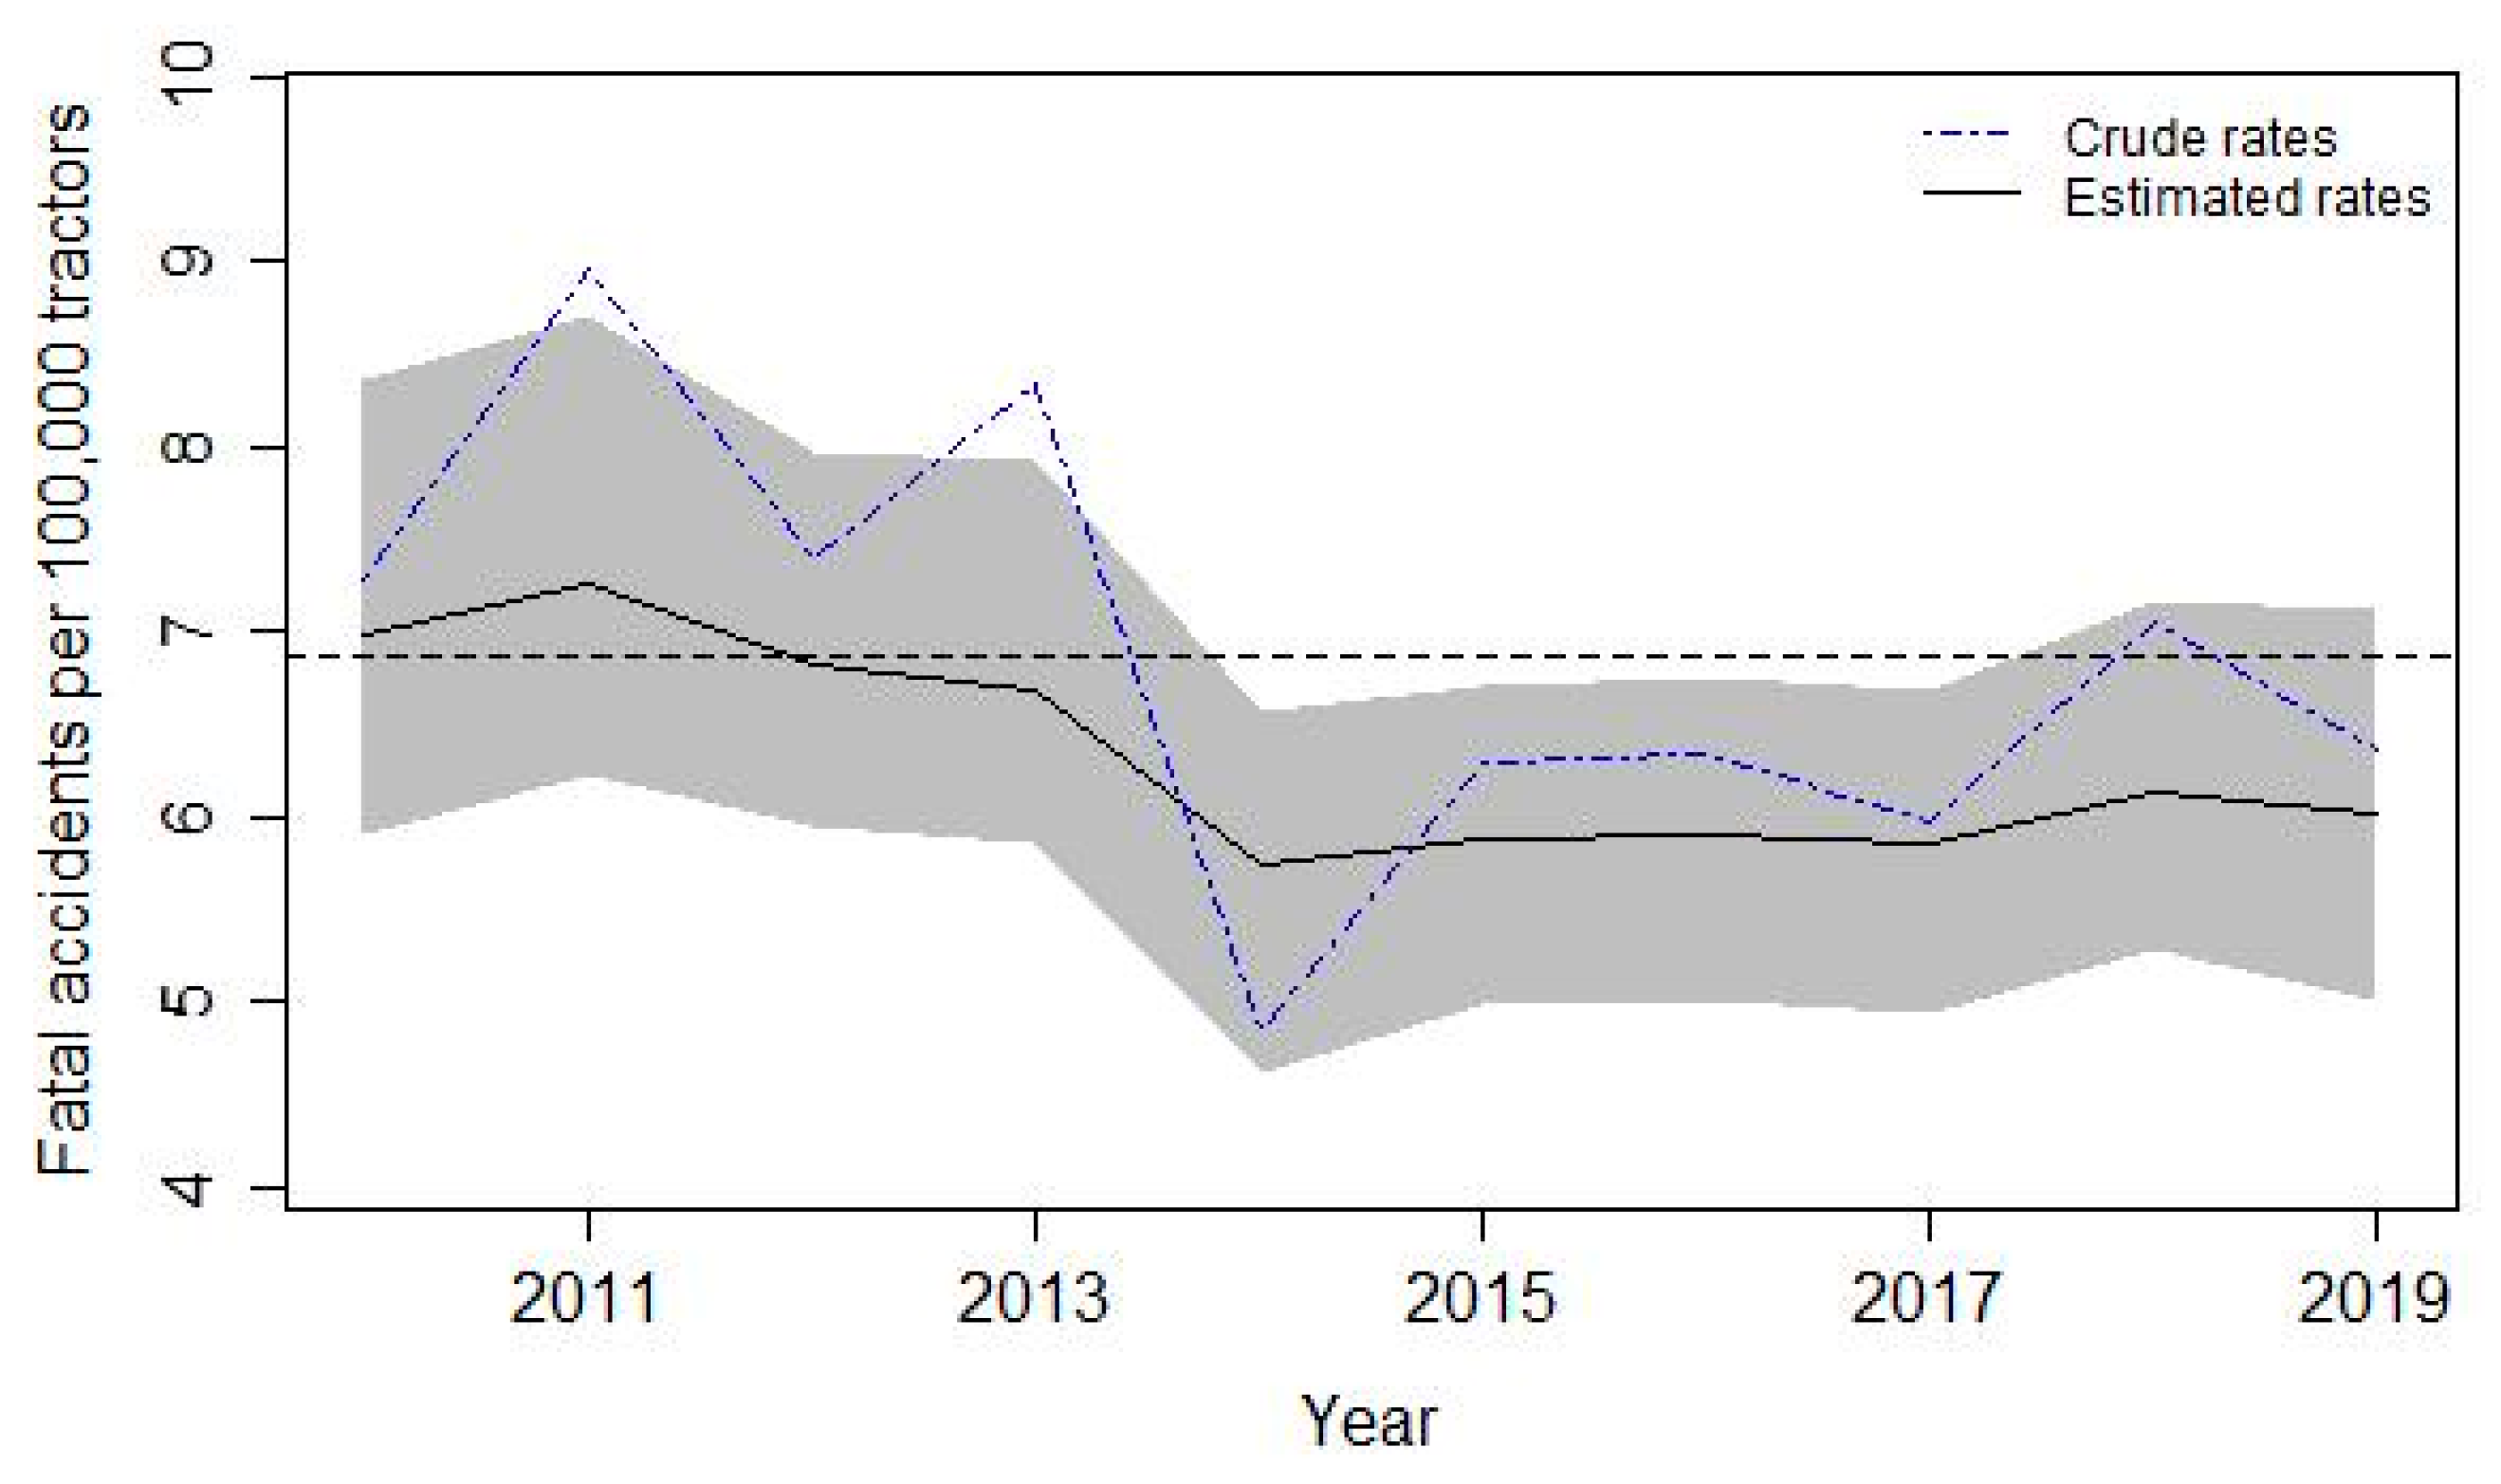
3.1. Analysis of Fatal Accidents
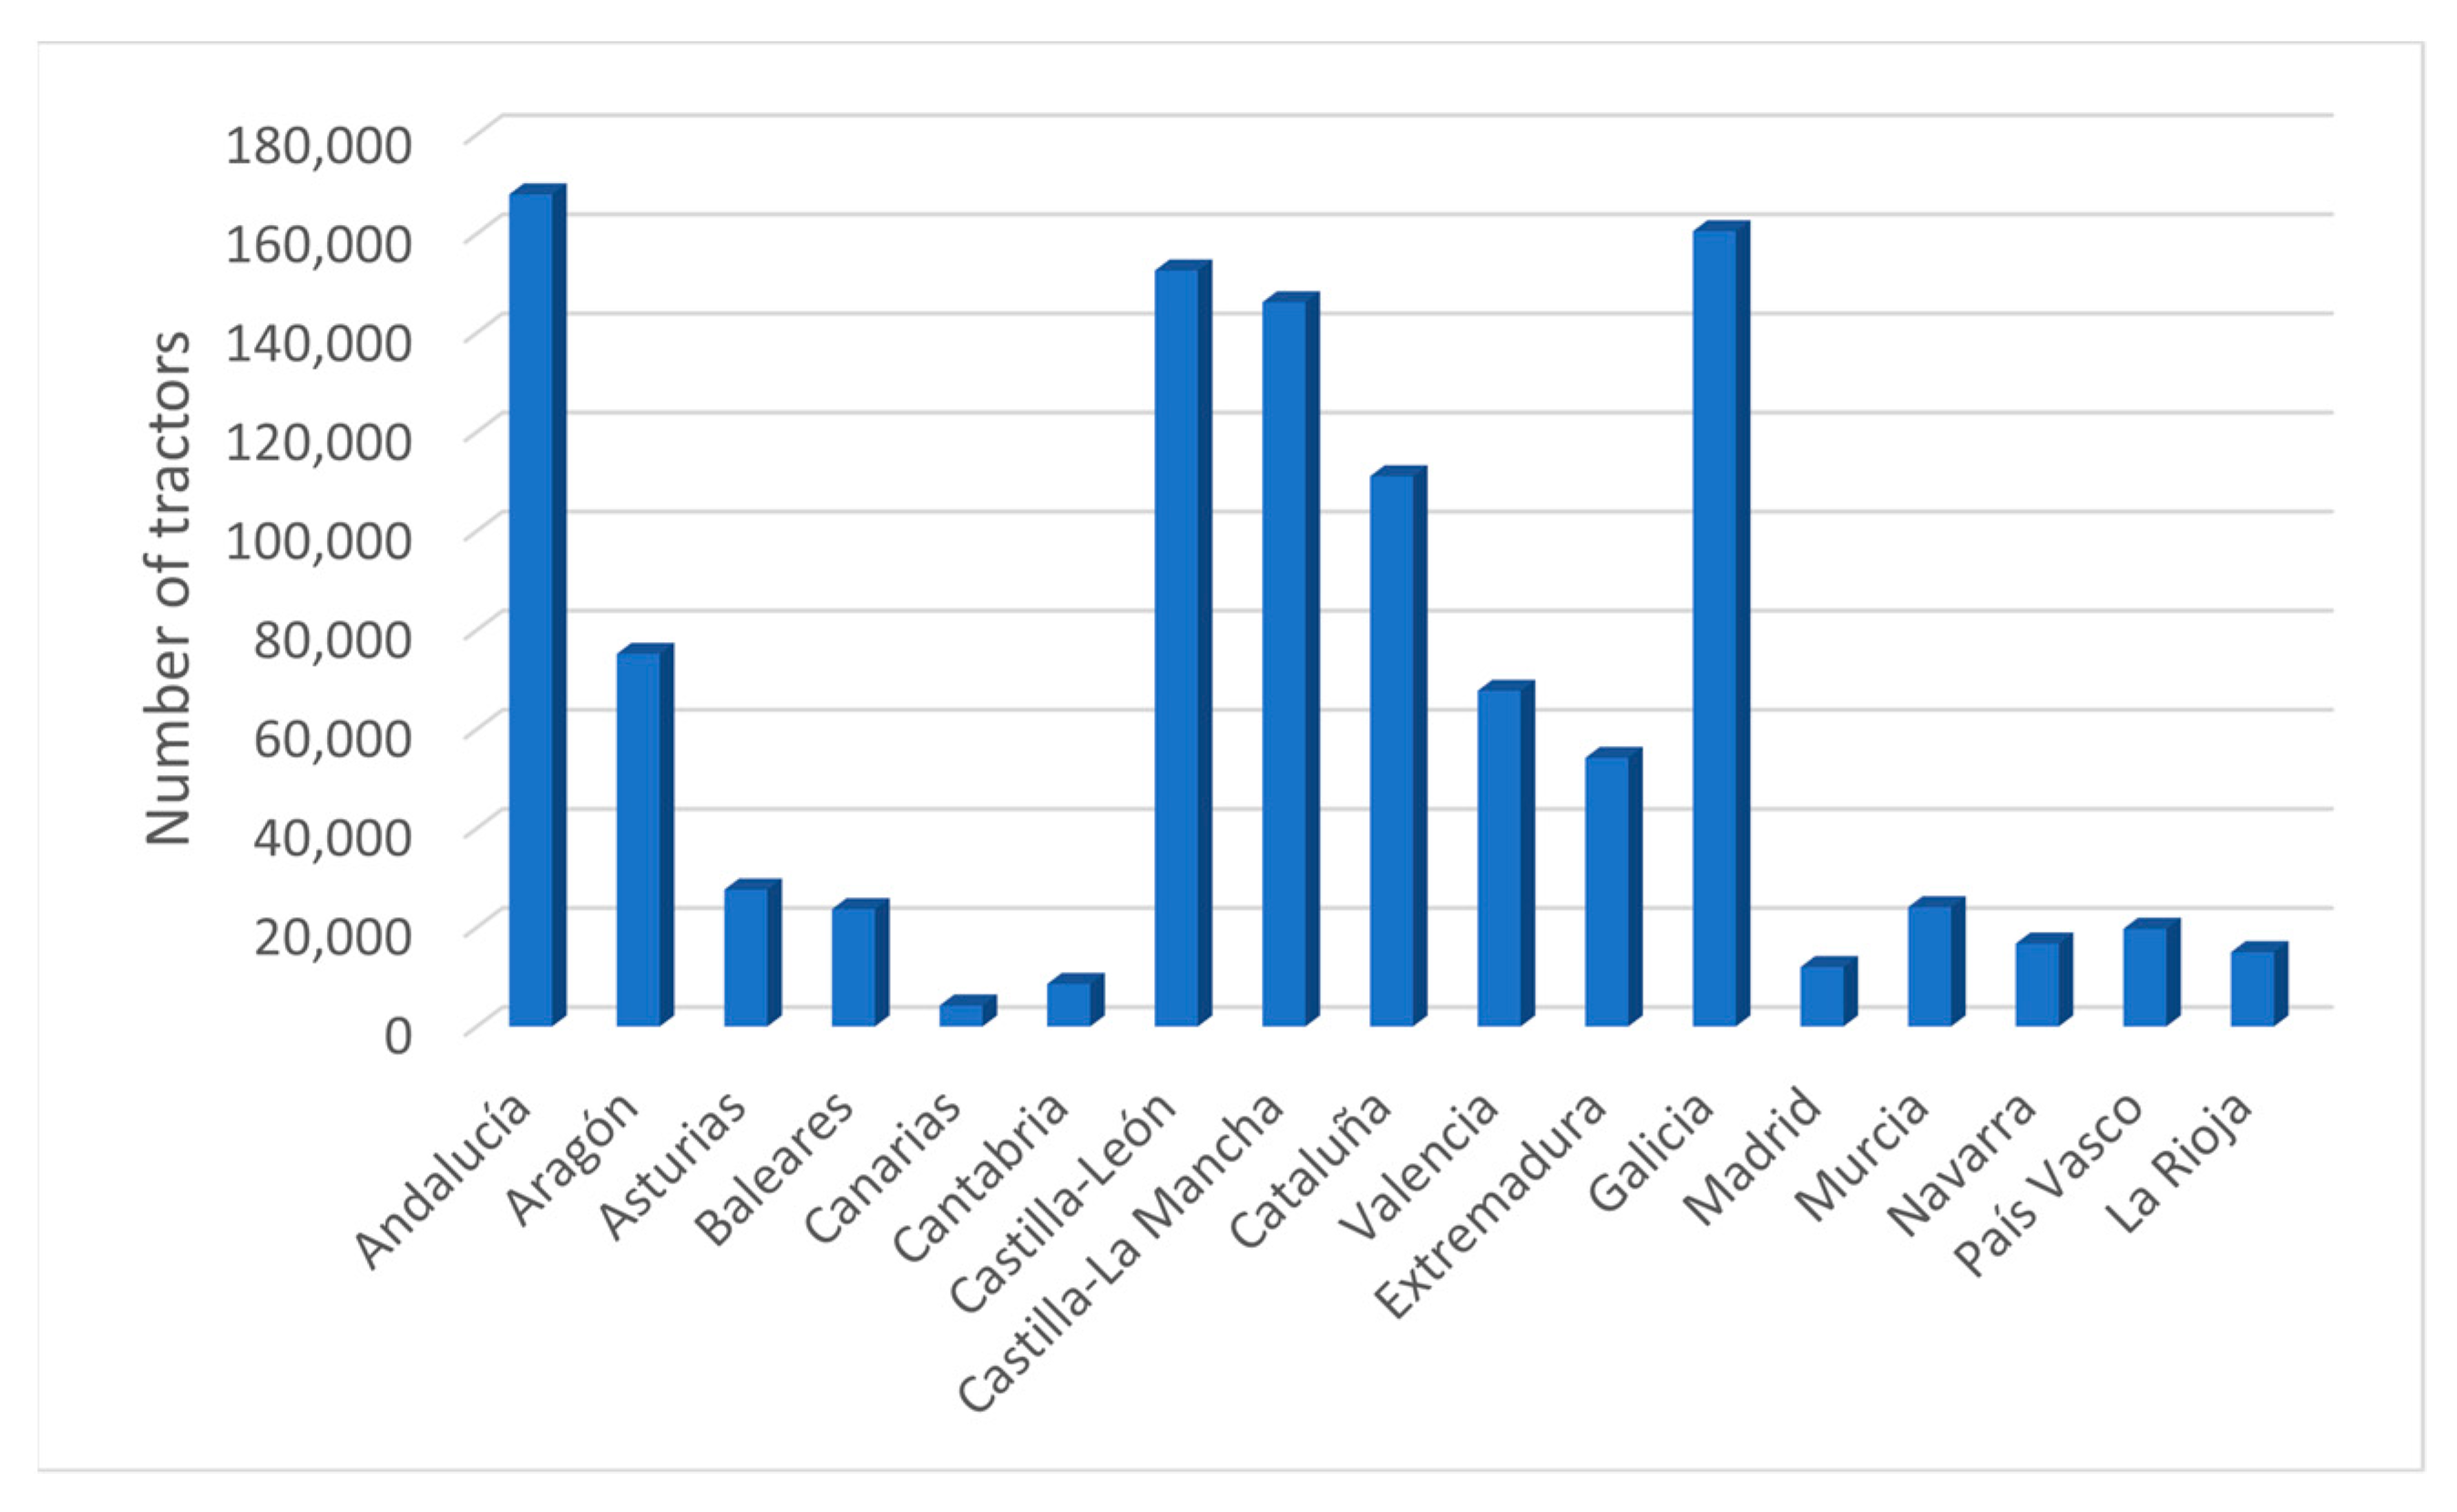
3.2. Analysis of the Tractor Fleet by Autonomous Communities
4. Discussion
5. Conclusions
- Galicia was an Autonomous Region with a high probability of fatal accidents, which may be due to its large fleet of tractors, especially low-powered tractors, and to the high rate of registrations of change of ownership of old tractors, the highest among all the Autonomous Regions.
- Navarre was one of the Autonomous Regions with a high probability of fatal accidents. Despite the fact that the majority of new tractor registrations were for tractors with a power of over 110 kW, most of the changes of ownership were for tractors over 20 years old and other factors such as the type of structure of the farms or the orography would justify this high probability.
- Asturias, País Vasco, Tarragona (in Cataluña), Valencia and Murcia, with a high probability of fatal accidents, did not stand out for their purchase of powerful new tractors, but maintained the general trend of transfers of older tractors.
- Cantabria and La Rioja, with a somewhat lower accident probability than the previous communities, also purchased new tractors of medium power.
- Andalucía and Cataluña, in most of their provinces, had an average probability of fatal tractor accidents. The purchase of new tractors in these regions corresponded to medium horsepower. Andalucía registers proportionally fewer old tractors than other regions.
- Castilla-La Mancha, Castilla-León and Extremadura were regions with a low probability of tractor accidents. In the case of Castilla-León, the relationship between low accident probability and less powerful new tractors did not hold true, since it was the region registering the highest percentage of new high-powered tractors and, likewise, the change of ownership was mainly of older tractors.
- In the islands, the relationship between low accident probability and registration of low-powered tractors was fulfilled, and in the Islas Canarias in particular, hardly any old tractors were registered. The Islas Baleares, which had a somewhat higher accident probability than the Islas Canarias, registered mostly older tractors.
Supplementary Materials
Author Contributions
Funding
Acknowledgments
Conflicts of Interest
References
- INSST—Instituto Nacional de Seguridad y Salud en el Trabajo (INSST), Ministerio de Trabajo, Migraciones y Seguridad Social (Spain). Informe Anual de Accidentes de Trabajo en España 2019 (Annual Report on Accidents at Work in Spain 2019); INSST: Madrid, Spain, 2020. [Google Scholar]
- Arnal, P. Análisis de la información sobre accidentes en el sector agrario recogida en los medios de comunicación en el decenio 2004 a 2013 (Analysis of the information on accidents in the agricultural sector collected in the media in the decade from 2004 to 2013). Ph.D. Thesis, Universidad Pública de Navarra, Pamplona, Spain, 2017. [Google Scholar]
- PricewaterhouseCoopers. El futuro del sector agrícola: Claves para construir un sector sostenible económica, social y medioambientalmente (The future of the agricultural sector: Keys to building an economically, socially and environmentally sustainable sector). 2019. Available online: https://www.pwc.es/es/publicaciones/assets/informe-sector-agricola-espanol.pdf (accessed on 20 December 2021).
- García-Arroyo, J.A.; Osca Segovia, A. Occupational accidents in immigrant workers in Spain: The complex role of culture. Saf. Sci. 2020, 121, 507–515. [Google Scholar] [CrossRef]
- Rondelli, V.; Casazza, C.; Martelli, R. Tractor rollover fatalities, analyzing accident scenario. J. Saf. Res. 2018, 67, 99–106. [Google Scholar] [CrossRef] [PubMed]
- Rezaei, R.; Seidi, M.; Karnasioun, M. Pesticide exposure reduction: Extending the theory of planned behavior to understand iranian farmers intention to apply personal protective equipment. Saf. Sci. 2019, 120, 527–537. [Google Scholar] [CrossRef]
- Holte, K.A.; Follo, G. Making occupational health and safety training relevant for farmers: Evaluation of an introductory course in occupational health and safety in Norway. Saf. Sci. 2018, 109, 368–376. [Google Scholar] [CrossRef]
- Valero, E.; Abril, I. Diagnóstico de la prevención de riesgos laborales en el sector Agrario. Segur. Trab. 2016, 87, 18–25. [Google Scholar]
- Arana, I.; Mangado, J.; Arnal, P.; Arazuri, S.; Alfaro, J.R.; Jarén, C. Evaluation of risk factors in fatal accidents in agriculture. Span. J. Agric. Res. 2010, 8, 592–598. [Google Scholar] [CrossRef] [Green Version]
- Fundación MAPFRE. Siniestralidad, mortalidad agrícola, vuelcos de tractores e incendios en cosechadoras 2010–2019 (Accidents, agricultural mortality, tractor overturns and fires in combine harvesters 2010–2019). Available online: https://noticias.fundacionmapfre.org/wp-content/uploads/2020/02/INFORME-SINIESTRALIDAD-AGRICOLA-2010-2019.pdf (accessed on 20 September 2021).
- Bafalliu Vidal, A.; Morente Sánchez, A. Análisis de los accidentes por vuelco de tractor en la Región de Murcia (Analysis of tractor overturning accidents in the Murcia Region). Instituto de Seguridad y Salud Laboral de la Región de Murcia. 2018. Available online: http://www.carm.es/ (accessed on 30 September 2021).
- Ministerio de Agricultura, Pesca y Alimentación. Análisis del parque nacional de tractores 2005–2006 (Analysis of the national tractor fleet 2005–2006). Available online: http://www.mapa.gob.es/ (accessed on 20 October 2021).
- Duddu, V.R.; Penmetsa, P.; Pulugurtha, S.S. Modeling and comparing injury severity of at-fault and not at-fault drivers in crashes. Accid. Anal. Prev. 2018, 120, 55–63. [Google Scholar] [CrossRef] [PubMed]
- Caffaro, F.; Mirisola, A.; Cavallo, E. Safety signs on agricultural machinery: Pictorials do not always successfully convey their messages to target users. Appl. Ergon. 2017, 58, 156–166. [Google Scholar] [CrossRef] [PubMed]
- Houshyar, E.; Houshyar, M. Tractor safety and related injuries in iranian farms. Saf. Sci. 2018, 103, 88–93. [Google Scholar] [CrossRef]
- Blazquez, C.; Picarte, B.; Calderón, J.F.; Losada, F. Spatial autocorrelation analysis of cargo trucks on highway crashes in Chile. Accid. Anal. Prev. 2018, 120, 195–210. [Google Scholar] [CrossRef] [PubMed]
- Bąk, I.; Cheba, K.; Szczecińska, B. The statistical analysis of road traffic in cities of Poland. Transp. Res. Proc. 2019, 39, 14–23. [Google Scholar] [CrossRef]
- Goerlich Gisbert, F.J.; Cantarino Martí, I. Rugosidad del terreno: Una característica del paisaje poco estudiada. Doc. Trab. (Fund. BBVA) 2010, 10, 31. [Google Scholar]
- Adin, A.; Goicoa, T.; Ugarte, M.D. Online relative risks/rates estimation in spatial and spatio-temporal disease mapping. Comput. Methods Programs Biomed. 2019, 172, 103–116. [Google Scholar] [CrossRef] [PubMed] [Green Version]
- Rue, H.; Martino, S.; Chopin, N. Approximate Bayesian inference for latent Gaussian models by using integrated nested Laplace approximations. J. R. Stat. Soc. B Stat. Methodol. 2009, 71, 319–392. [Google Scholar] [CrossRef]
- Knorr-Held, L. Bayesian modelling of inseparable space-time variation in disease risk. Stat. Med. 2000, 19, 2555–2567. [Google Scholar] [CrossRef] [Green Version]
- Instituto Nacional de Estadística. Encuesta sobre la estructura de las explotaciones agrícolas (Farm structure survey). 2017. Available online: https://www.ine.es/prensa/eeea_2016.pdf (accessed on 12 July 2022).
- Arnal, P.; López-Maestresalas, A.; Arazuri, S.; Mangado, J.M.; Jarén, C. A Multi-year analysis of traffic accidents involving agricultural tractors. Chem. Eng. Trans. 2017, 58, 109–114. [Google Scholar] [CrossRef]
- Cecchini, M.; Zambon, I.; Monarca, D.; Piccioni, F.; Marucci, A.; Colantoni, A. Spatial analysis for detecting recent work accidents in agriculture in Italy. In International Mid-Term Conference of the Italian Association of Agricultural Engineering; Springer: Cham, Switzerland, 2019; pp. 631–643. [Google Scholar]
- Baraza, X.; Cugueró-Escofet, N. Severity of occupational agricultural accidents in Spain, 2013–2018. Saf. Sci. 2021, 143, 105422. [Google Scholar] [CrossRef]
- Facchinetti, D.; Santoro, S.; Galli, L.E.; Pessina, D. Agricultural tractor roll-over related fatalities in Italy: Results from a 12 years analysis. Sustainability 2021, 13, 4536. [Google Scholar] [CrossRef]


| Age of the Tractors | % Tractors |
|---|---|
| >20 | 40 |
| 16–20 | 15 |
| 11–15 | 12 |
| 6–10 | 18 |
| <5 | 15 |
| AACC | POWER (kW) | |||||
|---|---|---|---|---|---|---|
| ≤30 | 30.1–50 | 50.1–70 | 70.1–90 | 90.1–110 | >110 | |
| Andalucía | 2075 | 1478 | 3489 | 9710 | 3343 | 1288 |
| Aragón | 391 | 247 | 1088 | 1564 | 898 | 2518 |
| Asturias | 97 | 122 | 333 | 297 | 170 | 91 |
| Baleares | 550 | 384 | 332 | 334 | 109 | 52 |
| Canarias | 327 | 185 | 126 | 115 | 21 | 0 |
| Cantabria | 29 | 26 | 104 | 178 | 106 | 91 |
| Castilla-León | 470 | 282 | 739 | 1769 | 1933 | 5113 |
| Castilla—La Mancha | 353 | 204 | 1662 | 3882 | 1719 | 2328 |
| Cataluña | 767 | 632 | 2168 | 2021 | 865 | 1479 |
| Valencia | 393 | 472 | 2147 | 1463 | 398 | 180 |
| Extremadura | 360 | 437 | 1640 | 2245 | 842 | 715 |
| Galicia | 972 | 1,413 | 1119 | 846 | 680 | 749 |
| Madrid | 88 | 26 | 75 | 107 | 88 | 163 |
| Murcia | 122 | 257 | 1226 | 1538 | 578 | 526 |
| Navarra | 85 | 109 | 177 | 483 | 280 | 735 |
| País Vasco | 154 | 256 | 294 | 435 | 135 | 248 |
| Rioja | 15 | 80 | 277 | 973 | 128 | 157 |
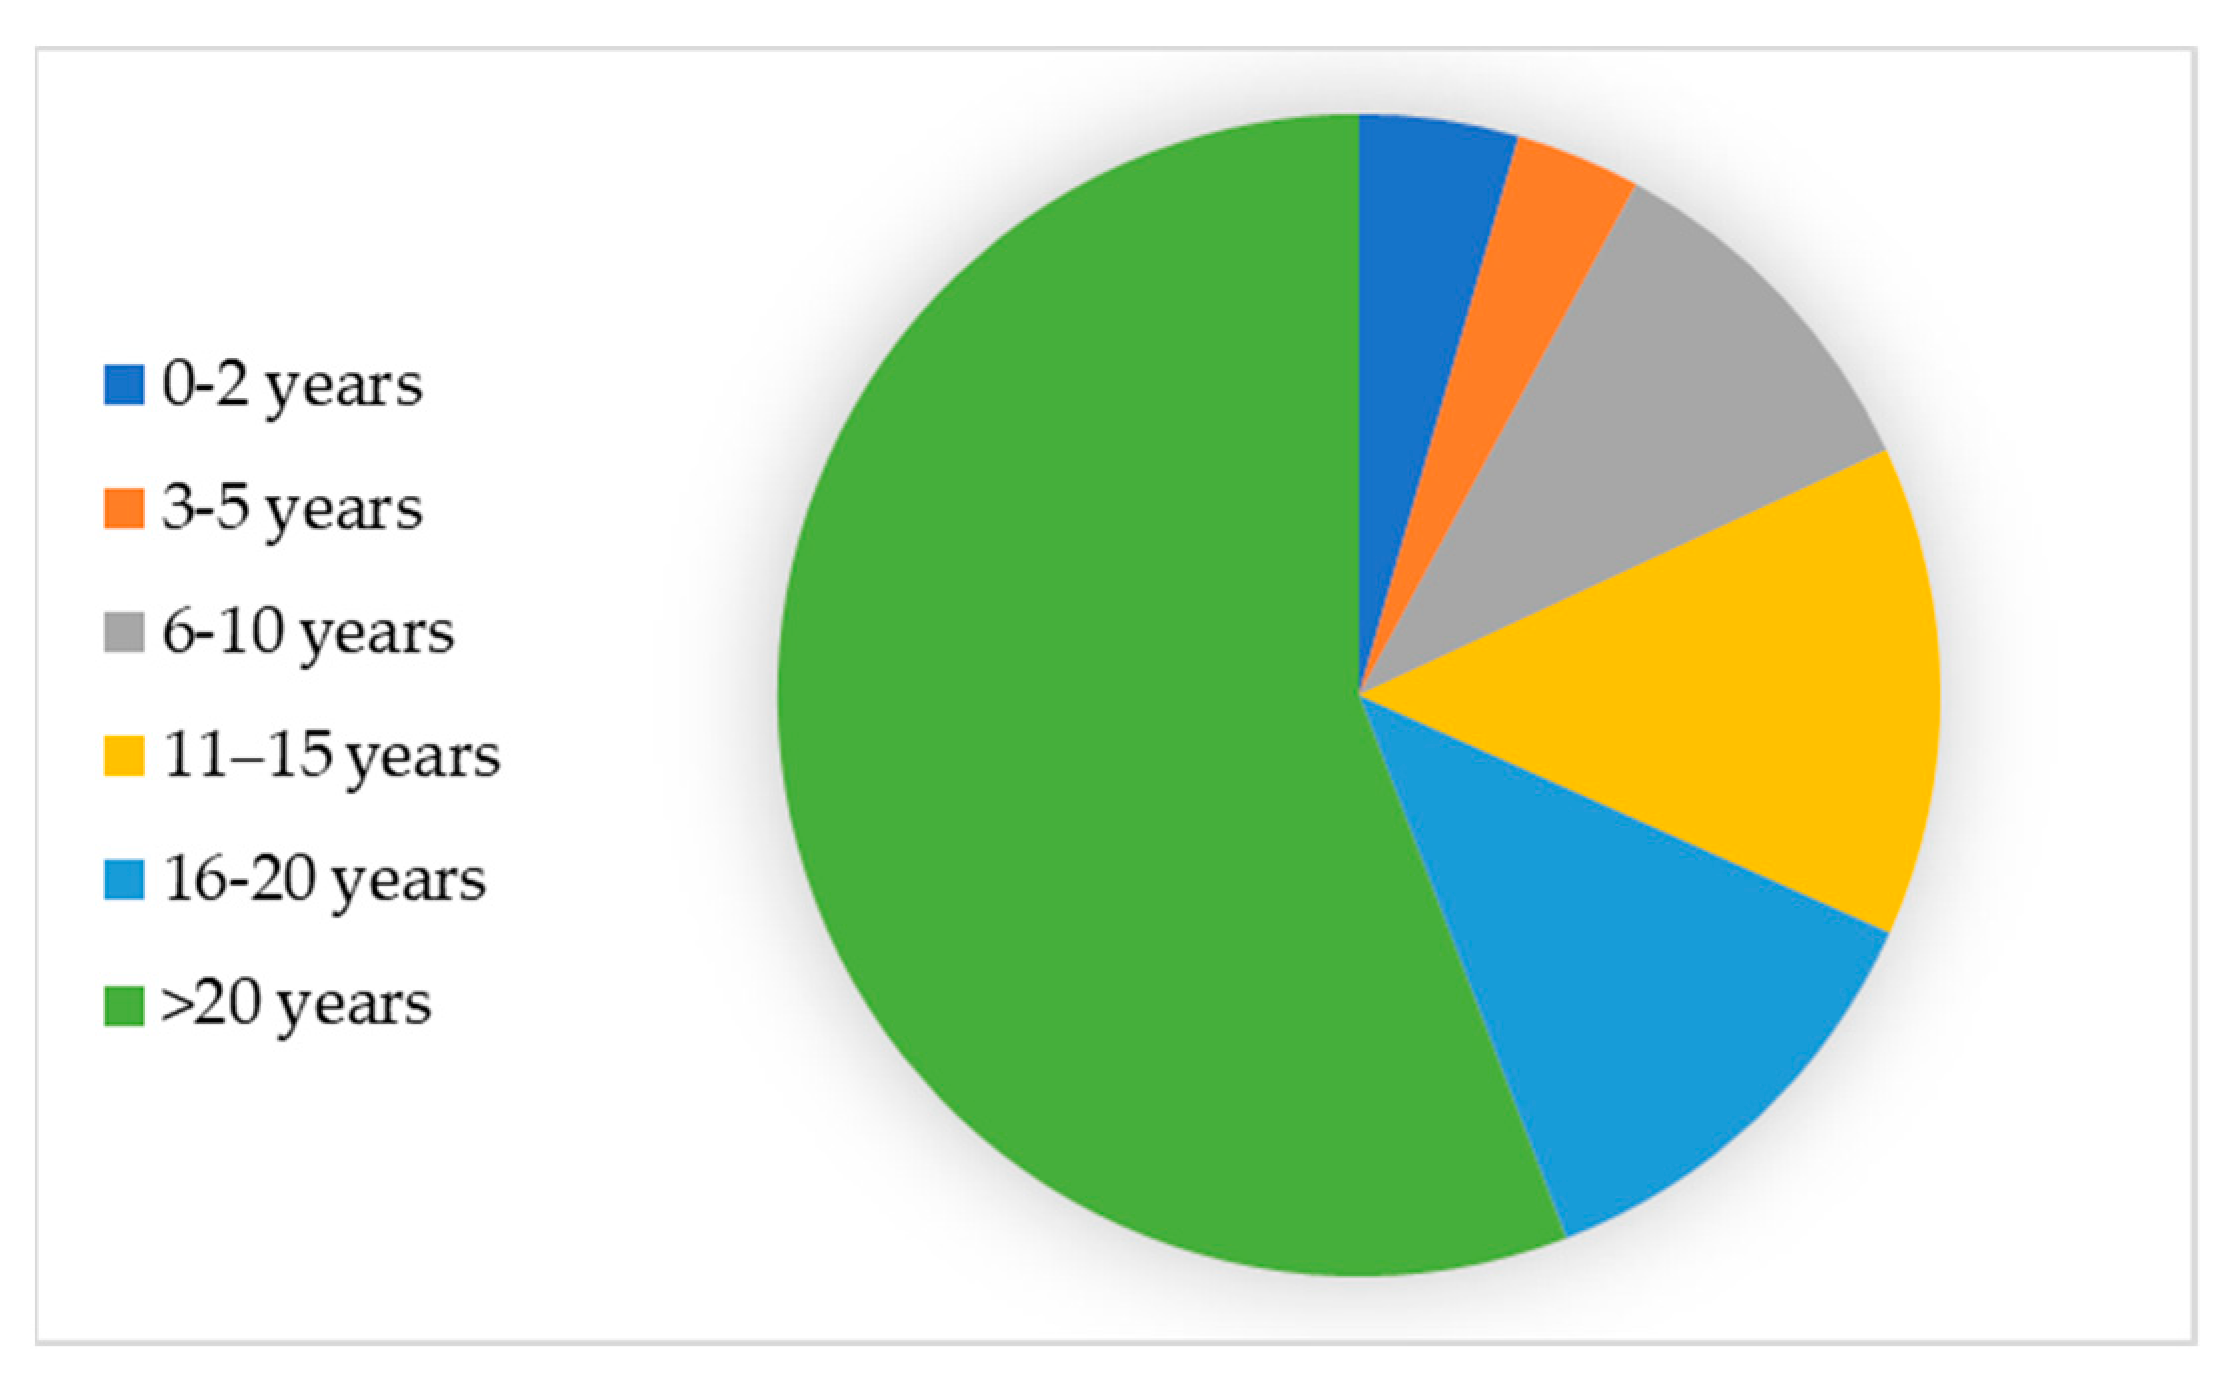
| Age | |||||
|---|---|---|---|---|---|
| 0–2 | 3–5 | 6–10 | 11–15 | 16–20 | >20 |
| 11,644 | 9126 | 26,604 | 35,672 | 32,743 | 146,170 |
| 4.44% | 3.48% | 10.16% | 13.62% | 12.50% | 55.80% |
Publisher’s Note: MDPI stays neutral with regard to jurisdictional claims in published maps and institutional affiliations. |
© 2022 by the authors. Licensee MDPI, Basel, Switzerland. This article is an open access article distributed under the terms and conditions of the Creative Commons Attribution (CC BY) license (https://creativecommons.org/licenses/by/4.0/).
Share and Cite
Jarén, C.; Ibarrola, A.; Mangado, T.; Adin, A.; Arnal, P.; López-Maestresalas, A.; Ríos, A.; Arazuri, S. Fatal Tractor Accidents in the Agricultural Sector in Spain during the Past Decade. Agronomy 2022, 12, 1694. https://doi.org/10.3390/agronomy12071694
Jarén C, Ibarrola A, Mangado T, Adin A, Arnal P, López-Maestresalas A, Ríos A, Arazuri S. Fatal Tractor Accidents in the Agricultural Sector in Spain during the Past Decade. Agronomy. 2022; 12(7):1694. https://doi.org/10.3390/agronomy12071694
Chicago/Turabian StyleJarén, Carmen, Alicia Ibarrola, Txuma Mangado, Aritz Adin, Pedro Arnal, Ainara López-Maestresalas, Alonso Ríos, and Silvia Arazuri. 2022. "Fatal Tractor Accidents in the Agricultural Sector in Spain during the Past Decade" Agronomy 12, no. 7: 1694. https://doi.org/10.3390/agronomy12071694