Article

Growth and Fruit Yields of Greenhouse Tomato under the Integrated Water and Fertilizer by Moistube Irrigation

1
Faculty of Engineering, Huanghe Science and Technology University, Zhengzhou 450000, China
2
Henan Provincial Water Conservancy Research Institute, Zhengzhou 450000, China
3
School of Foreign Languages, Xinyang Agriculture and Forestry University, Xinyang 464000, China
4
Northwest Land and Resources Research Center, Shaanxi Normal University, Xi’an 710119, China
5
Guiyang Engineering Corporation Limited, Power Construction Corporation of China, Guiyang 550000, China
6
Key Laboratory of Vegetation Ecology, Ministry of Education, Northeast Normal University, Changchun 130024, China
*
Author to whom correspondence should be addressed.
Agronomy 2022, 12(7), 1630; https://doi.org/10.3390/agronomy12071630
Submission received: 6 June 2022 / Revised: 27 June 2022 / Accepted: 29 June 2022 / Published: 7 July 2022

Abstract

:
The mechanism of greenhouse tomato growth and yield under the integrated water and fertilizer of moistube irrigation (MI) is not clear. Thus, to fill the research gap, a completely randomized trial design was used to study the effects of different irrigation amounts (I; to realize different I, the tube working pressure was 1 (I1), 2 (I2), 3 (I3) m) and fertilizer amounts (F, N-P-K: 20%-20%-20%; the F at a single time was 100 (F1), 200 (F2) and 300 (F3) kg/ha) on growth and yield of tomato. The results showed that with an increase in I, the photosynthetic rate (Pn) of leaves and total dry matter mass (TDM) first increased and then decreased, while the nutrition and the flavor indexes of fruit decreased. With an increase in F, the Pn of leaves, the TDM of tomato and the fruit quality increased at first and then decreased. The effects of I on the yield of tomato was higher than that of F. With an increase in I, the partial fertilizer productivity (PFP) increased at first and then decreased, and the water use efficiency (WUE) decreased by 13.96%. With an increase in F, the WUE increased at first and then decreased, and the PFP decreased by 148.97%. The conclusion based on a spatial analysis was consistent with the comprehensive evaluation of yield and water use efficiency, which showed that I2F2 was the best.

1. Introduction

With considerable nutritional and economic benefits, tomato is one of the most popular cultivated vegetables [1]. According to statistics, the annual yield and harvest area of tomato maintained a steady growth from 1980 to 2019 globally. The annual global yield and harvest area of tomatoes in 2019 were 18,076.63 t and 5.0305 million hm2, respectively, with an increase of 243.33% and 105.88%, respectively, compared with those in 1980 [2]. The development of facility agriculture in the Huang-Huai-Hai Plain of China provides an effective guarantee of the stable production of tomatoes [3]. The irrigation of facility agriculture vegetables comes mainly from groundwater, which aggravates the water resources crisis in this area [4]. Furthermore, in this region, the nutrients required for the growth of tomatoes using facility agriculture mainly come from fertilization. However, the over-use of fertilizers will reduce soil nutrient utilization efficiency [5], force soil salinization [6], and increase greenhouse gas emissions [7], amongst others.
Irrigation is the main method [8] applied to achieve precision supplies of water and fertilizer to crops grown using agricultural facilities, and determines how water and fertilizer enter the soil zone of crop roots [9]. The optimization of the irrigation and fertilizer in greenhouses can save water, increase yield and improve product quality, in addition to reducing input costs [10]. In production practice, farmers adopt different irrigation methods for various crops [11]. Drip irrigation is the most widely used water-saving technology in facility agriculture [12]. Currently, the technology of integrated water and fertilizer in drip irrigation has achieved exceptional results. For example, the optimal treatment using water-fertilizer coupling with drip irrigation for tomato crops in Xinjiang (China) is 4050 m3/ha of water and 250 kg/ha of fertilizer [13]. The optimal combination model of drip water and fertilizer in the Shaanxi region of the Loess Plateau (China) is that the evaporation level for irrigation is 0.7–0.75 times the irrigation amount and the fertilizer amount is 180–250 kg/ha for winter wheat and tomatoes [14]. The best coupling parameter of drip irrigation water and fertilizer for cotton production in the arid region of Northwest China is with evaporation of 1.0 times the irrigation amount and fertilizer at 250–43.7–41.5 kg/ha [15]. The optimal combination model of water and fertilizer in drip irrigation of tomato for the Mediterranean area (Italy) is the evaporation of 1.0 times the irrigation amount and 120 kg/ha of fertilizer [16].
As a new type of water-saving technology, moistube irrigation (MI) represents continuous infiltration irrigation with a linear source. With a water potential gradient inside and outside the pipe wall as the driving force, crop irrigation can achieve a sustainable water supply over the whole crop growth period in a timely and appropriate way, which can improve soil moisture environment, reduce surface evaporation and improve soil water and fertilizer utilization [17]. MI has been widely used in such fields as greening, food crops [18], and vegetables [19]. Previous studies have shown that the yield and crop water use efficiency of tomato [20] and winter wheat [19] under MI were higher than those under drip irrigation in the Loess Plateau. Therefore, research on water and fertilizer integration of MI is of great significance since it is conducive to maturing the water-fertilizer integration technology system, and broadening its scope of application. However, previous studies on MI mainly focused on the influence of changes in parameters such as capillary depth, capillary spacing [21], working pressure [22] head and other parameters on crop growth and soil moisture distribution [23]. Currently, studies on integrated water and fertilizer of MI on crops in the well irrigation area of Huang-Huai-Hai Plain arerelatively rare. The rules governing crop growth and its influence mechanism under the integrated water and fertilizer of MI remain unclear. For example, previous studies are not clear about how to respond to tomato growth under the integrated water and fertilizer with MI. Moreover, the quantitative description of the relationship between irrigation amount and fertilizer amount on tomato yield under the integrated water and fertilizer with MI is inadequate. There is also a lack of quantitative description of the relationship between the photosynthetic rate of tomato leaves, dry matter quality and yield of tomato under the integrated water and fertilizer regime with MI. In addition, there are few reports on how to combine the irrigation amount and fertilizer amount to achieve the optimum coupling of water and fertilizer and the multiple goals of water-saving, yield-increasing and quality-improving. The solution of the problems mentioned above is of significance in guiding the popularization and application of MI technology.
Therefore, it is the focus of the current research to develop advanced irrigation methods for tomato cultivation using agricultural facilities without increasing farmers’ economic input; this requires formulation of a reasonable proposal for irrigation volume and fertilizer amounts, in order to achieve the best balance between increasing yield and improving quality while reducing the irrigation volume and fertilizer amount. Taking greenhouse tomato cultivation as the research object, the purpose of this study was to explore the effects of different irrigation amounts and fertilizer amounts on the photosynthetic characteristics of tomato leaves, dry matter mass, fruit quality and yield under MI in Huang-Huai-Hai Plain. Regression analysis was used to quantitatively describe the correlation between the photosynthetic rate of tomato leaves, dry matter mass of tomato and yield of tomato and the coupled irrigation fertilizer supply under MI. In addition, the Cobb–Douglas [24] production function model was used to quantitatively evaluate the effects of irrigation amount and fertilizer amount on tomato yield, water use efficiency and partial fertilizer productivity. Based on the spatial analysis method [25] and the traditional yield and water use efficiency method, the most suitable combination model of irrigation amount and fertilizer amount of tomato greenhouse was obtained under MI. The purpose of this paper is to provide a theoretical basis for the sustainable development of facility agriculture tomato industry in this region.

2. Materials and Methods

2.1. Experimental Site and Management

The experiment was carried out in a greenhouse in Chencao Township, Xuchang City, Henan Province, China (N 34°08′, E 113°59′). The greenhouse is situated in the north warm temperate monsoon climate zone, with an altitude of 85.0 m. The average annual temperature was 14.30–14.60 °C, and the average annual rainfall was 701.10 mm. The precipitation from June to September accounts for more than 62% of the annual precipitation. The frost-free period was 217 days and the annual sunshine time was about 2280 h. The soil type of the experimental greenhouse was alluvial soil The average bulk density of 0.80 m soil layer was 1.39 g/cm3. The field weight capacity was 25.60%. The soil organic matter content was 20.1 mg/kg. The total nitrogen content was 1.15 g/kg. The total phosphorus content was 1.71 g/kg and the total phosphorus content was 72.34 mg/kg.
The tomato variety was “Nongbofenba 1316”, which was planted on the ridge with one tube and one row. The depth of moistube was 20 cm with a row spacing of tomatoes of 50 cm. The plant spacing was 40 cm and the spacing of each plot was 2.0 m. The field management measures were consistent in each plot. Irrigation water came from the groundwater in this area. To ensure the survival of seedlings, tomato seedlings were planted on 30 March 2021 with reference to local tomato planting experience. Irrigation treatment began on 10 April 2021 (11 days after transplant), stopped on 28 July 2021 (120 days after transplant) and the harvest was on 7 August 2021 (130 days after transplant). Due to the small water demand in the tomato seedling stage and flowering initial stage, the irrigation stopped from 13 April to 18 April (14–19 days after transplant), 23 April to 28 April (24–29 days after transplant), 3 May to 8 May (34–39 days after transplant) and 13 May to 18 May (44–45 days after transplant) after tomato planting. The meteorological data such as temperature and humidity during the growth period of tomato are shown in Figure 1.
The MI irrigation and fertilization system was composed of moistube, water pump, fertilizer applicator, water supply tank, water meter, filter, pressure gauge, etc. (Figure 2), in which the principle of diversion was used to control the constant working pressure of each treatment to realize a different working pressure in each plot. In this study, the moistube produced by Shenzhen Moistube Irrigation Technology Co., Ltd. (Shenzhen, Guangdong, China) was used; it is made of a polymer semi-permeable membrane with a thickness of 0.06 mm. The fertilizer applicator was adjusted and the water and fertilizer were mixed and diluted at a ratio of 1:600 to directly irrigate tomatoes. The tested fertilizer was the high-power and high-balance water-soluble fertilizer produced by Shenzhen Dugao Biological Technology Co., Ltd. (Guangdong, China, N-P-K: 20%-20%-20%).

2.2. Experimental Design

In this experiment, two factors were set up: irrigation amount and fertilizer amount. Different irrigation (I) gradients were achieved through controlling the capillary working pressure of the moistube irrigation. The capillary working pressure was set at 3 levels: 1 (I1), 2 (I2) and 3 (I3) m. The fertilizer amount (F) was set at 3 levels: 100 (F1), 200 (F2) and 300 (F3) kg/ha, respectively. The fertilizations were conducted every 10 days, comprising 11 times in total. A completely randomized trial design was used, using 9 treatments in total (Table 1) with each trial design/treatment repeated 3 times.

2.3. Measurements and Computational Methods

(1) Photosynthesis measurements
On the 40th, 78th and 112th days after the transplant of the tomato plants, three conjoined healthy tomato leaves with full light and consistent leaf position were randomly selected from 9:00 to 11:00 by LI-6400 photosynthesis instrument of LI-COR Company to determine the photosynthetic characteristics of tomato leaves. The gas exchange parameters such as photosynthetic rate (Pn), stomatal conductivity (Gs), intercellular CO2 concentration (Ci) and transpiration rate (Tr) were obtained in Table 2.
(2) Dry matter mass
Three tomato plants with the same growth were randomly selected in each treatment and all the above-ground parts of the plants were cut. The diameter, leaves and fruits were putting into an oven and dried at 105 °C for 30 min and then dried at 75 °C for 100 days. Among them, the dry matter mass of fruit was the cumulative value of 4 ears of tomato fruit. The root system of the plant was obtained by digging a pit with a diameter of about 0.6 m and a depth of about 0.4 m. The root system was washed and put into an oven at 105 °C for 30 min and then dried at 75 °C for 100 days.
(3) Fruit quality and yield of tomato
(a) Fruit quality of tomato
Tomato fruit shape index (transverse diameter (TD), vertical diameter (VD)), tomato flavor index (total soluble solids (TSS), total soluble sugar (TSU)) and tomato nutrition index (vitamin C (VC), lycopene (LY)) were determined. When the tomato fruits were matured in the second ear, three tomato fruits were randomly selected in each plot. The tomato fruit shape index was first determined, and then the single fruit was homogenized into jam to determine the fruit flavor and nutrition index in Table 3. The specific measurement methods are as follows [25]:
The TD and VD of tomato fruit were measured with vernier caliper; the TSS of tomato fruit were measured by hand refractometer (PR-32α Atago, Tokyo, Japan); the TSU of tomato fruit was determined by the anthrone method; and the VC of tomato fruit was determined by titration method. LY in tomato fruit was determined by ultraviolet spectrophotometer.
(b) Yield
The yield of tomato fruit per plant was measured by electronic scales and was converted into yield per unit area (kg/ha).
(4) Water use efficiency and fertilizer partial productivity
The soil moisture content of tomato plots during the growth period was measured by a soil drill drying method once before and once after the growth period. Three monitoring points were selected in each plot (about 5 cm away from the moistube). The ETa of tomato water consumption was obtained by measuring the soil moisture content at 0–80 cm soil depth.
Crop water use efficiency was obtained through Formula (1) (WUE, kg/m3):
WUE = 1000 × Y/ETa
In the formula: Y was the yield of tomato, kg/ha; ETa was the crop growth period water consumption, mm.
Partial fertilizer productivity was obtained by Formula (2) (PFP, kg/kg):
PFP = Y/F
In the formula: Y was the yield of tomato, kg/ha; F was the total amount of fertilizer applied during the growth period kg/ha.
(5) Data analysis
(a) Significance and drawing analysis
The mean errors were analyzed by SPSS 22.00 (IBM Crop., Armonk, NY, USA) and the significant difference was analyzed by F test; the significance level was set to p ≤ 0.05. OriginPro 9.0 (Origin Lab Corporation, Northampton, MA, USA) was used to make drawings.
(b) Spatial analysis
The total dry matter mass, fruit quality, yield, WUE and PFP of the tomato crop were the 5 major indexes selected to show the comprehensive benefits of greenhouse tomato cultivation. Since there were many indexes of tomato fruit quality, to comprehensively analyze the tomato fruit quality, a principal component analysis (PCA) of tomato fruit quality was carried out, and the tomato fruit quality was characterized by the comprehensive score of tomato fruit quality.
Based on the square method and spatial analysis, 1stOpt (7D-Soft High Technology Inc., Beijing, China) and Mathematica 12.0 (Wolfram Research, New York, NY, USA) were used to analyze the total dry matter mass, fruit quality, yield, WUE and PFP of the tomatoes. Among them, total dry matter mass, comprehensive score of fruit quality, yield, WUE and PFP of the tomatoes were taken as dependent variables, while I and F were taken as independent variables. The 95% confidence interval (CI) of tomato total dry matter mass, comprehensive score of fruit quality, yield, WUE and PFP was used as the basis for screening the best I and F and the optimal combination treatment was selected.

3. Results

3.1. Photosynthetic Characteristics of Tomato Leaves in Greenhouse

The photosynthetic rate (Pn), intercellular CO2 concentration (Ci), stomatal conductivity (Gs) and transpiration rate (Tr) of tomato leaves tended to increase and then decreased as the tomato growth progressed (Figure 3). The irrigation amount (I) and fertilizer amount (F) had significant effects on Pn, Ci, Gs and Tr of tomato leaves (p ≤ 0.05).
As I was increased, the Pn, Gs and Tr of tomato leaves showed a trend of first increasing and then decreasing with increasing I. Among them, the Pn, Gs and Tr of tomato leaves with I2 were about 21.36% and 7.64%, 28.31% and 8.07%, 22.64% and 8.12% higher than those of I1 and I3, respectively. The Ci decreased at first and then increased. With the increase in F, the Pn, Gs and Tr of tomato leaves first added and then reduced. Among them, the Pn, Gs and Tr of tomato leaves treated with F2 were significantly higher than that of F1 and F3 treatments (19.37% and 5.38%, 50.62% and 9.40%, 19.04% and 5.82%, respectively). With the increase of F, the Ci of tomato leaves first decreased and then increased.

3.2. Dry Matter Mass of Tomato in Greenhouse

Both I and F had significant effects on tomato leaf dry matter mass (LDM) Stem dry matter mass (SDM), root dry matter mass (RDM), fruit dry matter mass (FDM) total dry matter mass (TDM), and the interaction of 2 factors had significant effects on tomato leaf dry matter mass (p ≤ 0.05) (Table 4).
As the irrigation amount was increased from I1 to I3, the LDM, SDM, RDM, FDM and TDM of the tomatoes increased initially and then declined. The LDM, SDM, RDM, FDM and TDM of tomato I2 were higher than those of I1 and I3 (16.34% and 2.17%, 14.85% and 3.73%, 21.70% and 3.75%, 16.30% and 0.78%, 16.11% and 2.02%, respectively). With the increase of F, the LDM, SDM, RDM, FDM and TDM of the tomatoes increased at first and then decreased. The LDM, SDM, RDM, FDM and TDM of tomatoes treated with F2 were higher than those of F1 and F3 (11.91% and 2.72%, 12.28% and 0.76%, 8.21% and 5.82%, 16.89% and 2.00%, 14.04% and 1.98%, respectively).

3.3. Fruit Quality of Tomato in Greenhouse

Both I and F had significant effects on the transverse diameter (TD), vertical diameter (VD), total soluble solids (TSS), total soluble sugar (TSU) vitamin C (VC), lycopene (LY) (p ≤ 0.05), and the interaction between the 2 factors had significant effects on LY (Table 5).
With the increase of I, the TD and VD of tomato were first increased and then decreased, and the TSS, TSU, VC and LY of tomato fruit reduced. The TSS, TSU, VC and LY of tomato fruit with I2 were significantly higher than those of I3 treatment by about 10.17%, 12.37%, 10.16% and 9.75%, respectively. With increase in F, the TD, VD, TSS, TSU, VC and LY of tomato fruit first increased and then decreased. The TD, VD, TSS, TSU, VC and LY of tomato with F2 were higher than those of F1 and F3 (2.53% and 0.52%, 17.89% and 2.37%, 10.70% and 3.93%, 12.99% and 2.80%, 15.43% and 7.12%, 15.01% and 2.13%, respectively).

3.4. Yield, Water Use Efficiency and Partial Fertilizer Productivity of Tomato in Greenhouse

Both I and F had significant effects on tomato yield (Y), water consumption, water use efficiency (WUE) and fertilizer partial productivity (PFP); the interaction of 2 factors had significant effects on tomato water consumption and WUE (Table 6). The F-value of I was higher than that of F indicating that the effect of I on tomato Y and WUE was greater than that of F.
With the increase of I, the Y and PFP of the tomatoesshowed a trend of increasing and then decreasing. The Y and PFP of tomatoes I2 were significantly higher than those of I1 and I3 by about 13.99% and 1.29%, 12.42% and 0.56%, respectively. Water consumption showed an increasing trend; the WUE of tomatoes showed a decreasing trend, in which the WUE of I1 was higher than that of I3 by about 13.96%. With the increase of F, the Y and WUE of the tomatoes first increased and then decreased; Y and WUE of tomato F2 were significantly higher than those of F1 and F3 treatments by about 22.57% and 1.72%, 12.34% and 8.11%, respectively. Water consumption with F2 treatment was significantly lower than that for F3 treatment by about 5.69%; PFP decreased by about 148.97%.
Taking the I and F as independent variables, and taking Y, WUE and PFP of tomato as dependent variables, the Cobb–Douglas model was used for regression analysis. The fitting results are shown in Formulas (3)–(5), respectively.
Y = e10.6690I0.1835F0.1746 R2 = 0.8753
WUE = e3.0826I−0.1011F0.0468 R2 = 0.6486
PFP = e8.0567I0.1007F−0.7817 R2 = 0.9876
In the formula: I represents the irrigation amount; F represents the fertilizer amount, Y represents the yield of tomato; WUE represents the water use efficiency of tomato; PFP represents the fertilizer partial productivity of tomato.
As can be seen from the above formula, under the condition of MI, the production elasticity of I is greater than that of F. For every 1.00% increase of I, Y increased by about 18.35%, the WUE decreased by about 10.11%, and the PFP increased by about 10.07%. For every 1.00% increase of F, the Y of tomato increased by about 17.46%, the WUE of tomato increased by about 4.68%, and the PFP of tomato decreased by about 78.17%. The fitting results of Cobb–Douglas model showed that the effects of I and F on tomato Y and WUE were consistent with the F test.

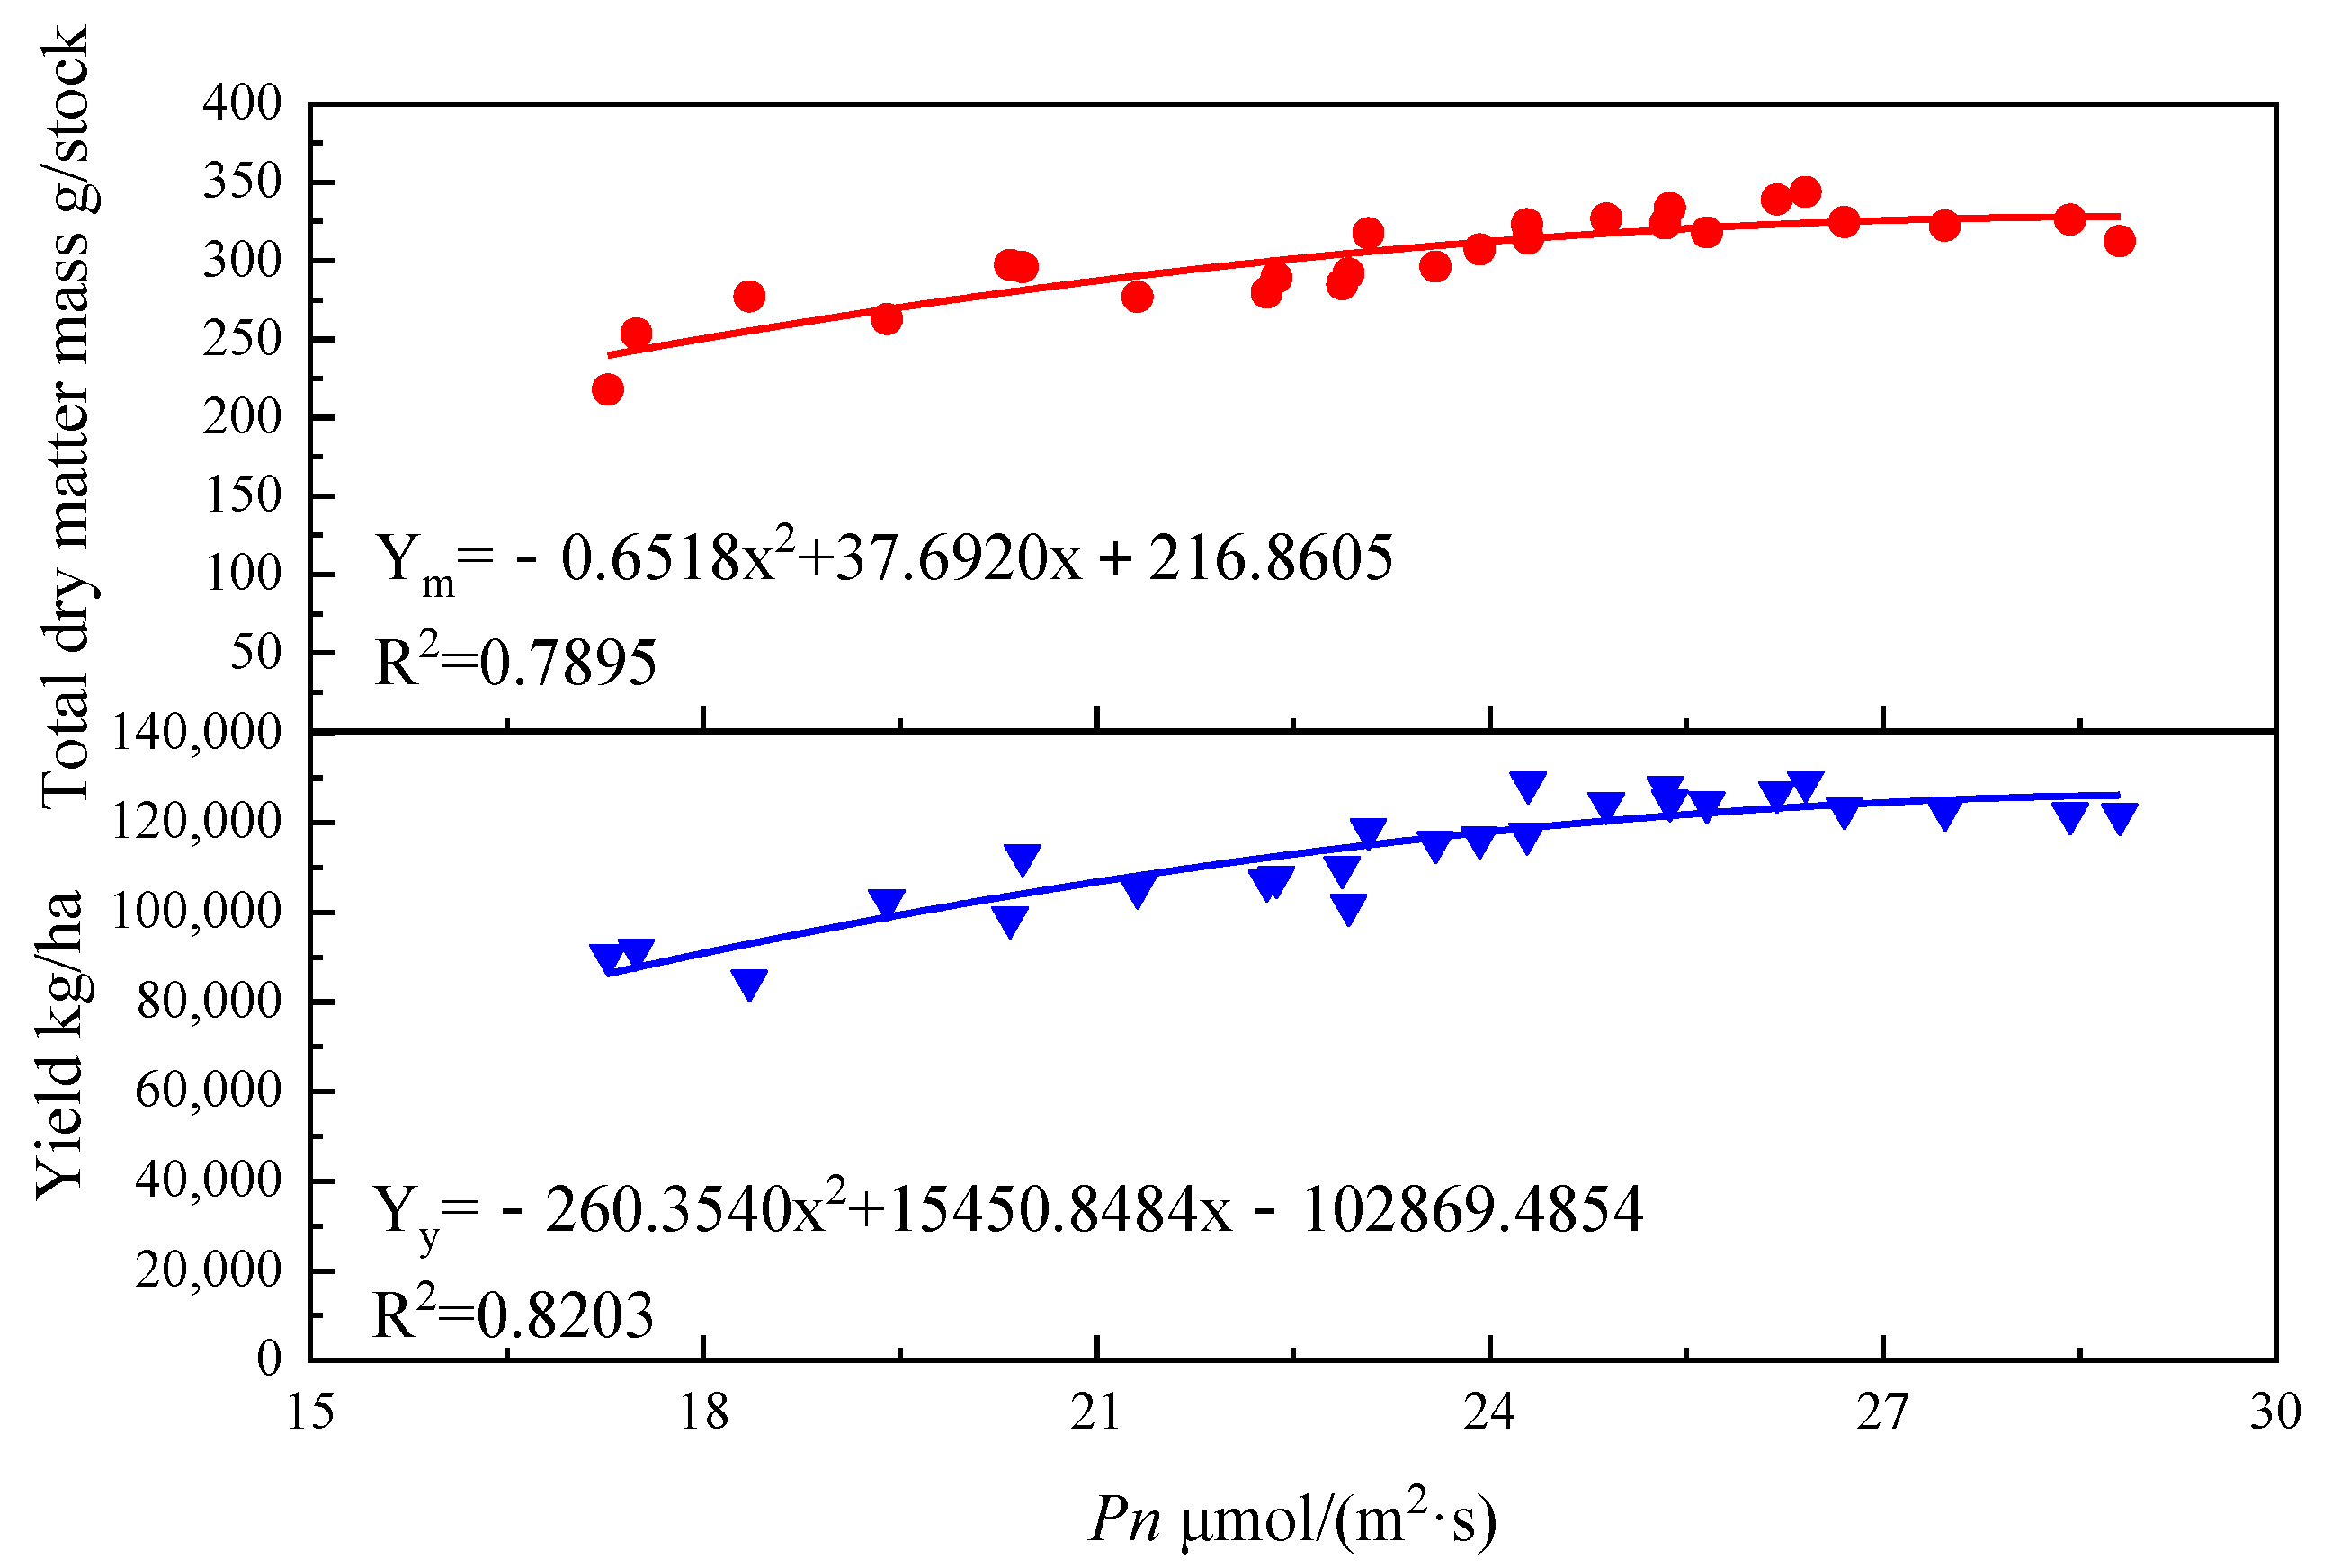
3.5. Correlation between Pn of Tomato Leaves, Dry Matter Mass of and Yield of Tomatoes in Greenhouse

Under the integrated water and fertilizer conditions of MI, the Pn of tomato leaves, total dry matter mass and tomato yield showed a quadratic curve (Figure 4).
In the correlation between Pn of tomato leaves and total dry matter mass of tomato: Ym = −0.6518x2 + 37.6920x + 216.8605, the variation of Pn of tomato leaves can explain the change of 78.95% in total dry matter mass, indicating that the model has a high degree of fit. In the correlation between Pn of tomato leaves and yield of tomato, Yy = −260.3540x2 + 15,450.8484x − 102,869.4854; the change of Pn of tomato leaves can explain the variation of 78.95% in tomato yield, indicating that the model has a high degree of fit.

3.6. The Optimal Scheme for the Integrated Water and Fertilizer in Moistube Irrigation

3.6.1. Comprehensive Score Evaluation of Tomato Quality Based on Principal

Component Analysis (PCA)

In the comprehensive evaluation of tomato fruit quality, the principal components were extracted based on the principle that the characteristic value is greater than 1 (Table 7). The cumulative contribution rate of PC1 and PC2 is more than 95%. The variance contribution rate of the first principal component PC1 is more than 61%, which mainly reflects the shape index of tomato fruit. PC1 can be named as commodity factor. The variance contribution rate of the second principal component PC2 is more than 35%, which mainly reflects the flavor and nutrition index of tomato fruit, the PC2 can be called taste nutrition factor. The comprehensive score of tomato fruit quality showed that the tomato fruit shape and flavor quality of I2F2 combination was better (Figure 4).

3.6.2. Selection of Optimal Scheme for Integrated Water and Fertilizer of MI Based on Spatial Analysis

A multiple regression analysis was conducted with I and F as independent variables and the tomato total dry matter quality, comprehensive score of fruit quality, yield, WUE and PFP as dependent variables (Table 8). The regression analysis revealed that when the total dry matter mass, comprehensive score of fruit quality, yield, WUE and PFP of tomato peaked, the I values were 2.525, 1.454, 2.444, 1.486, 2.116 m, respectively, and the F values were 236.344, 225.682, 244.083, 208.463, 371.413 kg/ha, respectively.
It was found that when the total dry matter mass, comprehensive score of fruit quality, yield, WUE and PFP of tomato were all at their peak it was difficult to meet the I and F of MI simultaneously. Therefore, the spatial analysis method is used to analyze the 95.00% confidence interval of the peak value as the acceptability interval. The spatial analysis found that the PFP did not meet the conditions of spatial analysis and thus it was discarded. Therefore, this study further carried out spatial analysis on 95% of the peak value of tomato total dry matter mass, comprehensive score of fruit quality, yield and WUE as the optimal screening index. It can be seen from Figure 5 that I2F2 is the best treatment in this study, in which the total dry matter mass, fruit quality, yield and WUE of tomato for I2F2 all reached more than 95.00% of their peak value at the same time.

4. Discussion

4.1. Effects of Different Treatments on Tomato Growth in Greenhouse Conditions

Moistube irrigation is driven by the water potential gradient inside and outside the tube wall to achieve continuous water supply during the crop reproductive period, which not only improves the soil hydropneumatics environment reduces surface evaporation, but also promotes the stability of microclimate and soil micro-environment in farmland [17]. In this study, it was found that the dry matter mass of tomato showed a trend of increasing and then decreasing with continuous increase of the irrigation amount. Tomato is a crop with high water consumption, whose growth is vulnerable to drought stress [26]. The water supply was able to maintain the water requirement with positive effects on tomato growth when I creased from I1 to I2. The tomato root system promoted 21.36% enhancement in photosynthetic rate of tomato leaves in a suitable soil hydrothermal environment. Tomato is a crop sensitive to soil oxygen. When the irrigation amount was increased to I3, continuous irrigation with under large fixed irrigation with simultaneous moistube irrigation resulted in high soil water content (24.31% by weight) for a long time under the I3 treatment. The high soil moisture reduces soil porosity and thus the diffusion rate of oxygen [27]; lower soil oxygen content of the soil limits the synthesis of adenine nucleoside triphosphate in aerobic respiration. The degree of plasma membrane peroxidation of root cells increased under long-term hypoxia stress, resulting in increased anaerobic respiration in the rhizosphere under hypoxia stress [28], and the energy produced by the roots was not enough to maintain the normal growth of plants [29]. As a result, the photosynthetic rate of aboveground leaves decreased by 7.64% and inhibited the accumulation of dry matter mass of tomato plants.
Previous studies found that moderate fertilization promotes tomato root activity and water absorption capacity, and nutrients dissolved in water reached the root surface through mass flow or diffusion, promoting the accumulation of tomato dry matter mass [30]. In this study, it was found that the total dry matter mass of tomato tended to first increase and then decrease with the increase of fertilization level. This may be due to excessive fertilization (F3) that reduces the contents of zinc, calcium and boron in tomato plants, causing yellowing between leaf veins, and limiting the photosynthetic capacity of tomato leaves [31]; it also tends to cause stripes and cracks on the surface of tomato stalks and hollowness in the stems [32], reducing the transport capacity of nutrients in plant stalks, and finally limiting the accumulation of dry matter in tomato plants [33]. The results of this study are consistent with the conclusion of Li [34] who conducted drip irrigation experiments with muskmelon and Zhang [35] who used the tomato as drip-irrigation experiment material.

4.2. Effects of Different Treatments on Fruit Quality of Tomato in Greenhouse Conditions

Suitable soil moisture promotes water conduction by the root system [36], accelerates the synthesis of chlorophyll and increases the photosynthetic enzyme activity, improves plant photosynthesis, promotes the metabolism of reactive oxygen species in crops, and positively promotes fruit quality [11]. It was found that the TD and VD of tomato fruits increased and then decreased with the increase of irrigation amount, which is consistent with the findings of Liu [3] and Suat [37] on drip irrigated tomatoes, indicating that the effect of the amount of moistube irrigation on tomato fruit morphology is similar to that of drip irrigation. In this study, it was found that the TSS and TSU of tomato fruit decreased with the increase of irrigation volume. This suggests that the increase of soil volumetric moisture content with higher irrigation amount and lower drought stress reduces the resistance to the transport of phloem juice to the fruit and increases the water flow from xylem to fruit, which leads to the decrease of juice solute concentration and dilution of TSS and TSU concentration per unit mass of tomato fruit [38]. In addition, higher irrigation amounts limit the activity of sucrose synthase and sucrose phosphate synthase, and reduce the conversion rate of sucrose to fructose and glucose, thus reducing the content of TSS and TSU in tomato fruits [3]. The results are in agreement with Gamareldawla [39] and Liu [3]’s finding that reveals the TSS and TSU of drip-irrigated tomatoes varied with the amount of irritation. However, the findings of this study are not consistent with Wang’s study, in which he/she found that the TSS and VC content of drip-irrigated tomatoes increased and then decreased with the increase of irrigation amount. Such inconsistency is probably due to the difference of irrigation amount. In this study, the minimum amount is 73.46 mm, which is lower than that of Wang’s study, and the highest amount is 218.42 mm, which is higher than that of Wang’s study [40].
Previous studies found that the amount of fertilizer application affects the ratio of protein and carbohydrate in crops. It was also found that while reasonable nitrogen application can increase the contents of TSS, VC and TSU, excessive fertilization reduces the contents of VC and TSS [41]. It was found in this study that TSS, TSU, VC and LY showed a trend of increasing and then decreasing with the increase of fertilization When the fertilization rates increased from F1 to F2, soil fertilization increased the content of nitrogen, phosphorus and potassium in the root zones of tomatoes, prompted the growth of crop root, delayed fruit ripening, extended the time of photosynthesis, and increased the sugar content and mineral ion content of fruit [41]. When the fertilization rates increased from F2 to F3, on the one hand, the content of soil nitrogen [42], phosphorus [43] and potassium [44] was higher than the amount absorbed by plants, resulting in excess soil nutrients and higher ion concentration per unit volume and producing toxic effect on roots. On the other hand, excessive nutrient absorbed by tomato plants resulted in abnormal plant physiology and ecology, such as yellowing of tomato leaves and inhibition of photosynthetic capacity [45]. Such abnormality brought about chapped fruit and lower fruit quality [46,47]. This contrasts with Wang’s finding that the TSS of tomato fruits decreased with increasing fertilization. Such differences may be due to a different type of fertilizer and cultivation modality in Wang’s experiment in which tomatoes were grown in greenhouse pots with potassium fertilizer. In the present study, tomatoes were grown conventionally in greenhouses with a compound water soluble fertilizer of N, P, and K.

4.3. Effects of Different Treatments on Tomato Yield, WUE and PFP in Greenhouse Conditions

Under drought stress, tomato root systems could only support fewer tomato fruit and the weight of single fruit was reduced [48,49]. In this study, it was found that the tomato yield increased at first and then decreased as the irrigation volume was increased. It may be due to the decrease in soil volumetric water content and water stress in root systems under I1 irrigation treatment. Zhang [25] found that the tomato flowering and fruiting sexpansion stages were more sensitive to water stress. Zhang also found that the weight per fruit also showed a decreasing trend with the decrease of irrigation amount, and that the decrease of weight per fruit limited the increase of tomato yield [50]. Under the high irrigation treatment of I3, the soil water-filled porosity of tomato root zone was determined to be higher than that of I2 treatment by about 6.64%. The higher soil water-filled porosity limited the diffusion rate of soil oxygen, weakened root and microbial respiration, increased anaerobic respiratory enzyme activity, and decreased soil microbial population. The crop respiration as well as growth were found to be abnormal, which limited the improvement of tomato yield. In addition, this study also found that tomato water use efficiency tended to decrease with increasing irrigation water, probably because the increase in irrigation water made the soil wet zone larger and inefficient water consumption increased. It is also probably due to the fact that when soil water stress is reduced, tomato nutrient growth is vigorous and the effective evapotranspiration of water from the plant body increased, resulting in 28.01% increase in water consumption, 12.54% increase in tomato yield, and 13.99% decrease in WUE. Such scholars as Agbna G H D, and Yan Zhu found that tomato yield increased and WUE decreased with the increase of irrigation amount, which is similar to the finding of this study. More importantly, it was also found in this study that moderate increase of moistube irrigation is conducive to the improvement of the productivity of tomato partial fertilizer, probably because the continuous water supply of the moistube irrigation can dilute the increased soil ion concentration caused by fertilization. The decrease of soil ion concentration can decrease soil microbial and enzyme activity, which improves the development of tomato root morphology and vigor and thus increases the utilization rate of fertilizer by the tomato plants.
The absorption efficiency of nitrogen, phosphorus and potassium by tomato is significantly affected by fertilization levels. An increase in fertilizer application leads to a decrease in nitrogen use efficiency and an increase in soil nitrate-N accumulation and soil fertility [50,51,52,53,54,55,56,57]. Excessive fertilizer application leads to reduced fruit set, poor stress tolerance, and susceptibility to pests and diseases, thus limiting tomato yield improvement. In this study, it was found that tomato yield increased at first and then decreased with the increase of fertilization rates. This finding is consistent with that on the variation of tomato yield in Zhao Wenju and Wu’s studies. It was also found that the WUE of tomato increased and then decreased with the increase of fertilization rates. This may be because that the increase of tomato yield (22.57%) was higher than that for an increase of water consumption (9.22%) when the amount of fertilizer application increased from F1 to F2, resulting in an increase in tomato water use efficiency by 12.34%. When increasing from F2 to F3, the increase of fertilizer amount led to a significant increase in the concentration in the. Salt injury affected the morphological development of tomato roots, increased ineffective water consumption, and led to a continuous increase in tomato water consumption (5.69%). At the same time, tomato yield decreased by 1.72%, resulting in a decrease of WUE of 8.11%. This study also found a decreasing trend of fertilizer productivity with increasing fertilizer application, which may be due to the marginal effect of yield, i.e., yield does not increase continuously with increasing fertilizer application. On the other hand, the reason could also be the increase of N, P, K in the soil, combined with the limited uptake of soil NPK by the plant body, so the increase in plant yield of tomatoes for the uptake of NPK (20.50%) was lower than the amount of soil fertilizer added (200%), resulting in a 148.97% decrease in tomato PFP with the increase of fertilizer application.
This study found that irrigation amounts and fertilization rates had significant effects on tomato yields and WUE, and the effect of irrigation was greater than that of fertilization, which was consistent with Zhang [35] and Daniel [58] in terms of drip irrigated tomatoes, indicating that the effect of MI on tomato yields was similar to that of drip irrigation. However, the results of this study were inconsistent with those of Li [59], who concluded that the fertilization of drip-irrigated tomatoes had a greater effect on the yield than on the irrigation amount. Such difference can probably be attributed to differences in types of fertilizers, fertility and productivity. While Li’s study adopted compound-coated urea and carbon based urine slow release fertilizers, this study used non-slow-release water-soluble fertilizers.

5. Conclusions

This study explored the response mechanism of photosynthetic characteristics, dry matter quality and yield of tomato leaves under greenhouse conditions as contrasted to the well-irrigated area of the surrounding Huang-Huai-Hai Plain. It explored different irrigation and fertilization rates of micro-irrigation, and found a mode of irrigation-fertilization combination under moistube irritation that is suitable to the growth of greenhouse tomatoes in this area. The results showed that with the increase of irrigation amount, the photosynthetic rate and total dry matter mass of tomato leaves increased first and then decreased; the TSS, TSU, VC and LY of tomato fruits all showed a decreasing trend. With the increase of fertilization amount, the photosynthetic rate of tomato leaves increased, total dry matter quality and fruit quality showed a trend of increasing and then decreasing. The effect of irrigation amount on yield was higher than that of fertilization. The tomato yield of I2 treatment was significantly higher than that of I1 and I3 treatments by about 13.99% and 1.29%; the tomato yield of F2 treatment was significantly higher than that of F1 and F3 treatments by about 22.57% and 1.72%. With the increase of irrigation amount, the partial fertilizer productivity first increased and then decreased and the water use efficiency decreased. With the increase of fertilization amount, the water use efficiency of tomato crops increased and then decreased and the partial productivity of fertilizers decreased. The photosynthetic rate of greenhouse tomato leaves showed a quadratic curve relationship with the total dry matter mass and yield under the irrigation-fertilization combination of moistube irrigation. Based on the spatial analysis in which tomato dry matter quality, fruit quality, yield and water use efficiency were compared with the traditional method of yield and water use efficiency, it was found that I2F2 was the optimal treatment.

Author Contributions

Data curation, N.X.; Formal analysis, Y.L. (Yangjian Li); Methodology, D.Z. and Z.X.; Project administration, Y.L. (Yuan Li); Software, Z.Z.; Writing—review and editing, M.Z. All authors have read and agreed to the published version of the manuscript.

Funding

This work is supported jointly by Natural Science Foundation of China (No. 41807041), Ninth batch of key disciplines in Henan Province—Mechanical Design, Manufacturing and Automation (JG [2018] No. 119), Key Research and Development Program of Shaanxi (No. 2022NY-191), Funda-mental Research Funds for the Central Universities (GK202103129), and the Program of Introducing Talents of Discipline to Universities (B16011). We are grateful for the helpful comments of the anonymous reviewers.

Data Availability Statement

The datasets used and/or analyzed during the current study are available from the corresponding author on reasonable request.

Conflicts of Interest

The authors declare no conflict of interest.

References

  1. Zhang, M.; Li, Y.; Liu, J.; Wang, J.; Zhang, Z.; Xiao, N. Changes of soil water and heat transport and yield of tomato (Solanum lycopersicum) in greenhouses with Micro-Sprinkler irrigation under plastic film. Agronomy 2022, 12, 664. [Google Scholar] [CrossRef]
  2. Zeng, X.; Zhang, C.; He, Y.; Zhou, Q.; Li, D.; Zheng, L.; Ouyang, X.; Zhang, Z. Analysis of World Tomato Production Based on FAO Data from 1980 to 2019. Hunan Agric. Sci. 2021, 104–108. [Google Scholar] [CrossRef]
  3. Liu, H.; Duan, A.; Li, F.; Sun, J.; Wang, Y.; Sun, C. Drip irrigation scheduling for tomato grown in solar greenhouse based on pan evaporation in north china plain. J. Integr. Agric. 2013, 12, 520–531. [Google Scholar] [CrossRef]
  4. Ren, P.; Huang, F.; Li, B. Spatiotemporal patterns of water consumption and irrigation requirements of wheat-maize in the Huang-Huai-Hai Plain, China and options of their reduction. Agric. Water Manag. 2022, 263, 107468. [Google Scholar] [CrossRef]
  5. Wu, Y.; Yan, S.; Fan, J.; Zhang, F.; Zhao, W.; Zheng, J.; Guo, J.; Xiang, Y.; Wu, L. Combined effects of irrigation level and fertilization practice on yield, economic benefit and water-nitrogen use efficiency of drip-irrigated greenhouse tomato. Agric. Water Manag. 2022, 262, 107401. [Google Scholar] [CrossRef]
  6. Cecilio, F.A.; Nascimento, C.S.; Pereira, B.J.; Nascimento, C.S. Nitrogen fertilisation impacts greenhouse gas emissions, carbon footprint, and agronomic responses of beet intercropped with arugula. J. Environ. Manag. 2022, 307, 114568. [Google Scholar] [CrossRef]
  7. Zhang, Z.; Yu, Z.; Zhang, Y.; Shi, Y. Finding the fertilization optimization to balance grain yield and soil greenhouse gas emissions under water-saving irrigation. Soil Tillage Res. 2021, 214, 105167. [Google Scholar] [CrossRef]
  8. Zhang, M.; Niu, W.; Bai, Q.; Li, Y.; Wang, J.; Wang, Z.; Zhang, Z. Improvement of quality and yield of greenhouse tomato (Solanum lycopersicum L.) Plants by micro-sprinkler irrigation under plastic film. Appl. Ecol. Environ. Res. 2020, 18, 6905–6926. [Google Scholar] [CrossRef]
  9. Cassel Sharmasarkar, F.; Sharmasarkar, S.; Miller, S.D.; Vance, G.F.; Zhang, R. Assessment of drip and flood irrigation on water and fertilizer use efficiencies for sugarbeets. Agric. Water Manag. 2001, 46, 241–251. [Google Scholar] [CrossRef]
  10. Wang, H.; Xiang, Y.; Zhang, F.; Tang, Z.; Guo, J.; Zhang, X.; Hou, X.; Wang, H.; Cheng, M.; Li, Z. Responses of yield, quality and water-nitrogen use efficiency of greenhouse sweet pepper to different drip fertigation regimes in Northwest China. Agric. Water Manag. 2022, 260, 107279. [Google Scholar] [CrossRef]
  11. Zhu, K.; Zhao, Y.; Ma, Y.; Zhang, Q.; Kang, Z.; Hu, X. Drip irrigation strategy for tomatoes grown in greenhouse on the basis of fuzzy Borda and K-means analysis method. Agric. Water Manag. 2022, 267, 107598. [Google Scholar] [CrossRef]
  12. Hu, J.; Gettel, G.; Fan, Z.; Lv, H.; Zhao, Y.; Yu, Y.; Wang, J.; Butterbach-Bahl, K.; Li, G.; Lin, S. Drip fertigation promotes water and nitrogen use efficiency and yield stability through improved root growth for tomatoes in plastic greenhouse production. Agric. Ecosyst. Environ. 2021, 313, 107379. [Google Scholar] [CrossRef]
  13. Wang, Z.; Chen, X.; Lv, D.; Li, W.; Wang, T.; Wei, C. Effects of water and fertilizer coupling on the yield and quality of processing tomato under aerated drip irrigation. Trans. Chin. Soc. Agric. Eng. 2020, 36, 66–75. [Google Scholar]
  14. Du, Y.; Cao, H.; Liu, S.; Gu, X.; Cao, Y. Response of yield, quality, water and nitrogen use efficiency of tomato to different levels of water and nitrogen under drip irrigation in Northwestern China. J. Integr. Agric. 2017, 16, 1153–1161. [Google Scholar] [CrossRef] [Green Version]
  15. Wang, H.; Wu, L.; Wang, X.; Zhang, S.; Cheng, M.; Feng, H.; Fan, J.; Zhang, F.; Xiang, Y. Optimization of water and fertilizer management improves yield, water, nitrogen, phosphorus and potassium uptake and use efficiency of cotton under drip fertigation. Agric. Water Manag. 2021, 245, 106662. [Google Scholar] [CrossRef]
  16. Volpi, I.; Bosco, S.; Ragaglini, G.; Laville, P.; Bonari, E. Tomato productivity and soil greenhouse gas emissions under reduced water and N fertilizers in a Mediterranean environment. Agric. Ecosyst. Environ. 2022, 326, 107819. [Google Scholar] [CrossRef]
  17. Qi, W.; Zhang, Z.; Wang, C.; Huang, M. Prediction of infiltration behaviors and evaluation of irrigation efficiency in clay loam soil under Moistube® irrigation. Agric. Water Manag. 2021, 248, 106756. [Google Scholar] [CrossRef]
  18. Ou, Y.; Xu, P. Comparative study on water-saving irrigation techniques for urban greening. Water Sav. Irrig. 2021, 16–23. [Google Scholar] [CrossRef]
  19. Zhang, M.; Niu, W.; Lu, Z.; Wang, J.; Qiu, X.; Li, Y. Effects of Moistube Irrigation on Winter Wheat’s Yield and Irrigation Water Use Efficiency. J. Irrig. Drain. 2018, 37, 8–15. [Google Scholar]
  20. Zhu, Y.M. Effect of Pressure Head on Soil Water and Nitrogen Migration and Greenhouse Vegetable Growth in Moistube-irrigation and Fertilization. Master’s Thesis, Taiyuan University of Technology, Taiyuan, China, 2021. [Google Scholar]
  21. Lv, W.; Niu, W.; Gu, J.; Li, Y.; Zou, X.; Zhang, R. Effects of moistube depth and density on tomato yield and quality in solar greenhouse. Chin. J. Eco-Agric. 2016, 24, 1663–1673. [Google Scholar]
  22. Niu, W.; Zhang, M.; Xu, J.; Zou, X.; Li, Y. Prediction Methods and Characteristics of Flow for Moistube. Trans. Chin. Soc. Agric. Mach. 2017, 48, 217–224. [Google Scholar]
  23. Kanda, E.K.; Senzanje, A.; Mabhaudhi, T. Soil water dynamics under Moistube irrigation. Phys. Chem. Earth Parts A/B/C 2020, 115, 102836. [Google Scholar] [CrossRef]
  24. Zhang, Q.; Dong, W.; Wen, C.; Li, T. Study on factors affecting corn yield based on the Cobb-Douglas production function. Agric. Water Manag. 2020, 228, 105869. [Google Scholar] [CrossRef]
  25. Zhang, M.; Wang, L.; Wang, H.; Xiao, N.; Liu, J. Exploration of Water-Saving and High-Yield irrigation model for tomato under microsprinkler irrigation with plastic film in a greenhouse based on spatial analysis. J. Sens. 2022, 2022, 3452727. [Google Scholar] [CrossRef]
  26. Horchani, F.; Aschi-Smiti, S.; Brouquisse, R. Involvement of nitrate reduction in the tolerance of tomato (Solanum lycopersicum L.) plants to prolonged root hypoxia. Acta Physiol. Plant. 2010, 32, 1113–1123. [Google Scholar] [CrossRef]
  27. Li, Y.; Niu, W.; Cao, X.; Wang, J.; Zhang, M.; Duan, X.; Zhang, Z. Effect of soil aeration on root morphology and photosynthetic characteristics of potted tomato plants (Solanum lycopersicum) at different NaCl salinity levels. BMC Plant Biol. 2019, 19, 331. [Google Scholar] [CrossRef] [PubMed] [Green Version]
  28. Li, S.; Liu, F. Vapour pressure deficit and endogenous ABA level modulate stomatal responses of tomato plants to soil water deficit. Environ. Exp. Bot. 2022, 199, 104889. [Google Scholar] [CrossRef]
  29. Patel, D.P.; Das, A.; Munda, G.C.; Ghosh, P.K.; Bordoloi, J.S.; Kumar, M. Evaluation of yield and physiological attributes of high-yielding rice varieties under aerobic and flood-irrigated management practices in mid-hills ecosystem. Agric. Water Manag. 2010, 97, 1269–1276. [Google Scholar] [CrossRef]
  30. Sainju, U.M.; Singh, B.P.; Whitehead, W.F. Comparison of the effects of cover crops and nitrogen fertilization on tomato yield, root growth, and soil properties. Sci. Hortic. 2001, 91, 201–214. [Google Scholar] [CrossRef]
  31. Pfaff, J.; Denton, A.K.; Usadel, B.; Pfaff, C. Phosphate starvation causes different stress responses in the lipid metabolism of tomato leaves and roots. Biochim. Biophys. Acta Mol. Cell Biol. Lipids 2020, 1865, 158763. [Google Scholar] [CrossRef]
  32. Paleari, L.; Movedi, E.; Vesely, F.M.; Invernizzi, M.; Piva, D.; Zibordi, G.; Confalonieri, R. Estimating plant nitrogen content in tomato using a smartphone. Field Crop. Res. 2022, 284, 108564. [Google Scholar] [CrossRef]
  33. Sun, H.; Shi, Q.; Zhang, S.; Huang, W. The response of photosystem I to fluctuating light is influenced by leaf nitrogen content in tomato. Environ. Exp. Bot. 2022, 193, 104665. [Google Scholar] [CrossRef]
  34. Li, Y.; Yuan, B.; Bie, Z.; Kang, Y. Effect of drip irrigation criteria on yield and quality of muskmelon grown in greenhouse conditions. Agric. Water Manag. 2012, 109, 30–35. [Google Scholar] [CrossRef]
  35. Zhang, X.; Wang, H.; Niu, W. Effects of water and N-fertilizer supplies on the distribution and use efficiency of water and nitrogen of drip-irrigated tomato in greenhouse. Trans. Chin. Soc. Agric. Eng. 2020, 36, 106–115. [Google Scholar]
  36. Shu, L.; Liu, R.; Min, W.; Wang, Y.; Yu, H.; Zhu, P.; Zhu, J. Regulation of soil water threshold on tomato plant growth and fruit quality under alternate partial root-zone drip irrigation. Agric. Water Manag. 2020, 238, 106200. [Google Scholar] [CrossRef]
  37. Sensoy, S.; Ertek, A.; Gedik, I.; Kucukyumuk, C. Irrigation frequency and amount affect yield and quality of field-grown melon (Cucumis melo L.). Agric. Water Manag. 2007, 88, 269–274. [Google Scholar] [CrossRef]
  38. Chen, J.; Kang, S.; Du, T.; Guo, P.; Qiu, R.; Chen, R.; Gu, F. Modeling relations of tomato yield and fruit quality with water deficit at different growth stages under greenhouse condition. Agric. Water Manag. 2014, 146, 131–148. [Google Scholar] [CrossRef]
  39. Agbna, G.H.D.; Dongli, S.; Zhipeng, L.; Elshaikh, N.A.; Guangcheng, S.; Timm, L.C. Effects of deficit irrigation and biochar addition on the growth, yield, and quality of tomato. Sci. Hortic. 2017, 222, 90–101. [Google Scholar] [CrossRef]
  40. Wang, J.; Li, Y.; Niu, W. Deficit alternate drip irrigation increased Root-Soil-Plant interaction, tomato yield, and quality. Int. J. Environ. Res. Public Health 2020, 17, 781. [Google Scholar] [CrossRef] [Green Version]
  41. He, Z.; Li, M.; Cai, Z.; Zhao, R.; Hong, T.; Yang, Z.; Zhang, Z. Optimal irrigation and fertilizer amounts based on multi-level fuzzy comprehensive evaluation of yield, growth and fruit quality on cherry tomato. Agric. Water Manag. 2021, 243, 106360. [Google Scholar] [CrossRef]
  42. Ordóñez, R.A.; Castellano, M.J.; Danalatos, G.N.; Wright, E.E.; Hatfield, J.L.; Burras, L.; Archontoulis, S.V. Insufficient and excessive N fertilizer input reduces maize root mass across soil types. Field Crop. Res. 2021, 267, 108142. [Google Scholar] [CrossRef]
  43. Li, J.; Zhang, S.; Ding, X. The combined application of biochar and high phosphate fertilizer promoted the mobilization and redistribution of cadmium in rhizosphere soil. J. Environ. Chem. Eng. 2022, 10, 107482. [Google Scholar] [CrossRef]
  44. Striker, G.G.; Teakle, N.L.; Colmer, T.D.; Barrett-Lennard, E.G. Growth responses of Melilotus siculus accessions to combined salinity and root-zone hypoxia are correlated with differences in tissue ion concentrations and not differences in root aeration. Environ. Exp. Bot. 2015, 109, 89–98. [Google Scholar] [CrossRef]
  45. Yang, X.; Geng, J.; Li, C.; Zhang, M.; Chen, B.; Tian, X.; Zheng, W.; Liu, Z.; Wang, C. Combined application of polymer coated potassium chloride and urea improved fertilizer use efficiencies, yield and leaf photosynthesis of cotton on saline soil. Field Crop. Res. 2016, 197, 63–73. [Google Scholar] [CrossRef]
  46. Wu, W.; Lin, Z.; Zhu, X.; Li, G.; Zhang, W.; Chen, Y.; Ren, L.; Luo, S.; Lin, H.; Zhou, H.; et al. Improved tomato yield and quality by altering soil physicochemical properties and nitrification processes in the combined use of organic-inorganic fertilizers. Eur. J. Soil Biol. 2022, 109, 103384. [Google Scholar] [CrossRef]
  47. Wang, Y.; Liu, R.; Huang, S.; Jin, J. Effects of potassium application on flavor compounds of cherry tomato fruits. J. Plant Nutr. 2009, 32, 1451–1468. [Google Scholar] [CrossRef]
  48. Patanè, C.; Tringali, S.; Sortino, O. Effects of deficit irrigation on biomass, yield, water productivity and fruit quality of processing tomato under semi-arid Mediterranean climate conditions. Sci. Hortic. 2011, 129, 590–596. [Google Scholar] [CrossRef]
  49. Yalin, D.; Schwartz, A.; Tarchitzky, J.; Shenker, M. Soil oxygen and water dynamics underlying hypoxic conditions in the root-zone of avocado irrigated with treated wastewater in clay soil. Soil Tillage Res. 2021, 212, 105039. [Google Scholar] [CrossRef]
  50. Ouyang, Z.; Tian, J.; Yan, X.; Shen, H. Effects of different concentrations of dissolved oxygen on the growth, photosynthesis, yield and quality of greenhouse tomatoes and changes in soil microorganisms. Agric. Water Manag. 2021, 245, 106579. [Google Scholar] [CrossRef]
  51. Shang, Z.; Cai, H.; Chen, H.; Sun, Y.; Li, L.; Zhu, Y.; Wang, X. Effect of Water-Fertilizer-Gas Coupling on Soil N2O Emission and Yield in Greenhouse Tomato. Environ. Sci. 2020, 41, 2924–2935. [Google Scholar]
  52. Zhu, Y.; Cai, H.; Song, L.; Wang, X.; Shang, Z.; Sun, Y. Aerated irrigation of different irrigation levels and subsurface dripper depths affects fruit yield, quality and water use efficiency of greenhouse tomato. Sustainability 2020, 12, 2703. [Google Scholar] [CrossRef] [Green Version]
  53. Sun, G.; Hu, T.; Liu, X.; Peng, Y.; Leng, X.; Li, Y.; Yang, Q. Optimizing irrigation and fertilization at various growth stages to improve mango yield, fruit quality and water-fertilizer use efficiency in xerothermic regions. Agric. Water Manag. 2022, 260, 107296. [Google Scholar] [CrossRef]
  54. Xing, Y.; Zhang, T.; Jiang, W.; Li, P.; Shi, P.; Xu, G.; Cheng, S.; Cheng, Y.; Fan, Z.; Wang, X. Effects of irrigation and fertilization on different potato varieties growth, yield and resources use efficiency in the Northwest China. Agric. Water Manag. 2022, 261, 107351. [Google Scholar] [CrossRef]
  55. Hebbar, S.S.; Ramachandrappa, B.K.; Nanjappa, H.V.; Prabhakar, M. Studies on NPK drip fertigation in field grown tomato (Lycopersicon esculentum Mill.). Eur. J. Agron. 2004, 21, 117–127. [Google Scholar] [CrossRef]
  56. Liu, J.; Hu, T.; Feng, P.; Yao, D.; Gao, F.; Hong, X. Effect of potassium fertilization during fruit development on tomato quality, potassium uptake, water and potassium use efficiency under deficit irrigation regime. Agric. Water Manag. 2021, 250, 106831. [Google Scholar] [CrossRef]
  57. Zhao, W.; Ma, F.; Cao, W.; Ma, F.; Han, L. Effects of water and fertilizer coupling on the yield and quality of tomatoes. Trans. Chin. Soc. Agric. Eng. 2022, 38, 95–101. [Google Scholar]
  58. Geisseler, D.; Aegerter, B.J.; Miyao, E.M.; Turini, T.; Cahn, M.D. Nitrogen in soil and subsurface drip-irrigated processing tomato plants (Solanum lycopersicum L.) as affected by fertilization level. Sci. Hortic. 2020, 261, 108999. [Google Scholar] [CrossRef]
  59. Li, Y.; Sun, Y.; Liao, S.; Zou, G.; Zhao, T.; Chen, Y.; Yang, J.; Zhang, L. Effects of two slow-release nitrogen fertilizers and irrigation on yield, quality, and water-fertilizer productivity of greenhouse tomato. Agric. Water Manag. 2017, 186, 139–146. [Google Scholar] [CrossRef]
Figure 1. Meteorological data.
Agronomy 12 01630 g001
Figure 2. Schematic diagram of moistube irrigation system. Note: 1 represents the headwaters; 2 represents the valve; 3 represents the cistern; 4 represents the water pump; 5 represents the valve; 6 represents the tomato; 7 represents the moistube; 8 represents the filter; 9 represents the capillary valve; 10 represents the pressure gauge; 11 represents the fertilizer applicator. (AC) represent three independent water supply systems, respectively. (D) represents the schematic diagram of the moistube irrigation. (E) represents the tomato planting. (F) represents the tomato harvest.
Agronomy 12 01630 g002
Figure 3. Effect of integrated water and fertilizer on photosynthetic characteristics of tomato leaves using moistube irrigation of greenhouse tomatoes. Note: I represents the irrigation amount, F represents the fertilizer amount.
Agronomy 12 01630 g003
Figure 4. Correlation between Pn of tomato leaves and total dry matter mass and yield. Note: Ym represents the total dry matter mass, Yy represents the yield, x represents the photosynthetic rate (Pn).
Agronomy 12 01630 g004
Figure 5. Spatial analysis. Note: The circular dotted points in the figure represent the measured and calculated value of total dry matter mass of tomato (A), yield of tomato (B), water use efficiency of tomato (C), comprehensive score of tomato quality (D). The shadow regions represent 95% confidence interval of maximal comprehensive score.
Agronomy 12 01630 g005
Table 1. Test treatment table.
NumberTreatmentsWorking Pressure mIrrigation Amount mmFertilizer Amount kg/ha
1I1F11173.66100
2I1F21173.66200
3I1F31173.66300
4I2F12372.70100
5I2F22372.70200
6I2F32372.70300
7I3F13528.31100
8I3F23528.31200
9I3F33528.31300
Note: I represents the irrigation amount; F represents the fertilizer amount. The working pressure error is controlled within ±0.20 m.
Table 2. Photosynthesis measurements.
NumberDays after the Transplant of Tomato PlantsIndexInstrument
140Photosynthetic rate (Pn)
Stomatal conductivity (Gs)
Intercellular CO2 concentration (Ci)
Transpiration rate (Tr)
LI-6400
278
3112
Table 3. Measurement methods.
NumberIndexMethods
1Transverse Diameter (TD)Vernier caliper
2Vertical Diameter (VD)Vernier caliper
3Total Soluble Solids (TSS)Hand refractometer
4Total Soluble Sugar (TSU)Anthrone method
5Vitamin C (VC)Titration method
6Lycopene (LY)Ultraviolet spectrophotometer
Table 4. Effect of integrated water and fertilizer on the dry matter mass of tomato by moistube irrigation in greenhouse.
TreatmentsLDM
g/Stock
SDM
g/Stock
RDM
g/Stock
FDM
g/Stock
TDM
g/Stock
I1F165.06 ± 5.69 d70.76 ± 8.2 d9.56 ± 1.36 b109.06 ± 25.87 d254.44 ± 23.15 d
I1F272.01 ± 5.8 cd78.31 ± 5.78 bcd10.74 ± 1.25 ab129.57 ± 29.45 bcd290.63 ± 27.83 c
I1F371.23 ± 5.65 cd76.64 ± 5.45 d9.49 ± 1.32 b127.69 ± 26.24 cd285.04 ± 28.98 c
I2F175.79 ± 9.93 abc79.21 ± 11.05 bcd11.87 ± 1.2 a131.34 ± 16.37 bcd298.21 ± 27.41 bc
I2F283.97 ± 9.43 a90.75 ± 10.86 a12.28 ± 1.75 a142.03 ± 12.28 abc329.03 ± 26.68 a
I2F382.59 ± 6.22 ab89.27 ± 6.88 a12.1 ± 0.92 a152.65 ± 21.91 ab336.61 ± 21.53 a
I3F173.54 ± 14.01 bcd77.03 ± 9.31 cd11.09 ± 1.06 ab126.15 ± 22.43 cd287.81 ± 39.10 c
I3F283.93 ± 12.03 a85.83 ± 7.09 abc12.18 ± 1.72 a156.84 ± 9.59 a338.78 ± 18.75 a
I3F379.74 ± 11.29 abc87.06 ± 11.5 ab11.67 ± 3.47 a139.72 ± 27.33 abc318.18 ± 23.32 ab
F-value
I11.471 **11.774 **11.822 **6.807 **21.731 **
F6.012 **9.535 **2.927 *6.818 **16.709 **
I*F2.110 *0.247 ns0.292 ns0.933 ns0.682 ns
Note: I represents the irrigation amount, F represents the fertilizer amount. LDM represents the leaf dry matter mass, SDM represents the stem dry matter mass, RDM represents the root dry matter mass, FDM represents the fruit dry matter mass, TDM represents the total dry matter mass. Different letters in the same line meant significant difference at 0.05 level, * represents the p < 0.05, ** represents the p < 0.01, ns represents the p > 0.05.
Table 5. Effect of integrated water and fertilizer on the quality of tomato fruit by moistube irrigation in greenhouse.
TreatmentsTD mmVD mmTSS%TSU%VC mg/gLY%
I1F150.83 ± 9.26 b53.13 ± 9.44 e5.64 ± 0.09 ab8.79 ± 1.42 ab19.21 ± 1.5 bc62.68 ± 6.72 ab
I1F254.22 ± 6.14 ab64.51 ± 5.79 abc6.11 ± 0.17 a9.55 ± 0.95 a21.79 ± 1.3 a67.66 ± 4.33 a
I1F354.42 ± 11.65 ab63.6 ± 7.98 abc5.98 ± 0.4 a9.41 ± 0.58 ab20.8 ± 1.1 ab66.03 ± 5.53 a
I2F151.11 ± 7.04 b59.93 ± 9.64 cde5.45 ± 0.42 b8.29 ± 1.37 abc18.55 ± 2.68 c58.55 ± 10.86 b
I2F260.51 ± 4.19 a69.98 ± 3.17 a6.02 ± 0.9 a9.37 ± 1.85 ab21.75 ± 3.72 a67.62 ± 7.98 a
I2F358.96 ± 4.28 a67.89 ± 5.18 ab5.71 ± 0.51 ab9.03 ± 1.06 ab19.1 ± 1.76 bc65.17 ± 5.41 ab
I3F150.27 ± 11.4 b55.01 ± 10.43 de4.82 ± 0.12 c7.13 ± 1.13 c16.42 ± 1.09 d50.33 ± 4.89 c
I3F256.56 ± 8.45 ab63.66 ± 5.11 abc5.5 ± 0.39 b8.44 ± 1.43 ab19.01 ± 1.31 bc62.02 ± 6 ab
I3F357.03 ± 6.01 ab62.08 ± 6.55 bcd5.27 ± 0.41 b8.18 ± 0.8 bc18.49 ± 0.88 c62 ± 3.17 ab
F-value
I6.450 **15.148 **18.591 **8.484 **13.402 **13.587 **
F5.378 *14.355 **11.128 **5.359 **14.326 **13.776 **
I*F0.351 ns0.146 ns0.213 ns0.137 ns0.812 ns3.097 *
Note: I represents the irrigation amount, F represents the fertilizer amount. TD represents the transverse diameter, VD represents the vertical diameter, TSS represents the total solids content, TSU represents the total soluble sugar, VC represents the vitamin C, LY represents the lycopene. Different letters in the same line meant significant difference at 0.05 level, * represents the p < 0.05, ** represents the p < 0.01, ns represents the p > 0.05.
Table 6. Effect of integrated water and fertilizer on the yield and water use efficiency of tomatoes by moistube irrigation in greenhouse.
TreatmentsYield
kg/ha
Water Consumption
mm
Water Use Efficiency
kg/m3
Partial Factor Productivity
kg/kg
I1F194,497.07 ± 12,514.03 c358.33 ± 9.05 h26.41 ± 3.77 bc85.91 ± 11.38 b
I1F2111,169.27 ± 8390.25 b386.8 ± 18.06 g28.81 ± 2.74 ab50.53 ± 3.81 d
I1F3110,264.5 ± 17,709.89 b410.18 ± 18.53 f26.89 ± 4.17 abc33.41 ± 5.37 e
I2F1102,204.58 ± 14,881.37 bc405.77 ± 8.86 f25.24 ± 4.02 cd92.91 ± 13.53 a
I2F2131,200.94 ± 13,552.62 a439.79 ± 15.65 e29.9 ± 3.55 a59.64 ± 6.16 c
I2F3126,729.16 ± 13,164.28 a472.98 ± 10.12 d26.81 ± 2.86 abc38.4 ± 3.99 e
I3F1103,999.59 ± 12,172.08 bc452.01 ± 7.68 c23 ± 2.62 d94.55 ± 11.07 a
I3F2126,203.36 ± 17,928.28 a501.65 ± 22.35 b25.15 ± 3.38 cd57.37 ± 8.15 cd
I3F3125,340.07 ± 21,839.81 a525.21 ± 7.95 a23.88 ± 4.28 cd37.98 ± 6.62 e
F-value
I30.295 **523.818 **10.638 **7.922 **
F24.528 **186.635 **7.082 **385.682 **
I*F0.541 ns4.734 *2.491 *0.342 ns
Note: I represents the irrigation amount, F represents the fertilizer amount. Different letters in the same line meant significant difference at 0.05 level, * represents the p < 0.05, ** represents the p < 0.01, ns represents the p > 0.05.
Table 7. Factor loadings and variance contribution rates of the principal component.
Indicator VariablesFactor Loading
PC1 (61.14%)PC2 (35.53%)
TD0.2260.959
VD0.3930.888
TSS0.9650.247
TSU0.9520.284
VC0.9300.296
LY0.8720.441
Characteristic values4.7971.003
Variance contribution rates %61.13535.531
Cumulative contribution rates %61.13596.666
Note: TD represents the transverse diameter, VD represents the vertical diameter, TSS represents the total solids content, TSU represents the total soluble sugar, VC represents vitamin C, LY represents lycopene.
Table 8. Multiple regression analysis.
Dependent VariableRegression EquationR2Maximum Combination of Z Values
xyzmax
Total dry matter mass of tomatoz = 51.947 − 32.970x2 − 0.002y2 + 148.605x + 1.077y − 0.001xy0.9952.525236.344346.559
Comprehensive score of tomato qualityz = 124.808 − 8.287x2 − 0.0016y2 + 19.417x + 0.697y + 0.021xy0.9941.454225.682217.581
Yield of tomatoz = 18,165.595 − 8132.583x2 − 1.235y2 + 36,345.838x + 568.937y + 13.933xy0.9752.444244.083132,008.216
Water use efficiency of tomatoz = 14.988 − 1.627x2 − 0.0003y2 + 4.627x + 0.106y − 0.001xy0.9491.486208.46329.490
Partial fertility productivity of tomatoz = 119.368 − 3.694x2 − 0.001y2 + 20.150x − 0.573y − 0.010xy0.9992.216371.41335.303
Note: x represents the irrigation amount, y represents the fertilizer amount, z represents the required value.
Publisher’s Note: MDPI stays neutral with regard to jurisdictional claims in published maps and institutional affiliations.

